Embed Size (px)
Citation preview

Accounting for the Changing Impact of the Federal
Government Including the Affordable Care Act
Benjamin A. MandelBEA Advisory Committee Meeting
Washington, DCMay 10, 2013
bea.gov
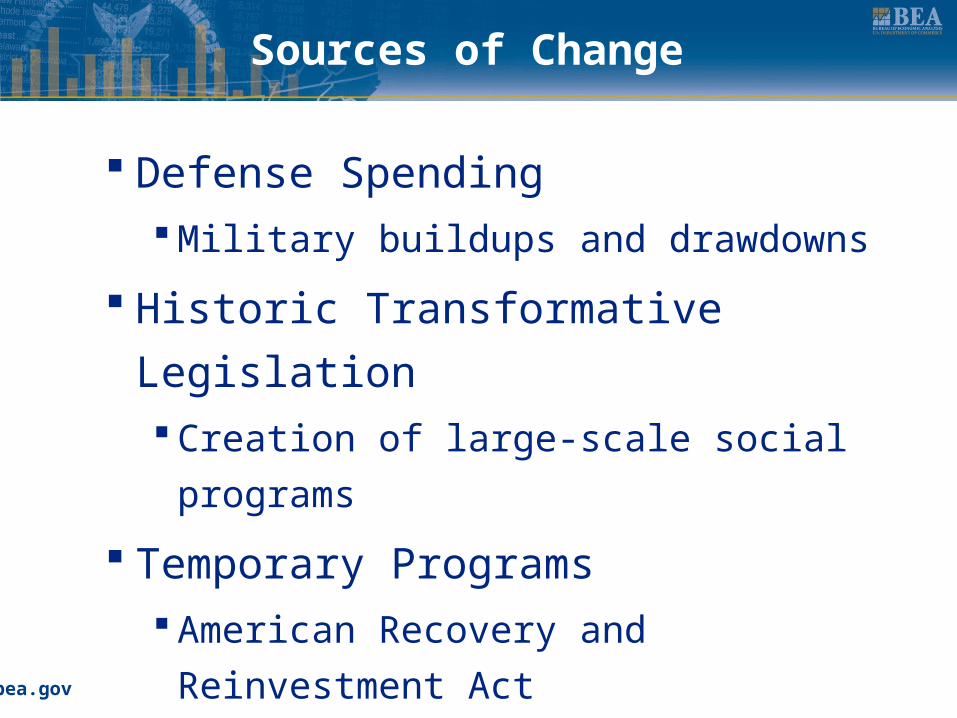
Sources of Change
Defense Spending Military buildups and drawdowns
Historic Transformative Legislation Creation of large-scale social programs
Temporary Programs American Recovery and Reinvestment Act
Disaster Assistance
bea.gov
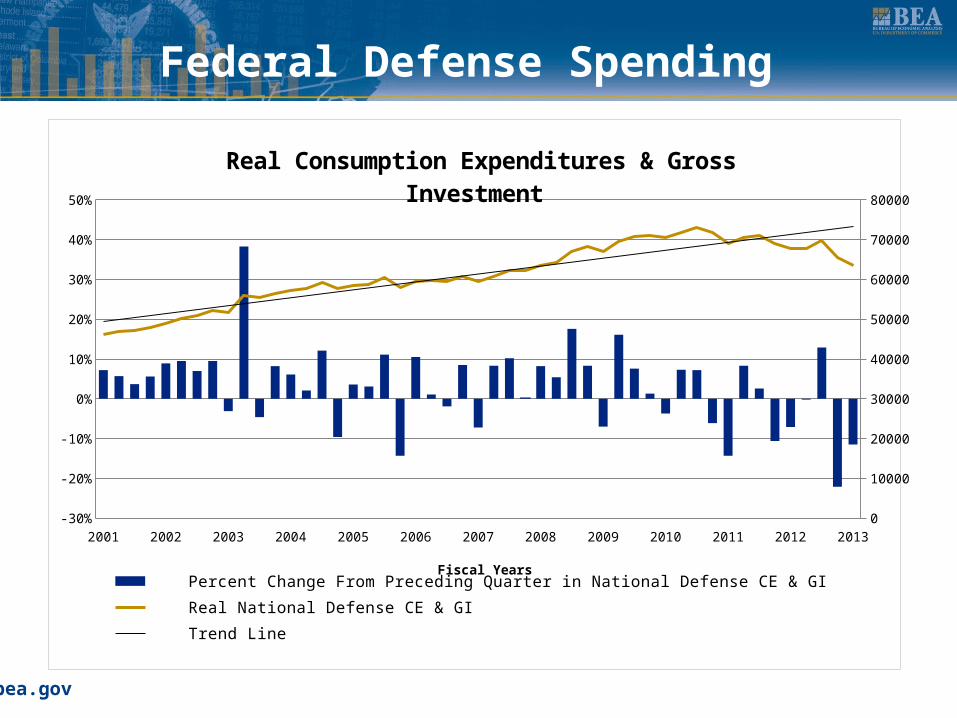
Federal Defense Spending
2001 2002 2003 2004 2005 2006 2007 2008 2009 2010 2011 2012 2013-30%
-20%
-10%
0%
10%
20%
30%
40%
50%
0
10000
20000
30000
40000
50000
60000
70000
80000
Real Consumption Expenditures & Gross Investment
Percent Change From Preceding Quarter in National Defense CE & GI Real National Defense CE & GI
Trend Line
Fiscal Years
bea.gov
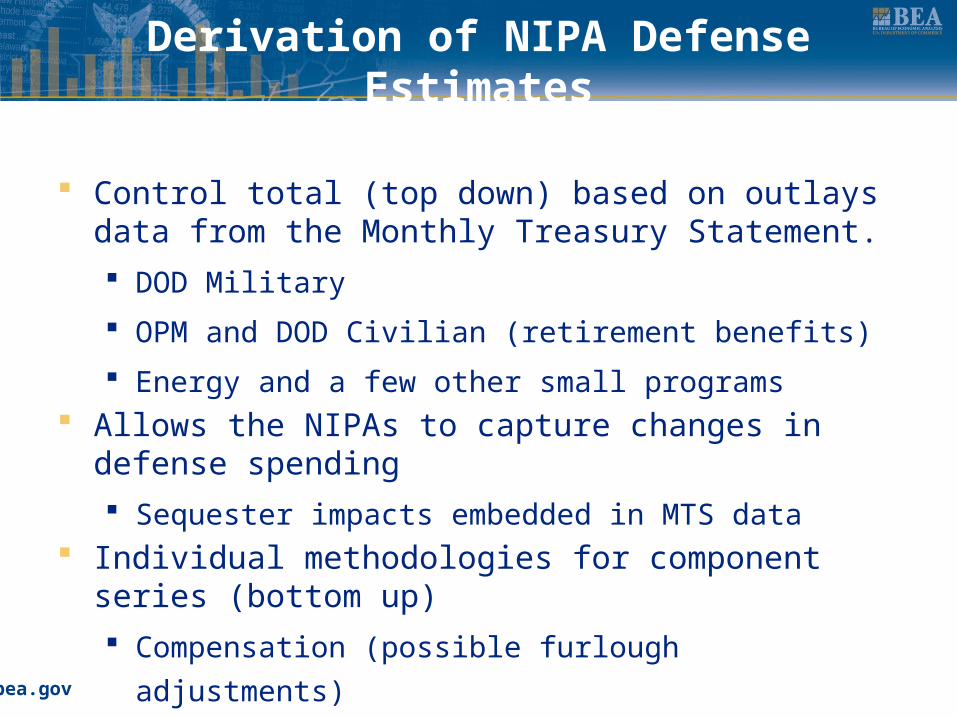
Derivation of NIPA Defense Estimates
Control total (top down) based on outlays data from the Monthly Treasury Statement. DOD Military
OPM and DOD Civilian (retirement benefits)
Energy and a few other small programs Allows the NIPAs to capture changes in defense spending
Sequester impacts embedded in MTS data Individual methodologies for component series (bottom up)
Compensation (possible furlough adjustments)
bea.gov
Adjustments to Defense Outlays
National Accounting differs from Budget Accounting
Timing
Personnel
Procurement of Equipment
Coverage
Consumption of Fixed Capital
Other smaller adjustments
bea.gov
Historic Social Program Legislation
Old-Age (Retirement), Survivors, and Disability Insurance
Unemployment benefits Medicare - Health insurance for aged and disabled Medicaid - Federal grants to states for medical
assistance programs Supplemental Security Income - Payments to low-
income people who are either 65 or older, blind, or disabled
bea.gov
Patient Protection and Affordable Care Act
Ensure health insurance coverage for most U.S citizens
Individual Mandate
Employer
Medicare or Medicaid
Individual direct purchase
Health insurance exchanges
Prohibits exclusions for pre-existing conditions
Improve healthcare treatments and delivery
bea.gov
Government Services and Funding
Government Support Health Exchanges
Insurance subsidies
Expansion of existing programs – Medicaid and CHIP Government Revenue
Increase existing taxes and reduce certain tax credits
New excise taxes
Penalties and fees
bea.gov
Several ACA provisions have already begun and related transactions are included in the NIPAs
Transactions are included in our normal source data (Budget, MTS, etc.)
Provisions continue to begin each year 2014 through 2020
BEA’s Analysis of ACA Impact on the Federal Sector of the NIPAs
bea.gov
BEA’s Analysis of ACA Impact on the Federal Sector of the NIPAs
Classify estimates of ACA spending and revenues into a national accounts framework
Focus on which NIPA transactions are impacted, not estimated values
Source data (fiscal years)
CBO & Joint Committee on Taxation : 2010 – 2012 reports
Estimates a bit outdated, but still useful for analysis
Consistent impacts
OMB outlays and receipts through 2018 (used for allocations)
Lacking detailed data, BEA split estimates of the new Medicare surtaxes 50/50 between contributions for social insurance and personal current taxes
Federal sector perspective Direct impacts of law changes
Changes to existing programs
New transactions
Not multiplier effects
bea.gov
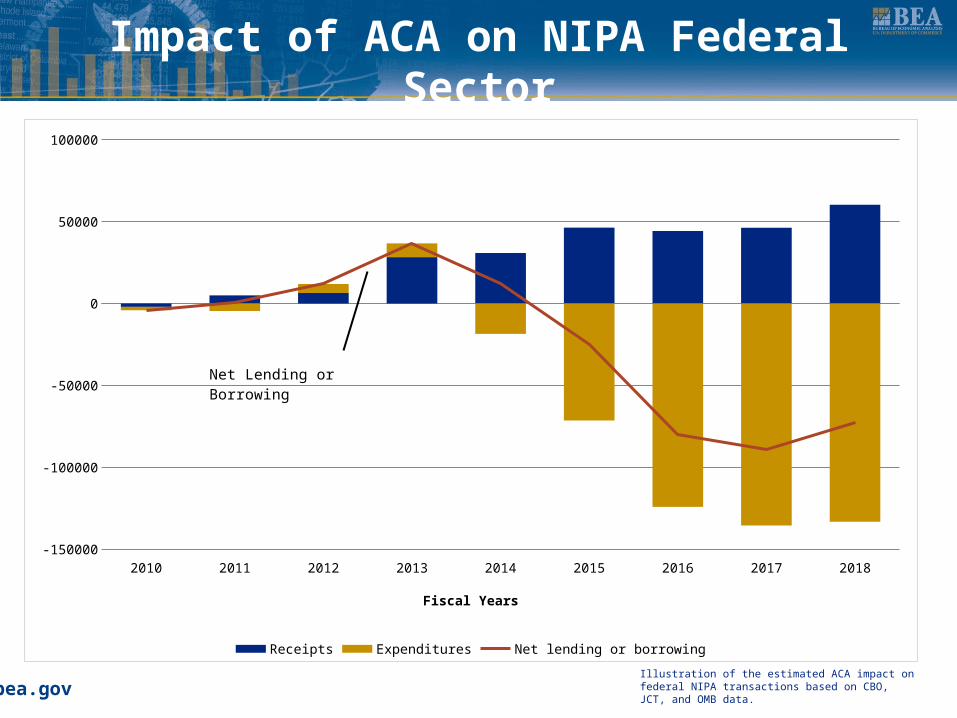
Impact of ACA on NIPA Federal Sector
2010 2011 2012 2013 2014 2015 2016 2017 2018-150000
-100000
-50000
0
50000
100000
Receipts Expenditures Net lending or borrowing
Fiscal Years
Net Lending or Borrowing
Illustration of the estimated ACA impact on federal NIPA transactions based on CBO, JCT, and OMB data.
bea.gov
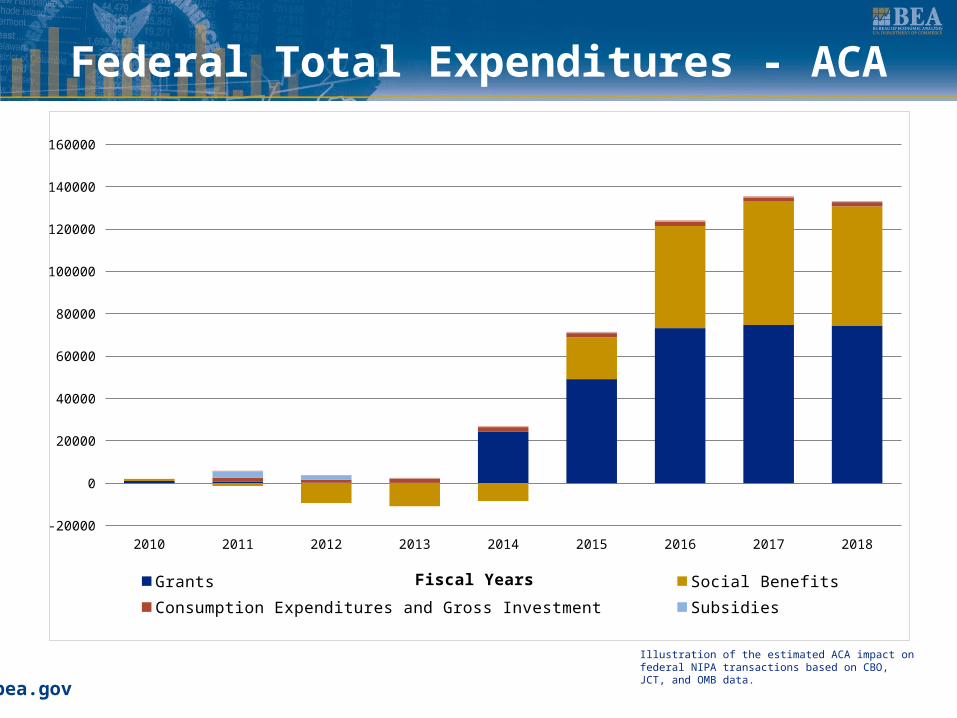
Federal Total Expenditures - ACA
2010 2011 2012 2013 2014 2015 2016 2017 2018-20000
0
20000
40000
60000
80000
100000
120000
140000
160000
Grants Social Benefits Consumption Expenditures and Gross Investment Subsidies Capital transfers to personsFiscal Years
Illustration of the estimated ACA impact on federal NIPA transactions based on CBO, JCT, and OMB data.
bea.gov
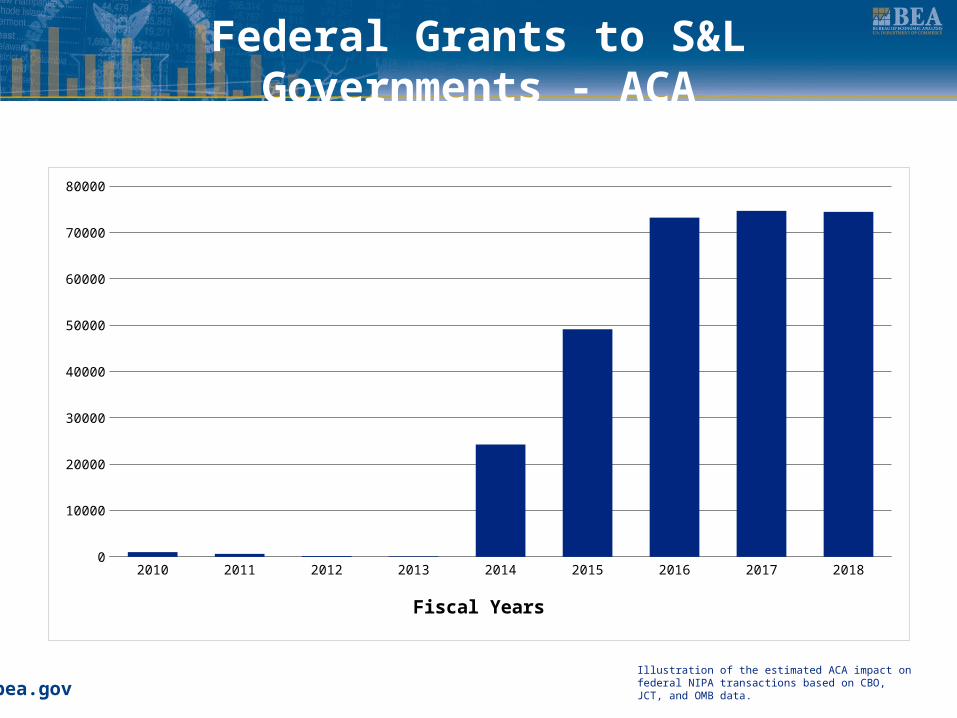
Federal Grants to S&L Governments - ACA
2010 2011 2012 2013 2014 2015 2016 2017 20180
10000
20000
30000
40000
50000
60000
70000
80000
Fiscal Years
Illustration of the estimated ACA impact on federal NIPA transactions based on CBO, JCT, and OMB data.
bea.gov
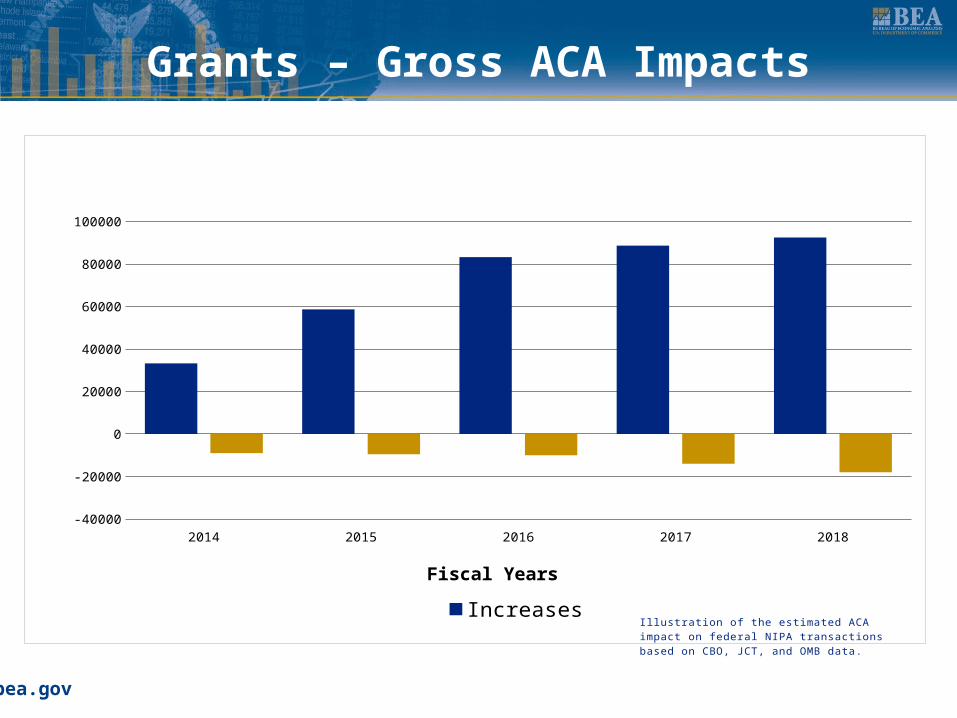
Grants – Gross ACA Impacts
2014 2015 2016 2017 2018-40000
-20000
0
20000
40000
60000
80000
100000
Increases Decreases
Fiscal Years
Illustration of the estimated ACA impact on federal NIPA transactions based on CBO, JCT, and OMB data.
bea.gov
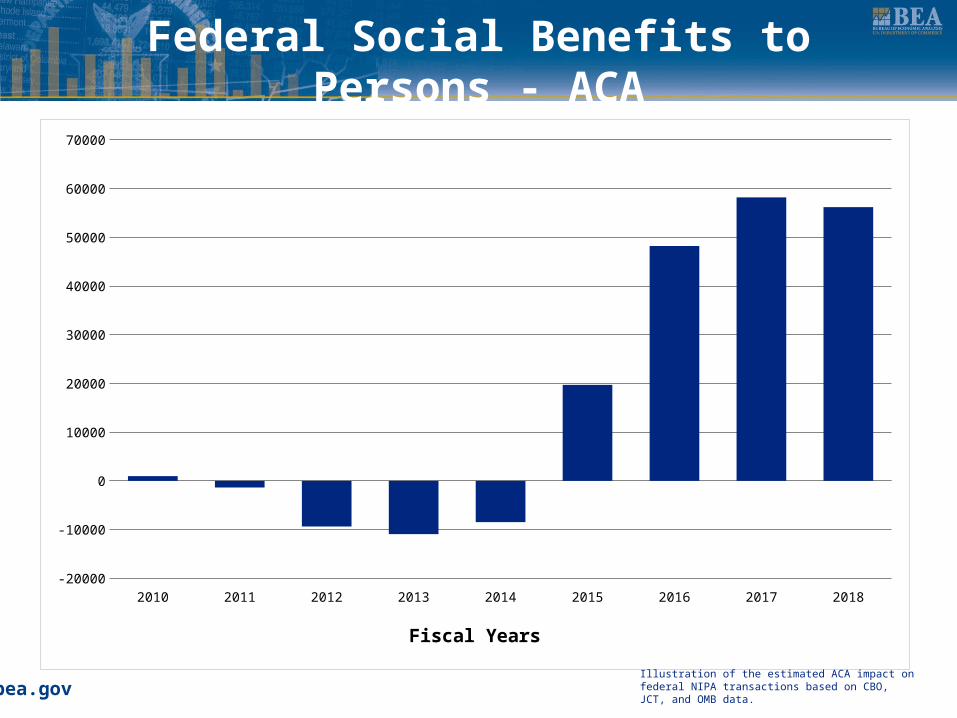
Federal Social Benefits to Persons - ACA
2010 2011 2012 2013 2014 2015 2016 2017 2018-20000
-10000
0
10000
20000
30000
40000
50000
60000
70000
Fiscal Years
Illustration of the estimated ACA impact on federal NIPA transactions based on CBO, JCT, and OMB data.
bea.gov
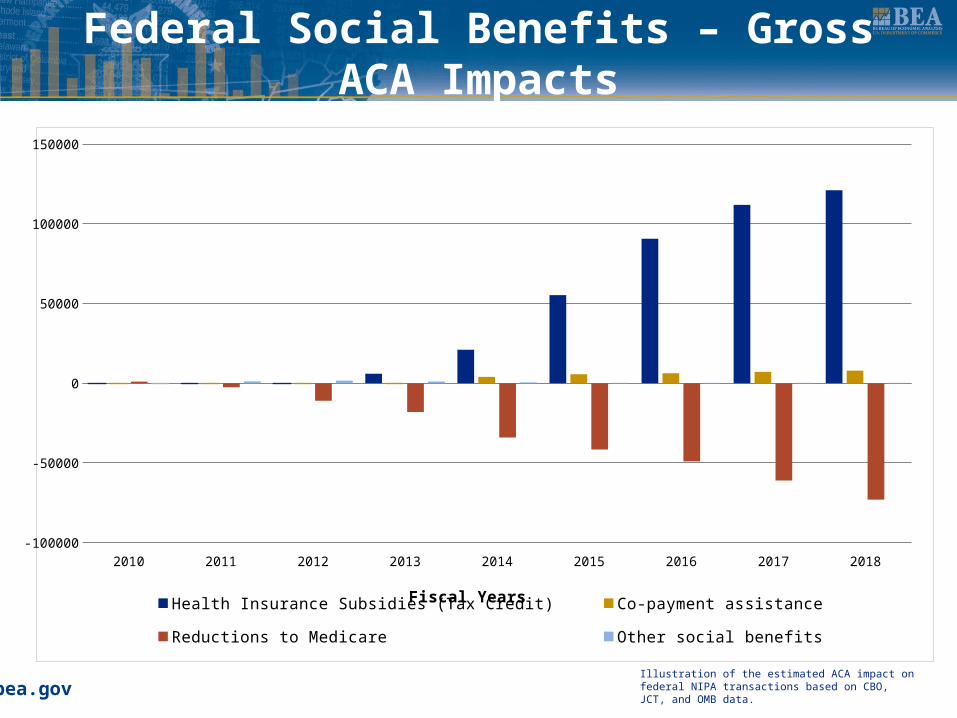
Federal Social Benefits – Gross ACA Impacts
2010 2011 2012 2013 2014 2015 2016 2017 2018-100000
-50000
0
50000
100000
150000
Health Insurance Subsidies (Tax Credit) Co-payment assistance Reductions to Medicare Other social benefits
Fiscal Years
Illustration of the estimated ACA impact on federal NIPA transactions based on CBO, JCT, and OMB data.
bea.gov
Health Insurance Subsidies
Subsidized purchase of insurance from government-run exchanges Beginning in 2014
Eligibility: income that does not exceed 400% of the poverty level Social Benefit to Persons
Prepaid refundable tax credit most likely paid directly to the insurer, not the individual
Personal Current Taxes Tax filing: reconciliation of prepaid credit with allowable credit
Either a tax reduction (entitled to more of a subsidy) or tax increase (received too much of a subsidy)
bea.gov
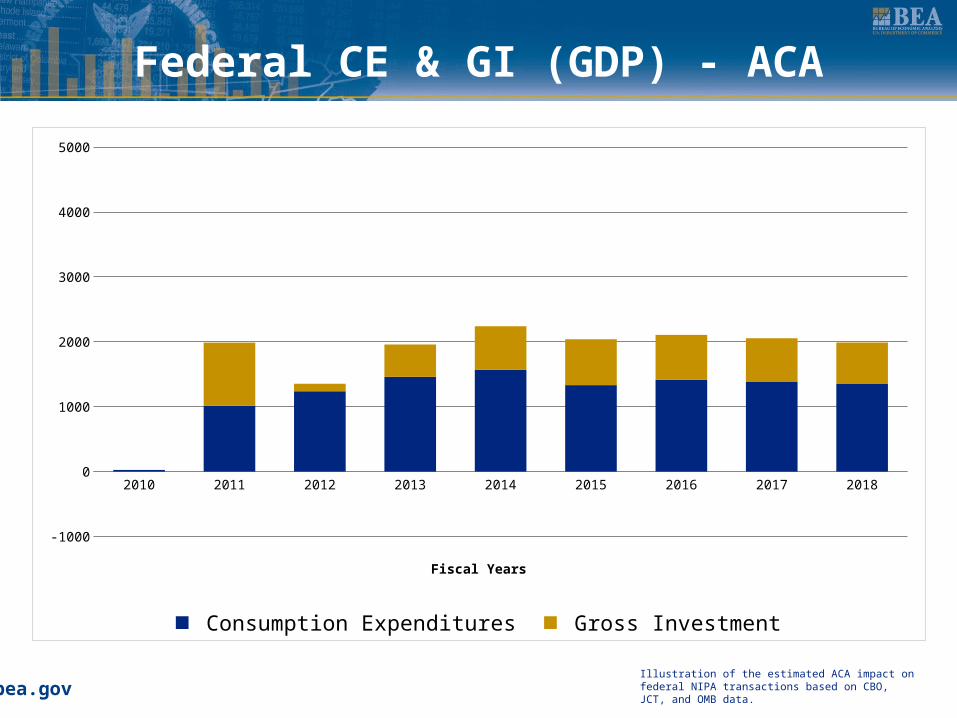
Federal CE & GI (GDP) - ACA
2010 2011 2012 2013 2014 2015 2016 2017 2018
-1000
0
1000
2000
3000
4000
5000
Consumption Expenditures Gross Investment
Fiscal Years
Illustration of the estimated ACA impact on federal NIPA transactions based on CBO, JCT, and OMB data.
bea.gov
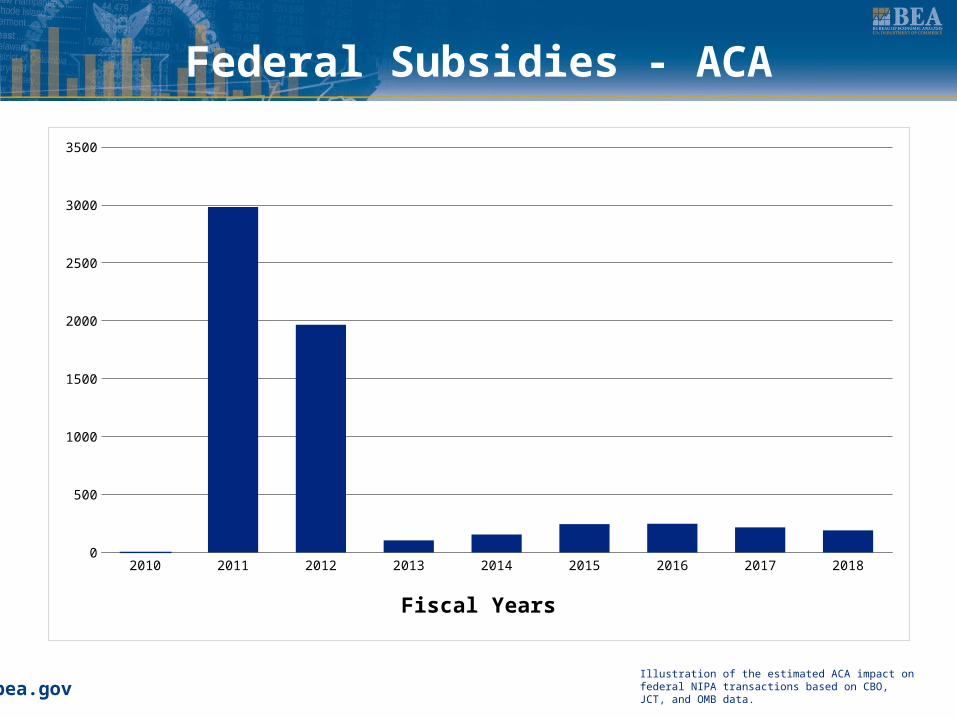
Federal Subsidies - ACA
2010 2011 2012 2013 2014 2015 2016 2017 20180
500
1000
1500
2000
2500
3000
3500
Fiscal Years
Illustration of the estimated ACA impact on federal NIPA transactions based on CBO, JCT, and OMB data.
bea.gov
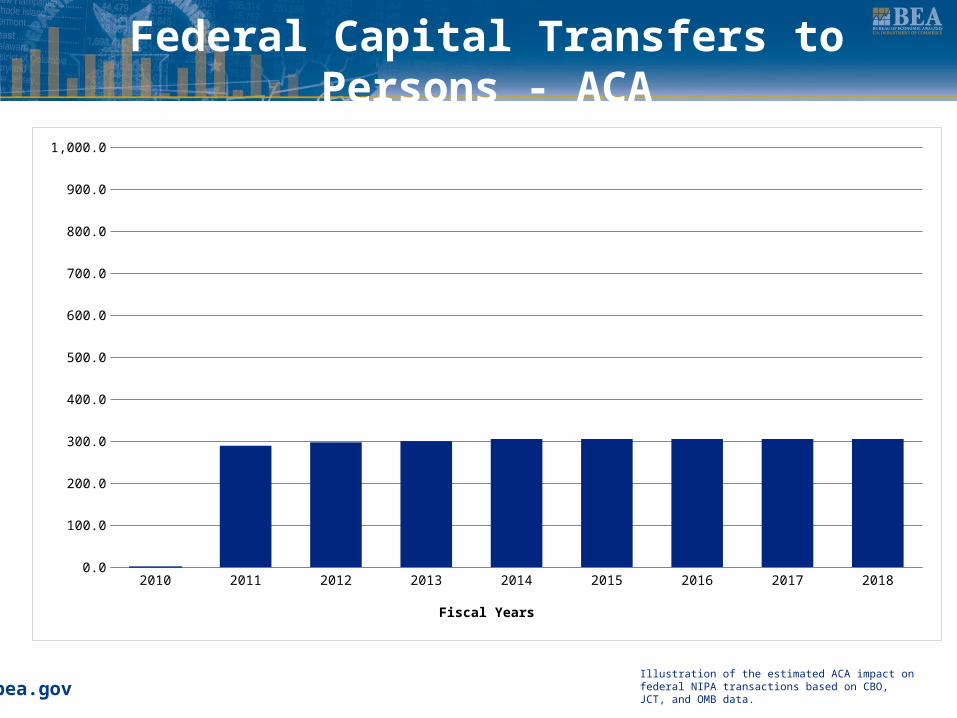
Federal Capital Transfers to Persons - ACA
2010 2011 2012 2013 2014 2015 2016 2017 20180.0
100.0
200.0
300.0
400.0
500.0
600.0
700.0
800.0
900.0
1,000.0
Fiscal Years
Illustration of the estimated ACA impact on federal NIPA transactions based on CBO, JCT, and OMB data.
bea.gov
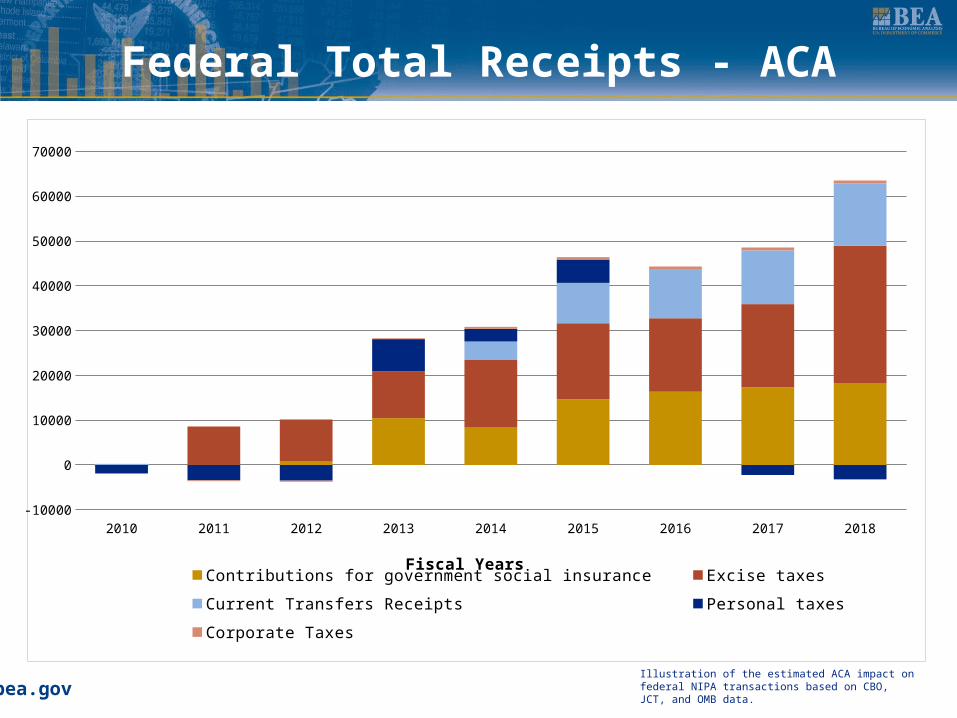
Federal Total Receipts - ACA
2010 2011 2012 2013 2014 2015 2016 2017 2018-10000
0
10000
20000
30000
40000
50000
60000
70000
Contributions for government social insurance Excise taxes Current Transfers Receipts Personal taxes
Corporate Taxes
Fiscal Years
Illustration of the estimated ACA impact on federal NIPA transactions based on CBO, JCT, and OMB data.
bea.gov
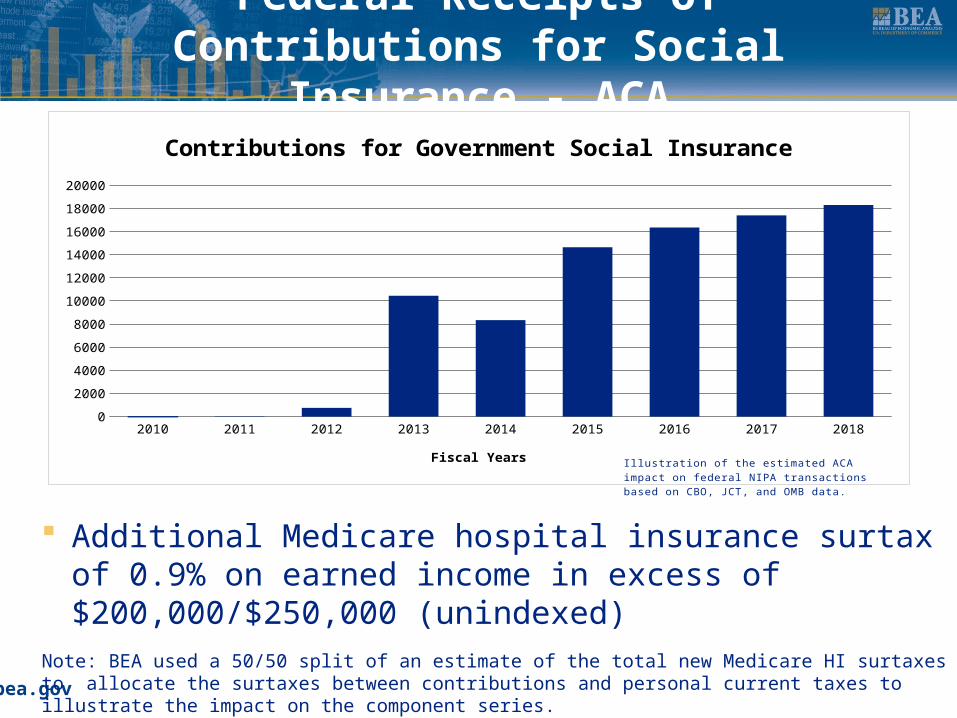
Federal Receipts of Contributions for Social Insurance - ACA
Additional Medicare hospital insurance surtax of 0.9% on earned income in excess of $200,000/$250,000 (unindexed)
Note: BEA used a 50/50 split of an estimate of the total new Medicare HI surtaxes to allocate the surtaxes between contributions and personal current taxes to illustrate the impact on the component series.
2010 2011 2012 2013 2014 2015 2016 2017 20180
2000
4000
6000
8000
10000
12000
14000
16000
18000
20000
Contributions for Government Social Insurance
Fiscal Years Illustration of the estimated ACA impact on federal NIPA transactions based on CBO, JCT, and OMB data.
bea.gov
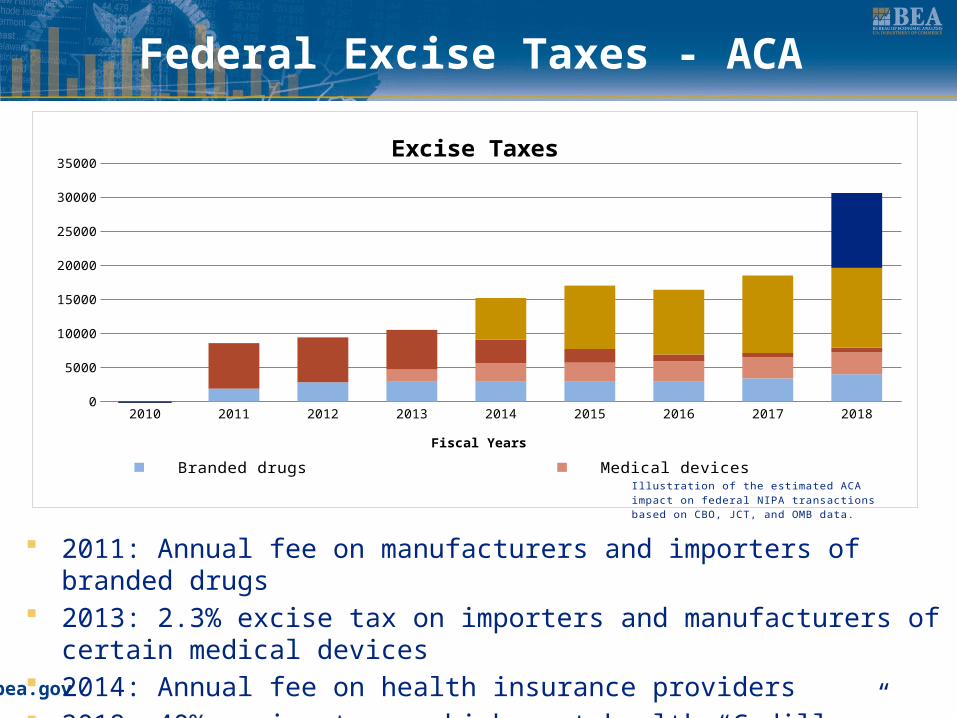
Federal Excise Taxes - ACA
2011: Annual fee on manufacturers and importers of branded drugs 2013: 2.3% excise tax on importers and manufacturers of certain medical devices 2014: Annual fee on health insurance providers 2018: 40% excise tax on high cost health “Cadillac” plans
2010 2011 2012 2013 2014 2015 2016 2017 20180
5000
10000
15000
20000
25000
30000
35000Excise Taxes
Branded drugs Medical devices Other excise taxes Health insurance providers High cost health insurance plans
Fiscal Years
Illustration of the estimated ACA impact on federal NIPA transactions based on CBO, JCT, and OMB data.
bea.gov
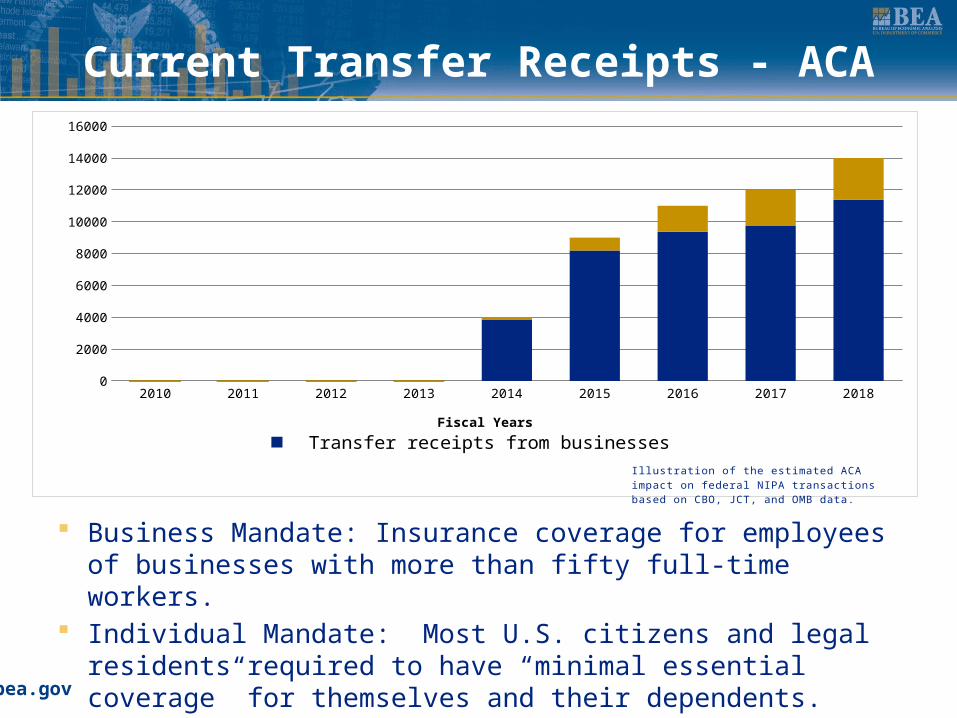
Current Transfer Receipts - ACA
Business Mandate: Insurance coverage for employees of businesses with more than fifty full-time workers.
Individual Mandate: Most U.S. citizens and legal residents required to have “minimal essential coverage” for themselves and their dependents.
2010 2011 2012 2013 2014 2015 2016 2017 20180
2000
4000
6000
8000
10000
12000
14000
16000
Transfer receipts from businesses Transfer receipts from persons
Fiscal Years
Illustration of the estimated ACA impact on federal NIPA transactions based on CBO, JCT, and OMB data.
bea.gov
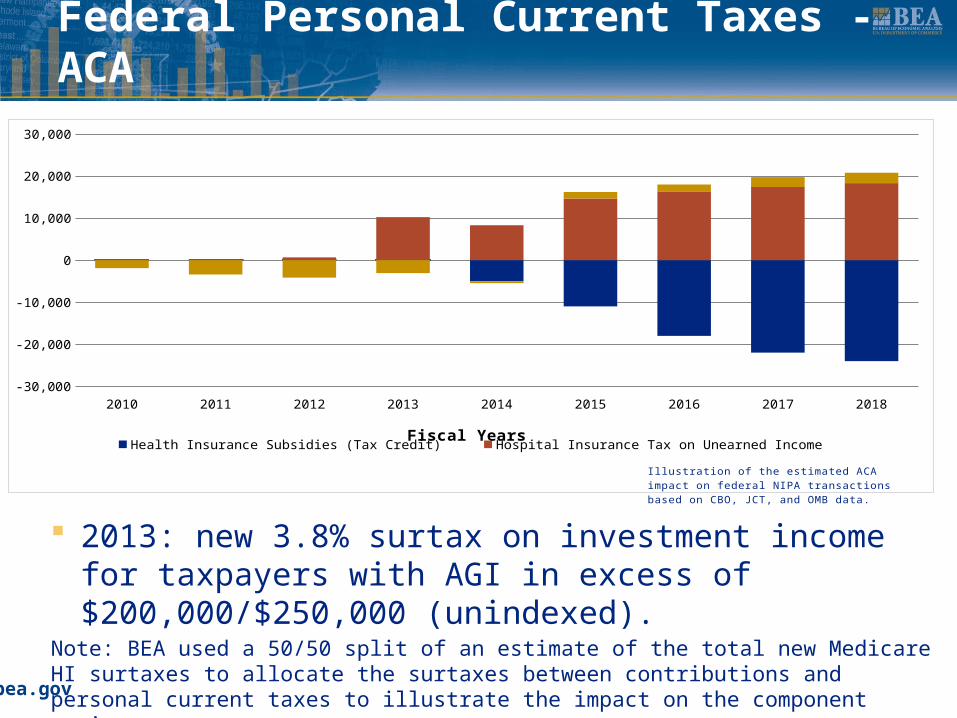
Federal Personal Current Taxes - ACA
2010 2011 2012 2013 2014 2015 2016 2017 2018-30,000
-20,000
-10,000
0
10,000
20,000
30,000
Health Insurance Subsidies (Tax Credit) Hospital Insurance Tax on Unearned Income Other personal taxes impactsFiscal Years
Illustration of the estimated ACA impact on federal NIPA transactions based on CBO, JCT, and OMB data.
2013: new 3.8% surtax on investment income for taxpayers with AGI in excess of $200,000/$250,000 (unindexed).
Note: BEA used a 50/50 split of an estimate of the total new Medicare HI surtaxes to allocate the surtaxes between contributions and personal current taxes to illustrate the impact on the component series.
bea.gov
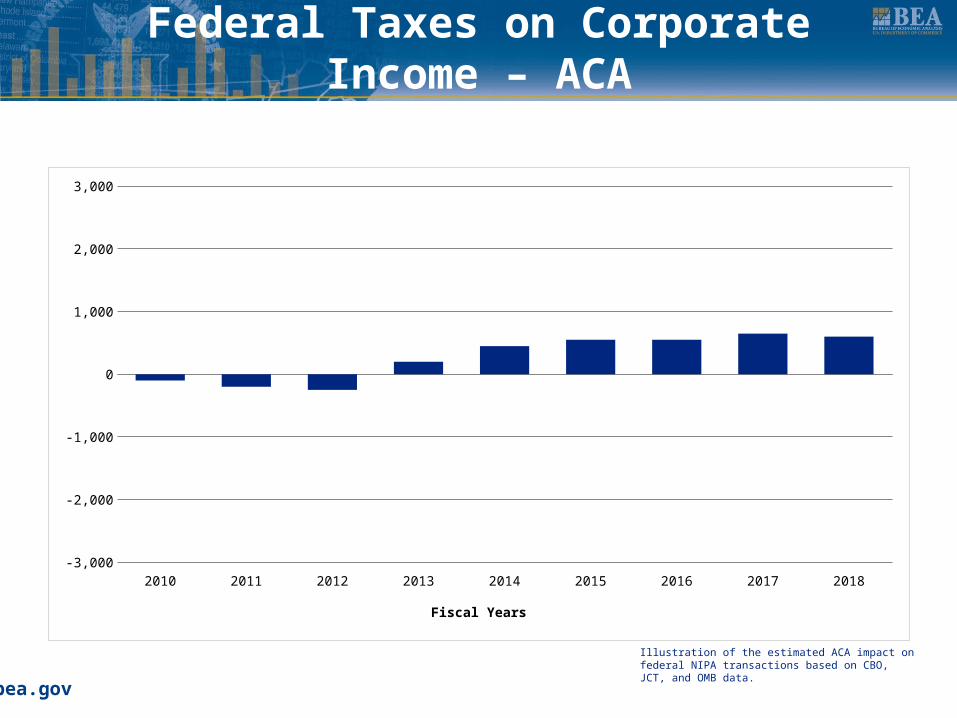
Federal Taxes on Corporate Income – ACA
2010 2011 2012 2013 2014 2015 2016 2017 2018-3,000
-2,000
-1,000
0
1,000
2,000
3,000
Fiscal Years
Illustration of the estimated ACA impact on federal NIPA transactions based on CBO, JCT, and OMB data.
bea.gov
ACA Analysis – Future Considerations
The implementation of the ACA will lead to changes in the current estimates of impacts
Some programs may be modified or eliminated Unclear exactly what actions individuals and employers will
take regarding health insurance. Impacts on other sectors of the NIPAs?
State and Local Governments
Personal Consumption Expenditures (Current dollars and Prices)
Corporate Profits
bea.gov
2013 Comprehensive Revision - NIPAs
Changes in economic accounting definitions and classifications
Capitalization of research and development
Accrual treatment of defined benefit pension plan transactions