Embed Size (px)
Citation preview

Accounting

1
Performance Indicator1. Student Learning Results
Performance Measure What is your measurement instrument or process? Current Results Analysis of Results Action Taken or Improvement made Insert Graphs or Tables of Resulting Trends (3-5 data points preferred)
Measurable goal Do not use grades. What are your current results? What did you learn from the results? What did you improve or what is your next step?
What is your goal? (Indicate type of instrument) direct, formative, internal, comparativeOur goal is achieve a 50th average percentile rank on all MFT all performace areas.
Peregrine's MFT assessment, Summative external data Accounting majors scored between 57 and 70 percentile during this time period.
Overall, accounting majors are exceeding expectations
None needed at this time.
Our goal is achieve a score of 50 or above on all MFT performace areas, and to continually improve our scores.
Peregrine's MFT assessment, Summative external data Accounting majors consistently scored above the 50 percential throughout this time period.
Overall, accounting majors are exceeding expectations
None needed at this time.
Our goal is achieve a a score of 50 or above on all Accounting Subject areas, and to continually improve our scores.
Peregrine's MFT assessment, Summative external data Accounting majors consistently scored above the 50 percential throughout this time period.
The overall trend is upward although there was a drop in 2018-19. Given the increase in 2019-20, that drops appears to be a stand-alone anamoly.
None needed at this time.
Standard #4 Measurement and Analysis of Student Learning and PerformanceUse this table to supply data for Criterion 4.2.
DefinitionA student learning outcome is one that measures a specific competency attainment. Examples of a direct assessment (evidence) of student learning attainment that might be used include: capstone performance, third-party examination, faculty-designed examination, professional performance, licensure examination). Add these to the description of the measurement instrument in column two:Direct - Assessing student performance by examining samples of student workFormative – An assessment conducted during the student’s education.Summative – An assessment conducted at the end of the student’s education.Internal – An assessment instrument that was developed within the business unit.External – An assessment instrument that was developed outside the business unit.Comparative – Compare results between classes, between online and on ground classes, Between professors, between programs, between campuses, or compare to external results such as results from the U.S. Department of Education Research and Statistics, or results from a vendor providing comparable data.
Analysis of Results

2
Accounting Knowledge #1 (Part 1): Demonstrate ability to organize, review, and prepare financial statements, primarily focusing on corporate and governmental/nonprofit entities. The goal for AC201: that the average score is at or above the Proficient level. For AC320, 330, and 425: that at least 90% of students are scoring at or above the Proficient level. 5-point scale used: Exemplary, Superior, Proficient, Deficient, and Inadequate.
An exam problem that requires students to organize and prepare financial statements. The exam problem increases in difficulty as advance to higher-level courses. AC201 is a formative assessment.
Lowest "all students" average was 64% (Proficient) for 2016-17; otherwise the outcome tended to stay close to 73% throughout the years. Further, 2017-18 marks the 1st time that the average results for all modalities reached the Superior level. Conclusion: throughout all six years the average score was at or above Proficient.
The Fall 2013 results indicated too many students had a Deficient knowledge. The consensus among instructors was that the course covered too much content and lacked a clear study plan for the final exam. We implemented adjustments to the course for Summer 2014 with immediate positive outcomes. In 2017-18 the Final Exam settings were inadvertently changed to allow 3 attempts per question, as opposed to just 1. This likely contributed to stellar outcomes that year. These exam settings were corrected for 2019 and 2020.
We achieved positive outcomes effective Summer 2014 by: 1 - decreasing chapters from 12 to 11. 2 - developing final exam review assignment (for course points) that includes preparation of financial statements. Additional positive outcomes were achieved in 2018 when we provided a stronger reward structure for completion of the final exam review assignment. 2019 adjustments include: 1- assure that adjuncts are administering exam as directed (we discovered one that was providing unlimited time), 2 - set final exam so that students are not aware of exam score until completed as a means of motivating full completion of exam.
An exam problem that requires students to organize and prepare financial statements. The exam problem increases in difficulty as advance to higher-level courses. AC320 is a formative assessment.
87-100% of all students scored proficient or above during the 6 year time period. AY2019-20 score is 96%. Our 90% goal was met.
Accounting majors mostly populate this course so they are more concerned about mastering accounting as part of their career preparation.
There are plans to redevelop this course for Spring 2021 to provide an even more student-friendly platform.
An exam problem that requires students to organize and prepare financial statements. The exam problem increases in difficulty as advance to higher-level courses. AC330 is a formative assessment focusing on the Statement of Cash Flows.
81 - 100% of all students scored proficient or above during the 5 year time period. AY2019-20 score is 81%. Our 90% goal was met in 2015-16 and 2018-19.
The Statement of Cash Flows requires intensive understanding of account analysis so a very, very challening accounting topic.
For 2015-16 we incorporated the "MixMax" case throughout AC320 & 325. The case repeatedly focuses on account analysis and continuously grows in complexity. The 2015-16 results convey this has had a positive impact on student outcomes. However, we may need to better motivate students to complete this case as we redevelop AC320 and 325. We also may need to reconsider our expectations give the complexity of this topic.
An exam problem that requires students to organize and prepare financial statements. The exam problem increases in difficulty as advance to higher-level courses. AC425 is a summative assessment focusing on Consolidated Corporations & Governmental/Nonprofit entities.
88 - 97% of all students scored at or above Proficient. AY2019-20 score is 89%. With the exception of 2016-17 ,ur 90% goal was essentially met throughout this 5 year period.
The program formative assessments support continuous student development to enable positive student outcomes at the summative assessment level.
We plan to redevelop the course for Spring 2021 to incorporate an online homework system. We anticipate this will better motivate students and provide better and more timely student feedback.
Accounting Knowledge #1 (Part 2): Apply the conceptual framework to analyze core accounting events. The goal for AC201: that the average score is at or above the Proficient level. For AC320 and 425: that at least 90% of students are scoring at or above the Proficient level. 5-point scale used: Exemplary, Superior, Proficient, Deficient, and Inadequate.
Exam questions. The exam increases in difficulty as advance to higher-level courses. The AC201 comprehensive final exam is a formative assessment.
There is an overall upward trend for "All Students" that mostly flattened out the past 5 years. The "all students" average AV2019-20 score is 75% (superior) . Throughout all years the average score was at or above Proficient.
There was an overall upward trend following the course adjustments made in Summer 2014. In 2017-18 the Final Exam settings were inadvertently changed to allow 3 attempts per question, as opposed to just 1. This likely contributed to stellar outcomes that year. These exam settings were corrected for 2019 and 2020.
Beginning Summer 2014 we: 1 - decreased chapters from 12 to 11. 2 - developed a highly structured final exam review assignment as part of total course points. 3 - more clearly directed student attention towards homework completion by removing excessive case discussions in online environment. Replaced those case discussions with homework discussions.
Exam questions. The exam increases in difficulty as advance to higher-level courses. The AC320 final exam is a formative assessment.
69-81% of all students scored proficient or above during the 5 year time period. Even so, there have not been drastic variations. Still, we did not meet our 90% goal.
We may have too high of expectations. Accounting content is very challening in this course. In addition, it may be that we have a significant minority of students preforming at "deficient" and "inadequate" in this entry-level course for the accounting major because of those opting to drop out of the accounting major and doing so after this exam. By then, it is reasonable that a number of students would have decided to change their major from accounting.
There are plans to redevelop this course for Spring 2021 to provide enhancements that provide an even more student-friendly platform.
3
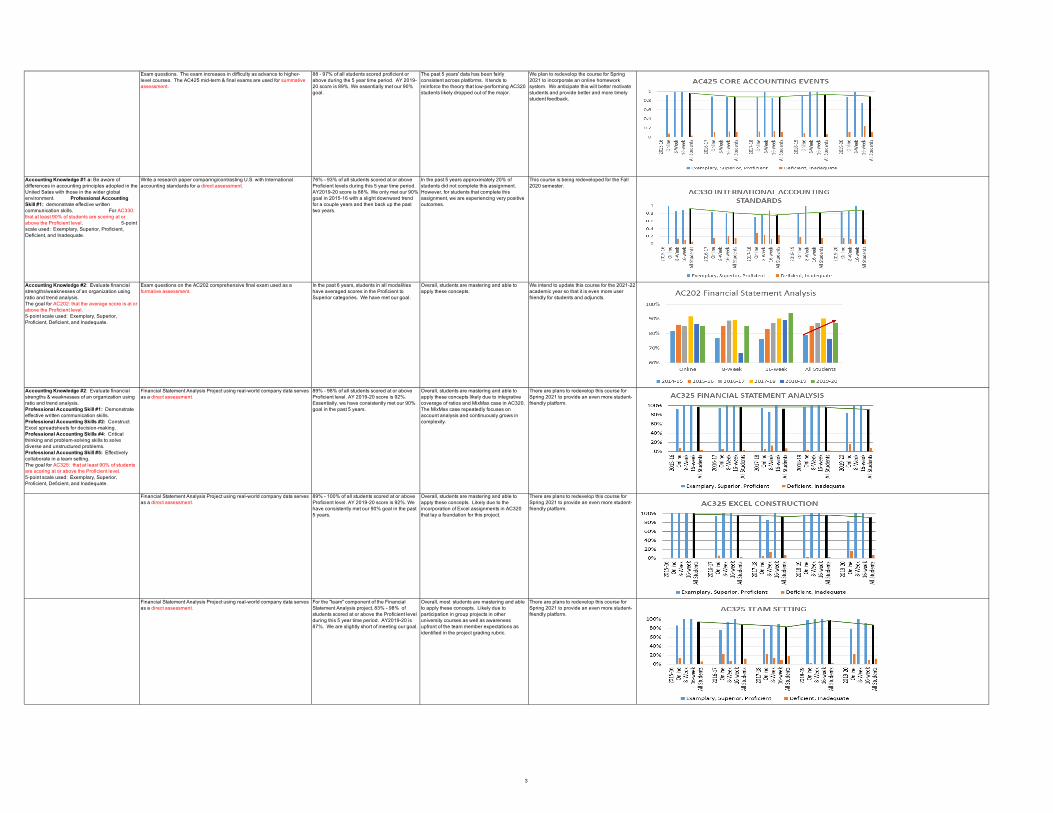
Exam questions. The exam increases in difficulty as advance to higher-level courses. The AC425 mid-term & final exams are used for summative assessment.
88 - 97% of all students scored proficient or above during the 5 year time period. AY 2019-20 score is 89%. We essentially met our 90% goal.
The past 5 years' data has been fairly consistent across platforms. It tends to reinforce the theory that low-performing AC320 students likely dropped out of the major.
We plan to redevelop the course for Spring 2021 to incorporate an online homework system. We anticipate this will better motivate students and provide better and more timely student feedback.
Accounting Knowledge #1 a: Be aware of differences in accounting principles adopted in the United Sates with those in the wider global environment. Professional Accounting Skill #1: demonstrate effective written communication skills. For AC330: that at least 90% of students are scoring at or above the Proficient level. 5-point scale used: Exemplary, Superior, Proficient, Deficient, and Inadequate.
Write a research paper comparing/contrasting U.S. with International accounting standards for a direct assessment.
76% - 93% of all students scored at or above Proficient levels during this 5 year time period. AY2019-20 score is 88%. We only met our 90% goal in 2015-16 with a slight downward trend for a couple years and then back up the past two years.
In the past 5 years approximately 20% of students did not complete this assignment. However, for students that complete this assignment, we are experiencing very positive outcomes.
This course is being redeveloped for the Fall 2020 semester.
Accounting Knowledge #2: Evaluate financial strengths/weaknesses of an organization using ratio and trend analysis. The goal for AC202: that the average score is at or above the Proficient level. 5-point scale used: Exemplary, Superior, Proficient, Deficient, and Inadequate.
Exam questions on the AC202 comprehensive final exam used as a formative assessment.
In the past 6 years, students in all modalities have averaged scores in the Proficient to Superior categories. We have met our goal.
Overall, students are mastering and able to apply these concepts.
We intend to update this course for the 2021-22 academic year so that it is even more user friendly for students and adjuncts.
Accounting Knowledge #2: Evaluate financial strengths & weaknesses of an organization using ratio and trend analysis. Professional Accounting Skill #1: Demonstrate effective written communication skills. Professional Accounting Skills #2: Construct Excel spreadsheets for decision-making. Professional Accounting Skills #4: Critical thinking and problem-solving skills to solve diverse and unstructured problems. Professional Accounting Skill #5: Effectively collaborate in a team setting. The goal for AC325: that at least 90% of students are scoring at or above the Proficient level. 5-point scale used: Exemplary, Superior, Proficient, Deficient, and Inadequate.
Financial Statement Analysis Project using real-world company data serves as a direct assessment.
89% - 98% of all students scored at or above Proficient level. AY 2019-20 score is 92%. Essentially, we have consistently met our 90% goal in the past 5 years.
Overall, students are mastering and able to apply these concepts likely due to integrative coverage of ratios and MixMax case in AC320. The MixMax case repeatedly focuses on account analysis and continuously grows in complexity.
There are plans to redevelop this course for Spring 2021 to provide an even more student-friendly platform.
Financial Statement Analysis Project using real-world company data serves as a direct assessment.
89% - 100% of all students scored at or above Proficient level. AY 2019-20 score is 92%. We have consistently met our 90% goal in the past 5 years.
Overall, students are mastering and able to apply these concepts. Likely due to the incorporation of Excel assignments in AC320 that lay a foundation for this project.
There are plans to redevelop this course for Spring 2021 to provide an even more student-friendly platform.
Financial Statement Analysis Project using real-world company data serves as a direct assessment.
For the "team" component of the Financial Statement Analysis project, 83% - 98% of students scored at or above the Proficient level during this 5 year time period. AY2019-20 is 87%. We are slightly short of meeting our goal.
Overall, most students are mastering and able to apply these concepts. Likely due to participation in group projects in other university courses as well as awareness upfront of the team member expectations as identified in the project grading rubric.
There are plans to redevelop this course for Spring 2021 to provide an even more student-friendly platform.

4
Accounting Knowledge #3 (Part 1): Apply costs through a cost system (such as job order, process, and activity-based costing systems). The goal for AC202: that the average score is at or above the Proficient level. For AC380: that at least 90% of students are scoring at or above the Proficient level. 5-point scale used: Exemplary, Superior, Proficient, Deficient, and Inadequate.
AC202 Comprehensive Final Exam is used for formative assessment. In the current AY the student average in all delivery platforms was either Superior or Exemplary. We have met our goal of the average score being above Proficiency.
Overall, students are mastering and able to apply these concepts.
We intend to update this course for the 2021-22 academic year so that it is even more user friendly for students.
AC380 Comprehensive Final Exam is used for summative assessment. 46% - 80% of students scored at or above the Proficient level, including 21 - 41% at Exemplary during this 5 year time period. We have not met out 90% goal over this time period.
There was a dip in the outcomes last year but an upward trand this year.
There are plans to redevelop this course; however, that time frame has to be postponed due to other pressing needs due to Covid 19 pandemic. In the meantime, we will collect additional data.
Accounting Knowledge #3 (Part 2): Prepare budget reports and analyze variances. The goal for AC202: that the average score is at or above the Proficient level. For AC380: that at least 90% of students are scoring at or above the Proficient level. 5-point scale used: Exemplary, Superior, Proficient, Deficient, and Inadequate.
AC202 Comprehensive Final Exam is used for formative assessment. In the current AY the student average in all delivery platforms was either Superior or Exemplary. We have met our goal of the average score being above Proficiency.
Overall, students are mastering and able to apply these concepts.
We intend to update this course for the 2021-22 academic year so that it is even more user friendly for students.
AC380 Comprehensive Final Exam is used for summative assessment. 68% - 82% of students scored at or above the Proficient level, including 43 - 45% at Exemplary over this 4 year time period. We did not meet our 90% goal during this time period.
There was a dip in the outcomes last year but an upward trand this year.
There are plans to redevelop this course; however, that time frame has to be postponed due to other pressing needs due to Covid 19 pandemic. In the meantime, we will collect additional data.
Accounting Knowledge #3 (Part 3): Evaluate cost behaviors/methods and production reports for strategic decision-making. The goal for AC202: that the average score is at or above the Proficient level. For AC380: that at least 90% of students are scoring at or above the Proficient level. 5-point scale used: Exemplary, Superior, Proficient, Deficient, and Inadequate.
AC202 Comprehensive Final Exam is used for formative assessment. In the current AY the student average in all delivery platforms was either Superior or Exemplary. We have met our goal of the average score being above Proficiency.
Overall, students are mastering and able to apply these concepts.
We intend to update this course for the 2021-22 academic year so that it is even more user friendly for students.
AC380 Comprehensive Final Exam is used for summative assessment. 70 - 83% of students scored at or above the Proficient level all years, including 43 - 70% at Exemplary. We did not meet out 90% goal during these 5 years.
Signs indicate a significant number of students are not mastering these concepts………..or perhaps we have set too high of expectation. This pattern remained fairly flat but dropped somewhat this current AY.
There are plans to redevelop this course; however, that time frame has to be postponed due to other pressing needs due to Covid 19 pandemic. In the meantime, we will collect additional data.

5
Accounting Knowledge #3 (Part 4): Explain the management accountant's role utilizing cost measurements for decision-making in global organizations. Accounting Professional Skill #1: Demonstrate effective writing. Professional Skill #4: Critical thinking and problem-solving skills to solve diverse and unstructured problems. Professional Orientation #2: Recognize the complexities in the global business/accounting environment. For AC380: that at least 90% of students are scoring at or above the Proficient level. 5-point scale used: Exemplary, Superior, Proficient, Deficient, and Inadequate.
A written decision-making project completed individually is used as a direct assessment.
68% -92% of students scored at or above the Proficient level, including 55 - 80% at Exemplary during this 5 year time period. We did not meet out 90% goal.
There had been a continuous upward trend with meeting the 90% goal AY2017-18, dipped down last year, and then somewhat back up this current AY.
There are plans to redevelop this course; however, that time frame has to be postponed due to other pressing needs due to Covid 19 pandemic. In the meantime, we will collect additional data.
Accounting Knowledge #4: Tax compliance and strategy for individual and business entities. (Part 1): Explain fundamental tax concepts for individuals. For AC309: that at least 90% of students are scoring at or above the Proficient level. 5-point scale used: Exemplary, Superior, Proficient, Deficient, and Inadequate.
AC309 Comprehensive Final Exam is used for summative assessment. 82% -92% of students scored at or above the Proficient level, including 61-82% at Exemplary during this 3 year time period. Current AY score was 82% (and all of those were at Exemplary.) We were able to meet out 90% goal in 2017-18 & 2018-19 but not the current year.
There had been a positive trend with meeting the 90% goal last year; however, dipped down somewhat this year.
The course was redeveloped two years ago. The results convey slightly more rigor introduced in the course but not excessively so. We recently hired a new faculty member holding a tax specialization with plans to update this course sometime next year.
Accounting Knowledge #4: Tax compliance and strategy for individual and business entities. (Part 2): Explain fundamental tax conceptsfor C-corporations & flow-through entities. For AC312: that at least 90% of students are scoring at or above the Proficient level. 5-point scale used: Exemplary, Superior, Proficient, Deficient, and Inadequate.
AC312 Comprehensive Final Exam is used for summative assessment. This course lacks much data collection. In 2017-18 we were unable to collect data from the 8-week format. Then in 2018-19 the course was in process of revision and no data was collected. In 2019-20 the course was not offered at the Parkville campus because of low enrollment and lack of qualified faculty. 66-97% of all students scored at or above Proficient over the two years measured. We met our 90% goal in 2018.
There is insufficient data to derive any clear patterns.
This course was redeveloped for the Fall 2, 2019 term to incorporate major new tax law. We recently hired a new faculty member holding a tax specialization with plans to update this course sometime next year.
Accounting Knowledge #4: Tax compliance and strategy for individual and business entities. Accounting Professional Skill #2: Use of technology adopted by professional accountants. Professional Skill #4: Critical thinking and problem-solving skills to solve diverse and unstructured problems. For AC309 & AC312: that at least 90% of students are scoring at or above the Proficient level. 5-point scale used: Exemplary, Superior, Proficient, Deficient, and Inadequate.
AC309: Completion of Individual Income Tax Return using unstructured information.
93 - 97% of students scored at or above Proficient with 33 - 73% Exemplary. We are now meeting our 90% goal.
Although a modest dip in 2019-20, the course has consistently met the 90% goal.
The course was redeveloped two years ago to incorporate new tax law. We recently hired a new faculty member holding a tax specialization with plans to update this course sometime next year.
AC312: Completion of Business Income Tax Return using unstructured information.
This course lacks much data collection. In 2017-18 we were unable to collect data from the 8-week format. Then in 2018-19 the course was in process of revision and no data was collected. In 2019-20 the course was not offered at the Parkville campus because of low enrollment and lack of qualified faculty. Over the two years, 83-89% of students scored at or above Proficient. Although close in 2018, we have not yet met our 90% goal.
There is insufficient data to derive any clear patterns.
This course was redeveloped for the Fall 2, 2019 term to incorporate major new tax law. We recently hired a new faculty member holding a tax specialization with plans to update this course sometime next year.
Accounting Knowledge #5: Accounting and business processes, with related internal controls. Part 2 Evaluate risk and internal controls of accounting processes. The goal for AC350 is at least 90% of students are scoring at or above the Proficient level. 5-point scale used: Exemplary, Superior, Proficient, Deficient, and Inadequate.
AC350 final exam is used as a formative assessment. 88 - 100% of all students scored at or above Proficient with 45 - 87% at Exemplary. The course was not offered in the 16-week format this year because of low enrollments. We are essentially meeting the 90% goal.
Overall, students are mastering these concepts. This course was redeveloped Fall 2018 to switch textbooks and Excel materials.

6
Accounting Knowledge #5: Accounting and business processes, with related internal controls. Part 2: Evaluatge internal control of accounting processes. Accounting Knowledge #6: Assurances of financial statements. Evaluate internal control to develop a strategy for tests of controls. Professional Accounting Skill #4: Critical thinking and problem-solving skills to solve diverse and unstructured problems. The goal for AC430 is at least 90% of students are scoring at or above the Proficient level. 5-point scale used: Exemplary, Superior, Proficient, Deficient, and Inadequate.
AC430 final exam is used as a diect assessment. 87 - 96% of all students scored at or above Proficiency over this 5 year time period. Current AY was 89%. This course was not offered in the 16-week format this year due to low enrollments. We are essentially meeting our 90% goal.
Overall, students are mastering these concepts. This course and related CLOs were redeveloped this year to reflect current audit theories and processes. We compared this year with a similar CLO from prior years. We see no need for modifications at this time.
Accounting Knowledge #6: Assurances of financial statements, including risk assessment. Part 1: Explain the role of external auditing in financial markets. Professional Orientation #3: Identify the roles and responsibilities of accountants to assure the integrity of financial information. The goal for AC430 is at least 90% of students are scoring at or above the Proficient level. 5-point scale used: Exemplary, Superior, Proficient, Deficient, and Inadequate.
AC430 exam is used as a direct assessment. 86% - 93% of all students scored at or above Proficiency. Current AY was 85%. This course was not offered in the 16-week format this year due to low enrollments. In most years, we met our 90% goal.
Overall, students are mastering these concepts. This course and related CLOs were redeveloped this year to reflect current audit theories and processes. We compared this year with a similar CLO from prior years. We see no need for modifications at this time.
Professional Accounting Skill #2: Use of technology adopted by professional accountants. Part 1: Construct Excel spreadsheets for accounting decision-making. The goal for AC320 & 350 is at least 90% of students are scoring at or above the Proficient level. 5-point scale used: Exemplary, Superior, Proficient, Deficient, and Inadequate.
AC320 Excel Amortization Schedule assignment is used as a formative assessment.
58% - 71% of all students scored at or above Proficient level. AY 2019-20 scored 66%. We have not met our 90% goal.
A significant number of students, both online and f2f, chose to avoid this assignment - probably because of few points assigned to it. Our data, therefore does not inform about mastery of this skill.
There was improvement overall in 2017-18 which may be attributed to having full-time faculty teaching most of the online sections. Previously we enlarged the reward structure; however, a good number of students still opt out of completing this assignment and thus distorts the data. There are plans to redevelop this course for Spring 2021 to provide enhancements that provide an even more student-friendly platform.
AC350 Excel assignment requiring the use of higher-level Excel functions is used as a summative assessment.
60% - 83% of students performed at or above Proficient with the past two years remaining flat at around 79%. 42 - 79% scored Exemplary during this 4 year time period. 15 - 35% of students scored Inadequate likely due to avoidance of the assignment. This course was not offered in the 16-week format this year due to low enrollments. We did not meet our 90% goal.
In general, students are mastering higher-level Excel skills. Repetitive use of Excel in AC320, 325, and 330 facilitate the ability to move into higher-level spreadsheet skills. It could be that students scoring Inadequate did not complete these prerequisite courses at Park using Excel, particularly during the 2018 AY. Or it may be that they opted to avoid this assignment.
In the past two years our efforts have shown improvement in motivating more students to complete these assignments.
Professional Accounting Skill #3: Accounting research skills, including, but not limited to FASB Codification Database, U.S. tax law, AICPA Auditing Standards, etc. Professional Accounting Skill #1: Write research mems in good form. The goal for AC312, 320 & 425 is at least 90% of students are scoring at or above the Proficient level. 5-point scale used: Exemplary, Superior, Proficient, Deficient, and Inadequate.
AC312 assignment requiring justifying resolution for unstructured accounting case utilizing the income tax sources is a formative assessment.
This course lacks much data collection. In 2017-18 we were unable to collect data from the 8-week format. Then in 2018-19 the course was in process of revision and no data was collected. In 2019-20 the course was not offered at the Parkville campus because of low enrollment and lack of qualified faculty. Over the two years, 75-92% of students scored at or above Proficient. We met our 90% goal in 2018
There is insufficient data to derive any clear patterns.
This course was redeveloped for the Fall 2, 2019 term to incorporate major new tax law. We recently hired a new faculty member holding a tax specialization with plans to update this course sometime next year.
AC320 assignment requiring justifying resolution for unstructured accounting case utilizing the FASB Codification database is a formative assessment.
48% - 78% of all students scored at or above Proficient level. AY 2019-20 score is 60%. We have not met our 90% goal.
A significant number of students, both online and f2f, chose to avoid this assignment - probably because of few points assigned to it. Our data, therefore does not inform about mastery of this skill.
There was improvement overall in 2017-18 which may be attributed to having full-time faculty teaching most of the online sections. Previously we enlarged the reward structure; however, a good number of students still opt out of completing this assignment and thus distorts the data. There are plans to redevelop this course for Spring 2021 to provide enhancements that provide an even more student-friendly platform.

7
AC425 assignment requiring justifying resolution for unstructured accounting case utilizing the GASB Codification database is a summative assessment.
The goal was met in 2015-16 (94%) but not in the past 4 years ranging between 49-71% of all students scoring at or above Proficient level. Current AY is 65% and all at the Exemplary level. We currently did not meet our goal.
Roughly 24-38% of students are not completing this activity creating a bias in our conclusion. We believe that overall, students are mastering these skills and that is demonstrated by the students who complete the assignment. The incorporation of similar assignments in both AC320 & 325 lays a solid foundation for this summative assessment in AC425.
We will look at ways of better motivating students to complete this assignment. We plan to redevelop the course for Spring 2021 to incorporate an online homework system to enhance the learning platform. (The course currently does not contain an online homework system.)
Professional Orientation #1: Identify and apply principles of ethical behavior in decision-making. Goal for AC330 is at least 90% of students complete certification.
Complete Certificate in Ethical Leadership from the NASBA Center for the Public Trust. A minimum score of 80% much be achieved to be awarded certificate. This is an external assessment.
85 - 100% of students scored at or above Proficient during this 4 year time period. The score for AY 2019-20 is 92%. We met our 90% goal.
We were able to get this activity incorported into all sections of AC330 last three years. Overall, students are mastering these skills.
Thi course is being redeveloped for Fall 2020 to move to an even more student-user friendly platform.
Professional Orientation #4: Recognize the importance of continuous lifelong learning as a professional. The goal is for students in AC320 to master how to best study accounting and also develop a professional development plan that is revisited in subsequent upper-level accounting courses.
AC320 Student Self-Assessment Checklist and Course goal-setting is a direct assessment. AC320 assignment to complete a Professional Development Plan is another direct assessment.
As part of course requirements, AC320 students complete the two assignments.
Student feedback has been highly positive. The checklist in essence, informs students what they should be doing to perform well in the course. Students research various career options prior to writing their Professional Development Plan. Many students discover there are more options in accounting than becoming a CPA.
We currently have not collected these documents. In the future we will collect samples for the full-time faculty to review.

1
Performance Indicator
Performance Measure What is your measurement instrument or process?
Current Results Analysis of Results Action Taken or Improvement made
Insert Graphs or Tables of Resulting Trends (3-5 data points preferred)
Measurable goal What are your current results?
What did you learn from the results?
What did you improve or what is your next step?
What is your goal?
Analysis on student perceptions and student satifcation. Goal is to understand the underlying influences on student perceptions and student satifisaction.
IDEA Survey Results at the Program LevelNote: Trend data will not be available until additional surveys are administered.
Perception of accounting teachers and courses is in line with the School of Business as well as national norms.
Normally student perceptions of accounting faculty and courses are more negative than other business disciplines. Given that, the accounting instructors and courses are above national norms for accounting courses.
In AY 2018-19 we streamlined communications with adjuncts by creating an Accounting Faculty Connection Point in Canvas. The Accounting PC also provides resources for adjuncts and addresses any concerns. Park University began a peer mentoring program the same year and two accounting adjuncts served as mentors. One of those is scheduled to carry forward next year. In addition the university began PC reviews of adjuncts via the online program Faculty 180. This program has allowed us to receive better feedback about course delivery particularly given the peer review process that takes place before the PC review. A survey of adjuncts this year indicated a desire to have more input in course development. We plan to reach out to adjuncts before and/or during the course development process.
Analysis on adjunct faculty satisfaction. Goal is to understand the level of faculty satisfaction at the program level.
Adjunct Faculty Satification SurveyPercentage is based on the number of adjunct faculty members providing survey feedback in the program. *Program/School of Business AY1920 Comparison
All adjunct accounting faculty are either highly satisifed or satisfied.
Clearly, all surveyed accounting adjuncts are satisfied with their job.
In AY 2018-19 we streamlined communications with adjuncts by creating an Accounting Faculty Connection Point in Canvas. The Accounting PC also provides resources for adjuncts and addresses any concerns. Park University began a peer mentoring program the same year and two accounting adjuncts served as mentors. One of those is scheduled to carry forward next year. In addition the university began PC reviews of adjuncts via the online program Faculty 180. This program has allowed us to receive better feedback about course delivery particularly given the peer review process that takes place before the PC review. A survey of adjuncts this year indicated a desire to have more input in course development. We plan to reach out to adjuncts before and/or during the course development process.
Analysis of Results
Indirect assessments measure student achievement of program by looking at attitudes. Examples of a indirect assessment may include: Student Opinion of Teaching Survey Results (IDEA) at the Program LevelSurveys of Instructors Teaching Courses in the Program
DefinitionStandard #4 Indirect Assessments Measurement

2
Analysis on adjunct faculty satisfaction. Goal is to understand the level of faculty satisfaction at the program level.
Adjunct Faculty Satification SurveyPercentage is based on the number of adjunct faculty members providing survey feedback in the program. *Program Specific AY1920 AY1819/AY1719 Trend Data
All adjunct accounting faculty are either highly satisifed or satisfied.
Clearly, all surveyed accounting adjuncts are satisfied with their job.
In AY 2018-19 we streamlined communications with adjuncts by creating an Accounting Faculty Connection Point in Canvas. The Accounting PC also provides resources for adjuncts and addresses any concerns. Park University began a peer mentoring program the same year and two accounting adjuncts served as mentors. One of those is scheduled to carry forward next year. In addition the university began PC reviews of adjuncts via the online program Faculty 180. This program has allowed us to receive better feedback about course delivery particularly given the peer review process that takes place before the PC review. A survey of adjuncts this year indicated a desire to have more input in course development. We plan to reach out to adjuncts before and/or during the course development process.
Analysis on adjunct faculty survey data specific to course structure alignment with Core Learning Outcomes (CLO's). Goal is to understand if courses within the program are appropriately structured to meet the Core Learning Outcomes (CLO's).
Adjunct Faculty Course Feedback Survey Percentage is based on the number of courses with survey feedback in the program. *Program/School of Business AY1920 Comparison
All adjunct accounting faculty agree courses are properly structured to meet CLO's.
Thre is 100% agreement that courses meet CLO's.
In AY 2018-19 we streamlined communications with adjuncts by creating an Accounting Faculty Connection Point in Canvas. The Accounting PC also provides resources for adjuncts and addresses any concerns. Park University began a peer mentoring program the same year and two accounting adjuncts served as mentors. One of those is scheduled to carry forward next year. In addition the university began PC reviews of adjuncts via the online program Faculty 180. This program has allowed us to receive better feedback about course delivery particularly given the peer review process that takes place before the PC review. A survey of adjuncts this year indicated a desire to have more input in course development. We plan to reach out to adjuncts before and/or during the course development process.

3
Analysis on adjunct faculty survey data specific to course structure alignment with Core Learning Outcomes (CLO's). Goal is to understand if courses within the program are appropriately structured to meet the Core Learning Outcomes (CLO's).
Adjunct Faculty Course Feedback Survey Percentage is based on the number of courses with survey feedback in the program. *Program Specific AY1920 AY1819/AY1719 Trend Data
All adjunct accounting faculty agree courses are properly structured to meet CLO's.
Thre is 100% agreement that courses meet CLO's.
In AY 2018-19 we streamlined communications with adjuncts by creating an Accounting Faculty Connection Point in Canvas. The Accounting PC also provides resources for adjuncts and addresses any concerns. Park University began a peer mentoring program the same year and two accounting adjuncts served as mentors. One of those is scheduled to carry forward next year. In addition the university began PC reviews of adjuncts via the online program Faculty 180. This program has allowed us to receive better feedback about course delivery particularly given the peer review process that takes place before the PC review. A survey of adjuncts this year indicated a desire to have more input in course development. We plan to reach out to adjuncts before and/or during the course development process.

ConstructionManagement

1
Performance Indicator1. Student Learning Results
Performance Measure What is your measurement instrument or process?
Current Results Analysis of Results Action Taken or Improvement made Insert Graphs or Tables of Resulting Trends (3-5 data points preferred)
Measurable goal Do not use grades. What are your current results? What did you learn from the results? What did you improve or what is your next step?
What is your goal? (Indicate type of instrument) direct, formative, internal, comparative1. Employ basic construction
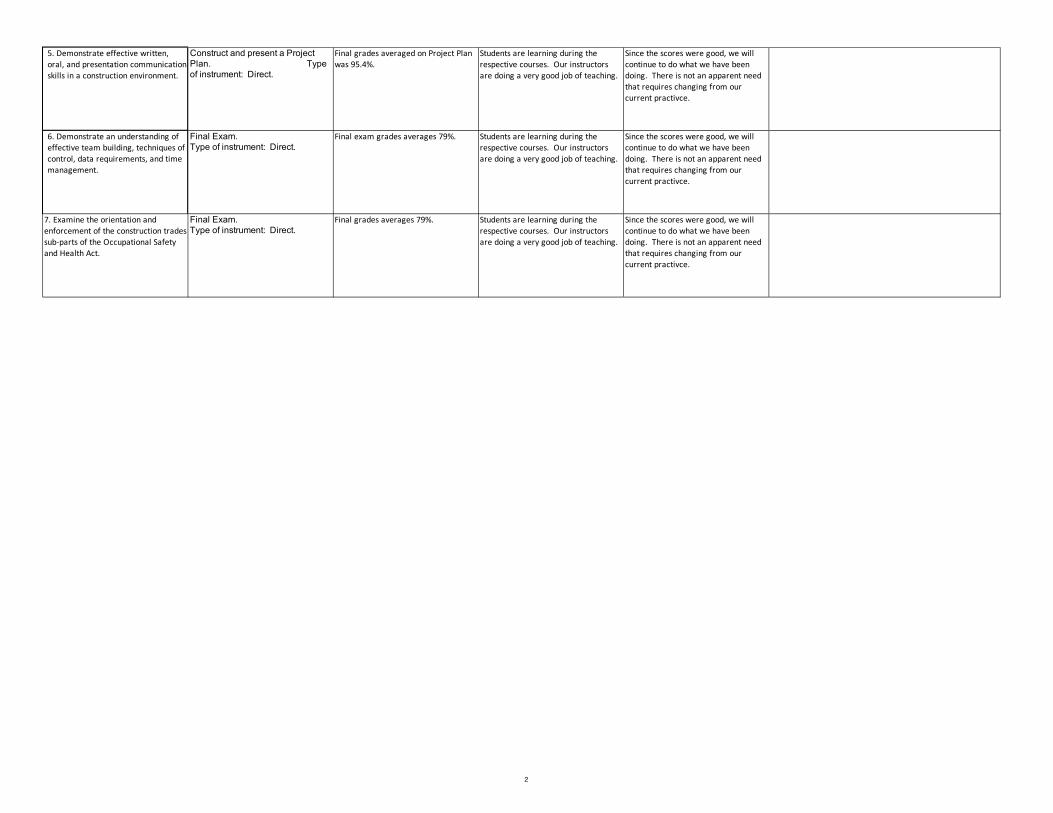
management functions.Construct and present a Project Plan. Type of instrument: Direct.
Final grades averaged on Project Plan was 95.4%.
Students are learning during the respective courses. Our instructors are doing a very good job of teaching.
Since the scores were good, we will continue to do what we have been doing. There is not an apparent need that requires changing from our current practivce.
Final Exam. Type of instrument: Direct.
Final exam grades averages 79%. Students are learning during the respective courses. Our instructors are doing a very good job of teaching.
Since the scores were good, we will continue to do what we have been doing. There is not an apparent need that requires changing from our current practivce.
Final Exam. Type of instrument: Direct.
Final grades averages 79%. Students are learning during the respective courses. Our instructors are doing a very good job of teaching.
Since the scores were good, we will continue to do what we have been doing. There is not an apparent need that requires changing from our current practivce.
Use this table to supply data for Criterion 4.2.Definition
A student learning outcome is one that measures a specific competency attainment. Examples of a direct assessment (evidence) of student learning attainment that might be used include: capstone performance, third-party examination, faculty-designed examination, professional performance, licensure examination). Add these to the description of the measurement instrument in column two:Direct - Assessing student performance by examining samples of student workFormative – An assessment conducted during the student’s education.Summative – An assessment conducted at the end of the student’s education.Internal – An assessment instrument that was developed within the business unit.External – An assessment instrument that was developed outside the business unit.Comparative – Compare results between classes, between online and on ground classes, Between professors, between programs, between campuses, or compare to external results such as results from the U.S. Department of Education Research and Statistics, or results from a vendor providing comparable data.
Analysis of Results
2. Identify materials required to achieve the desired construction project quality.
3. Discover ethical, socially responsible, and global issues related to construction management.
4. Apply legal considerations in construction work.
2
Construct and present a Project Plan. Type of instrument: Direct.
Final grades averaged on Project Plan was 95.4%.
Students are learning during the respective courses. Our instructors are doing a very good job of teaching.
Since the scores were good, we will continue to do what we have been doing. There is not an apparent need that requires changing from our current practivce.
Final Exam. Type of instrument: Direct.
Final exam grades averages 79%. Students are learning during the respective courses. Our instructors are doing a very good job of teaching.
Since the scores were good, we will continue to do what we have been doing. There is not an apparent need that requires changing from our current practivce.
7. Examine the orientation and enforcement of the construction trades sub-parts of the Occupational Safety and Health Act.
Final Exam. Type of instrument: Direct.
Final grades averages 79%. Students are learning during the respective courses. Our instructors are doing a very good job of teaching.
Since the scores were good, we will continue to do what we have been doing. There is not an apparent need that requires changing from our current practivce.
6. Demonstrate an understanding of effective team building, techniques of control, data requirements, and time management.
5. Demonstrate effective written, oral, and presentation communication skills in a construction environment.

1
Performance Indicator
Performance Measure What is your measurement instrument or process?
Current Results Analysis of Results Action Taken or Improvement made
Insert Graphs or Tables of Resulting Trends (3-5 data points preferred)
Measurable goal What are your current results?
What did you learn from the results?
What did you improve or what is your next step?
What is your goal?
Analysis on student perceptions and student satifcation. Goal is to understand the underlying influences on student perceptions and student satifisaction.
IDEA Survey Results at the Program LevelNote: Trend data will not be available until additional surveys are administered.
Results were over a solid score of 4, but were down compared to last year.
As students began taking course online, the student's responses were not as positive as responses from students when the courses were mainly f2f. The courses and the teachers have remained the same, but students prefer f2f teaching and the results bare this out.
The perception is online is not as effective as f2f, so I would expect the results to level off as all courses have been converted to online. However, with more experience in teaching online, I would expect the results to be slightly better.
Analysis of Results
Indirect assessments measure student achievement of program by looking at attitudes. Examples of a indirect assessment may include: Student Opinion of Teaching Survey Results (IDEA) at the Program LevelSurveys of Instructors Teaching Courses in the Program
DefinitionStandard #4 Indirect Assessments Measurement

Corporate Financial
Management

1
Performance Indicator1. Student Learning Results
Performance Measure What is your measurement instrument or process? Current Results Analysis of Results Action Taken or Improvement made Insert Graphs or Tables of Resulting Trends (3-5 data points preferred)
Measurable goal Do not use grades. What are your current results? What did you learn from the results? What did you improve or what is your next step?
What is your goal? (Indicate type of instrument) direct, formative, internal, comparative
Our goal is achieve a 50th average percentile rank on all MFT all performace areas. Peregrine's MFT assessment, Summative external data
The MFT result shows that 14 Financal Management Majors have achieved the program goal of 71% average percentile rank in all MFT performance, which is higher than the required 50% percentile.
This is the first year we collect performance data for this new program. More data will be collected in future years to be used for trend analysis.
We have two degree programs in Finance area, incluing Managerial Finance track and Financial Planning Track. The Finance Planning Track has received the approval from the CFP Board Registration in May 2018. We anticipate this Finance Planning track will attrack more students in the coming terms.
Our goal is achieve a score of 50 or above on all MFT performace areas, and to continually improve our scores. Peregrine's MFT assessment, Summative external data
The Finance majors performance on MFT by topic achieved the goal of 50% or above for all MFT performance areas except for Economics: Microeconomics that scored 1% less than the 50% goal.
Business Integration, Business Leadership, Information Mangement System, Legal Environment of Business, and Marketing are the hightest (above 70%) among all categories. However, the lowest perfomance are Economics: Microeconomics (49%) andthe Quantitative Research Techniques which is around 52%.
The improvement in teaching Business Finance, students retention, and maintain high IDEA survey areas can conntinue improving the results.
Our goal is achieve a a score of 50 or above on all Business Finance areas, and to continually improve our scores. Peregrine's MFT assessment, Summative external data
Financal Management majors show that business finance topic score is 67%.
This is the first year we collect performance data for this new program. More data will be collected in future years to be used for trend analysis.
Will continue the focus to enhance the business finance area for Finance majors for the coming year.
Standard #4 Measurement and Analysis of Student Learning and PerformanceUse this table to supply data for Criterion 4.2.
DefinitionA student learning outcome is one that measures a specific competency attainment. Examples of a direct assessment (evidence) of student learning attainment that might be used include: capstone performance, third-party examination, faculty-designed examination, professional performance, licensure examination). Add these to the description of the measurement instrument in column two:Direct - Assessing student performance by examining samples of student workFormative – An assessment conducted during the student’s education.Summative – An assessment conducted at the end of the student’s education.Internal – An assessment instrument that was developed within the business unit.External – An assessment instrument that was developed outside the business unit.Comparative – Compare results between classes, between online and on ground classes, Between professors, between programs, between campuses, or compare to external results such as results from the U.S. Department of Education Research and Statistics, or results from a vendor providing comparable data.
Analysis of Results
1
Performance Indicator
Performance Measure What is your measurement instrument or process?
Current Results Analysis of Results Action Taken or Improvement made
Insert Graphs or Tables of Resulting Trends (3-5 data points preferred)
Measurable goal What are your current results?
What did you learn from the results?
What did you improve or what is your next step?
What is your goal?
Analysis on adjunct faculty satisfaction. Goal is to understand the level of faculty satisfaction at the program level.
Adjunct Faculty Satification SurveyPercentage is based on the number of adjunct faculty members providing survey feedback in the program. *Program/School of Business AY1920 Comparison
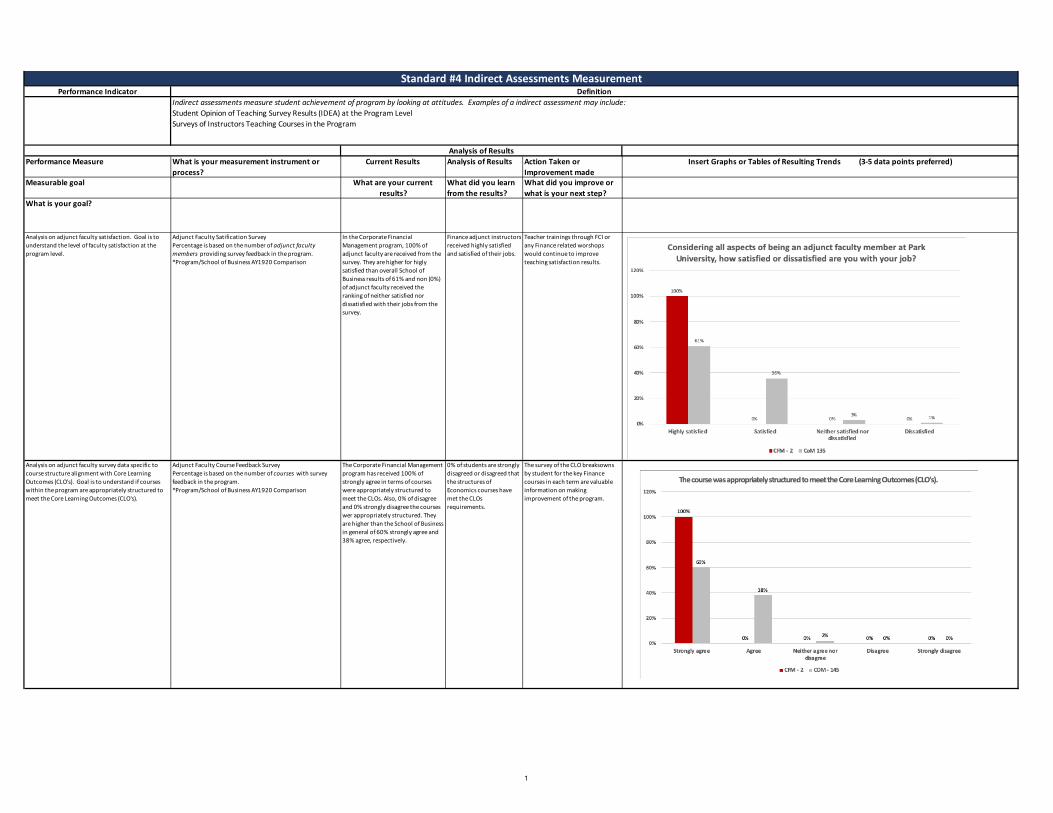
In the Corporate Financial Management program, 100% of adjunct faculty are received from the survey. They are higher for higly satisfied than overall School of Business results of 61% and non (0%) of adjunct faculty received the ranking of neither satisfied nor dissatisfied with their jobs from the survey.
Finance adjunct instructors received highly satisfied and satisfied of their jobs.
Teacher trainings through FCI or any Finance related worshops would continue to improve teaching satisfaction results.
Analysis on adjunct faculty survey data specific to course structure alignment with Core Learning Outcomes (CLO's). Goal is to understand if courses within the program are appropriately structured to meet the Core Learning Outcomes (CLO's).
Adjunct Faculty Course Feedback Survey Percentage is based on the number of courses with survey feedback in the program. *Program/School of Business AY1920 Comparison
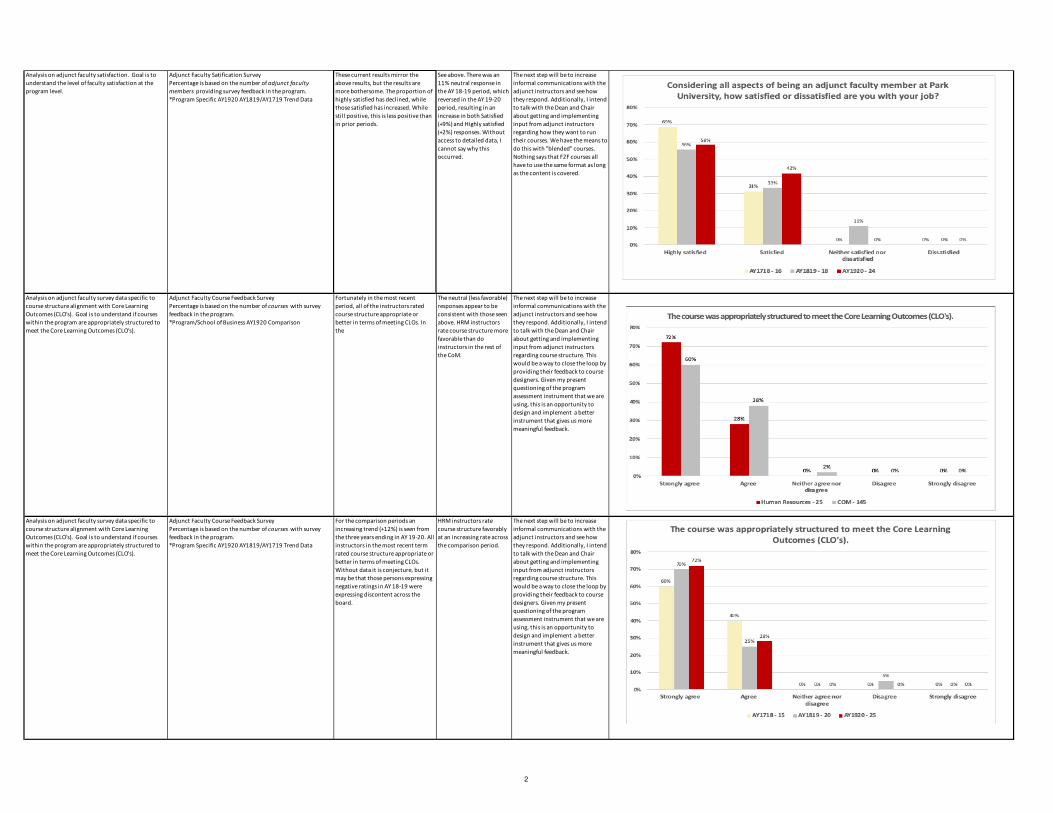
The Corporate Financial Management program has received 100% of strongly agree in terms of courses were appropriately structured to meet the CLOs. Also, 0% of disagree and 0% strongly disagree the courses wer appropriately structured. They are higher than the School of Business in general of 60% strongly agree and 38% agree, respectively.
0% of students are strongly disagreed or disagreed that the structures of Economics courses have met the CLOs requirements.
The survey of the CLO breaksowns by student for the key Finance courses in each term are valuable information on making improvement of the program.
Analysis of Results
Indirect assessments measure student achievement of program by looking at attitudes. Examples of a indirect assessment may include: Student Opinion of Teaching Survey Results (IDEA) at the Program LevelSurveys of Instructors Teaching Courses in the Program
DefinitionStandard #4 Indirect Assessments Measurement

Healthcare Management

1
Performance Indicator1. Student Learning Results
Performance Measure What is your measurement instrument or process? Current Results Analysis of Results Action Taken or Improvement made Insert Graphs or Tables of Resulting Trends (3-5 data points preferred)
Measurable goal Do not use grades. What are your current results? What did you learn from the results? What did you improve or what is your next step?
What is your goal? (Indicate type of instrument) direct, formative, internal, comparativeOur goal is achieve a 60th average percentile rank on all Peregrine Major Fifled Test (MFT) performace areas.
Peregrine's MFT assessment, Summative external data We came close to our goal of achieving a 60th average percentile on all MFT performance areas. We see an increase by 6% from the previous year AY18-19 to AY19-20.
These results indicate the BSM program with concentration in Health Care graduates' results on the Peregrine MFT test that they take in their capstone course, which is the last course in the program, and it is a general management course, not one of HC courses. This means that the MFT results for AY18-19 capture the data for the graduates who took the HC courses in the old format, with the old content, before the course redevelopment. All completely redevelopmed HC courses were launched in Spring 1 term of 2019. The MFT results for AY19-20 capture the data for the graduates who took the HC courses in the new format with team projects.
All eight HC courses were just recently completely redeveloped and launched in Spring 1, 2019. It is not surprizing that the student the students did better on the MFT test this year. We begin seeing increase and getting close to meeting a 60th average percentile. Perhaps, since the BSM-HC students take a general business major Peregrine MFT, it is probably not a fair assessment for the health care managment students. I would recommend shfting to the healthcare management MFT, instead of the business one. Relook at the Peregrine exam itself to see if the BSM-HC students can take the Peregrine test for undergradaute healthcare managment major. Keep monitoring the results.
Our goal is achieve a score of 60 or above on all MFT performace areas, and to continually improve our scores.
Peregrine's MFT assessment, Summative external data The MFT results for the accounting area, business ethics, business leadership, legal environment of business, and organizational behavior look good; business intergration and strategic management, information management systems, human resources management, marketing, and quantitative research and statistics - stand out; business finance, economics, macroeconomics, and global dimentions of business - seem to be a challenge; microeconomics - improved a bit and getting closer to goal of a score of 60. However, management of operation/production dropped significantly comparing to the last year.
Overall MFT scores have been improving over the years. The areas of economics still need more attention - economics and macroeconomic are lower than other areas. Another problematic area emerged this year - management of operation/production. Business intergration and strategic management, human resources management, marketing, and quantitative research and statistics areas are now higher than they've ever been since AY13-14.
All HC were redeveloped and launched in Spring 1, 2019. There was an effort to ensure healthcare finance, economics, marketing, legal and ethical issues, and quantitative reasoning concepts are covered in multiple courses where the inclusion of this content makes sense. There was also an effort to create absolutely all assignment to be practical with specific business-type of deliverables: all discussion are based on mini-cases, all homework application assignments are case studies, and the team project assignments are also practical case studies. Also, exams and quizzes were eliminated. Instead the team project deliverables are used for assessment of the development of the competencies. This approach resulted in the increase of the overall MFT scores. However, will look at the Peregrine data to see what exactly in Economics and Management Operations/Production the students are missing. Let the Program Coordinators, who oversee these areas know what the results are, so that the Economics and Management Operations/Production courses can be improved accordingly
Standard #4 Measurement and Analysis of Student Learning and PerformanceUse this table to supply data for Criterion 4.2.
DefinitionA student learning outcome is one that measures a specific competency attainment. Examples of a direct assessment (evidence) of student learning attainment that might be used include: capstone performance, third-party examination, faculty-designed examination, professional performance, licensure examination). Add these to the description of the measurement instrument in column two:Direct - Assessing student performance by examining samples of student workFormative – An assessment conducted during the student’s education.Summative – An assessment conducted at the end of the student’s education.Internal – An assessment instrument that was developed within the business unit.External – An assessment instrument that was developed outside the business unit.Comparative – Compare results between classes, between online and on ground classes, Between professors, between programs, between campuses, or compare to external results such as results from the U.S. Department of Education Research and Statistics, or results from a vendor providing comparable data.
Analysis of Results

1
Performance Indicator
Performance Measure What is your measurement instrument or process?
Current Results Analysis of Results Action Taken or Improvement made
Insert Graphs or Tables of Resulting Trends (3-5 data points preferred)
Measurable goal What are your current results? What did you learn from the results? What did you improve or what is your next step?
What is your goal?
Analysis on student perceptions and student satifcation. Goal is to understand the underlying influences on student perceptions and student satifisaction.
IDEA Survey Results at the Program LevelNote: Trend data will not be available until additional surveys are administered.
The undergradaute HC courses faculty rank in average 4.2 level on a 5.0 scale as excellent faculty on the IDEA student opinion of teaching survey. Overall, the current year scores for excellent teacher and excellent course are consistent with the SoB All and IDEA All. Comparing to the previous AY18/19, the HC courses faculty scores increased by 0.38 for excellent teacher, by 0.5 for excellent course, and by 0.445 on average.
Beginning Spring 1 2019 term, all eight HC courses were launched after complete redevelopment. When we change the standardised course structure format, increasing the rigor, the IDEA scores are expected to drop, and they did as we see in the previous year AY18/19 results. The rigor of the HC courses is higher; there are practical cases in discussions and application assignments; there is a sinchronous component added with weekly team meetings recordings that the students had never done before. We have seen the IDEA results drop before when we implemented this change in the MHA program in Summer 2016. Once the students got used to the new course structure and got comfortable with it and began to like it; then the IDEA results in the MHA program went up accordingly. It appears that the IDEA results for the undergraduate HC courses begin increasing this year AY19/20.
The results are normal and expected. We see the beginning of improving of the scores in AY19/20. Beginning Spring 1 term of 2019, we implemented tactical strategy to increase the student response rate to the IDEA assessment survey by offering 5 bonus points to each student in class if 100% of the class complete the IDEA survey (the same strategy that has been proven to be effective in the MHA program). As a result, the average student reponse rate to the SOTS (IDEA) survey went up from 47% to 79%. Continue the same strategy to maintain high student response rate and keep monitoring the results.
Analysis on adjunct faculty satisfaction. Goal is to understand the level of faculty satisfaction at the program level.
Adjunct Faculty Satification SurveyPercentage is based on the number of adjunct faculty members providing survey feedback in the program. *Program/School of Business AY1920 Comparison
The sample includes only 2 adjunct faculty members responses. These two faculty members are satisfied with their job.
Having the results from only two survey participants is not overly useful.
Implement strategies to encourage the adjunct faculty members to participate in the survey in order to increase the reponse rate.
Analysis of Results
Indirect assessments measure student achievement of program by looking at attitudes. Examples of a indirect assessment may include: Student Opinion of Teaching Survey Results (IDEA) at the Program LevelSurveys of Instructors Teaching Courses in the Program
DefinitionStandard #4 Indirect Assessments Measurement

2
Analysis on adjunct faculty satisfaction. Goal is to understand the level of faculty satisfaction at the program level.
Adjunct Faculty Satification SurveyPercentage is based on the number of adjunct faculty members providing survey feedback in the program. *Program Specific AY1920 AY1819/AY1719 Trend Data
The sample includes only 2 adjunct faculty members responses. These two faculty members are satisfied with their job.
Having the results from only two survey participants is not overly useful.
Implement strategies to encourage the adjunct faculty members to participate in the survey in order to increase the reponse rate.
Analysis on adjunct faculty survey data specific to course structure alignment with Core Learning Outcomes (CLO's). Goal is to understand if courses within the program are appropriately structured to meet the Core Learning Outcomes (CLO's).
Adjunct Faculty Course Feedback Survey Percentage is based on the number of courses with survey feedback in the program. *Program/School of Business AY1920 Comparison
One faculty member who reponded to the survey strongly agree and one faculty member agree that the course was appropriately structured to meet the CLOs.
Only 2 survey participants, who are strongly agree and agree. Good for the newly implemented course structure.
We will continue monitoring. Implement strategies to encourage the adjunct faculty members to participate in the survey in order to increase the reponse rate.
Analysis on adjunct faculty survey data specific to course structure alignment with Core Learning Outcomes (CLO's). Goal is to understand if courses within the program are appropriately structured to meet the Core Learning Outcomes (CLO's).
Adjunct Faculty Course Feedback Survey Percentage is based on the number of courses with survey feedback in the program. *Program Specific AY1920 AY1819/AY1719 Trend Data
One faculty member who reponded to the survey strongly agree and one faculty member agree that the course was appropriately structured to meet the CLOs.
Only 2 survey participants, who are strongly agree and agree. Good for the newly implemented course structure.
We will continue monitoring. Implement strategies to encourage the adjunct faculty members to participate in the survey in order to increase the reponse rate.

Human Resources

1
Performance Indicator
Performance Measure What is your measurement instrument or process?
Current Results Analysis of Results Action Taken or Improvement made
Insert Graphs or Tables of Resulting Trends (3-5 data points preferred)
Measurable goal What are your current results?
What did you learn from the results?
What did you improve or what is your next step?
What is your goal?
Analysis on student perceptions and student satifcation. Goal is to understand the underlying influences on student perceptions and student satifisaction.
IDEA Survey Results at the Program LevelNote: Trend data will not be available until additional surveys are administered.
Current results are that summative scores for HRM instructors and courses are above the summative scores for both the SoB and the aggregated IDEA data.
That the results, while above comparison scores are downsloping, which is a cause for concern.
My recommendation is to examine the data for all instructors and courses for the last three years to determine the causes of the declines in rating. Further, I recommend that we provide incentives to ALL students to fill out IDEA form. If courses are having "small _n_ for feedback, that gives us an inaccurate picture of what is going on, good or bad. It may be necessary to lock Unit 8 in courses until the IDEA form is submitted so that adequate response rates are obtained.
Analysis on adjunct faculty satisfaction. Goal is to understand the level of faculty satisfaction at the program level.
Adjunct Faculty Satification SurveyPercentage is based on the number of adjunct faculty members providing survey feedback in the program. *Program/School of Business AY1920 Comparison
Current results suggest that adjunct faculty are either at least satisfied or better with what they are doing and how they are treated OR they are not willing to say otherwise.
Typically I take a very "hands off" approach with adjunct instructors. While none of the HRM instructors reported downside responses, I could do a better job of touching base with them. There is room for improvement in these responses.
The next step will be to increase informal communications with the adjunct instructors and see how they respond.
Analysis of Results
Indirect assessments measure student achievement of program by looking at attitudes. Examples of a indirect assessment may include: Student Opinion of Teaching Survey Results (IDEA) at the Program LevelSurveys of Instructors Teaching Courses in the Program
DefinitionStandard #4 Indirect Assessments Measurement
2
Analysis on adjunct faculty satisfaction. Goal is to understand the level of faculty satisfaction at the program level.
Adjunct Faculty Satification SurveyPercentage is based on the number of adjunct faculty members providing survey feedback in the program. *Program Specific AY1920 AY1819/AY1719 Trend Data
These current results mirror the above results, but the results are more bothersome. The proportion of highly satisfied has declined, while those satisfied has increased. While still positive, this is less positive than in prior periods.
See above. There was an 11% neutral response in the AY 18-19 period, which reversed in the AY 19-20 period, resulting in an increase in both Satisfied (+9%) and Highly satisfied (+2%) responses. Without access to detailed data, I cannot say why this occurred.
The next step will be to increase informal communications with the adjunct instructors and see how they respond. Additionally, I intend to talk with the Dean and Chair about getting and implementing input from adjunct instructors regarding how they want to run their courses. We have the means to do this with "blended" courses. Nothing says that F2F courses all have to use the same format as long as the content is covered.
Analysis on adjunct faculty survey data specific to course structure alignment with Core Learning Outcomes (CLO's). Goal is to understand if courses within the program are appropriately structured to meet the Core Learning Outcomes (CLO's).
Adjunct Faculty Course Feedback Survey Percentage is based on the number of courses with survey feedback in the program. *Program/School of Business AY1920 Comparison
Fortunately in the most recent period, all of the instructors rated course structure appropriate or better in terms of meeting CLOs. In the
The neutral (less favorable) responses appear to be consistent with those seen above. HRM instructors rate course structure more favorable than do instructors in the rest of the CoM.
The next step will be to increase informal communications with the adjunct instructors and see how they respond. Additionally, I intend to talk with the Dean and Chair about getting and implementing input from adjunct instructors regarding course structure. This would be a way to close the loop by providing their feedback to course designers. Given my present questioning of the program assessment instrument that we are using, this is an opportunity to design and implement a better instrument that gives us more meaningful feedback.
Analysis on adjunct faculty survey data specific to course structure alignment with Core Learning Outcomes (CLO's). Goal is to understand if courses within the program are appropriately structured to meet the Core Learning Outcomes (CLO's).
Adjunct Faculty Course Feedback Survey Percentage is based on the number of courses with survey feedback in the program. *Program Specific AY1920 AY1819/AY1719 Trend Data
For the comparison periods an increasing trend (+12%) is seen from the three years ending in AY 19-20. All instructors in the most recent term rated course structure appropriate or better in terms of meeting CLOs. Without data it is conjecture, but it may be that those persons expressing negative ratings in AY 18-19 were expressing discontent across the board.
HRM instructors rate course structure favorably at an increasing rate across the comparison period.
The next step will be to increase informal communications with the adjunct instructors and see how they respond. Additionally, I intend to talk with the Dean and Chair about getting and implementing input from adjunct instructors regarding course structure. This would be a way to close the loop by providing their feedback to course designers. Given my present questioning of the program assessment instrument that we are using, this is an opportunity to design and implement a better instrument that gives us more meaningful feedback.

1
Performance Indicator
Performance Measure What is your measurement instrument or process?
Current Results Analysis of Results Action Taken or Improvement made
Insert Graphs or Tables of Resulting Trends (3-5 data points preferred)
Measurable goal What are your current results?
What did you learn from the results?
What did you improve or what is your next step?
What is your goal?
Analysis on student perceptions and student satifcation. Goal is to understand the underlying influences on student perceptions and student satifisaction.
IDEA Survey Results at the Program LevelNote: Trend data will not be available until additional surveys are administered.
Current results are that summative scores for HRM instructors and courses are above the summative scores for both the SoB and the aggregated IDEA data.
That the results, while above comparison scores are downsloping, which is a cause for concern.
My recommendation is to examine the data for all instructors and courses for the last three years to determine the causes of the declines in rating. Further, I recommend that we provide incentives to ALL students to fill out IDEA form. If courses are having "small _n_ for feedback, that gives us an inaccurate picture of what is going on, good or bad. It may be necessary to lock Unit 8 in courses until the IDEA form is submitted so that adequate response rates are obtained.
Analysis on adjunct faculty satisfaction. Goal is to understand the level of faculty satisfaction at the program level.
Adjunct Faculty Satification SurveyPercentage is based on the number of adjunct faculty members providing survey feedback in the program. *Program/School of Business AY1920 Comparison
Current results suggest that adjunct faculty are either at least satisfied or better with what they are doing and how they are treated OR they are not willing to say otherwise.
Typically I take a very "hands off" approach with adjunct instructors. While none of the HRM instructors reported downside responses, I could do a better job of touching base with them. There is room for improvement in these responses.
The next step will be to increase informal communications with the adjunct instructors and see how they respond.
Analysis of Results
Indirect assessments measure student achievement of program by looking at attitudes. Examples of a indirect assessment may include: Student Opinion of Teaching Survey Results (IDEA) at the Program LevelSurveys of Instructors Teaching Courses in the Program
DefinitionStandard #4 Indirect Assessments Measurement

2
Analysis on adjunct faculty satisfaction. Goal is to understand the level of faculty satisfaction at the program level.
Adjunct Faculty Satification SurveyPercentage is based on the number of adjunct faculty members providing survey feedback in the program. *Program Specific AY1920 AY1819/AY1719 Trend Data
These current results mirror the above results, but the results are more bothersome. The proportion of highly satisfied has declined, while those satisfied has increased. While still positive, this is less positive than in prior periods.
See above. There was an 11% neutral response in the AY 18-19 period, which reversed in the AY 19-20 period, resulting in an increase in both Satisfied (+9%) and Highly satisfied (+2%) responses. Without access to detailed data, I cannot say why this occurred.
The next step will be to increase informal communications with the adjunct instructors and see how they respond. Additionally, I intend to talk with the Dean and Chair about getting and implementing input from adjunct instructors regarding how they want to run their courses. We have the means to do this with "blended" courses. Nothing says that F2F courses all have to use the same format as long as the content is covered.
Analysis on adjunct faculty survey data specific to course structure alignment with Core Learning Outcomes (CLO's). Goal is to understand if courses within the program are appropriately structured to meet the Core Learning Outcomes (CLO's).
Adjunct Faculty Course Feedback Survey Percentage is based on the number of courses with survey feedback in the program. *Program/School of Business AY1920 Comparison
Fortunately in the most recent period, all of the instructors rated course structure appropriate or better in terms of meeting CLOs. In the
The neutral (less favorable) responses appear to be consistent with those seen above. HRM instructors rate course structure more favorable than do instructors in the rest of the CoM.
The next step will be to increase informal communications with the adjunct instructors and see how they respond. Additionally, I intend to talk with the Dean and Chair about getting and implementing input from adjunct instructors regarding course structure. This would be a way to close the loop by providing their feedback to course designers. Given my present questioning of the program assessment instrument that we are using, this is an opportunity to design and implement a better instrument that gives us more meaningful feedback.
Analysis on adjunct faculty survey data specific to course structure alignment with Core Learning Outcomes (CLO's). Goal is to understand if courses within the program are appropriately structured to meet the Core Learning Outcomes (CLO's).
Adjunct Faculty Course Feedback Survey Percentage is based on the number of courses with survey feedback in the program. *Program Specific AY1920 AY1819/AY1719 Trend Data
For the comparison periods an increasing trend (+12%) is seen from the three years ending in AY 19-20. All instructors in the most recent term rated course structure appropriate or better in terms of meeting CLOs. Without data it is conjecture, but it may be that those persons expressing negative ratings in AY 18-19 were expressing discontent across the board.
HRM instructors rate course structure favorably at an increasing rate across the comparison period.
The next step will be to increase informal communications with the adjunct instructors and see how they respond. Additionally, I intend to talk with the Dean and Chair about getting and implementing input from adjunct instructors regarding course structure. This would be a way to close the loop by providing their feedback to course designers. Given my present questioning of the program assessment instrument that we are using, this is an opportunity to design and implement a better instrument that gives us more meaningful feedback.

International Business

1
Performance Indicator1. Student Learning Results
Performance Measure What is your measurement instrument or process? Current Results Analysis of Results Action Taken or Improvement made Insert Graphs or Tables of Resulting Trends (3-5 data points preferred)
Measurable goal Do not use grades. What are your current results? What did you learn from the results? What did you improve or what is your next step? What is your goal? (Indicate type of instrument) direct, formative, internal, comparativeOur goal is achieve a 50th average percentile rank on all MFT all performace areas.
Peregrine's MFT assessment, Summative external data What questions were you trying to answer this year about student achievement of your program competencies? How did you try to answer those questions (what did you measure?) and what were your results? What questions were you trying to answer this year about student achievement of your program competencies? How did you try to answer those questions (what did you measure?) and what were your results?
(These results could be from direct measures such as gateway, midpoint, capstone courses, comprehensive exams, portfolios, etc. - and indirect measures such as student opinion surveys, faculty surveys, employer feedback, placement rates)
I do an informal survey rather than assignment for points to understand where students are located on the international business continuum. Unless the student is has military experience or is a nontraditional student that may have worked for a company with international department that has involved in IB, or is an international student they have no experience in IB but are eager to learn. We just want to introduce International Business in its most basic forms and seem to do that very well. With what we’ve designed, the course is intentionally challenging because it is mostly new material for the students and the ROW (rest of world) when compared to the United States is somewhat daunting to the students. We try to break down the information and make the class educational and informative. The students typically communicate they’ve learned quite a bit in an enjoyable manner and no pun intended, it has opened up a whole new world of possibilities for them.
International Business students consistantly do well on this exam
From the data provided by the Office of Institutional Effectiveness in your program’s Data Sheet (available through the OIE Data page in Canvas), what data or data trends stand out? What kinds of actions might your interpretation of data suggest taking? Addressed above. Student data should be assed regularly as student perception is critical to all Programs’ continued success. There are several trends that stand out in both student data and data from the present global environment that has been greatly impacted by Covd-19 and the current government administration, which has changed immigration and mobility of foreign-born nationals. The trends that stand out in the student data reflect changes based on government structure laws and immigration. For example, when I started in 2012, over 50% of my classes were made up of international students. The volume of international students enrolled a Park has decreased with the current administration and a lack of mobility for immigrants and international students. The United States is globally recognized as having some of the best schools in the world. Students come from all over to study in the United States. However, student mobility has been greatly impacted recently by Visa issues over the last few years and more recently the Global Pandemic makes entering the United States close to impossible. The mobility issues go both ways as our students are not allowed to study abroad. Recent studies strongly suggest this will change in the future. Also, in the past some students have applicability issues and in the Spring 2020 semester in I experienced and overwhelming number of students saying that learning about global business has been impressively relevant as they are applying it do matters involving the global pandemic and COVID 19. I received numerous comments that because of what happened worldwide the class had much more relevant and application. They were able to apply so many concepts and terms that we learned in class to the current situation. Terms such as supply chain, import. Export, global workforce, country comparisons were in the news daily and this class helped understand it.
If your program completed a comprehensive academic program review in the previous year, please provide an update on your Action Plan.
Our goal is achieve a score of 50 or above on all MFT performace areas, and to continually improve our scores.
Peregrine's MFT assessment, Summative external data What questions were you trying to answer this year about student achievement of your program competencies? How did you try to answer those questions (what did you measure?) and what were your results?
(These results could be from direct measures such as gateway, midpoint, capstone courses, comprehensive exams, portfolios, etc. - and indirect measures such as student opinion surveys, faculty surveys, employer feedback, placement rates)
I do an informal survey rather than assignment for points to understand where students are located on the international business continuum. Unless the student is has military experience or is a nontraditional student that may have worked for a company with international department that has involved in IB, or is an international student they have no experience in IB but are eager to learn. We just want to introduce International Business in its most basic forms and seem to do that very well. With what we’ve designed, the course is intentionally challenging because it is mostly new material for the students and the ROW (rest of world) when compared to the United States is somewhat daunting to the students. We try to break down the information and make the class educational and informative. The students typically communicate they’ve learned quite a bit in an enjoyable manner and no pun intended, it has opened up a whole new world of possibilities for them.
This information will be reflected in my plan of action for the following year as the economic slowdown may allow us additional time to make improvements to our curriculum, nad when international business and travel resumes, we will have fresh new approached. Recent studies have forecasted this trend and firmly state that international business and education will resume in moment in the near future, as the United States maintains its reputation as the home of many premier educational institutions. Business and trend forecasting stated that the current economic situation is temporary and that international enrollment will increase in the future. Right now, what COVID 19 pandemic there are no sports activities or on campus experience so this may be an opportunity for us to develop the program can give it attention with curricular items will be ready for pick up or trending enrollment when that occurs the next year so.
My action plan, due to the shortfall of international students is to try to teach more internationally themes courses in the Management program as I am fully qualified there, and hopefully some of the research will be transferrable. Our comprehensive academic plan is to increase majors and enrollment by offering compelling and relevant material in our International Business classes, by updating courses every 3 years approximately. The CLO’s are standard for international business and based on student feedback they are able to understand and apply the material to real life situations.
Our goal is achieve a a score of 50 or above on all Global Dimensions of Business areas, and to continually improve our scores.
Peregrine's MFT assessment, Summative external data We’ve done everything we’ve set out to do:
PLO 1. Demonstrate an understanding of financial strategic and financal operational aspects of business on an international level.
IB302 - CLO 4: Summarize understanding of business and management practices across cultures. (internal Formative Assessment of Final Paper: Country Culture Project)
The students do extremely well in this seminar class.
Redevelop IB315 and change the assessment instrument again due to Canvas constraints. I like the final exam for assessment because its synthesis material across chapter and is comprehensive. This year we used a random sampling of final exam material. When we redeveloped the course, we were planning to use the export project for assessment rather than the final exam. Our previous learning management system allowed me to pull data by CLO and question. Canvas does not have that functionality. So, we planned to use the export project. Due to the assignment being new to the class, I did not want to use it for assessment until we’d run the assignment a few times to see if it would need changes. The online faculty provided positive feedback, so I ran the assignment in my class a few times to see how it would go as there would be a presentation requirement in a Face to Face class. It seemed to be fine however the rubrics would not stay attached to the assignments in Canvas. I called IT about it and they said maybe the instructors were deleting them. I spoke to my supervisor and received permissions to go back to the final exam, random sampling. Anyway, I went back to the final exam, random sampling until we are able to make sure the rubrics work in every class, every time. I am going to have each instructor check every rubric before class begins so we will be able to pull a report. I know some work is being done on changing rubrics so wonder if that might be an issue. Most students do fine with the Project and they learn the complexities of preparing a product or service for the international environment. It really pulls together everything they learn in class, much like the final.
Standard #4 Measurement and Analysis of Student Learning and PerformanceUse this table to supply data for Criterion 4.2.
DefinitionA student learning outcome is one that measures a specific competency attainment. Examples of a direct assessment (evidence) of student learning attainment that might be used include: capstone performance, third-party examination, faculty-designed examination, professional performance, licensure examination). Add these to the description of the measurement instrument in column two:Direct - Assessing student performance by examining samples of student workFormative – An assessment conducted during the student’s education.Summative – An assessment conducted at the end of the student’s education.Internal – An assessment instrument that was developed within the business unit.External – An assessment instrument that was developed outside the business unit.Comparative – Compare results between classes, between online and on ground classes, Between professors, between programs, between campuses, or compare to external results such as results from the U.S. Department of Education Research and Statistics, or results from a vendor providing comparable data.
Analysis of Results

2
PLO 1. Demonstrate an understanding of financial strategic and financal operational aspects of business on an international level.
IB302 - CLO 6: Estimate how cultural factors motivate international business decisions and communications. (internal Formative Assessment of Final Paper: Country Culture Project)
The students do extremely well in this seminar class.
International Business Culture (IB302) is well liked and students do extremely well
PLO 2. Obtain specialized international business knowledge in the areas of marketing.
CLO 5: Develop understanding of how cultural intelligence can lead to competitive advantage. (internal Formative Assessment of Final Paper: Country Culture Project)
The students do extremely well in this seminar class.
IB431 International Finance is in the process of redevelopment
PLO 3. Analyze cultural and national differences in terms of the impact on conducting business in other regions or countries.
IB302 - CLO 1: Assess the major dimensions of culture relevant to global business activities. (internal Formative Assessment of Final Paper: Country Culture Project)
The students do extremely well in this seminar class.
IB302 International Business Culture is in the process of redevelopment.
PLO 3. Analyze cultural and national differences in terms of the impact on conducting business in other regions or countries.
IB302 - CLO 2: Incorporate relevant cultural factors to global business situations.
The students do extremely well in this seminar class.
MK395 was redeveloped 2 years ago.
PLO 3. Analyze cultural and national differences in terms of the impact on conducting business in other regions or countries.
IB302 - CLO 3: Compare various theories and models of culture. (internal Formative Assessment of Final Paper: Country Culture Project)
The students do extremely well in this seminar class.
IB315 was redeveloped 2 years ago.

1
Performance Indicator Definition
Indirect assessments measure student achievement of program by looking at attitudes. Examples of a indirect assessment may include: Student Opinion of Teaching Survey Results (IDEA) at the Program LevelSurveys of Instructors Teaching Courses in the Program
Analysis of Results
Performance Measure What is your measurement instrument or process? What questions were you trying to answer this year about student achievement of your program competencies? How did you
Current Results Analysis of Results Action Taken or Improvement made Insert Graphs or Tables of Resulting Trends (3-5 data points preferred)
Measurable goal students feedback on relevance of course material What are your current results? What did you learn from the results? What did you improve or what is your next step?
What is your goal? Build enrollment, provide the full college learning experience through the material in the classes
excellent students are facinated by cultures other than their own we are redeveloping the course-keeping most of the assignments
Analysis on student perceptions and student satifcation. Goal is to understand the underlying influences on student perceptions and student satifisaction.
IDEA Survey Results at the Program LevelNote: Trend data will not be available until additional surveys are administered.
Student perception and satisfaction were mixed.This is expected for several reasons. From the data provided by the Office of Institutional Effectiveness in your program’s Data Sheet (available through the OIE Data page in Canvas), what data or data trends stand out? What kinds of actions might your interpretation of data suggest taking? Addressed above. Student data should be assed regularly as student perception is critical to all Programs’ continued success. There are several trends that stand out in both student data and data from the present global environment that has been greatly impacted by Covd-19 and the current government administration, which has changed immigration and mobility of foreign-born nationals. The trends that stand out in the student data reflect changes based on government structure laws and immigration. For example, when I started in 2012, over 50% of my classes were made up of international students. The volume of international students enrolled a Park has decreased with the current administration and a lack of mobility for immigrants and international students. The United States is globally recognized as having some of the best schools in the world. Students come from all over to study in the United States. However, student mobility has been greatly impacted recently by Visa issues over the last few
The interpretation of the data was unsurprising. Our program is carefully designed for maximizing the student learning experience. If problems come up, they are addressed. This might be due to the fact that I teach sections of the class every semester and make sure students understand that providing and receiving feedback is a professional skill and well as an academic one. Business Professors not only need a graduate degree, and most institutions also require professional experience. The theory behind this is to ensure that the students not only learn the academic materials but that there is practical real-life application. I am not saying other degrees do not provide this, but most business professors automatically link these for the students. A great example of this is our Current Events assignments which the students were extremely enthuastic about. We’ve tried it in classes before, but the way the newest version assignment is designed, it really flows well-connects to the CLO’s, other assignments and exams. The format we selected for the assignment criteria automatically provides real life application and examples. We might consider adding additional phases of the assignment.
In general, enrollment and curricular changes are reviewed in relation to Program Mission, Vision, Goals and Competencies at the program level. We also benchmark using other Business School and Institutional criteria and of course outside sources. I also benchmark curriculum as needed and this is updated constantly in relation to market demands, job, and skills projection at a national and global level to determine changes to instructional approach. We are always willing to look at this as needed-especially if the same problem comes up with teaching pedagogy, faculty development/training efforts and
Analysis on adjunct faculty satisfaction. Goal is to understand the level of faculty satisfaction at the program level.
Adjunct Faculty Satification SurveyPercentage is based on the number of adjunct faculty members providing survey feedback in the program. *Program/School of Business AY1920 Comparison
The interpretation of the data was unsurprising. Our program is carefully designed for maximizing the student learning experience. If problems come up, they are addressed. This might be due to the fact that I teach sections of the class every semester and make sure students understand that providing and receiving feedback is a professional skill and well as an academic one. Business Professors not only need a graduate degree, and most institutions also require professional experience. The theory behind this is to ensure that the students not only learn the academic materials but that there is practical real-life application. I am not saying other degrees do not provide this, but most business professors automatically link these for the students. A great example of this is our Current Events assignments which the students were extremely enthuastic about. We’ve tried it in classes before, but the way the newest version assignment is designed, it really flows well-connects to the CLO’s, other assignments and exams. The format we selected for the assignment criteria automatically provides real life application and examples. We might consider adding additional phases of the assignment.
revisions to program competencies. The CoM is committed to presenting current and historic background and analysis to Gllobal Business.
Standard #4 Indirect Assessments Measurement

2
Analysis on adjunct faculty satisfaction. Goal is to understand the level of faculty satisfaction at the program level.
Adjunct Faculty Satification SurveyPercentage is based on the number of adjunct faculty members providing survey feedback in the program. *Program Specific AY1920 AY1819/AY1719 Trend Data
If your program completed a comprehensive academic program review in the previous year, please provide an update on your Action Plan.
Analysis on adjunct faculty survey data specific to course structure alignment with Core Learning Outcomes (CLO's). Goal is to understand if courses within the program are appropriately structured to meet the Core Learning Outcomes (CLO's).
Adjunct Faculty Course Feedback Survey Percentage is based on the number of courses with survey feedback in the program. *Program/School of Business AY1920 Comparison
My action plan, due to the shortfall of international students is to try to teach more internationally themes courses in the Management program as I am fully qualified there, and hopefully some of the research will be transferrable. Our comprehensive academic plan is to increase majors and enrollment by offering compelling and relevant material in our International Business classes, by updating courses every 3 years approximately. The CLO’s are standard for international business and based on student feedback they are able to understand and apply the material to real life situations.
Analysis on adjunct faculty survey data specific to course structure alignment with Core Learning Outcomes (CLO's). Goal is to understand if courses within the program are appropriately structured to meet the Core Learning Outcomes (CLO's).
Adjunct Faculty Course Feedback Survey Percentage is based on the number of courses with survey feedback in the program. *Program Specific AY1920 AY1819/AY1719 Trend Data
We’ve done everything we’ve set out to do:

Logistics

1
Performance Indicator1. Student Learning Results
Performance Measure What is your measurement instrument or process? Current Results Analysis of Results Action Taken or Improvement made Insert Graphs or Tables of Resulting Trends (3-5 data points preferred)
Measurable goal Do not use grades. What are your current results? What did you learn from the results? What did you improve or what is your next step? What is your goal? (Indicate type of instrument) direct, formative, internal, comparativeOur goal is achieve a 50th average percentile rank on all MFT all performace areas.
Peregrine's MFT assessment, Summative external data steady performance solid program emphasis on real world logistics issues and globalization --- giving students better feedback on assignements. Better use of excel spreadsheets.
Our goal is achieve a score of 50 or above on all MFT performace areas, and to continually improve our scores.
Peregrine's MFT assessment, Summative external data solid perfomance weakness in quantitative reaearch and statistics and economics
spend more time on statistics and economics principes - utilize society of logistics engineers material for further assessment.
Our goal is achieve a a score of 50 or above on all Accounting Subject areas, and to continually improve our scores.
Peregrine's MFT assessment, Summative external data
Standard #4 Measurement and Analysis of Student Learning and PerformanceUse this table to supply data for Criterion 4.2.
DefinitionA student learning outcome is one that measures a specific competency attainment. Examples of a direct assessment (evidence) of student learning attainment that might be used include: capstone performance, third-party examination, faculty-designed examination, professional performance, licensure examination). Add these to the description of the measurement instrument in column two:Direct - Assessing student performance by examining samples of student workFormative – An assessment conducted during the student’s education.Summative – An assessment conducted at the end of the student’s education.Internal – An assessment instrument that was developed within the business unit.External – An assessment instrument that was developed outside the business unit.Comparative – Compare results between classes, between online and on ground classes, Between professors, between programs, between campuses, or compare to external results such as results from the U.S. Department of Education Research and Statistics, or results from a vendor providing comparable data.
STED

1
Performance Indicator Definition
Analysis of ResultsPerformance Measure What is your measurement instrument or
process? Current Results Analysis of Results Action Taken or
Improvement made Insert Graphs or Tables of Resulting Trends (3-5 data points preferred)
Measurable goal What are your current results?
What did you learn from the results?
What did you improve or what is your next step?
What is your goal?
Analysis on student perceptions and student satifcation. Goal is to understand the underlying influences on student perceptions and student satifisaction.
IDEA Survey Results at the Program LevelNote: Trend data will not be available until additional surveys are administered.
SOLID PERFORMANCE SOLID PERFORMANCE imrove timely feedback to students, introduce more opportunities for students to relate the amteril to their own experiences
Analysis on adjunct faculty satisfaction. Goal is to understand the level of faculty satisfaction at the program level.
Adjunct Faculty Satification SurveyPercentage is based on the number of adjunct faculty members providing survey feedback in the program. *Program/School of Business AY1920 Comparison
EXCELLENT TEACHERS
EXCELLENT TEACHERS
Indirect assessments measure student achievement of program by looking at attitudes. Examples of a indirect assessment may include: Student Opinion of Teaching Survey Results (IDEA) at the Program LevelSurveys of Instructors Teaching Courses in the Program
Standard #4 Indirect Assessments Measurement

2
Analysis on adjunct faculty satisfaction. Goal is to understand the level of faculty satisfaction at the program level.
Adjunct Faculty Satification SurveyPercentage is based on the number of adjunct faculty members providing survey feedback in the program. *Program Specific AY1920 AY1819/AY1719 Trend Data
EXCELLENT TEACHERS
EXCELLENT TEACHERS
Analysis on adjunct faculty survey data specific to course structure alignment with Core Learning Outcomes (CLO's). Goal is to understand if courses within the program are appropriately structured to meet the Core Learning Outcomes (CLO's).
Adjunct Faculty Course Feedback Survey Percentage is based on the number of courses with survey feedback in the program. *Program/School of Business AY1920 Comparison
STRUCTURE IS GOOD MAINTAIN STRUCTURE MAINTAIN STRUCTURE

3
Analysis on adjunct faculty survey data specific to course structure alignment with Core Learning Outcomes (CLO's). Goal is to understand if courses within the program are appropriately structured to meet the Core Learning Outcomes (CLO's).
Adjunct Faculty Course Feedback Survey Percentage is based on the number of courses with survey feedback in the program. *Program Specific AY1920 AY1819/AY1719 Trend Data
STRUCTURE IS GOOD MAINTAIN STRUCTURE MAINTAIN STRUCTURE

Management

1
Performance Indicator1. Student Learning Results
Performance Measure What is your measurement instrument or process? Current Results Analysis of Results Action Taken or Improvement made Insert Graphs or Tables of Resulting Trends (3-5 data points preferred)
Measurable goal Do not use grades. What are your current results? What did you learn from the results? What did you improve or what is your next step? What is your goal? (Indicate type of instrument) direct, formative, internal, comparativeOur goal is achieve a 50th average percentile rank on all MFT all performace areas. Program Goal 1 - Management Competency: Demonstrate an understanding of the interrelationships and interdependencies among the marketing, finance, operations, administration, and management functional systems of a business.
Peregrine's MFT assessment, Summative external data. External data derived from Peregrine Exam results.
Internal Data derived from MG 495 Live Team Case Analysis. CLO 2 (Demonstrate an understanding of management terminology, principles, and concepts) and CLO 4 (Demonstrate an understanding of the interrelationships and interdependencies among the marketing, finance, operations, administration, and management functional systems of a business). Data Formative Assessment: Internal Data derived from MG 371 Comprehensive Case Analysis - includes written communication rubric and oral presentation rubric. CLO 1 (Assessment of the use of each of the management process components - planning, organizing, leading, and controlling) and CLO 4 (Evaluaion of management practices within a domestic environment versus those within a global environment).
The MTF Average Percentile Rank by AY shows an increase from AY 18-19 to AY 19-20. Management majors performed at the goal of 50th average percentile rank. Management Subject Score Comparisons that performed at or above ACBSP Average in the area of management competency are as follows: Business Leadership, Legal Environments of Business, Management, Management Operations / Production, Management Organizational Behavior, and Management Human Resources. The results for CLO 2 and CLO 4 for the summative assessment increased for the Spring terms. There was a decrease in learning for the formative assessment data during the year
The results indicate that it will be important to continue the current assessment process for this year. There is also an indication that it is necessary to review those areas that are not meeting the goals and to keep areas performing above the goals on track.
Plan to review and modify the current assessment instrument when needed in order to address management competency.
Our goal is achieve a score of 50 or above on all MFT performace areas, and to continually improve our scores. Program Goal 2 - Problem Solving: Apply critical and creative thinking for effective problem solving, decision-making, and planning on local, regional, and global organizational issues
Peregrine's MFT assessment, Summative external data. Summative Assessment: External data derived from Peregrine Exam results.
Formative Assessment: Internal Data derived from MG 371 Comprehensive Case Analysis. CLO 1 (Assessment of the use of each of the management process components - planning, organizing, leading, and controlling). CLO 3 (Critique of the methods selected and applied to motivate followers to achieve organizational goals). CLO 4 (Evaluation of management practices within a domestic environment versus those within a global environment). CLO 5 (Evaluation of outcomes of management practices based upon their inclusion of ethics and social responsibility).
Management Subject Score Comparisons that performed at or above 50 in the area of problem solving are as follows: 1) Business Integration and Strategy, 2) Legal Environments of Business, 3) Management, 4) Management Organizational Behavior, 5) Management Productions/Operations, and 6) Quantitative Research Techniques. In the formative assessment there was a consistent increase in the results for all but the CLO 4 data.
The results indicate that it will be important to continue the current assessment process for this year. There is also an indication that it is necessary to review those areas that are not meeting the goals and to keep areas performing above the goals on track.
Plan to review and modify the current assessment instrument when needed in order to address management competency.
Our goal is achieve a a score of 50 or above on all Management areas, and to continually improve our scores. Program Goal 3 - Globalization: Explain globalization and its impact on business and society.
Peregrine's MFT assessment, Summative external data. Summative Assessment: External data derived from Peregrine Exam results.
Formative Assessment: Internal Data derived from MG 371 Comprehensive Case Analysis. CLO 4 (Evaluation of management practices within a domestic environment versus those within a global environment). CLO 5 (Evaluation of outcomes of management practices based upon their inclusion of ethics and social responsibilities
Global Dimensions of Business results increased his year from Fall 2019 in the Peregrine Exam results. In the formative assessment the data for CLO 4 was lower than previous terms in the Fall and higher than previous terms in the Spring. The data for CLO 5 was consistently higher than the previous year except for Spring I.
The results indicate that it will be important to continue the current assessment process for this year. There is also an indication that it is necessary to review those areas that are not meeting the goals and to keep areas performing above the goals on track.
Plan to review and modify the current assessment instrument when needed in order to address management competency.
Standard #4 Measurement and Analysis of Student Learning and Performance
Definition
Analysis of Results
Use this table to supply data for Criterion 4.2.
A student learning outcome is one that measures a specific competency attainment. Examples of a direct assessment (evidence) of student learning attainment that might be used include: capstone performance, third-party examination, faculty-designed examination, professional performance, licensure examination). Add these to the description of the measurement instrument in column two:Direct - Assessing student performance by examining samples of student workFormative – An assessment conducted during the student’s education.Summative – An assessment conducted at the end of the student’s education.Internal – An assessment instrument that was developed within the business unit.External – An assessment instrument that was developed outside the business unit.Comparative – Compare results between classes, between online and on ground classes, Between professors, between programs, between campuses, or compare to external results such as results from the U.S. Department of Education Research and Statistics, or results from a vendor providing comparable data.
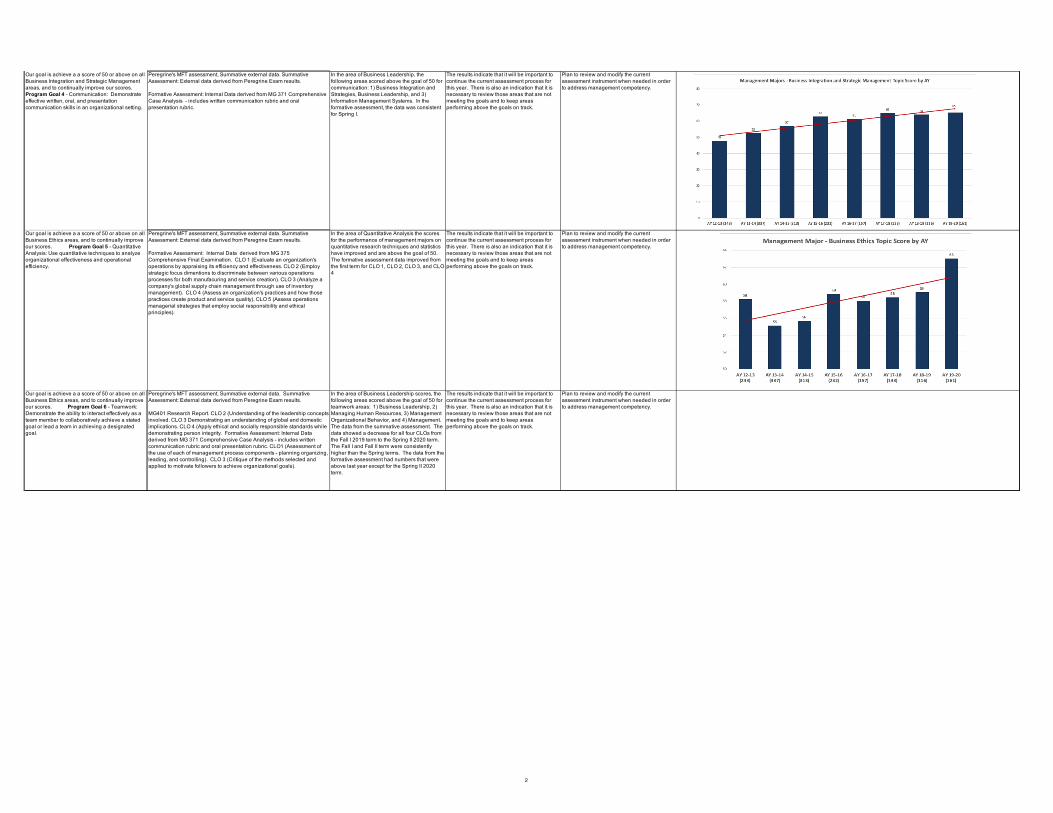
2
Our goal is achieve a a score of 50 or above on all Business Integration and Strategic Management areas, and to continually improve our scores. Program Goal 4 - Communication: Demonstrate effective written, oral, and presentation communication skills in an organizational setting.
Peregrine's MFT assessment, Summative external data. Summative Assessment: External data derived from Peregrine Exam results.
Formative Assessment: Internal Data derived from MG 371 Comprehensive Case Analysis - includes written communication rubric and oral presentation rubric.
In the area of Business Leadership, the following areas scored above the goal of 50 for communication: 1) Business Integration and Strategies, Business Leadership, and 3) Information Management Systems. In the formative assessment, the data was consistent for Spring I.
The results indicate that it will be important to continue the current assessment process for this year. There is also an indication that it is necessary to review those areas that are not meeting the goals and to keep areas performing above the goals on track.
Plan to review and modify the current assessment instrument when needed in order to address management competency.
Our goal is achieve a a score of 50 or above on all Business Ethics areas, and to continually improve our scores. Program Goal 5 - Quantitative Analysis: Use quantitative techniques to analyze organizational effectiveness and operational efficiency.
Peregrine's MFT assessment, Summative external data. Summative Assessment: External data derived from Peregrine Exam results.
Formative Assessment: Internal Data derived from MG 375 Comprehensive Final Examination. CLO 1 (Evaluate an organization's operations by appraising its efficiency and effectiveness. CLO 2 (Employ strategic focus dimentions to discriminate between various operations processes for both manufacuring and service creation). CLO 3 (Analyze a company's global supply chain management through use of inventory management). CLO 4 (Assess an organization's practices and how those practices create product and service quality). CLO 5 (Assess operations managerial strategies that employ social responsibility and ethical principles).
In the area of Quantitative Analysis the scores for the performance of management majors on quantitative research techniques and statistics have improved and are above the goal of 50. The formative assessment data improved from the first term for CLO 1, CLO 2, CLO 3, and CLO 4
The results indicate that it will be important to continue the current assessment process for this year. There is also an indication that it is necessary to review those areas that are not meeting the goals and to keep areas performing above the goals on track.
Plan to review and modify the current assessment instrument when needed in order to address management competency.
Our goal is achieve a a score of 50 or above on all Business Ethics areas, and to continually improve our scores. Program Goal 6 - Teamwork: Demonstrate the ability to interact effectively as a team member to collaboratively achieve a stated goal or lead a team in achieving a designated goal.
Peregrine's MFT assessment, Summative external data. Summative Assessment: External data derived from Peregrine Exam results.
MG401 Research Report. CLO 2 (Understanding of the leadership concepts involved. CLO 3 Demonstrating an understanding of global and domestic implications. CLO 4 (Apply ethical and socially responsible standards while demonstrating person integrity. Formative Assessment: Internal Data derived from MG 371 Comprehensive Case Analysis - includes written communication rubric and oral presentation rubric. CLO1 (Assessment of the use of each of management process components - planning organizing, leading, and controlling). CLO 3 (Critique of the methods selected and applied to motivate followers to achieve organizational goals).
In the area of Business Leadership scores, the following areas scored above the goal of 50 for teamwork areas: 1) Business Leadership, 2) Managing Human Resources, 3) Management Organizational Behavior, and 4) Management. The data from the summative assessment. The data showed a decrease for all four CLOs from the Fall I 2019 term to the Spring II 2020 term. The Fall I and Fall II term were consistently higher than the Spring terms. The data from the formative assessment had numbers that were above last year except for the Spring II 2020 term.
The results indicate that it will be important to continue the current assessment process for this year. There is also an indication that it is necessary to review those areas that are not meeting the goals and to keep areas performing above the goals on track.
Plan to review and modify the current assessment instrument when needed in order to address management competency.

1
Performance Indicator Definition
Analysis of ResultsPerformance Measure What is your measurement instrument or
process? Current Results Analysis of Results Action Taken or
Improvement made Insert Graphs or Tables of Resulting Trends (3-5 data points preferred)
Measurable goal What are your current results?
What did you learn from the results?
What did you improve or what is your next step?
What is your goal?
Analysis on student perceptions and student satifcation. Goal is to understand the underlying influences on student perceptions and student satifisaction.
IDEA Survey Results at the Program LevelNote: Trend data will not be available until additional surveys are administered.
The results from the IDEA Summative Questions show that the undergraduate management program scored higher than the School of Business and IDEA at 4.60 for excellent teacher, 4.45 for excellent course, and 4.53 for average of the two categories
The PDL training and the instructional designers along with the course developers have created a quality learning environment for the students.
Continue to monitor the development of courses and professional development activities of the faculty teaching undergraduate management courses.
Analysis on adjunct faculty satisfaction. Goal is to understand the level of faculty satisfaction at the program level.
Adjunct Faculty Satification SurveyPercentage is based on the number of adjunct faculty members providing survey feedback in the program. *Program/School of Business AY1920 Comparison
The results from the survey indicate that 96% of the adjunct faculty teaching management courses is either highly satisfied or satisfied with their job. This is the same for the School of Business. There are 4% of the adjunct faculty members teaching management courses indicate that they are neither satisfied or dissatisfied with the job.
The adjuncts teaching management courses are expected to use the Canvas courses in the facilitation of their course material. The management courses are developed so that there is consistency in the delivery of the course material. This also requires that the same textbook is used for course delivery. There have been a very small number of adjunct faculty members that have expressed dissatisfaction with using the Canvas course, which is required by Park policy.
Continue to monitor the adjunct faculty facilitating courses in the management program. Instructors that are struggling with using the Canvas course material will be offered the opportunity for additional training and mentoring.
Indirect assessments measure student achievement of program by looking at attitudes. Examples of a indirect assessment may include: Student Opinion of Teaching Survey Results (IDEA) at the Program LevelSurveys of Instructors Teaching Courses in the Program

2
Analysis on adjunct faculty satisfaction. Goal is to understand the level of faculty satisfaction at the program level.
Adjunct Faculty Satification SurveyPercentage is based on the number of adjunct faculty members providing survey feedback in the program. *Program Specific AY1920 AY1819/AY1719 Trend Data
The results from the survey indicate that for AY1920, 96% of the adjunct faculty teaching courses is either highly satisfied or satisfied with their job. In AY1819, 89% of the adjunct faculty teaching courses is either highly satisfied or satisfied with their job. There were 4% faculty that were neither satisfied or disatisfied with teaching courses in AY1920 compared to 11% in AY1819.
The adjuncts teaching management courses are expected to use the Canvas courses in the facilitation of their course material. The management courses are developed so that there is consistency in the delivery of the course material. This also requires that the same textbook is used for course delivery. There have been a small number of adjunct faculty members that have expressed dissatisfaction with using the Canvas course which is the Park University.
Continue to monitor the adjunct faculty facilitating courses in the management program. Instructors that are struggling with using the Canvas course material will be offered the opportunity for additional training and mentoring. There is a canvas connection program used to communicate and receive feedback from adjunct and full-time faculty.
Analysis on adjunct faculty survey data specific to course structure alignment with Core Learning Outcomes (CLO's). Goal is to understand if courses within the program are appropriately structured to meet the Core Learning Outcomes (CLO's).
Adjunct Faculty Course Feedback Survey Percentage is based on the number of courses with survey feedback in the program. *Program/School of Business AY1920 Comparison
The results from the survey indicate that 98% of the adjunct faculty teaching management courses either strongly agree or agree that the course structure is in alignment with the Core Learning Outcomes. This is the same for the College of Management. There are about 2% of the adjunct faculty members teaching management courses indicate that they are neither agree or disagree that the course structure is in alignment with the Core Learning Outcomes compared to 0% in the College of Management.
The adjuncts teaching management courses are expected to use the Canvas courses in the facilitation of their course material. The management courses are developed so that there is consistency in the delivery of the course material. This also requires that the same textbook is used for course delivery. There have been a small number of adjunct faculty members that have expressed dissatisfaction with using the Canvas course which is the Park University.
Continue to monitor the adjunct faculty facilitating courses in the management program and their feedback. There is a canvas connection program used to communicate and receive feedback from adjunct and full-time faculty. The feedback is available to the course developers to share with the instructional designers for any needed modifications to the course.

3
Analysis on adjunct faculty survey data specific to course structure alignment with Core Learning Outcomes (CLO's). Goal is to understand if courses within the program are appropriately structured to meet the Core Learning Outcomes (CLO's).
Adjunct Faculty Course Feedback Survey Percentage is based on the number of courses with survey feedback in the program. *Program Specific AY1920 AY1819/AY1719 Trend Data
The results from the survey indicate that for AY1920 there are 98% of the adjunct faculty teaching management courses either strongly agree or agree that the course structure is in alignment with the Core Learning Outcomes as compared to 93% in AY1819. There are 2% of the adjunct faculty members teaching management courses indicate that they are neither agree or disagree that the course structure is in alignment with the Core Learning Outcomes in AY1920 compared to 9% in AY1819
The adjuncts teaching management courses are expected to use the Canvas courses in the facilitation of their course material. The management courses are developed so that there is consistency in the delivery of the course material. This also requires that the same textbook is used for course delivery. There have been a small number of adjunct faculty members that have expressed dissatisfaction with using the Canvas course which is the Park University.
Continue to monitor the adjunct faculty facilitating courses in the management program and their feedback. There is a canvas connection program used to communicate and receive feedback from adjunct and full-time faculty. The feedback is available to the course developers to share with the instructional designers for any needed modifications to the course.

Construction Management

1
Performance Indicator1. Student Learning Results
Performance Measure What is your measurement instrument or process?
Current Results Analysis of Results Action Taken or Improvement made Insert Graphs or Tables of Resulting Trends (3-5 data points preferred)
Measurable goal Do not use grades. What are your current results? What did you learn from the results? What did you improve or what is your next step?
What is your goal? (Indicate type of instrument) direct, formative, internal, comparative1. Employ basic construction
management functions.Construct and present a Project Plan. Type of instrument: Direct.
Final grades averaged on Project Plan was 95.4%.
Students are learning during the respective courses. Our instructors are doing a very good job of teaching.
Since the scores were good, we will continue to do what we have been doing. There is not an apparent need that requires changing from our current practivce.
Final Exam. Type of instrument: Direct.
Final exam grades averages 79%. Students are learning during the respective courses. Our instructors are doing a very good job of teaching.
Since the scores were good, we will continue to do what we have been doing. There is not an apparent need that requires changing from our current practivce.
Final Exam. Type of instrument: Direct.
Final grades averages 79%. Students are learning during the respective courses. Our instructors are doing a very good job of teaching.
Since the scores were good, we will continue to do what we have been doing. There is not an apparent need that requires changing from our current practivce.
Final Exam. Type of instrument: Direct.
Final grades averages 79%. Students are learning during the respective courses. Our instructors are doing a very good job of teaching.
Since the scores were good, we will continue to do what we have been doing. There is not an apparent need that requires changing from our current practivce.
Use this table to supply data for Criterion 4.2.Definition
A student learning outcome is one that measures a specific competency attainment. Examples of a direct assessment (evidence) of student learning attainment that might be used include: capstone performance, third-party examination, faculty-designed examination, professional performance, licensure examination). Add these to the description of the measurement instrument in column two:Direct - Assessing student performance by examining samples of student workFormative – An assessment conducted during the student’s education.Summative – An assessment conducted at the end of the student’s education.Internal – An assessment instrument that was developed within the business unit.External – An assessment instrument that was developed outside the business unit.Comparative – Compare results between classes, between online and on ground classes, Between professors, between programs, between campuses, or compare to external results such as results from the U.S. Department of Education Research and Statistics, or results from a vendor providing comparable data.
Analysis of Results
2. Identify materials required to achieve the desired construction project quality.
3. Discover ethical, socially responsible, and global issues related to construction management.
4. Apply legal considerations in construction work.

2
Construct and present a Project Plan. Type of instrument: Direct.
Final grades averaged on Project Plan was 95.4%.
Students are learning during the respective courses. Our instructors are doing a very good job of teaching.
Since the scores were good, we will continue to do what we have been doing. There is not an apparent need that requires changing from our current practivce.
Final Exam. Type of instrument: Direct.
Final exam grades averages 79%. Students are learning during the respective courses. Our instructors are doing a very good job of teaching.
Since the scores were good, we will continue to do what we have been doing. There is not an apparent need that requires changing from our current practivce.
7. Examine the orientation and enforcement of the construction trades sub-parts of the Occupational Safety and Health Act.
Final Exam. Type of instrument: Direct.
Final grades averages 79%. Students are learning during the respective courses. Our instructors are doing a very good job of teaching.
Since the scores were good, we will continue to do what we have been doing. There is not an apparent need that requires changing from our current practivce.
6. Demonstrate an understanding of effective team building, techniques of control, data requirements, and time management.
5. Demonstrate effective written, oral, and presentation communication skills in a construction environment.

1
Performance Indicator
Performance Measure What is your measurement instrument or process?
Current Results Analysis of Results Action Taken or Improvement made
Insert Graphs or Tables of Resulting Trends (3-5 data points preferred)
Measurable goal What are your current results?
What did you learn from the results?
What did you improve or what is your next step?
What is your goal?
Analysis on student perceptions and student satifcation. Goal is to understand the underlying influences on student perceptions and student satifisaction.
IDEA Survey Results at the Program LevelNote: Trend data will not be available until additional surveys are administered.
Results were over a solid score of 4, but were down compared to last year.
As students began taking course online, the student's responses were not as positive as responses from students when the courses were mainly f2f. The courses and the teachers have remained the same, but students prefer f2f teaching and the results bare this out.
The perception is online is not as effective as f2f, so I would expect the results to level off as all courses have been converted to online. However, with more experience in teaching online, I would expect the results to be slightly better.
Analysis of Results
Indirect assessments measure student achievement of program by looking at attitudes. Examples of a indirect assessment may include: Student Opinion of Teaching Survey Results (IDEA) at the Program LevelSurveys of Instructors Teaching Courses in the Program
DefinitionStandard #4 Indirect Assessments Measurement

Entrepreneurship

1
Performance Indicator1. Student Learning Results
Performance Measure What is your measurement instrument or process? Current Results Analysis of Results Action Taken or Improvement made Insert Graphs or Tables of Resulting Trends (3-5 data points preferred)
Measurable goal Do not use grades. What are your current results? What did you learn from the results? What did you improve or what is your next step?
What is your goal? (Indicate type of instrument) direct, formative, internal, comparativeOur goal is achieve a 50th average percentile rank on all MFT all performace areas.
Peregrine's MFT assessment, Summative external data we are holding steady at 58%
we are maintaining our scores
emphasize the business plan as the assessment tool. In class assignments to engage more discussion of business concepts
Our goal is achieve a score of 50 or above on all MFT performace areas, and to continually improve our scores.
Peregrine's MFT assessment, Summative external data we are holding steady at 58%
although Entreneurship is not directly measured -- overall performnce meets expectations
see above
Our goal is achieve a a score of 50 or above on all Management areas, and to continually improve our scores.
Peregrine's MFT assessment, Summative external data we are holding steady at 58%
we have a positive trend in scores
maintain positive trend
Standard #4 Measurement and Analysis of Student Learning and PerformanceUse this table to supply data for Criterion 4.2.
DefinitionA student learning outcome is one that measures a specific competency attainment. Examples of a direct assessment (evidence) of student learning attainment that might be used include: capstone performance, third-party examination, faculty-designed examination, professional performance, licensure examination). Add these to the description of the measurement instrument in column two:Direct - Assessing student performance by examining samples of student workFormative – An assessment conducted during the student’s education.Summative – An assessment conducted at the end of the student’s education.Internal – An assessment instrument that was developed within the business unit.External – An assessment instrument that was developed outside the business unit.Comparative – Compare results between classes, between online and on ground classes, Between professors, between programs, between campuses, or compare to external results such as results from the U.S. Department of Education Research and Statistics, or results from a vendor providing comparable data.
Analysis of Results
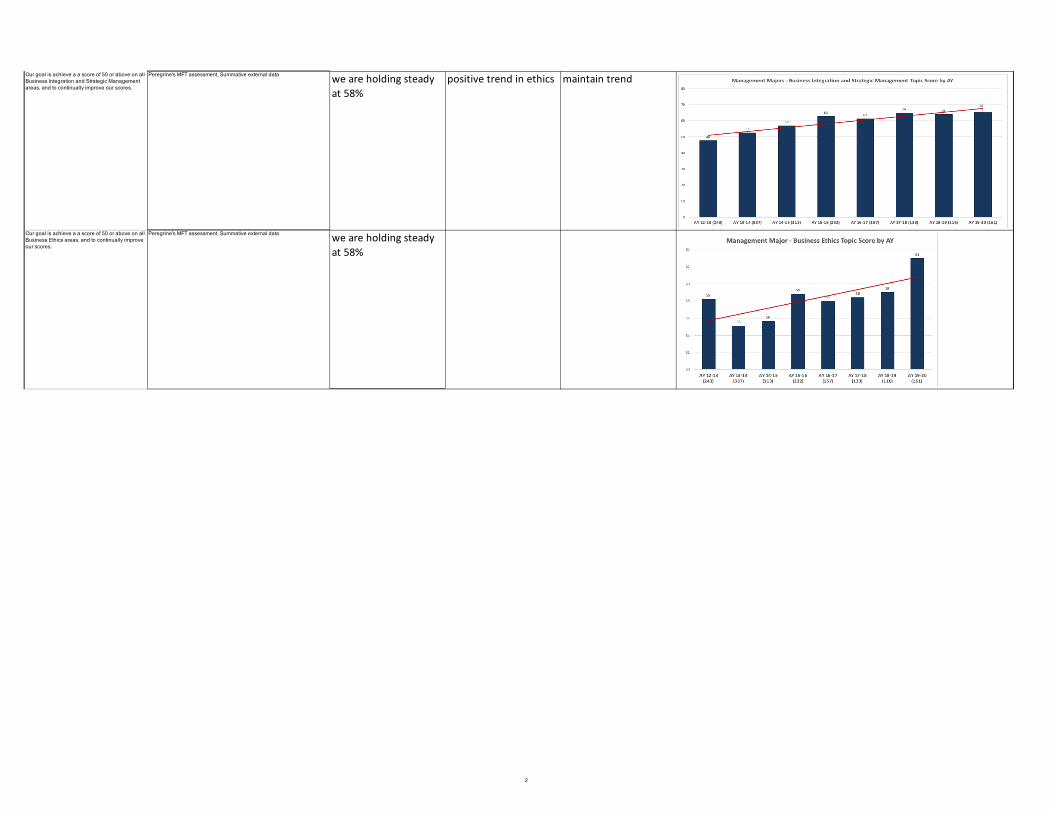
2
Our goal is achieve a a score of 50 or above on all Business Integration and Strategic Management areas, and to continually improve our scores.
Peregrine's MFT assessment, Summative external data we are holding steady at 58%
positive trend in ethics maintain trend
Our goal is achieve a a score of 50 or above on all Business Ethics areas, and to continually improve our scores.
Peregrine's MFT assessment, Summative external data we are holding steady at 58%
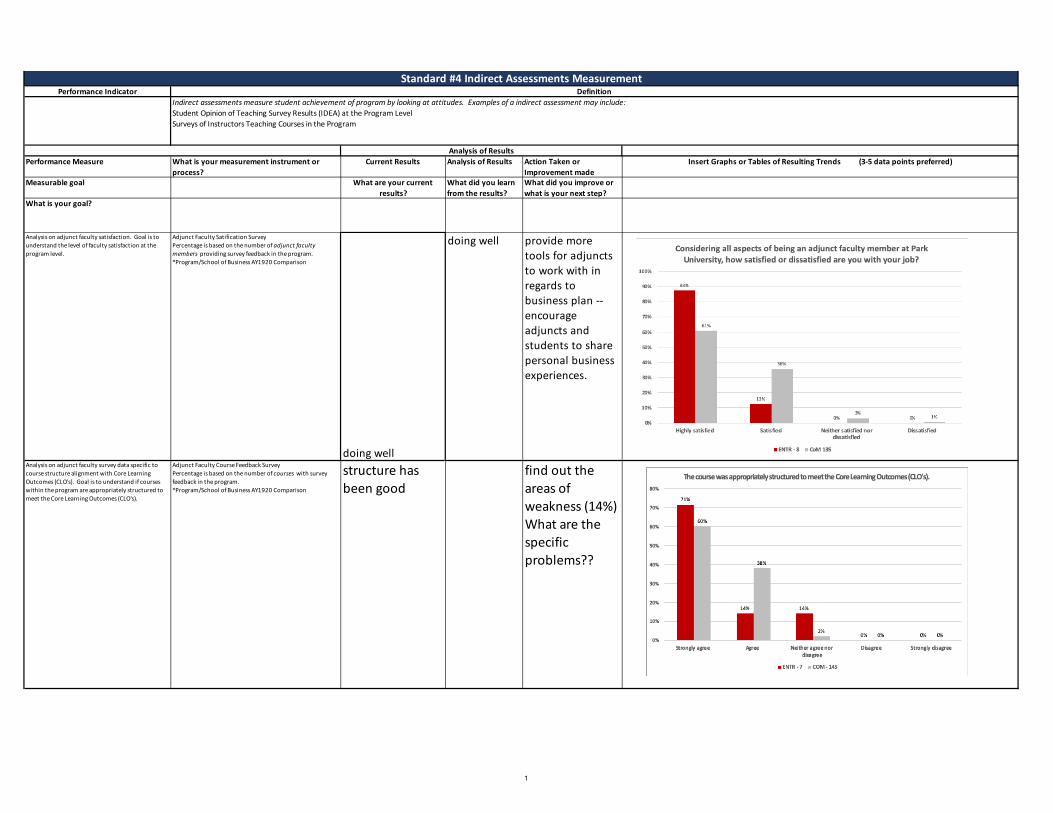
1
Performance Indicator
Performance Measure What is your measurement instrument or process?
Current Results Analysis of Results Action Taken or Improvement made
Insert Graphs or Tables of Resulting Trends (3-5 data points preferred)
Measurable goal What are your current results?
What did you learn from the results?
What did you improve or what is your next step?
What is your goal?
Analysis on adjunct faculty satisfaction. Goal is to understand the level of faculty satisfaction at the program level.
Adjunct Faculty Satification SurveyPercentage is based on the number of adjunct faculty members providing survey feedback in the program. *Program/School of Business AY1920 Comparison
doing well
doing well provide more tools for adjuncts to work with in regards to business plan -- encourage adjuncts and students to share personal business experiences.
Analysis on adjunct faculty survey data specific to course structure alignment with Core Learning Outcomes (CLO's). Goal is to understand if courses within the program are appropriately structured to meet the Core Learning Outcomes (CLO's).
Adjunct Faculty Course Feedback Survey Percentage is based on the number of courses with survey feedback in the program. *Program/School of Business AY1920 Comparison
structure has been good
find out the areas of weakness (14%) What are the specific problems??
Analysis of Results
Indirect assessments measure student achievement of program by looking at attitudes. Examples of a indirect assessment may include: Student Opinion of Teaching Survey Results (IDEA) at the Program LevelSurveys of Instructors Teaching Courses in the Program
DefinitionStandard #4 Indirect Assessments Measurement

Project Management

1
Performance Indicator1. Student Learning Results
Performance Measure What is your measurement instrument or process? Current Results Analysis of Results Action Taken or Improvement made Insert Graphs or Tables of Resulting Trends (3-5 data points preferred)
Measurable goal Do not use grades. What are your current results? What did you learn from the results? What did you improve or what is your next step?
What is your goal? (Indicate type of instrument) direct, formative, internal, comparativeOur goal is achieve a 50th average percentile rank on all MFT all performace areas.
Peregrine's MFT assessment, Summative external data good results -- 58 steady progress need to explore ways for a leap forward -- ideas -- more assignemnts related to student experences? (adult learning) assignements incorporating horizontal thinking across multiple disciples
Our goal is achieve a score of 50 or above on all MFT performace areas, and to continually improve our scores.
Peregrine's MFT assessment, Summative external data good results, solid program weakness in economics,business finance, accounting
more emphasis on economic principles, finance and accounting,cost benefit analysis
Our goal is achieve a a score of 50 or above on all Management areas, and to continually improve our scores.
Peregrine's MFT assessment, Summative external data solid results uptrend see above
Our goal is achieve a a score of 50 or above on all Business Integration and Strategic Management areas, and to continually improve our scores.
Peregrine's MFT assessment, Summative external data solid results uptrend see above
Standard #4 Measurement and Analysis of Student Learning and Performance
Definition
Analysis of Results
Use this table to supply data for Criterion 4.2.
A student learning outcome is one that measures a specific competency attainment. Examples of a direct assessment (evidence) of student learning attainment that might be used include: capstone performance, third-party examination, faculty-designed examination, professional performance, licensure examination). Add these to the description of the measurement instrument in column two:Direct - Assessing student performance by examining samples of student workFormative – An assessment conducted during the student’s education.Summative – An assessment conducted at the end of the student’s education.Internal – An assessment instrument that was developed within the business unit.External – An assessment instrument that was developed outside the business unit.Comparative – Compare results between classes, between online and on ground classes, Between professors, between programs, between campuses, or compare to external results such as results from the U.S. Department of Education Research and Statistics, or results from a vendor providing comparable data.

2
Our goal is achieve a a score of 50 or above on all Business Ethics areas, and to continually improve our scores.
Peregrine's MFT assessment, Summative external data solid results uptrend see above

1
Performance Indicator Definition
Analysis of ResultsPerformance Measure What is your measurement instrument or
process? Current Results Analysis of Results Action Taken or
Improvement made Insert Graphs or Tables of Resulting Trends (3-5 data points preferred)
Measurable goal What are your current results?
What did you learn from the results?
What did you improve or what is your next step?
What is your goal?
Analysis on adjunct faculty survey data specific to course structure alignment with Core Learning Outcomes (CLO's). Goal is to understand if courses within the program are appropriately structured to meet the Core Learning Outcomes (CLO's).
Adjunct Faculty Course Feedback Survey Percentage is based on the number of courses with survey feedback in the program. *Program/School of Business AY1920 Comparison
EXCELLENT CADRE OF INSTRUCTORS
SUBJECT MATTER KNOWLEDGE AND COMMITMENT
MAINTAIN HIGH STANDRDS FOR HIRING, QUICKER STUDENT FEEDBACK
Analysis on adjunct faculty survey data specific to course structure alignment with Core Learning Outcomes (CLO's). Goal is to understand if courses within the program are appropriately structured to meet the Core Learning Outcomes (CLO's).
Adjunct Faculty Course Feedback Survey Percentage is based on the number of courses with survey feedback in the program. *Program Specific AY1920 AY1819/AY1719 Trend Data
SOLID PERFORMANCE 14% SEEMS HIGH RESEARCH WHY 14% ARE NEUTRAL
Indirect assessments measure student achievement of program by looking at attitudes. Examples of a indirect assessment may include: Student Opinion of Teaching Survey Results (IDEA) at the Program LevelSurveys of Instructors Teaching Courses in the Program
Standard #4 Indirect Assessments Measurement

Marketing

1
Performance Indicator1. Student Learning Results
Performance Measure What is your measurement instrument or process? Current Results Analysis of Results Action Taken or Improvement made Insert Graphs or Tables of Resulting Trends (3-5 data points preferred)
Measurable goal Do not use grades. What are your current results? What did you learn from the results? What did you improve or what is your next step? What is your goal? (Indicate type of instrument) direct, formative, internal, comparativeOur goal is achieve a 50th average percentile rank on all MFT all performance areas.
Peregrine's MFT assessment, Summative external data Results show marketing majors at the 55th percentile.
Being above the 50th percentile is a positive indicator for the program but taking steps to grow beyond the current percentile rank is necessary. There was no change in percentile rank from the previous year.
MK351 has been redeveloped with a marketing plan being the major project for the course.
Our goal is achieve a score of 50 or above on all MFT performance areas, and to continually improve our scores.
Peregrine's MFT assessment, Summative external data Marketing majors are above the 50th percentile for all subjects.
While being above the 50th percentile is good, there are areas that need improvement. Student knowledge as it pertains to topics like operations and production management, finance and economics should be improved.
Placing greater emphasis on quantitative topic areas in the course may help to improve performance on topic areas where students are lacking.
Our goal is achieve a score of 50 or above on all Marketing Subject areas, and to continually improve our scores.
Peregrine's MFT assessment, Summative external data Results show marketing majors at the 62nd percentile.
Overall trend line shows positive results/ continuous improvement. However, there was a one percent decrease year over year.
Student performance on the assignment on newly redeveloped course will be monitored and reviewed for growth and improvement.
Standard #4 Measurement and Analysis of Student Learning and PerformanceUse this table to supply data for Criterion 4.2.
DefinitionA student learning outcome is one that measures a specific competency attainment. Examples of a direct assessment (evidence) of student learning attainment that might be used include: capstone performance, third-party examination, faculty-designed examination, professional performance, licensure examination). Add these to the description of the measurement instrument in column two:Direct - Assessing student performance by examining samples of student workFormative – An assessment conducted during the student’s education.Summative – An assessment conducted at the end of the student’s education.Internal – An assessment instrument that was developed within the business unit.External – An assessment instrument that was developed outside the business unit.Comparative – Compare results between classes, between online and on ground classes, Between professors, between programs, between campuses, or compare to external results such as results from the U.S. Department of Education Research and Statistics, or results from a vendor providing comparable data.
Analysis of Results

2
Our goal is achieve a a score of 50 or above on all Business Ethics areas, and to continually improve our scores.
Peregrine's MFT assessment, Summative external data Students were above the 50th percentile for this topic area.
At the 57th percentile, student performance is lower than that of the previous year (61st percentile).
Ensuring that business ethics is emphasized in all marketing courses will allow for improvement in this area.
Our goal is achieve a a score of 50 or above on all Quantitative Research Techniques and Statistics areas, and to continually improve our scores.
Peregrine's MFT assessment, Summative external data Results show marketing majors at the 59th percentile.
The overall trend is positive as it relates to this topic. However, at the 59th percentile, student performance is lower than that of the previous year (63rd percentile). This indicates a need for improvement in this area
Greater emphasis should be placed on quantitative topic in order to see an improvement in results.
Program Goal 1: Demonstrate an understanding of the marketing concept, and the ability to use the strategic marketing process to resolve marketing problems and explore marketing opportunities.
MK453 - Research Project formative internal data. A research project is evaluated using a common rubric.
Data shows students results as 2.22 for Spring 2020 , 3 for Fall 2 2019 and Spring 1 2020.
Overall, results from recent semesters indicate that program goal 1 is being met. With the exception of Spring 2020, results are consistently above 2.5.
This course has been redeveloped. The new content should allow for continual improvement and more consistent high scores throughout the year.
Program Goal 2: Demonstrate the ability to use quantitative techniques to analyze marketing strategies.
MK453 - Research Project formative internal data. A research project is evaluated using a common rubric.
Data shows students results as 2.22 for Spring 2020, 3 for Fall 2 2019 and Spring 1 2020.
Overall, results from recent semesters indicate that program goal 2 is being met. With the exception of Spring 2020, results are consistently above 2.5.
This course has been redeveloped. The new content and research project should allow for continual improvement and more consistent high scores throughout the year.

3
Program Goal 3: Demonstrate a working knowledge of data integration and research methodology and their place in the marketing decision proces.
MK453 - Research Project formative internal data. A research project is evaluated using a common rubric.
Data shows students results as 2.22 for Spring 2020, 3 for Fall 2 2019 and Spring 1 2020
Overall, results from recent semesters indicate that program goal 3 is being met. With the exception of Spring 2020, results are consistently above 2.5.
This course has been redeveloped. The new content and research project should allow for continual improvement and more consistent high scores throughout the year.
Program Goal 4: Analyze business/Marketing concepts. MK453 - Research Project formative internal data. A research project is evaluated using a common rubric.
Data shows students results as 2.22 for Spring 2020, 3 for Fall 2 2019 and Spring 1 2020
Overall, results from recent semesters indicate that program goal 4 is being met. With the exception of Spring 2020, results are consistently above 2.5.
This course has been redeveloped. The new content and research project should allow for continual improvement and more consistent high scores throughout the year.
Program Goal 6: Demonstrate effective oral and written communication skills.
MK453 - Research Project formative internal data. A research project is evaluated using a common rubric.
Data shows students results as 2.22 for Spring 2020, 3 for Fall 2 2019 and Spring 1 2020
Overall, results from recent semesters indicate that program goal 6 is being met. The results from Summer 19 and Spring 2020 indicate that there is room for improvement.
This course has been redeveloped. The new content and research project should allow for continual improvement and more consistent high scores throughout the year.

1
Performance Indicator Definition
Analysis of ResultsPerformance Measure What is your measurement instrument or
process? Current Results Analysis of Results Action Taken or
Improvement made Insert Graphs or Tables of Resulting Trends (3-5 data points preferred)
Measurable goal What are your current results?
What did you learn from the results?
What did you improve or what is your next step?
What is your goal?
Analysis on student perceptions and student satisfaction. Goal is to understand the underlying influences on student perceptions and student satisfaction.
IDEA Survey Results at the Program LevelNote: Trend data will not be available until additional surveys are administered.
Results indicate that the marketing program outperformed the School of Business average for the IDEA summative questions.
While the results show that scores were higher for the marketing program than the School of Business, scores for the program were lower than they were last year.
The newly redeveloped MK351 should lead to an improvement in the "excellent course" score.
Analysis on adjunct faculty satisfaction. Goal is to understand the level of faculty satisfaction at the program level.
Adjunct Faculty Satisfaction SurveyPercentage is based on the number of adjunct faculty members providing survey feedback in the program. *Program/School of Business AY1920 Comparison
Adjunct faculty indicate that they are satisfied or highly satisfied with their jobs.
The marketing program has more satisfied adjunct faculty when compared to the College of Management
Continue to build relationships with adjunct faculty by keeping lines of communication open
Indirect assessments measure student achievement of program by looking at attitudes. Examples of a indirect assessment may include: Student Opinion of Teaching Survey Results (IDEA) at the Program LevelSurveys of Instructors Teaching Courses in the Program
Standard #4 Indirect Assessments Measurement

2
Analysis on adjunct faculty satisfaction. Goal is to understand the level of faculty satisfaction at the program level.
Adjunct Faculty Satisfaction SurveyPercentage is based on the number of adjunct faculty members providing survey feedback in the program. *Program Specific AY1920 AY1819/AY1719 Trend Data
All adjunct faculty reported being satisfied or highly satisfied with their jobs
The current year's results are a noticeable improvement over the two previous years.
Increased efforts to communicate more with adjunct faculty seems to have lead to marked improvements in job satisfaction.
Analysis on adjunct faculty survey data specific to course structure alignment with Core Learning Outcomes (CLO's). Goal is to understand if courses within the program are appropriately structured to meet the Core Learning Outcomes (CLO's).
Adjunct Faculty Course Feedback Survey Percentage is based on the number of courses with survey feedback in the program. *Program/School of Business AY1920 Comparison
An overwhelming majority of adjuncts either agree or strongly agree that courses were appropriately structured to meet CLO's.
The marketing program outperformed the College of Management on this survey question
Continue to improve by reviewing and making changes to CLO's as courses are developed/redeveloped
Analysis on adjunct faculty survey data specific to course structure alignment with Core Learning Outcomes (CLO's). Goal is to understand if courses within the program are appropriately structured to meet the Core Learning Outcomes (CLO's).
Adjunct Faculty Course Feedback Survey Percentage is based on the number of courses with survey feedback in the program. *Program Specific AY1920 AY1819/AY1719 Trend Data
An overwhelming majority of adjuncts either agree or strongly agree that courses were appropriately structured to meet CLO's.
CLO's will be reviewed as courses are redeveloped.
The redevelopment of courses may have impacted these results. Adjuncts' unfamiliarity with the new course an potentially new CLO's may play a role here. This will change as adjuncts become more familiar with new courses.

Public Administration

1
Performance Indicator1. Student Learning Results
Performance Measure What is your measurement instrument or process? Current Results Analysis of Results Action Taken or Improvement made Insert Graphs or Tables of Resulting Trends (3-5 data points preferred)
Measurable goal Do not use grades. What are your current results? What did you learn from the results? What did you improve or what is your next step? What is your goal? (Indicate type of instrument) direct, formative, internal, comparative
Results indicate all but one student met expectations of the course CLOs in the final
essay.
This is the first year student learning attainment with CLOs has been analyzed. As yet, no trend has been
established. Over 96% of the students attained mastery of the course subject. Of those students, 2/3 exceeded
expectations in final essay. With one outlier an interpretation, is the student stopped participating and
dropped out without withdrawing from class rather than struggled to meet course mastery.
This is the introductory course in the BPA program. New leadership will continue to evaluate student learning
attainment. Course review and redevelopment initiative will begin in AY2021.
PA330 - Unit 8: Final EssayAssess student learning attainment for PA330-CLO 1: Analyze public administration in America and its historical developments.
Standard #4 Measurement and Analysis of Student Learning and Performance
Definition
Analysis of Results
Use this table to supply data for Criterion 4.2.
A student learning outcome is one that measures a specific competency attainment. Examples of a direct assessment (evidence) of student learning attainment that might be used include: capstone performance, third-party examination, faculty-designed examination, professional performance, licensure examination). Add these to the description of the measurement instrument in column two:Direct - Assessing student performance by examining samples of student workFormative – An assessment conducted during the student’s education.Summative – An assessment conducted at the end of the student’s education.Internal – An assessment instrument that was developed within the business unit.External – An assessment instrument that was developed outside the business unit.Comparative – Compare results between classes, between online and on ground classes, Between professors, between programs, between campuses, or compare to external results such as results from the U.S. Department of Education Research and Statistics, or results from a vendor providing comparable data.

2
PA432 Unit 8: Final Essay Results indicate all students met expectations of the course CLOs in the final essay.
This is the first year student learning attainment with CLOs has been analyzed. No trend has been established.
Over 3/4 of students exceeded expectations and all students met expectations for the capstone research
paper.
This is the capstone course and students are expected to have a high level of knowledge and experience in the
subject. The result confirm student mastery of the subject. New leadership will continue to evaluate student learning attainment. Course review and redevelopment
initiative will begin in AY2021.
Results indicate all but one student met expectations of the course CLOs in the final
essay.
This is the first year student learning attainment with CLOs has been analyzed. As yet, no trend has been
established. Over 96% of the students attained mastery of the course subject. Of those students, 2/3 exceeded
expectations in final essay. With one outlier an interpretation, is the student stopped participating and
dropped out without withdrawing from class rather than struggled to meet course mastery.
This is the introductory course in the BPA program. New leadership will continue to evaluate student learning
attainment. Course review and redevelopment initiative will begin in AY2021.
PA330 - Unit 8: Final EssayAssess student learning attainment for PA330-CLO 1: Analyze public administration in America and its historical developments.

3
PA432 Unit 8: Final Essay Results indicate all students met expectations of the course CLOs in the final essay.
This is the first year student learning attainment with CLOs has been analyzed. No trend has been established.
Over 3/4 of students exceeded expectations and all students met expectations for the capstone research
paper.
This is the capstone course and students are expected to have a high level of knowledge and experience in the
subject. The result confirm student mastery of the subject. New leadership will continue to evaluate student learning attainment. Course review and redevelopment
initiative will begin in AY2021.

1
Performance Indicator
Performance Measure What is your measurement instrument or process?
Current Results Analysis of Results Action Taken or Improvement made
Insert Graphs or Tables of Resulting Trends (3-5 data points preferred)
Measurable goal What are your current results?
What did you learn from the results?
What did you improve or what is your next step?
What is your goal?
Analysis on student perceptions and student satisfaction. Goal is to understand the underlying influences on student perceptions and student satifisaction.
IDEA Survey Results at the Program LevelNote: Trend data will not be available until additional surveys are administered.
Results indicate BPA students have a high perception and satisfaction with teachers and courses. BPA scores for IDEA Summative Questions are slightly higher than comparison SoB All and IDEA All scores.
Student perceptions of excellent teachers continues to show an improvement. Student perception of excellent course has slightly decreased. Overall student satisfaction has remained stable.
New leadership this year kept in close contact with adjuncts and provided guidance on communicating with students and student problems. This will continue. The adjunct teaching assessment is currently being used for a second year. Adjuncts receive feedback on their teaching and tips for improvement.
Analysis on adjunct faculty satisfaction. Goal is to understand the level of faculty satisfaction at the program level.
Adjunct Faculty Satification SurveyPercentage is based on the number of adjunct faculty members providing survey feedback in the program. *Program/School of Business AY1920 Comparison
Faculty who responded were generally satisfied with all aspects of being an adjunct faculty member.
All adjunct faculty indicated satisfaction with their job.
New leadership kept in close contact with adjuncts and provided guidance when needed. There were quick responses to adjuncts to answer questions and help with technical and student problems. This will continue. With n=2, it is difficult to gauge overall adjunct faculty satisfaction. Faculty will be encouraged to complete the survey in AY2021!
Analysis of Results
Indirect assessments measure student achievement of program by looking at attitudes. Examples of a indirect assessment may include: Student Opinion of Teaching Survey Results (IDEA) at the Program LevelSurveys of Instructors Teaching Courses in the Program
DefinitionStandard #4 Indirect Assessments Measurement

2
Analysis on adjunct faculty satisfaction. Goal is to understand the level of faculty satisfaction at the program level.
Adjunct Faculty Satification SurveyPercentage is based on the number of adjunct faculty members providing survey feedback in the program. *Program Specific AY1920 AY1819/AY1719 Trend Data
Overall satisfaction of faculty increased.
Adjunct faculty satisfaction increased over last year.
New leadership will continue to communicate regularly with adjunct faculty.
Analysis on adjunct faculty survey data specific to course structure alignment with Core Learning Outcomes (CLO's). Goal is to understand if courses within the program are appropriately structured to meet the Core Learning Outcomes (CLO's).
Adjunct Faculty Course Feedback Survey Percentage is based on the number of courses with survey feedback in the program. *Program/School of Business AY1920 Comparison
BPA faculty agree their courses were appropriately structured to meet course CLOs.
CLOs appear to remain appropriately structured for the BPA courses.
During the AY2021 course review, new leadership will continue to engage with adjunct faculty to assess course CLOs and course relevance.

3
Analysis on adjunct faculty survey data specific to course structure alignment with Core Learning Outcomes (CLO's). Goal is to understand if courses within the program are appropriately structured to meet the Core Learning Outcomes (CLO's).
Adjunct Faculty Course Feedback Survey Percentage is based on the number of courses with survey feedback in the program. *Program Specific AY1920 AY1819/AY1719 Trend Data
All faculty agree their courses were appropriately structured to meet the course CLOs.
Overall faculty agreement on courses appropriately structured to meet CLOs increased 25%.
During the AY2021 course review, new leadership will continue to engage with adjunct faculty to assess course CLOs and course relevance.

Master of
Healthcare Administration

1
Performance Indicator1. Student Learning Results
Performance Measure What is your measurement instrument or process? Current Results Analysis of Results Action Taken or Improvement made Insert Graphs or Tables of Resulting Trends (3-5 data points preferred)Measurable goal Do not use grades. What are your current results? What did you learn from the results? What did you improve or what is your next step? What is your goal? (Indicate type of instrument) direct, formative, internal, comparativeFor all MHA students to perform in the 60th percentile or better on all CPC performance areas for four consecutive terms on the Peregrine MFT.
Peregrine's CPC Assessment, Summative, External Data. We exceeded the goal. The data show that in each domain (competency) the MHA students performed better than the 60th percentile. This has been a consistent pattern over the past 4 academic years. Up to the last year, there was one area where percentiles were consistently lower than others: "legal environment of healthcare administration." This year this discipline showed significant increase reaching the 70th percentile.
Last year, the area for improvement was the legal environment of healthcare administration. Beginning Spring 2 2019, we changed the five team project assignments in the regular course maintenance in HA517 Legal and Ethical Issues in Healthcare Administration course. Instead of the court cases in various areas of the healthcare legal field, the root cause analysis and the action plan, the new cases are practice-based in the area of legal and ethical issues of human resources, medical malpractice, negligence, etc. As a result, we see this year AY19-20 a sharp increase in the "legal environment" score. The highest scores in the MHA program are communication skills (79th percentile) and risk management (84th percentile). This is not surprising as the program is laser focused on the development of the soft management skills, and all assignments in the core HA courses require practical deliverables (mini-cases in all discussions, case studies in all application assignments, and case studies in team projects). There are no quizzes or exams. The team project deliverables are used for the assessment of the development of the competencies.
It appears that the MHA students are comfortably and consistently exceeding the 60th percentile on the Peregrine MFT assessment, so moving forward, we'll adjust this goal up to the 70th percentile or better . To achieve this goal, we will enhance the content and expectations associated with HA516 Healthcare Finance and HA518 Organization of Healthcare Delivery Systems courses based on the summative and formative assessment information. Currently, we are also working on complete redevelopment of six old HA elective courses, that will be launched with team projects, mini-cases in discussions and case studies in application assignments during AY20/21. Will continue monitoring.
For all MHA students to perform in the 60th percentile or better on all CPC performance areas for four consecutive terms on the Peregrine MFT (continued the same previous goal ).
Peregrine's CPC Assessment, Summative, External Data. (continued the same previous goal, using data comparison with the national average amoung MHA programs using the Peregrine MFT assessment in the United States ).
This second graph shows a comparison of the average scores on the outbound Peregrine Major Field Test between Park University MHA graduates (blue color bars) and the MHA graduates in general in the United States during this AY19/20 (orange color bars).
Overall, Park MHA graduates outperform peers in all competency domains (7.95% higher overall in total). Especially, the difference is pronounced in the risk management competency (15.46% higher), which reflects the practical skills in identifying, assessing, and quantifying business risks and making decisions for measures to avert, control, and reduce these risks. This is not surprising since Park's MHA program utilizes a case study teaching approach. Comparing to the national average, there is also an impressive difference in the following competency domains: in legal environment of healthcare administration (8.31% higher), financial management (7.75% higher), leadership skills and behavior (7.05% higher), organizational climate and culture (6.26%), personal and professional accountability (5.22% higher), and strategic planning and marketing (5% higher).
Moving forward, we'll adjust this goal up to the 70th percentile or better . To achieve this goal, we will enhance the content and expectations associated with HA516 Healthcare Finance and HA518 Organization of Healthcare Delivery Systems courses based on the summative and formative assessment information. Currently, we are also working on complete redevelopment of six old HA elective courses, that will be launched with team projects, mini-cases in discussions and case studies in application assignments during AY20/21. Will continue monitoring.
MHA Performance on Peregrine MFT exam AY19/20 Comparing to National Average among MHA Graduates
To improve the overall financial management performance, on the Peregrine MFT, to the 60% level for at least 3 cosecutive terms during AY19-20.
Peregrine MFT (summative assessment,external assessment). . Will specifically be looking at the results for the "financial management" CPC.
We exceeded this goal, achieving 60% or higher for 4 consecutive terms during AY19-20 when the overall financial management performance on the Peregrine MFT scored at the 60% level or higher - Fall 1, Fall 2, Spring 1, and Spring 2. The Summer results are not available yet.
The national average for Financial Management among the MHA programs on the Peregrine outbound test during AY19-20 was 56.72%. Achieving 60% or higher for 4 consecutive terms demonstrates consistency in financial management competency development in Park MHA program.
Last year AY18-19, as a result of Faculty Assessment (FA) performance review of HA516 Healthcare Finance courses, we discovered some inconsistencies in the adjunct faculty performance and assessment practices which have been addressed with the adjunct faculty and are being monitored closely. This year AY19-20, the Faculty Assessment (FA) review in this course showed improved performance that meet the gradaute faculty performance expectations. We will use the information in the Peregrine report about specific challenging areas within the discipline of Healthcare Finance, and emphasize these problematic topics when enhancing the content and expectations associated with HA516 Healthcare Finance .
To improve the overall strategic planning and marketing performance on the Peregrine MFT, to the 70% level, for at least 3 consecutive terms during AY19-20.
Peregrine MFT (summative, external assessment). Will specifically be looking at the results for the "strategic planning and marketing" CPC.
We did not meet this goal. Fall 1 and Fall 2 2019 were the 2 consequtive terms when we met the requirement of the overall strategic planning and marketing performance on the Paragrine MFT score of 70% level or higher. However, then in Spring 1 2020 we got 57, which is the lowest score in four years. This could be cause by the distracting effect of the onset of the Coronavirus pandemic.
We are not seeing any change in the student performance, except for the outligher score in Spring 1, 2020, which could be caused by the transition related to the Coronavirus pandemic. The scores are consistent from year to year. When performing consistenly well in the capstone course HA616 when taking the Peregrine MFT assessment, as lons as our scores are consistent with other schools (the national average is 63.67%), we are doing well.
We totally redeveloped the capstone course HA616 Healthcare Strategic Management and Marketing and made it more closely aligned with other MHA courses in the core curriculum. We observed in the beginning of AY19-20 (Fall 1 and Fall 2) an increase of strategic management and marketing scores above 70%, however, didn't see them stabilize at the higher level. We will keep the goal to read: "To improve the overall strategic planning and marketing performance on the Peregrine MFT, to the 70% level, for at least 3 consecutive terms during AY20-21 ."
Standard #4 Measurement and Analysis of Student Learning and Performance
Definition
Analysis of Results
Use this table to supply data for Criterion 4.2.
A student learning outcome is one that measures a specific competency attainment. Examples of a direct assessment (evidence) of student learning attainment that might be used include: capstone performance, third-party examination, faculty-designed examination, professional performance, licensure examination). Add these to the

1
Performance Indicator
Performance Measure What is your measurement instrument or process?
Current Results Analysis of Results Action Taken or Improvement made
Insert Graphs or Tables of Resulting Trends (3-5 data points preferred)
Measurable goal What are your current results?
What did you learn from the results?
What did you improve or what is your next step?
What is your goal?
Analysis on student perceptions and student satifcation. Goal is to understand the underlying influences on student perceptions and student satifisaction.
IDEA Survey Results at the Program LevelNote: Trend data will not be available until additional surveys are administered.
The first table reflects the IDEA results only for the Spring 2020 session courses (N = 32), without the Fall session. The second table includes the Fall 2019 session courses (N = 34), too. Comparing the MHA graduate program IDEA assessment results with the SoB overall, that includes the undergraduate courses, is not the best comparison. Comparing the MHA IDEA results with "IDEA All" scores - these scores look pretty consistent based on the "Excellent Teacher" and "Excellent Course" scores. 4.16 and 4.3 are not statistically different. There is also no increase in the scores - the results are pretty flat.
The IDEA assessment doesn't identify any pressing issues. The top available score goes up to 5. Having the results around 4.1 is pretty good. The IDEA results do not appear to be overinflated, which is quite respectful. The reason for these consistently good results is that we perform the Faculty Assessment (FA) reviews on the faculty teaching performance, that reinforce the expectations and instructional criteria for the program faculty.
It looks like there is nothing special that needs to be done with the MHA faculty performance or the course structure used in the MHA curriculum. We will continue monitoring the IDEA results, using the student encouragement strategies to keep the IDEA assessment student response rate high, and performing the Faculty Assessment (FA) reviews on the faculty teaching performance. Currently, the MHA program student response rate to the IDEA student opinion of teaching (SOTS) survey reached 78.89%.
Analysis of Results
Indirect assessments measure student achievement of program by looking at attitudes. Examples of a indirect assessment may include: Student Opinion of Teaching Survey Results (IDEA) at the Program LevelSurveys of Instructors Teaching Courses in the Program
DefinitionStandard #4 Indirect Assessments Measurement

Master of
Business Administration
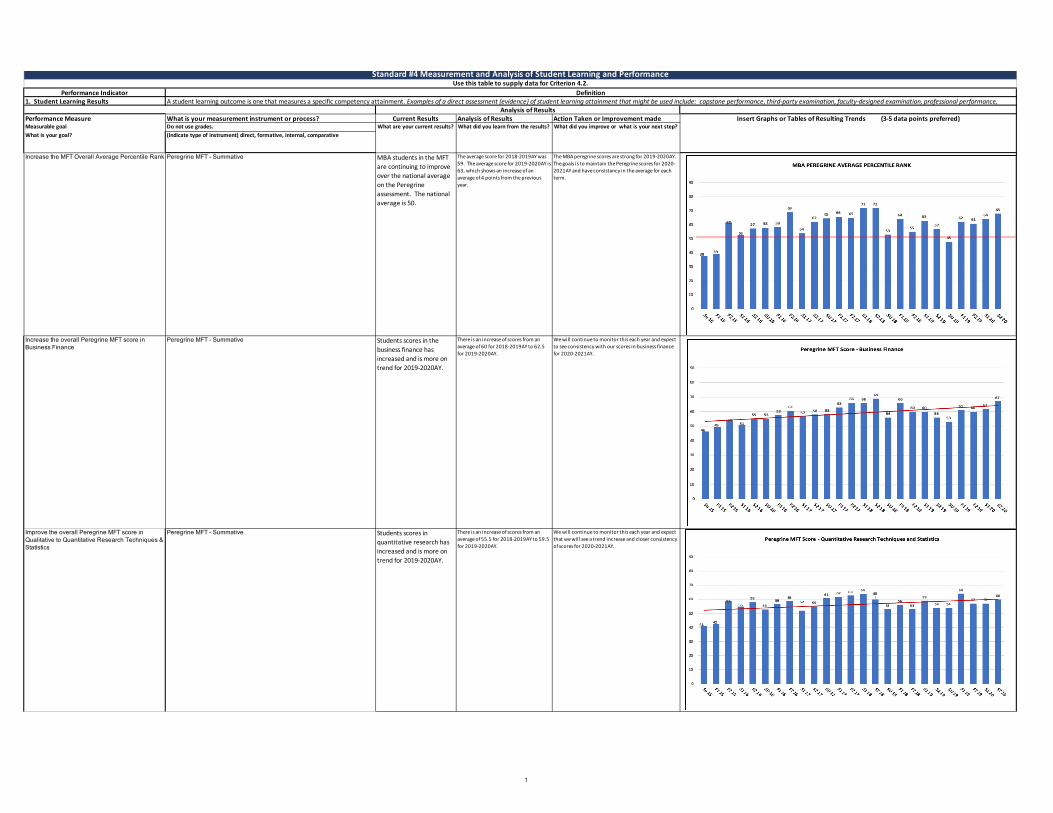
1
Performance Indicator1. Student Learning Results
Performance Measure What is your measurement instrument or process? Current Results Analysis of Results Action Taken or Improvement made Insert Graphs or Tables of Resulting Trends (3-5 data points preferred)Measurable goal Do not use grades. What is your goal? (Indicate type of instrument) direct, formative, internal, comparative
Increase the MFT Overall Average Percentile Rank Peregrine MFT - Summative MBA students in the MFT are continuing to improve over the national average on the Peregrine assessment. The national average is 50.
The average score for 2018-2019AY was 59. The average score for 2019-2020AY is 63, which shows an increase of an average of 4 points from the previous year.
The MBA peregrine scores are strong for 2019-2020AY. The goals is to maintain the Peregrine scores for 2020-2021AY and have consistancy in the average for each term.
Increase the overall Peregrine MFT score in Business Finance
Peregrine MFT - Summative Students scores in the business finance has increased and is more on trend for 2019-2020AY.
There is an increase of scores from an average of 60 for 2018-2019AY to 62.5 for 2019-2020AY.
We will continue to monitor this each year and expect to see consistency with our scores in business finance for 2020-2021AY.
Improve the overall Peregrine MFT score in Qualitative to Quantitative Research Techniques & Statistics
Peregrine MFT - Summative Students scores in quantitative research has increased and is more on trend for 2019-2020AY.
There is an increase of scores from an average of 55.5 for 2018-2019AY to 59.5 for 2019-2020AY.
We will continue to monitor this each year and expect that we will see a trend increase and closer consistency of scores for 2020-2021AY.
What are your current results? What did you learn from the results? What did you improve or what is your next step?
Standard #4 Measurement and Analysis of Student Learning and Performance
Definition
Analysis of Results
Use this table to supply data for Criterion 4.2.
A student learning outcome is one that measures a specific competency attainment. Examples of a direct assessment (evidence) of student learning attainment that might be used include: capstone performance, third-party examination, faculty-designed examination, professional performance,

2
2. Develop business strategic plans. Group business strategy plan in MBA695 Course. The majority of students fall into the exemplary and superior range.
The majority of students are able to develop a business strategic plan at the exemplary and superior level.
The goal is to continue to track this data and monitor it for the 2020/2021 AY.
3. Apply SWOT analysis in business. Group project and presentation in MBA576 Course. The majority of students are doing exemplary and superior work on their group project and presentation.
The majority of students are able to do a SWOT analysis in business and apply it in their group project and presentation at the exemplary and superior level.
The goal is to continue to track this data and monitor it for the 2020/2021 AY.
4. Evaluate financial statements to make informed business decision.
Final Exam in MBA615 Course. The grades are more varied distribution in grades for this quantitative course.
The students vary between exemplary and inadequate. The majority of the students fall in the exemplary to profiecient range.
The goal is to continue to track this data and monitor it for the 2020/2021 AY.

3
5. Construct ethical business decisions. Group project in MBA524 Course. he majority of students are doing exemplary and superior work on their group project.
Students are successfully able to construct ethical business decisions at exemplary and superior level.
The goal is to continue to track this data and monitor it for the 2020/2021 AY.

1
Performance Indicator
Performance Measure What is your measurement instrument or process?
Current Results Analysis of Results Action Taken or Improvement made
Insert Graphs or Tables of Resulting Trends (3-5 data points preferred)
Measurable goal What are your current results?
What did you learn from the results?
What did you improve or what is your next step?
What is your goal?
Analysis on student perceptions and student satifcation. Goal is to understand the underlying influences on student perceptions and student satifisaction.
IDEA Survey Results at the Program LevelNote: Trend data will not be available until additional surveys are administered.
Scores for excellent teacher/course are higher for GRPA than for SoBALL. (The more relevant comparison might be to All Hauptmann School of Public Affairs teachers/courses or to All CoM teachers/ courses.) Given the data presented, GRPA has higher scores for teachers and courses compared to SoB teachers/courses. The summative questions score improved over AY1819 for both teaching and courses.
Learned that Hauptmann School of Public Affairs Grad teachers/courses score higher than All School of Business teachers/courses. (Again, comparsison to All Hauptmann School or All CoM would have been more instructive.)
Continue motinoring for improvement in scores. The MPA has been hiring very qualified new adjuncts and I think this is having a positive influence.
Annalysis of fit between students career goals and MPA track offerings. Goals are to understand the reasons students pursue the MPA and how we might improve the program to best serve student needs.
Survey of MPA students to gauge their opinion on the extent to which the program facilitates their career goals and see what program improvements might be made.
The first survey was administered Spring 2019, but results were not ready for last years assessment report. The second survey was administered Spring 2020. Results of both show students take the MPA for career preparation and want more frequent course availability, fewer courses where material overlaps, and greater emphasis in courses on activities such as group projects and video presentations.
First, learned that my efforts to redesign the MPA degree plan (new plan rolled out Fall 2020) were in synch with student preference for greater frequency of course offerings and reduced overlap in material (new plan reduced total # MPA courses, that increases frequency particular courses will be offered, and reduces overalap between similar courses -- all told 28 MPA courses were eliminated from the Graduate Catalog). Second, leared that as courses are redeveloped, a more interactive compenent needs to be included.
Redesigned MPA program to reduce # of courses, enhance MPA core courses with greater emphasis on public management, and steamlined area concentraiton course offerings so that these are now the same as graduate certificate counterparts. As courses are redeveloped, included opportunities for team assignments and ensure that course materials align with career goals.
Suggestions for Program Improvement (N=61 on this question for both surveys): Improve Courses (n=26, of which 63% suggested increased use of teams and videos); Modify Course Offerings (n=26, of which 50% suggested either increased course availability or elimination of courses too similar in content). How Does MPA Help Attain Career Goal? (N=92 on this question for both surveys): Provides Career Preparation (n=84, 81%); Provides Personal Growth/Preparation for PhD (n=8, 9%)
Analysis of Results
Indirect assessments measure student achievement of program by looking at attitudes. Examples of a indirect assessment may include: Student Opinion of Teaching Survey Results (IDEA) at the Program LevelSurveys of Instructors Teaching Courses in the Program
DefinitionStandard #4 Indirect Assessments Measurement

Master of
Public Administration

1
Performance Indicator1. Student Learning Results
Performance Measure What is your measurement instrument or process?
Current Results Analysis of Results Action Taken or Improvement made Insert Graphs or Tables of Resulting Trends (3-5 data points preferred)
Measurable goal Do not use grades. What are your current results? What did you learn from the results? What did you improve or what is your next step? What is your goal? (Indicate type of instrument) direct, formative,
internal, comparativeImprove student performance on the MPA Oral Comprehensive Examination
MPA Oral Comprehensive Examination (summative, internal): Percent who pass on initial attempt
Data for the Initial MPA Oral Comprehensive Examination Pass Rate for the Fall 2020 semester is 90%.
Some students struggle with fully addressing competencies and synthesizing concepts and information across courses. Apparently the result of lack of sufficient preparation. The number and percentage of students who do so, however, is low (14%) and reflects lack of sufficient preparation
During the past two years there has been increased emphasis in the capstone PA602 on exam preparation. While a stumbling block for some students continues to be preparation, overall students did very well on the MPA Oral Comprehensive Examination. Guided by the idea that lack of preparation is associated with lack of familiarity with the exam process, a one-page description of the MPA Oral Exam process is distributed to all students in the PA602 capstone class. To further facilitate students on the exam, the MPA competencies list was reformated to be more reader-friendly and also made available to students in PA602 (among other changes, it was color-coded to help students distinguish between area concentration competencies). Further, the MPA Oral Comprehensive Examination is increasingly provided via Zoom. Students who reside in the region are given the choice of taking the exam face-to-face or via Zoom and the latter is
Number and Percent Passing MPA Oral Comprehensive Examiniation on Initial Attempt: Fall 2020, 18/20, 90% (Note: This is higher than the grand mean of 84% over the prior two years)
Improve student performance on the MPA Oral Comprehensive Examination
Oral Comprehensive Examination (summative, internal): Percent who are awarded Pass with Distinctiion.
Only those who pass upon the initial attempt are eligible to Pass with Distinction. 22% of students passed with distinction. This is somewhat higher than the 14% who passed with distincition in Spring 2019.
A higher percentage of students passed with distinction relative to the prior semester (F'19 compared to S'19). Combined with a higher initial pass rate (discussed above) the activities to provide students a description of the examination process, greater focus on the exam in PA602 and a more reader-friendly list of MPA exam competencies may have benefitted students.
Due to significant loss of staff support the Hauptmann School of Public Affairs will during this summer discuss either modifying or eliminating its MPA Oral Comprehensive Examinations. In the absence of any change (i.e., decision to maintain current system), outcomes will be monitored to assess if improvements noted here continue.
Number and Percent Passing MPA Oral Comprehensive Examination with Distinction: Fall 2020, 4/18, 22% (Note: This is an increase from the 14% who passed with distinction in Spring 2019)
Assess Student understanding of the public adminstration field in the absence of the MPA Oral Competency Examinatiion.(For Spring 2020 MPA Oral Comprehensive Examination waived; power point and summary essay used to guage student familiarity with the field).
Power Point and summary essay (summative, internal). (For Spring 2020 MPA Oral Comprehensive Examination waived; power point and summary essay used to guage student familiarity with the field).
All students provided and passed. Students successfully completed and submitted Power Point presenations and summary essay. Flexibility in completion time-frame was allowed due to pandemic.
Temporary measure due to pandemic. May or may not continue with this measure, as discussed above.
All students successfully completed power point and summary essay assignments
Notes: MPA Oral Comprensive Examination administered Fall 2019, waived for Spring 2020. For Spring 2020, student power point presentations and a final summary essay on their MPA experience were used to guage student understanding of the field.
Standard #4 Measurement and Analysis of Student Learning and Performance
Definition
Analysis of Results
Use this table to supply data for Criterion 4.2.
A student learning outcome is one that measures a specific competency attainment. Examples of a direct assessment (evidence) of student learning attainment that might be used include: capstone performance, third-party examination, faculty-designed examination, professional performance, licensure examination). Add these to the description of the measurement instrument in column two:Direct - Assessing student performance by examining samples of student workFormative – An assessment conducted during the student’s education.Summative – An assessment conducted at the end of the student’s education.Internal – An assessment instrument that was developed within the business unit.External – An assessment instrument that was developed outside the business unit.Comparative – Compare results between classes, between online and on ground classes, Between professors, between programs, between campuses, or compare to external results such as results from the U.S. Department of Education Research and Statistics, or results from a vendor providing comparable data.
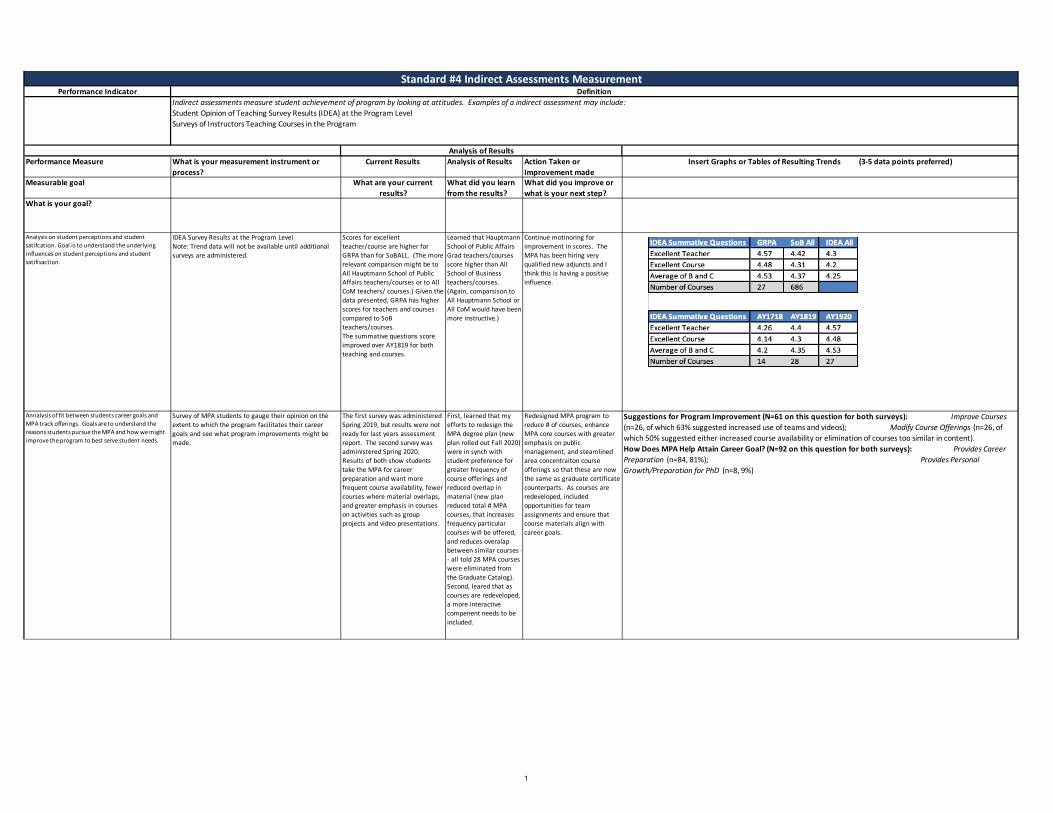
1
Performance Indicator
Performance Measure What is your measurement instrument or process?
Current Results Analysis of Results Action Taken or Improvement made
Insert Graphs or Tables of Resulting Trends (3-5 data points preferred)
Measurable goal What are your current results?
What did you learn from the results?
What did you improve or what is your next step?
What is your goal?
Analysis on student perceptions and student satifcation. Goal is to understand the underlying influences on student perceptions and student satifisaction.
IDEA Survey Results at the Program LevelNote: Trend data will not be available until additional surveys are administered.
Scores for excellent teacher/course are higher for GRPA than for SoBALL. (The more relevant comparison might be to All Hauptmann School of Public Affairs teachers/courses or to All CoM teachers/ courses.) Given the data presented, GRPA has higher scores for teachers and courses compared to SoB teachers/courses. The summative questions score improved over AY1819 for both teaching and courses.
Learned that Hauptmann School of Public Affairs Grad teachers/courses score higher than All School of Business teachers/courses. (Again, comparsison to All Hauptmann School or All CoM would have been more instructive.)
Continue motinoring for improvement in scores. The MPA has been hiring very qualified new adjuncts and I think this is having a positive influence.
Annalysis of fit between students career goals and MPA track offerings. Goals are to understand the reasons students pursue the MPA and how we might improve the program to best serve student needs.
Survey of MPA students to gauge their opinion on the extent to which the program facilitates their career goals and see what program improvements might be made.
The first survey was administered Spring 2019, but results were not ready for last years assessment report. The second survey was administered Spring 2020. Results of both show students take the MPA for career preparation and want more frequent course availability, fewer courses where material overlaps, and greater emphasis in courses on activities such as group projects and video presentations.
First, learned that my efforts to redesign the MPA degree plan (new plan rolled out Fall 2020) were in synch with student preference for greater frequency of course offerings and reduced overlap in material (new plan reduced total # MPA courses, that increases frequency particular courses will be offered, and reduces overalap between similar courses -- all told 28 MPA courses were eliminated from the Graduate Catalog). Second, leared that as courses are redeveloped, a more interactive compenent needs to be included.
Redesigned MPA program to reduce # of courses, enhance MPA core courses with greater emphasis on public management, and steamlined area concentraiton course offerings so that these are now the same as graduate certificate counterparts. As courses are redeveloped, included opportunities for team assignments and ensure that course materials align with career goals.
Suggestions for Program Improvement (N=61 on this question for both surveys): Improve Courses (n=26, of which 63% suggested increased use of teams and videos); Modify Course Offerings (n=26, of which 50% suggested either increased course availability or elimination of courses too similar in content). How Does MPA Help Attain Career Goal? (N=92 on this question for both surveys): Provides Career Preparation (n=84, 81%); Provides Personal Growth/Preparation for PhD (n=8, 9%)
Analysis of Results
Indirect assessments measure student achievement of program by looking at attitudes. Examples of a indirect assessment may include: Student Opinion of Teaching Survey Results (IDEA) at the Program LevelSurveys of Instructors Teaching Courses in the Program
DefinitionStandard #4 Indirect Assessments Measurement

Master of Information Systems and
Business Analytics
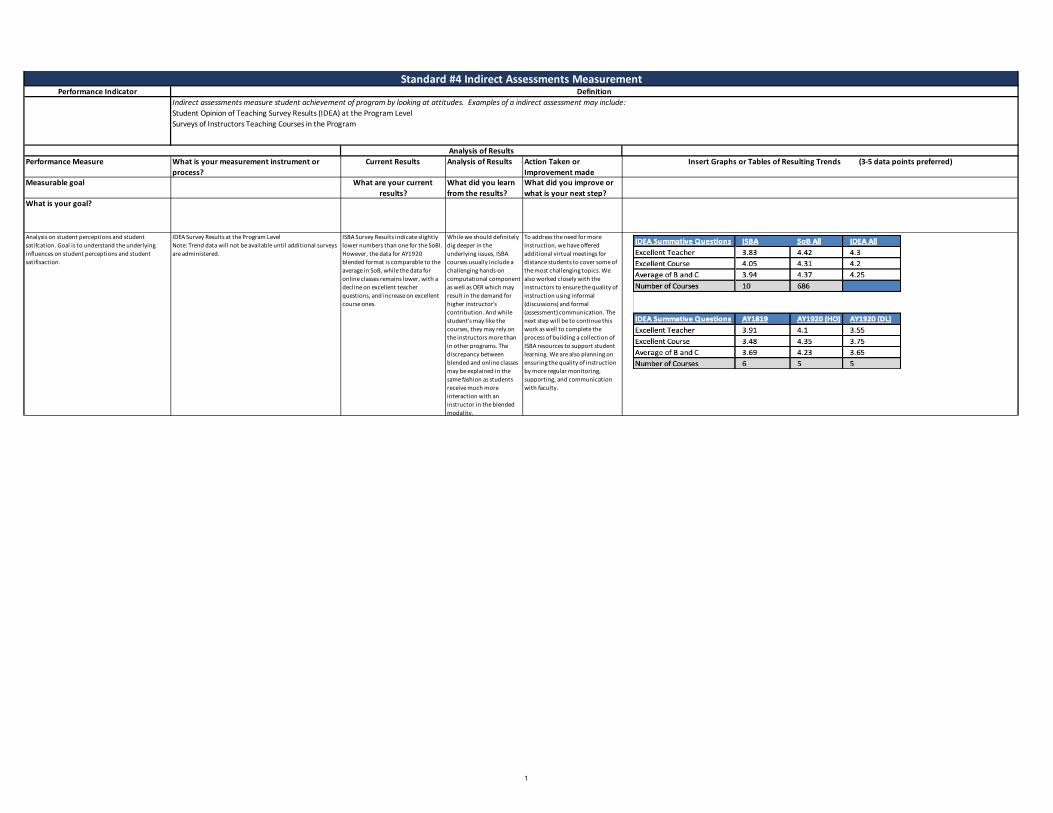
1
Performance Indicator
Performance Measure What is your measurement instrument or process?
Current Results Analysis of Results Action Taken or Improvement made
Insert Graphs or Tables of Resulting Trends (3-5 data points preferred)
Measurable goal What are your current results?
What did you learn from the results?
What did you improve or what is your next step?
What is your goal?
Analysis on student perceptions and student satifcation. Goal is to understand the underlying influences on student perceptions and student satifisaction.
IDEA Survey Results at the Program LevelNote: Trend data will not be available until additional surveys are administered.
ISBA Survey Results indicate slightly lower numbers than one for the SoBl. However, the data for AY1920 blended format is comparable to the average in SoB, while the data for online classes remains lower, with a decline on excellent teacher questions, and increase on excellent course ones.
While we should definitely dig deeper in the underlying issues, ISBA courses usually include a challenging hands-on computational component as well as OER which may result in the demand for higher instructor's contribution. And while student's may like the courses, they may rely on the instructors more than in other programs. The discrepancy between blended and online classes may be explained in the same fashion as students receive much more interaction with an instructor in the blended modality.
To address the need for more instruction, we have offered additional virtual meetings for distance students to cover some of the most challenging topics. We also worked closely with the instructors to ensure the quality of instruction using informal (discussions) and formal (assessment) communication. The next step will be to continue this work as well to complete the process of building a collection of ISBA resources to support student learning. We are also planning on ensuring the quality of instruction by more regular monitoring, supporting, and communication with faculty.
Analysis of Results
Indirect assessments measure student achievement of program by looking at attitudes. Examples of a indirect assessment may include: Student Opinion of Teaching Survey Results (IDEA) at the Program LevelSurveys of Instructors Teaching Courses in the Program
DefinitionStandard #4 Indirect Assessments Measurement