Embed Size (px)
Citation preview
Journal of Business Finance & Accounting, 36(1) & (2), 51–72, January/March 2009, 0306-686Xdoi: 10.1111/j.1468-5957.2008.02118.x
Accruals Quality, Information Risk andCost of Capital: Evidence from Australia
Philip Gray, Ping-Sheng Koh and Yen H. Tong∗
Abstract: Recent theoretical work argues that information risk is a non-diversifiable risk factorthat is priced in the capital market. Using accruals quality to proxy for information risk, Franciset al. (2005) provide empirical support for this argument using a sample of US firms. This paperre-examines the interplay of accruals quality, information risk and cost of capital in Australia,where a number of important institutional and regulatory differences are hypothesized to affectthe relation between accruals quality and cost of capital. The results suggest that, while accrualsquality impacts on the cost of capital for Australian firms, some salient differences exist. Incontrast to findings for US firms, the costs of debt and equity for Australian firms are largelyinfluenced by accruals quality arising from economic fundamentals (i.e., innate accrual quality)but not discretionary reporting choices (i.e., discretionary accrual quality). This finding isconsistent with our predictions based on the Australian institutional and regulatory environment.In addition, using both the asset pricing tests in Francis et al. (2005) and Core et al. (2008), weprovide evidence consistent with accruals quality being a priced risk factor.
Keywords: accruals quality, information risk, cost of capital, information asymmetry, informationprecision, discretionary, innate
1. INTRODUCTION
Recent theoretical work posits that information risk is a non-diversifiable risk factorthat is priced by the capital market. Several explanations have been given for thecause of information risk. In a multi-asset rational expectations framework, Easleyand O’Hara (2004, hereafter EOH) analyze the role of information asymmetry amonginvestors in the determination of cost of capital. In their model, less-informed investorsrecognize their informational disadvantage to more-informed investors. Accordingly,they demand a return premium for firms with a higher degree of informationasymmetry (i.e., a higher level of information risk). In contrast, Lambert et al. (2007)
∗The authors are respectively from UQ Business School, University of Queensland, Australia; Department ofAccounting, Hong Kong University of Science and Technology, Hong Kong; and Nanyang Business School,Nanyang Technological University, Singapore. They are grateful for the comments and suggestions of ananonymous referee, Peter F. Pope (editor), Neil Fargher, Egon Kalotay, Michael O’Brien and seminarparticipants at Macquarie University. (Paper received June 2007, revised version accepted October 2008)
Address for correspondence: Ping-Sheng Koh, Department of Accounting, Hong Kong University of Scienceand Technology, Clear Water Bay, Kowloon, Hong Kong.e-mail: [email protected]
C© 2008 The AuthorsJournal compilation C© 2008 Blackwell Publishing Ltd, 9600 Garsington Road, Oxford OX4 2DQ, UKand 350 Main Street, Malden, MA 02148, USA. 51
52 GRAY, KOH AND TONG
(hereafter LLV) argue that, in models with perfect competition, it is the precision ofinformation (rather than information asymmetry per se) that is the key determinant ofinformation risk which affects cost of capital. LLV (2007) define information precisionas the average quality of information that investors have on the expected cash flows ofthe firm, and information asymmetry as the difference in precision across investors.As such, LLV argue that it is not the distribution of information across investors thatmatters, but more so how precise that information is.1
Despite their different perspectives, the models of EOH (2004) and LLV (2007)share some common ground. EOH (2004) recognize an important role for informationprecision in reducing the cost of capital by mitigating the systematic risk arisingfrom information asymmetry across informed and uninformed investors. LLV (2007)acknowledge a cost of capital role for information asymmetry when competition isimperfect. Irrespective of the source of information risk, the theoretical models of bothEOH (2004) and LLV (2007) predict that equilibrium asset prices are influenced byinformation risk and that information risk may contribute to cross-sectional differencesin firms’ required return.2
Francis et al. (2005) (hereafter FLOS) provide empirical support for the associationbetween information risk and the cost of capital. Using the quality of accruals as a proxyfor information risk, FLOS (2005) report that US firms with poorer accruals quality(AQ) exhibit higher costs of debt and equity capital than firms with better AQ. Further,FLOS (2005) partition AQ into components that reflect economic fundamentals(innate AQ) and managerial reporting choices (discretionary AQ) and show that, whileboth components are associated with cost of capital, the former has the greater effect.
From an asset-pricing perspective, FLOS (2005) argue that information risk is apriced risk factor. Using the time-series regression approach of Fama and French(1993), they document a significant positive loading on an AQ-based factor-mimickingportfolio. Recently, however, Core et al. (2008) (hereafter CGV) suggest that a better-specified test of whether a proposed risk factor is priced requires a two-stage cross-sectional regression (2SCSR) method. Using the 2SCSR approach, CGV find noevidence that AQ is a priced risk factor. Nonetheless, subsequent empirical work byKim and Qi (2008) and Ogenva (2008) attribute CGV’s lack of findings to the impact ofstocks with low share price and negative cash flow shocks respectively.3 After controlling
1 In a recent study, Bhattacharya et al. (2008) provide evidence consistent with both a direct path fromearnings quality (which proxies for information precision) to the cost of capital, and an indirect path thatis mediated by information asymmetry, with the direct path as the dominant factor. Their evidence is thusconsistent with both the EOH’s (2004) and LLV’s (2007) theoretical models on the association betweeninformation risk and cost of capital.2 Unlike EOH (2004) and LLV (2007), Hughes et al. (2007) do not find theoretical support for cross-sectionaleffect of information asymmetry on cost of capital. Hughes et al. (2007) demonstrate analytically that in largeeconomies characterized by large number of risky assets and related private signals, private information canaffect market-wide factor risk premium but does not affect cost of capital in the cross-section. However,Hughes et al. (2007) point out that their analytical model is silent on the choice of systematic risk factors.Therefore, their theory is not inconsistent with studies that presume an existence of a systematic ‘informationrisk’ factor (e.g., FLOS, 2005; and Aboody et al., 2005).3 Kim and Qi (2008) find the AQ risk factor is statistically and economically priced in the US after theexclusion of low-priced stocks. Further, they show that the AQ risk premium is associated with fundamentalrisks related to macroeconomic conditions and firms’ economic activities. Ogneva (2008) hypothesizes thatCGV’s (2008) result arises because poor accrual quality firms experience negative cash flow shocks in thefuture, which results in negative returns that offset the higher expected returns for such firms. Using the2SCSR approach, she finds AQ is priced after controlling for the effects of cash flow shocks.
C© 2008 The AuthorsJournal compilation C© Blackwell Publishing Ltd. 2008
ACCRUALS QUALITY, INFORMATION RISK AND COST OF CAPITAL 53
for these characteristics, Kim and Qi’s (2008) and Ogneva’s (2008) results support thenotion of FLOS (2005) that AQ is priced risk factor.
The theoretical work of EOH (2004) and LLV (2007), along with the empiricalfindings of FLOS (2005), CGV (2008) and others, motivate the current study whichexamines the interplay of AQ, information risk and cost of capital for Australianfirms. The Australian regulatory and institutional environment provides an interestingsetting in which to further explore the market pricing of AQ for two importantreasons. First, relative to US firms, Australian firms are significantly more reliant onprivate debt compared to public debt.4 Private lenders typically have more privilegedaccess to the financial and business information of the borrowing firm than dopublic debt lenders. Hence, the level of information asymmetry across debt holdersis likely to be lower in Australia compared to the US. In addition, private lendersare more likely than public lenders to perform a monitoring role through theirclose relations with borrowing firms, thereby mitigating managerial opportunism infinancial reporting. The more privileged access to information and closer monitoringby private lenders increase information precision and mitigate information asymmetry.Therefore, the information risk associated with discretionary reporting by managersis likely to be reduced, thus diminishing the effect of discretionary AQ on the cost ofdebt. Accordingly, while FLOS (2005) report that both innate and discretionary AQsignificantly affect the cost of debt, we expect that innate AQ is likely to dominate theAQ effect on Australian firms’ cost of debt while discretionary AQ is likely to have anegligible effect.
Second, over the period examined in this paper, Australian firms are subject to acontinuous disclosure regime (CDR) designed to increase the quality and timelinessof corporate disclosure to the public. The CDR requires listed firms to immediatelydisclose price-sensitive information to the public via the Australian Stock Exchangewhen firms become aware of the information. Selective disclosure to third partiessuch as analysts is strictly prohibited.5 A regulatory environment characterized bynon-selective disclosure of timely and high-quality information to capital marketsis likely to mitigate the opportunities and incentives for managerial discretion infinancial reporting. This serves to reduce information asymmetry across investors andincrease the average precision of information on the firms’ expected cash flows. Thisreduction in overall information risk provides a second reason why the relation betweendiscretionary AQ and cost of capital for Australian firms may differ from that previouslyreported for US firms by FLOS (2005).
The results of this paper suggest that AQ is priced by both the debt and equitymarkets in Australia. While, in general, we document similar relations to those reportedby FLOS (2005) for US firms, salient differences exist. Specifically, we report thattotal AQ is not associated with cost of debt. However, when total AQ is partitionedinto innate and discretionary AQ components, cost of debt is significantly influenced
4 Between 1998 and 2006, public debt ranges between 7.8% and 12.3% of total non-government debtsecurities issued in Australia (statistics computed based on data available on Reserve Bank of Australia’swebsite, http://www.rba.gov.au/Statistics/Bulletin/index.html). Similarly, Cotter (1998) documents thatpublic debt issues make up less than 5% of total debt outstanding in her sample of Australian firms.5 In the US, Regulation Fair Disclosure (RegFD) focuses on the fair access to information by marketparticipants. That is, if a firm chooses to disclose pertinent information, such information must be disclosedto all parties and selective disclosure is not allowed. Unlike RegFD, the Australian CDR not only prohibitsselective disclosure, but also requires firms to disclose all price-sensitive information once such informationis known – non-disclosure of such information is not an option.
C© 2008 The AuthorsJournal compilation C© Blackwell Publishing Ltd. 2008
54 GRAY, KOH AND TONG
by a firm’s innate AQ. This lack of relation between discretionary AQ and cost ofdebt is consistent with our argument that the heavy reliance of Australian firms onprivate debt reduces information risk related to discretionary AQ, and consequentlythe influence of discretionary AQ on cost of debt. Similar to US findings with respectto cost of equity, we provide evidence that total AQ is significantly related to the costof equity. However, unlike FLOS (2005), we find that this association is driven solely bythe innate component of AQ, with no evidence that discretionary AQ impacts cost ofequity.
Overall, this study contributes to extant accounting and finance literature in severalways. First, our results support the theoretical argument that equilibrium asset prices areinfluenced by information risk and that information risk contributes to cross-sectionaldifferences in firms’ costs of capital (e.g., EOH, 2004; O’Hara, 2003; and LLV, 2007).Consistent with FLOS (2005), our results suggest that information risk proxied by AQis positively related to costs of debt and equity; specifically, poorer accruals quality isassociated with higher costs of capital.
Second, our study is amongst the first to examine the effects of accruals quality on thecost of capital for non-US firms. In light of the Australian regulatory and institutionalenvironment, our study demonstrates that different settings can lead to differences inthe pricing of reporting quality. Unlike FLOS (2005), who find that both innate anddiscretionary AQ are significantly associated with cost of capital in the US, we findthat the association between accruals quality and cost of capital for Australian firmsis driven solely by innate AQ. We attribute this difference in findings to the greaterreliance on private debt (as opposed to public debt) and the requirements of thecontinuous disclosure regime in Australia.
Finally, the paper sheds further light on the issue of whether AQ is a priced riskfactor. In contrast to the findings in CGV (2008), our results using the 2SCSR approachindicate that AQ is a priced risk factor for Australian firms. This conclusion is consistentwith concurrent studies by Kim and Qi (2008) and Ogneva (2008) using US data. Ourfindings, therefore, contribute to the growing body of empirical work that suggests thatAQ is a priced risk factor.
The remainder of the paper is structured as follows. In Section 2, we develop ourhypotheses on the pricing of accruals quality based on the theoretical models of EOH(2004) and LLV (2007). We also note how the Australian institutional and regulatoryenvironment is likely to impact on the relation between AQ, information risk and thecost of capital. Section 3 outlines the empirical methodology and sample selection. Inparticular, it describes the procedures to measure AQ and partition total AQ into innateand discretionary components. Furthermore, Section 3 also introduces the models usedto assess the relation between AQ and the costs of debt and equity capital. Section 4reports the empirical findings of the study. Section 5 discusses the findings of sensitivityanalysis and Section 6 concludes the paper.
2. HYPOTHESIS DEVELOPMENT
The link between the quality of financial reporting and information risk has been thefocus of several recent empirical papers (e.g., FLOS, 2005; Aboody et al., 2005; and Chenet al., 2007). These studies rely on theoretical models which suggest that informationrisk is non-diversifiable and may be priced by the market. For example, EOH (2004)and LLV (2007) argue that accounting information pertaining to a firm’s expected
C© 2008 The AuthorsJournal compilation C© Blackwell Publishing Ltd. 2008
ACCRUALS QUALITY, INFORMATION RISK AND COST OF CAPITAL 55
cash flows, amongst other things, affects the information environment surroundingthat firm’s equilibrium stock returns.
EOH (2004) investigate the behavior of investors (both informed and uninformed)in response to the proportion and precision of private and public information.They argue that the information asymmetry arising from higher levels of privateinformation increases the risk faced by less-informed investors compared to more-informed investors. This information risk is non-diversifiable prompting less-informedinvestors to demand higher returns on stocks with greater private information. Inaddition, EOH (2004) note the role of the precision of accounting information inreducing the cost of capital by mitigating the information risk faced by uninformedinvestors arising from the information asymmetry across investors.
LLV (2007) analytically demonstrate that information precision directly affectsequilibrium prices when capital markets are characterized by perfect competitionamong investors (a condition which EOH’s model assumes). LLV (2007) defineinformation precision as the quality of information on a firm’s expected cash flowsavailable to investors. In their model, the investor’s average information precision isa key determinant of the firm’s expected return, and therefore its cost of capital.In summary, the theoretical models of EOH (2004) and LLV (2007) both predict thatinformation risk is non-diversifiable and firms with higher information risk have highercost of capital.
FLOS (2005) empirically examine whether information risk, proxied by theprecision of public information, is priced by the capital markets. While cash flow isregarded as the primitive element of earnings relevant to valuation and risk assessment,earnings are widely believed to convey information about future cash flows. Further,the accrual component of earnings is subject to greater uncertainty than the cash flowcomponent.6 Accordingly, FLOS (2005) argue that, the higher the quality of accruals,the better earnings map into cash flows and hence, the lower the information risk andconsequently the cost of capital. Consistent with this argument, FLOS (2005) reportevidence that US firms with poorer AQ have higher costs of debt and equity capital.
Our first hypothesis, therefore, examines whether there is an association betweenAQ and the cost of capital. Specifically, we test the following hypothesis:
H1: The cost of capital for firms with poorer accruals quality is higher than for firms withbetter accruals quality.
We examine the relation of AQ with both the cost of debt and equity capital. To theextent that AQ captures information risk, and that information risk is priced by themarket, we expect to find evidence consistent with H1.
While the theoretical models in EOH (2004) and LLV (2007) do not differentiatebetween possible alternate sources of information risk, FLOS (2005) follow the leadfrom earnings management literature whereby the financial reporting outcome canbe partitioned into innate and discretionary components (see, for example, Guayet al., 1996; and Subramanyam, 1996). FLOS (2005) argue that accruals quality can beinfluenced by economic fundamentals (i.e., innate AQ) and management reportingchoices on accounting policies and estimates (i.e., discretionary AQ). It is plausible
6 FLOS (2005, p. 301) note that, while cash flows are actually realized, accruals are the product of judgments,estimations and allocations.
C© 2008 The AuthorsJournal compilation C© Blackwell Publishing Ltd. 2008
56 GRAY, KOH AND TONG
that these components of accrual quality have differential effects on information riskand consequently the cost of capital.
FLOS (2005) discuss three possible subcomponents of discretionary AQ andtheir respective effects on information risk. The performance subcomponent ariseswhen management uses accruals to enhance the ability of earnings to faithfullyreflect firm performance. Hence, the performance subcomponent is expected toreduce information risk. In contrast, the opportunistic and noise subcomponents ofdiscretionary AQ are likely to exacerbate information risk. While the net effect ofthese three subcomponents of discretionary AQ is uncertain, FLOS (2005) predictthat innate and discretionary AQ will have differential relations with information risk.Their empirical results suggest that the cost of capital effect of discretionary AQ issmaller in both magnitude and statistical significance than that for innate AQ.
Along these lines, our second hypothesis examines the relation between the cost ofcapital and the innate and discretionary components of total AQ:
H2: Innate accruals quality has a greater effect on cost of capital than discretionaryaccruals quality.
As with H1, H2 is examined separately for both the cost of debt and equity capital. WhileH2 is identical to the hypothesis tested by FLOS (2005), differences between the USand Australian regulatory and institutional environment motivate its re-examinationin our study. As noted in the introduction, Australian firms are more reliant on privatedebt. Private lenders are likely to have more privileged access to business informationcompared to public debt lenders. Relative to public debt lenders, private lenders arealso likely to monitor firms more closely because of their closer relations with theborrowing firms. To the extent that both effects mitigate opportunistic managerialbehavior in relation to discretionary reporting choices, information risk will be reducedas a result of the higher information precision and lower information asymmetry, aswell as enhancement in the performance subcomponent of discretionary reportingchoices. Further, the non-selective disclosure of high-quality and timely information tothe public under the continuous disclosure regime (CDR) in Australia may also mitigateopportunistic managerial discretionary reporting and enhance the performancemeasurement aspect of financial reporting.7 Both the greater dependence on privatedebt and the CDR in Australia are likely to reduce the information risk associated withdiscretionary AQ arising from managerial reporting choices. Therefore, we expect thatthe costs of capital effects arising from information risk in Australia are much morelikely to be observed for the innate rather than the discretionary component of AQ.
3. METHODOLOGY AND SAMPLE SELECTION
(i) Estimating Accruals Quality and its Components
The empirical analysis requires a metric of AQ and its partition into innate anddiscretionary components. We adopt the approach developed in Dechow and Dichev(2002) to capture the precision of financial statement information. The Dechow-Dichev
7 Using a sample of UK firms in the information technology industry, Gietzmann and Ireland (2005) provideempirical evidence consistent with the prediction that timelier disclosure is associated with lower cost of capital.
C© 2008 The AuthorsJournal compilation C© Blackwell Publishing Ltd. 2008
ACCRUALS QUALITY, INFORMATION RISK AND COST OF CAPITAL 57
model recognizes that the timing of a firm’s economic achievements and sacrificesoften differs from the timing of the related cash flows. The role of accruals, therefore,is to adjust for these cash flow timing problems. Accordingly, the Dechow and Dichev(2002) model captures these timing differences by including leading and lagging cashflows in their accruals model (in addition to contemporaneous cash flows). We adoptMcNichols’ (2002) modification of Dechow-Dichev model as follows:
TCA j,t = α0 + α1CFO j,t−1 + α2CFO j,t + α3CFO j,t+1 + α4�REV j,t + α5PPE j,t + εj,t , (1)
where, for firm j, TCAj,t is total current accruals in year t measured as income beforedepreciation and amortization minus operating cash flow, CFOj,t is cash flow fromoperations in year t, �REV j,t is change operating revenue between year t − 1 and yeart, PPE j,t is gross property, plant and equipment in year t. All variables are scaled byaverage total assets measured over year t − 1 and t.
In each year, model (1) is estimated cross-sectionally within industry groupings givenby four-digit GICS codes. A minimum of 10 firm observations within an industry arerequired. Using the estimated industry-year coefficients, firm-year specific residuals(ε j,t) are calculated. Our proxy for AQ is the standard deviation of a given firm’sresiduals over the past five years; that is, AQj,t = stdev(ε j,t), t = t − 5, . . . , t − 1.8
Intuitively, since ε j,t captures the estimation error in the mapping of accruals to cashflows, larger (smaller) values of AQ indicate poorer (better) accruals quality.9
To partition total AQ into innate and discretionary components, we follow Dechowand Dichev (2002) and FLOS (2005) by adopting five innate variables that affectaccruals quality (firm size, standard deviation of cash flows from operations, standarddeviation of sales revenues, length of operating cycle and incidence of negative earningsrealization). Dechow and Dichev (2002) suggest that these five innate variables captureeconomic fundamentals, as opposed to managerial discretion, that drive accrualsquality. The innate and discretionary components of AQ follow from annual cross-sectional estimation of the following model:
AQ j,t = φ0 + φ1SIZE j,t + φ2σ(CFO) j,t + φ3σ(Sales) j,t
+ φ4OpCycle j,t + φ5NegEarn j,t + ν j,t , (2)
where firm size (SIZE) is measured as the natural log of total assets, standard deviation ofcash flows from operations (σ(CFO)) is measured over the previous five years, standarddeviation of sales revenues (σ(Sales)) is measured over the previous five years, lengthof operating cycle (OpCycle) measured as log of the sum of days accounts receivableand days inventory, and the incidence of negative earnings realization (NegEarn) ismeasured by the number of years out of the last five with negative reported incomebefore extraordinary items. The predicted values from model (2) proxy for the innateportion of accruals quality (InnateAQ), while the residuals proxy for discretionaryaccruals quality (DiscAQ).10
8 Calculating the AQ measure in year t using firm-specific residuals in year t − 5 to year t − 1 eliminates theneed for future CFO measures in the estimation process.9 To avoid confusion over this terminology, we will use the terms better (poorer) accruals quality ratherthan lower (higher) accruals quality.10 An alternate approach to estimating DiscAQ is explored in Section 5.
C© 2008 The AuthorsJournal compilation C© Blackwell Publishing Ltd. 2008
58 GRAY, KOH AND TONG
(ii) AQ and Cost of Debt
Our proxy for the cost of debt (CostDebt) is interest expense divided by the averagetotal debt. The relation between AQ and cost of debt is examined using a regressionmodel that controls for other factors known to affect the cost of debt. Specifically, wecontrol for financial leverage, firm size, return on assets, interest coverage and earningsvolatility (Kaplan and Urwitz, 1979; and Palepu et al., 2000). The regression is as follows:
CostDebt j,t = γ0 + γ1Leverage j,t + γ2Size j,t + γ3ROA j,t + γ4IntCov j,t
+ γ5σ(NIBE) j,t + γ6AQrank j,t + μ j,t , (3)
where Leverage is the ratio of total debt to total assets, Size is the natural log of total assets,ROA is return on assets, IntCov is the ratio of operating income to interest expense andσ(NIBE) is the standard deviation of net income before extraordinary items, scaled byaverage assets, over the past five years. Consistent with FLOS (2005), we use firm j’sdecile rank of AQ rather than the raw AQ score. Using decile rank controls for outliersand non-linearity, and facilitates interpretation of the economic magnitude of the costof capital effect. The estimated coefficient on AQrank captures the accruals qualityeffect on cost of debt that is incremental to the control factors. All else equal, if lendersview firms with poorer AQ as riskier than firms with better AQ, there will be a positiveassociation between CostDebt and AQrank.
(iii) AQ and Cost of Equity
Following FLOS (2005), we use an industry-adjusted earnings-to-price ratio (IndEP)to proxy for cost of equity. Specifically, IndEP is the firm’s earnings-price ratio for aparticular year less the median earnings-price ratio of all firms with the same 4-digitGICS industry code. We use the following model to examine the relation between AQand cost of equity:
IndEP j,t = δ0 + δ1Growth j,t + δ2Leverage j,t + δ3Beta j,t
+ δ4Size j,t + δ5AQrank j,t + ζ j,t , (4)
where Growthj,t is the natural log of one plus the firm’s growth in book value of equityover the past five years, Betaj,t is the CAPM firm-specific beta estimated using rollingfive-year regressions (for firms with at least 18 monthly returns). All other variablesare as previously defined. The estimated coefficient on AQrank captures the accrualsquality effect on cost of equity that is incremental to the control factors. All else equal,if investors view firms with poorer AQ as riskier than firms with better AQ, there will bea positive association between IndEP and AQ.
(iv) Asset Pricing Tests
We use two approaches to examine whether AQ is a priced risk factor. The first approachis based on FLOS (2005), who document statistically significant loadings on a factor-mimicking portfolio constructed to capture accruals quality. Consistent with FLOS(2005) and in the spirit of the Fama and French (1993) analysis of size and book-to-market factors, we form an AQ factor-mimicking portfolio equal to the difference
C© 2008 The AuthorsJournal compilation C© Blackwell Publishing Ltd. 2008
ACCRUALS QUALITY, INFORMATION RISK AND COST OF CAPITAL 59
between the monthly returns to the best two AQ quintiles and the worst two AQquintiles. Portfolios are re-formed on a monthly basis using the most-recent AQ measureto accommodate inter-temporal changes in accruals quality and differences in firms’financial year ends. The following asset-pricing model is estimated:
Rj,t − R f,t = α j + β j,MRP(Rm,t − R f,t
) + β j,SMBSMBt
+ β j,HMLHMLt + β j,AQAQfactor t + ε j,t , (5)
where Rj,t , Rf ,t and Rm,t are the time t returns on stock j, the risk-free asset and themarket portfolio respectively, SMB and HML are the Fama-French size and book-to-market factors respectively, and AQfactor is the accrual quality factor. Model (5)represents the common three-factor asset-pricing model augmented by the AQ factor.FLOS (2005) interpret a significant estimate of β j,AQ as support for the notion that AQis priced.
Our second approach relies on CGV (2008) who argue that documenting acontemporaneous relation between the returns on assets and the AQ factor-mimickingportfolio (i.e., by the significance of β j,AQ in model 5) does not explicitly test thehypothesis that AQ is a priced risk factor. Rather, the positive coefficient from such atime-series regression merely indicates that, on average, firms have positive exposureto the AQ mimicking factor.11
Following Cochrane (2005), CGV suggest that a better-specified test of whethera proposed factor is priced requires a two-stage cross-sectional regression (2SCSR)approach.12 Rather than implementing the 2SCSR approach on individual stockreturns, we follow the majority of the empirical asset-pricing literature by using thereturns on 25 portfolios cross-sorted on size and book-to-market ratio. The 25 portfoliosare formed using a procedure identical to that of Fama and French (1993).13 In stage 1,factor betas are estimated using time-series regressions of excess portfolio returns onthe contemporaneous returns of proposed risk factors as shown in model (5). Stage 2then estimates a cross-sectional regression of the mean excess portfolio returns on thefactor betas estimated in model (5):
R̄ p,t − R̄ f,t = λ0 + λ1β̂p,MRP + λ2β̂p,SMB + λ3β̂p,HML + λ4β̂p,AQ + up,t (6)
where R̄ p,t − R̄ f,t is the time-series mean excess return for portfolio p, β̂p,MRP is themarket factor beta, β̂p,S MB is the size factor beta, β̂p,HMLis the book-to-market factorbeta, and β̂p,AQ is the AQ factor beta derived from estimating model (5) in stage 1using portfolio returns. This approach examines whether AQ is a priced risk factor,after controlling for the three Fama-French (1993) factors. Specifically, λ4 will havea significant positive coefficient if AQ is priced. Standard errors are calculated usingShanken’s (1992) correction to reflect the fact that the independent variables in thecross-sectional model (6) are estimated in Stage 1 (i.e., they are ‘generated regressors’).
11 Using a familiar analogy, CGV (2008, p. 3) note that a positive coefficient in a contemporaneous regressionof stock returns on the market portfolio does not imply that beta is priced, but simply confirms that the averagebeta in a random sample of firms is positive and mechanically close to one.12 The 2SCSR approach has been widely used to test asset pricing models. For example, in testing theCAPM (Fama and MacBeth, 1973), the conditional CAPM (Brennan et al., 2004; and Petkova, 2006), andthe two-beta model (Campbell and Vuolteenaho, 2004)13 We sincerely thank Michael O’Brien for supplying these SIZE/BM portfolio returns. Details of theportfolio formation procedure are outlined in O’Brien, Brailsford and Gaunt (2008).
C© 2008 The AuthorsJournal compilation C© Blackwell Publishing Ltd. 2008
60 GRAY, KOH AND TONG
(v) Sample Selection
As AASB1026 Statement of Cash Flows came into effect in 1992, we restrict our initialsample to post-1992 so that the cash flows from operations can be measured directlyfrom the Statement of Cash Flows.14 Accounting data for the study are drawn fromthe Aspect FinAnalysis database for the period 1992–2005. To be included in the samplefor a given year, a firm must have at least seven years of financial data to compute theAQ measure (model 1), in addition to the financial data to compute the five innatevariables that proxy for economic fundamentals driving AQ (model 2). These datarequirements restrict our final sample period from 1998 to 2005. In order to constructthe AQfactor used in the asset-pricing tests (model 5), we also require returns data whichresults in a base sample of 736 firms from 1998–2006. The estimation of models (3)and (4) imposes further data requirements for the control variables. The final sampleis 509 firms (2,057 firm-year observations) for the cost of debt model (3) and 346 firms(1,362 firm-year observations) for the cost of equity model (4).
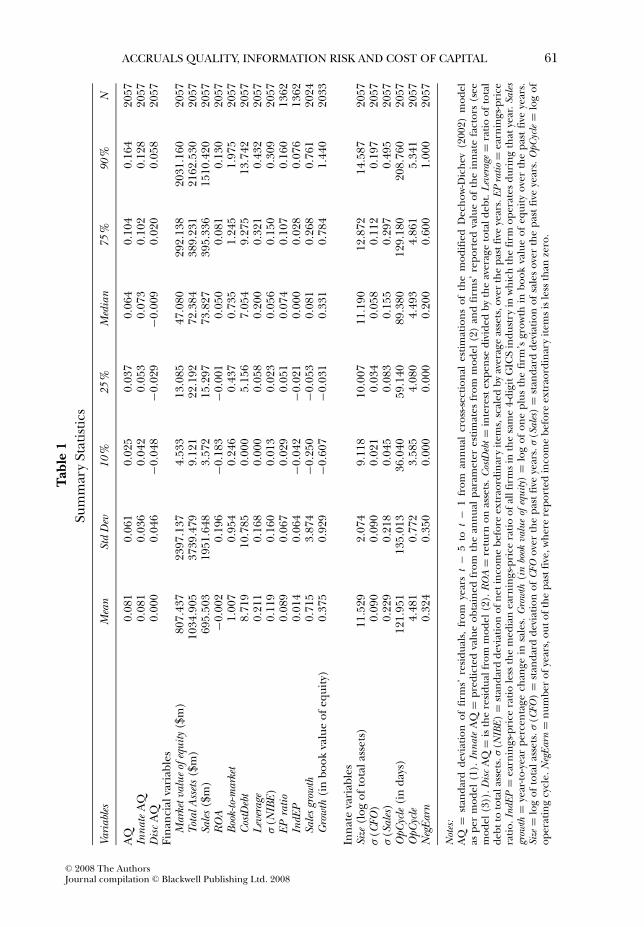
Table 1 provides descriptive statistics on the variables used in the empirical analysis.The distribution of AQ has a mean of 0.081, but exhibits significant dispersion with astandard deviation of 0.061. FLOS (2005) report lower mean AQ of 0.044, which maybe attributable to their larger sample. Recall that model (1) is fitted each year on aper industry basis, with AQ measured as the standard deviation of the fitted residuals.With significantly fewer sample firms per year per industry than in FLOS (2005), it isdifficult to achieve a tight fit, which manifests itself in the AQ metric.
4. RESULTS AND DISCUSSION
(i) Relation Between AQ and Economic Fundamentals
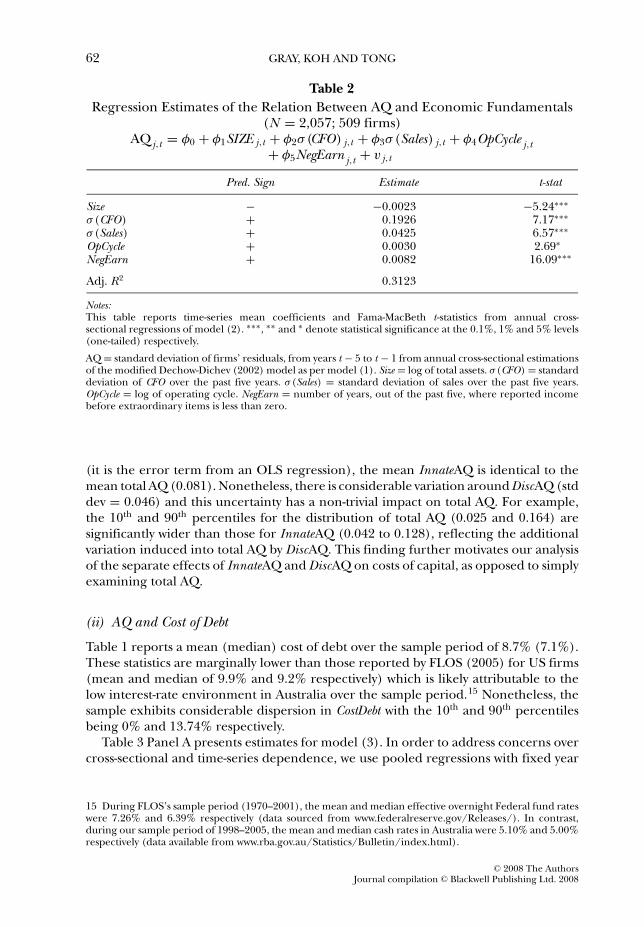
The partition of total AQ into innate and discretionary components is based onmodel (2) which models total AQ as a function of five variables reflecting economicfundamentals. Table 2 reports the time-series mean coefficient estimates and theassociated Fama and MacBeth (1973) t-statistics from the annual cross-sectionalregressions over the period 1998–2005.
The estimated coefficient on each of the five variables has the predicted sign and isstatistically significant at the 5% level or better. Specifically, firm size is negatively relatedwith AQ, while the remaining variables are positively related. It is important to recallthat AQ is measured as the standard deviation of the error term from model (1); hence,a ‘high’ AQ score reflects poor quality accruals and vice versa. The average goodness-of-fit of the cross-sectional regressions exceeds 30%. The current results, which are highlyconsistent with prior findings reported by Dechow and Dichev (2002) and FLOS (2005),suggest that the five innate variables are reasonable proxies for economic fundamentalsthat drive accruals quality.
For the subsequent analysis, the innate and discretionary components of AQ arederived from the fitted and error elements of model (2) respectively. Table 1 reportssummary statistics for InnateAQ and DiscAQ. Since by construction DiscAQ is mean zero
14 Hribar and Collins (2002) suggest that significant measurement errors arise when accruals and cash flowsfrom operations are measured from changes in balance sheet items, as opposed to accruals and cash flowsfrom operations measured using the cash flows statement.
C© 2008 The AuthorsJournal compilation C© Blackwell Publishing Ltd. 2008
ACCRUALS QUALITY, INFORMATION RISK AND COST OF CAPITAL 61T
able
1Su
mm
ary
Stat
istic
s
Vari
able
sM
ean
Std
Dev
10%
25%
Med
ian
75%
90%
N
AQ
0.08
10.
061
0.02
50.
037
0.06
40.
104
0.16
420
57In
nate
AQ
0.08
10.
036
0.04
20.
053
0.07
30.
102
0.12
820
57D
isc
AQ
0.00
00.
046
−0.0
48−0
.029
−0.0
090.
020
0.05
820
57Fi
nanc
ialv
aria
bles
Mar
ketv
alue
ofeq
uity
($m
)80
7.43
723
97.1
374.
533
13.0
8547
.080
292.
138
2031
.160
2057
Tota
lAss
ets
($m
)10
34.9
0537
39.4
799.
121
22.1
9272
.384
389.
231
2162
.530
2057
Sale
s($
m)
695.
503
1951
.648
3.57
215
.297
73.8
2739
5.33
615
10.4
2020
57R
OA
−0.0
020.
196
−0.1
83−0
.001
0.05
00.
081
0.13
020
57B
ook-
to-m
arke
t1.
007
0.95
40.
246
0.43
70.
735
1.24
51.
975
2057
Cos
tDeb
t8.
719
10.7
850.
000
5.15
67.
054
9.27
513
.742
2057
Lev
erag
e0.
211
0.16
80.
000
0.05
80.
200
0.32
10.
432
2057
σ(N
IBE
)0.
119
0.16
00.
013
0.02
30.
056
0.15
00.
309
2057
EPra
tio0.
089
0.06
70.
029
0.05
10.
074
0.10
70.
160
1362
IndE
P0.
014
0.06
4−0
.042
−0.0
210.
000
0.02
80.
076
1362
Sale
sgr
owth
0.71
53.
874
−0.2
50−0
.053
0.08
10.
268
0.76
120
24G
row
th(i
nbo
okva
lue
ofeq
uity
)0.
375
0.92
9−0
.607
−0.0
310.
331
0.78
41.
440
2033
Inna
teva
riab
les
Size
(log
ofto
tala
sset
s)11
.529
2.07
49.
118
10.0
0711
.190
12.8
7214
.587
2057
σ(C
FO)
0.09
00.
090
0.02
10.
034
0.05
80.
112
0.19
720
57σ
(Sal
es)
0.22
90.
218
0.04
50.
083
0.15
50.
297
0.49
520
57O
pCyc
le(i
nda
ys)
121.
951
135.
013
36.0
4059
.140
89.3
8012
9.18
020
8.76
020
57O
pCyc
le4.
481
0.77
23.
585
4.08
04.
493
4.86
15.
341
2057
Neg
Earn
0.32
40.
350
0.00
00.
000
0.20
00.
600
1.00
020
57
Not
es:
AQ
=st
anda
rdde
viat
ion
offir
ms’
resi
dual
s,fr
omye
ars
t−
5to
t−
1fr
oman
nual
cros
s-sec
tiona
les
timat
ions
ofth
em
odifi
edD
echo
w-D
iche
v(2
002)
mod
elas
per
mod
el(1
).In
nate
AQ
=pr
edic
ted
valu
eob
tain
edfr
omth
ean
nual
para
met
eres
timat
esfr
omm
odel
(2)
and
firm
s’re
port
edva
lue
ofth
ein
nate
fact
ors
(see
mod
el(3
)).D
isc
AQ
=is
the
resi
dual
from
mod
el(2
).R
OA
=re
turn
onas
sets
.Cos
tDeb
t=
inte
rest
expe
nse
divi
ded
byth
eav
erag
eto
tald
ebt.
Lev
erag
e=
ratio
ofto
tal
debt
toto
tala
sset
s.σ
(NIB
E)
=st
anda
rdde
viat
ion
ofne
tinc
ome
befo
reex
trao
rdin
ary
item
s,sc
aled
byav
erag
eas
sets
,ove
rth
epa
stfiv
eye
ars.
EPra
tio=
earn
ings
-pri
cera
tio.I
ndEP
=ea
rnin
gs-p
rice
ratio
less
the
med
ian
earn
ings
-pri
cera
tioof
allf
irm
sin
the
sam
e4-
digi
tGIC
Sin
dust
ryin
whi
chth
efir
mop
erat
esdu
ring
that
year
.Sal
esgr
owth
=ye
ar-to
-yea
rpe
rcen
tage
chan
gein
sale
s.G
row
th(i
nbo
okva
lue
ofeq
uity
)=
log
ofon
epl
usth
efir
m’s
grow
thin
book
valu
eof
equi
tyov
erth
epa
stfiv
eye
ars.
Size
=lo
gof
tota
lass
ets.
σ(C
FO)
=st
anda
rdde
viat
ion
ofC
FOov
erth
epa
stfiv
eye
ars.
σ(S
ales
)=
stan
dard
devi
atio
nof
sale
sov
erth
epa
stfiv
eye
ars.
OpC
ycle
=lo
gof
oper
atin
gcy
cle.
Neg
Earn
=nu
mbe
rof
year
s,ou
toft
hepa
stfiv
e,w
here
repo
rted
inco
me
befo
reex
trao
rdin
ary
item
sis
less
than
zero
.
C© 2008 The AuthorsJournal compilation C© Blackwell Publishing Ltd. 2008
62 GRAY, KOH AND TONG
Table 2Regression Estimates of the Relation Between AQ and Economic Fundamentals
(N = 2,057; 509 firms)AQ j,t = φ0 + φ1SIZE j,t + φ2σ(CFO) j,t + φ3σ(Sales) j,t + φ4OpCycle j,t+ φ5NegEarn j,t + v j,t
Pred. Sign Estimate t-stat
Size − −0.0023 −5.24∗∗∗
σ(CFO) + 0.1926 7.17∗∗∗
σ(Sales) + 0.0425 6.57∗∗∗
OpCycle + 0.0030 2.69∗
NegEarn + 0.0082 16.09∗∗∗
Adj. R2 0.3123
Notes:This table reports time-series mean coefficients and Fama-MacBeth t-statistics from annual cross-sectional regressions of model (2). ∗∗∗, ∗∗ and ∗ denote statistical significance at the 0.1%, 1% and 5% levels(one-tailed) respectively.
AQ = standard deviation of firms’ residuals, from years t − 5 to t − 1 from annual cross-sectional estimationsof the modified Dechow-Dichev (2002) model as per model (1). Size = log of total assets. σ(CFO) = standarddeviation of CFO over the past five years. σ(Sales) = standard deviation of sales over the past five years.OpCycle = log of operating cycle. NegEarn = number of years, out of the past five, where reported incomebefore extraordinary items is less than zero.
(it is the error term from an OLS regression), the mean InnateAQ is identical to themean total AQ (0.081). Nonetheless, there is considerable variation around DiscAQ (stddev = 0.046) and this uncertainty has a non-trivial impact on total AQ. For example,the 10th and 90th percentiles for the distribution of total AQ (0.025 and 0.164) aresignificantly wider than those for InnateAQ (0.042 to 0.128), reflecting the additionalvariation induced into total AQ by DiscAQ. This finding further motivates our analysisof the separate effects of InnateAQ and DiscAQ on costs of capital, as opposed to simplyexamining total AQ.
(ii) AQ and Cost of Debt
Table 1 reports a mean (median) cost of debt over the sample period of 8.7% (7.1%).These statistics are marginally lower than those reported by FLOS (2005) for US firms(mean and median of 9.9% and 9.2% respectively) which is likely attributable to thelow interest-rate environment in Australia over the sample period.15 Nonetheless, thesample exhibits considerable dispersion in CostDebt with the 10th and 90th percentilesbeing 0% and 13.74% respectively.
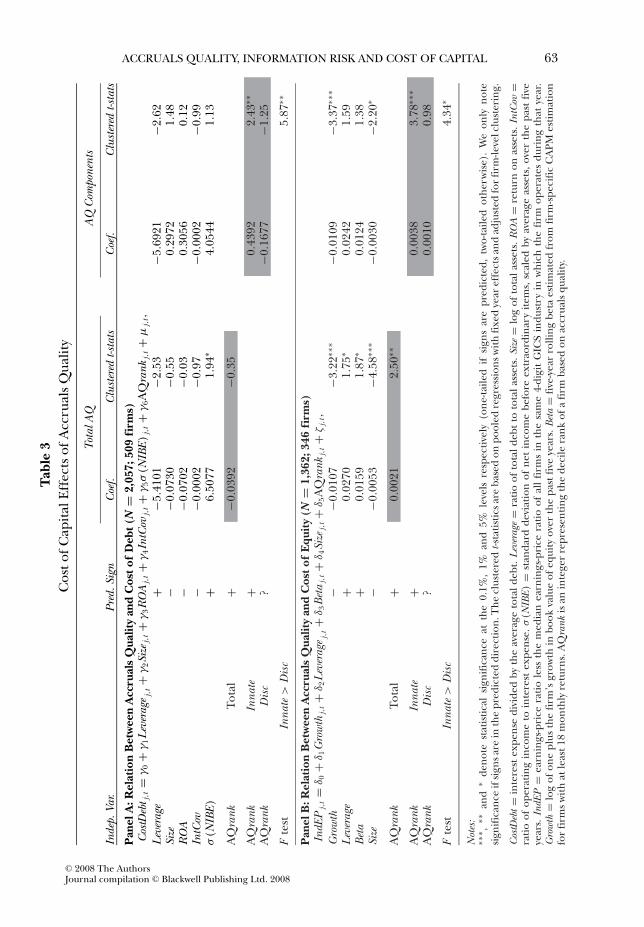
Table 3 Panel A presents estimates for model (3). In order to address concerns overcross-sectional and time-series dependence, we use pooled regressions with fixed year
15 During FLOS’s sample period (1970–2001), the mean and median effective overnight Federal fund rateswere 7.26% and 6.39% respectively (data sourced from www.federalreserve.gov/Releases/). In contrast,during our sample period of 1998–2005, the mean and median cash rates in Australia were 5.10% and 5.00%respectively (data available from www.rba.gov.au/Statistics/Bulletin/index.html).
C© 2008 The AuthorsJournal compilation C© Blackwell Publishing Ltd. 2008
ACCRUALS QUALITY, INFORMATION RISK AND COST OF CAPITAL 63T
able
3C
osto
fCap
italE
ffec
tsof
Acc
rual
sQ
ualit
y
Tota
lAQ
AQ
Com
pone
nts
Inde
p.Va
r.Pr
ed.S
ign
Coe
f.C
lust
ered
t-sta
tsC
oef.
Clu
ster
edt-s
tats
Pan
elA
:Rel
atio
nB
etw
een
Acc
rual
sQ
ualit
yan
dC
osto
fD
ebt(
N=
2,05
7;50
9fi
rms)
Cos
tDeb
t j,t
=γ
0+
γ1L
ever
age j,
t+
γ2S
ize j
,t+
γ3R
OA
j,t+
γ4I
ntC
ovj,
t+
γ5σ
(NIB
E) j
,t+
γ6A
Qra
nkj,
t+
μj,
t,
Lev
erag
e+
−5.4
101
−2.5
3−5
.692
1−2
.62
Size
−−0
.073
0−0
.55
0.29
721.
48R
OA
−−0
.070
2−0
.03
0.30
560.
12In
tCov
−−0
.000
2−0
.97
−0.0
002
−0.9
9σ
(NIB
E)
+6.
5077
1.94
∗4.
0544
1.13
AQ
rank
Tota
l+
−0.0
392
−0.3
5
AQ
rank
Inna
te+
0.43
922.
43∗∗
AQ
rank
Dis
c?
−0.1
677
−1.2
5
Fte
stIn
nate
>D
isc
5.87
∗∗
Pan
elB
:Rel
atio
nB
etw
een
Acc
rual
sQ
ualit
yan
dC
osto
fE
quit
y(N
=1,
362;
346
firm
s)In
dEP
j,t=
δ 0+
δ 1G
row
thj,
t+
δ 2L
ever
age j,
t+
δ 3B
eta
j,t+
δ 4Si
zej,
t+
δ 5A
Qra
nkj,
t+
ζj,
t,
Gro
wth
−−0
.010
7−3
.22∗∗
∗−0
.010
9−3
.37∗∗
∗
Lev
erag
e+
0.02
701.
75∗
0.02
421.
59B
eta
+0.
0159
1.87
∗0.
0124
1.38
Size
−−0
.005
3−4
.58∗∗
∗−0
.003
0−2
.20∗
AQ
rank
Tota
l+
0.00
212.
50∗∗
AQ
rank
Inna
te+
0.00
383.
78∗∗
∗
AQ
rank
Dis
c?
0.00
100.
98
Fte
stIn
nate
>D
isc
4.34
∗
Not
es:
∗∗∗ ,
∗∗an
d∗
deno
test
atis
tical
sign
ifica
nce
atth
e0.
1%,
1%an
d5%
leve
lsre
spec
tivel
y(o
ne-ta
iled
ifsi
gns
are
pred
icte
d,tw
o-ta
iled
othe
rwis
e).
We
only
note
sign
ifica
nce
ifsi
gnsa
rein
the
pred
icte
ddi
rect
ion.
The
clus
tere
dt-s
tatis
ticsa
reba
sed
onpo
oled
regr
essi
onsw
ithfix
edye
aref
fect
sand
adju
sted
for
firm
-leve
lclu
ster
ing.
Cos
tDeb
t=
inte
rest
expe
nse
divi
ded
byth
eav
erag
eto
tald
ebt.
Lev
erag
e=
ratio
ofto
tald
ebt
toto
tala
sset
s.Si
ze=
log
ofto
tala
sset
s.R
OA
=re
turn
onas
sets
.Int
Cov
=ra
tioof
oper
atin
gin
com
eto
inte
rest
expe
nse.
σ(N
IBE
)=
stan
dard
devi
atio
nof
net
inco
me
befo
reex
trao
rdin
ary
item
s,sc
aled
byav
erag
eas
sets
,ove
rth
epa
stfiv
eye
ars.
IndE
P=
earn
ings
-pri
cera
tiole
ssth
em
edia
nea
rnin
gs-p
rice
ratio
ofal
lfir
ms
inth
esa
me
4-di
git
GIC
Sin
dust
ryin
whi
chth
efir
mop
erat
esdu
ring
that
year
.G
row
th=
log
ofon
epl
usth
efir
m’s
grow
thin
book
valu
eof
equi
tyov
erth
epa
stfiv
eye
ars.
Bet
a=
five-
year
rolli
ngbe
taes
timat
edfr
omfir
m-sp
ecifi
cC
APM
estim
atio
nfo
rfir
ms
with
atle
ast1
8m
onth
lyre
turn
s.A
Qra
nkis
anin
tege
rre
pres
entin
gth
ede
cile
rank
ofa
firm
base
don
accr
uals
qual
ity.
C© 2008 The AuthorsJournal compilation C© Blackwell Publishing Ltd. 2008
64 GRAY, KOH AND TONG
effects and standard errors clustered by firm.16 Table 3 Panel A shows that earningsvolatility (σ(NIBE)) is positively related to CostDebt, but like FLOS (2005), the negativesign on financial leverage (Leverage) is opposite to that predicted. Most importantly,the coefficient on AQrank is insignificant. As such, there is no evidence to support theconjecture of H1 that firms with poor AQ have higher cost of debt. This finding differsfrom that of FLOS (2005) who report a modest, albeit statistically significant, positiverelation between total AQ and cost of debt.
To test H2, we extend the analysis to examine whether the innate and discretionarycomponents of total AQ have differential effects on cost of debt. Our approach is toreplace the AQrank for total AQ in model (3) with similarly-constructed decile rankingsfor both InnateAQ and DiscAQ measures. The modified model (3), which retains thefive control variables, estimates the unique impact of innate and discretionary AQ oncost of debt.
Table 3 Panel A reports that InnateAQ has a significant positive association withCostDebt – the poorer the innate accruals quality, the higher the cost of debt. Theestimated coefficient of 0.4392 implies that the cost of debt increases by about 395basis points as we move from firms in the best decile of InnateAQ to those in the worstdecile of InnateAQ. In sharp contrast, the relation between DiscAQ and cost of debtis insignificant. An F -test of the hypothesis that the true coefficients on InnateAQ andDiscAQ are equal is rejected.17
Consistent with H2, these findings support the notion that innate AQ has a greatereffect on Australian firms’ cost of debt than discretionary AQ. While this finding isconsistent with FLOS (2005), our results display one important difference. FLOS reportthat both the innate and discretionary components of total AQ have a significant impacton the cost of debt, the former being larger in magnitude. Our results suggest that thecost of debt for Australian firms is only affected by InnateAQ.18 This finding is consistentwith the earlier argument that, given their greater reliance on private debt, Australianfirms operate in an environment of higher information precision, lower informationasymmetry among and closer monitoring by private lenders. Thus, information riskassociated with managerial reporting discretion is reduced resulting in the diminishedeffect of discretionary AQ on the cost of debt.
(iii) AQ and Cost of Equity
Our analysis of the effect of AQ on cost of equity (as proxied by IndEP) is basedon model (4). We only include firms with positive earnings to obtain a meaningful
16 Petersen (2008) suggests that, in the presence of cross-sectional and time-series dependence, onedependence effect can be addressed parametrically (e.g., including time dummies for cross-sectionaldependence) and then estimate standard errors clustered on the other dependence effect (e.g., clusteringby firms for time-series dependence). As we have more firm than year observations, we use year dummiesand cluster by firms because a larger number of clusters leads to standard errors that are less biased.17 Our full sample contains a number of firms that do not report any interest expense, resulting in anestimated cost of debt of zero. As a robustness check, we repeat the analysis in Table 3 Panel A after excludingfirms with reported interest expense equal to zero. Untabulated results are qualitatively similar and do notchange our inferences.18 Rather than using a pooled regression with clustered t-statistics, FLOS (2005) simply report t-statisticsbased on the mean coefficients of annual regressions of model (3). As a robustness check, we also estimatemodel (3) on an annual basis, with the coefficients being the time-series means of the annual estimates. Theuntabulated results are qualitatively similar to those using the pooled regression. That is, the coefficients ontotal AQ and DiscAQ remain insignificant while the coefficient on InnateAQ is significantly positive.
C© 2008 The AuthorsJournal compilation C© Blackwell Publishing Ltd. 2008
ACCRUALS QUALITY, INFORMATION RISK AND COST OF CAPITAL 65
earnings-to-price ratio, which reduces the sample to 346 firms (N = 1,362). Table 1reports a mean (median) earnings-price ratio over the sample period of 0.089 (0.074),with 80% of earnings-price ratios ranging between 0.029 and 0.160. These statistics arevery similar to those reported by FLOS (2005) for their US sample where the mean(median) of earnings-price ratio is 0.089 (0.073) and 80% of their sample’s earnings-price ratios range between 0.026 and 0.166. These statistics suggest the cost of equityis similar for US and Australian firms.
Table 3 Panel B presents regression estimates for model (4). Each of the fourcontrol variables is statistically significant with the predicted sign. The coefficient onAQrank is positive and significantly related to IndEP . This finding suggests that firmswith poorer AQ have higher cost of equity, thus supporting H1. Regarding economicsignificance, the coefficient estimate (0.0021) implies that the industry-adjusted costof equity increases by about 189 basis points as we move from firms in the best decileof AQrank to those in the worst decile of AQrank.
In terms of H2, Table 3 Panel B shows that the coefficient on InnateAQ is significantlypositive, while the coefficient on DiscAQ is insignificant.19 An F -test of the hypothesisthat InnateAQ and DiscAQ have equal impact on IndEP is rejected. The economicsignificance of InnateAQ for cost of equity is unambiguous – the differential in industry-adjusted cost of equity between firms with the poorest and best InnateAQ is around342 basis points. The finding that discretionary AQ is not significantly associated withAustralian firms’ cost of equity may in part be a function of the continuous disclosureregime in place over our sample period. The non-selective disclosure of high qualityand timely information to the public domain increases the precision of informationand mitigates information asymmetry on expected cash flows. Thus, the informationrisk associated with discretionary AQ arising from managerial opportunistic reportingis reduced.
(iv) AQ and Asset Pricing Implications
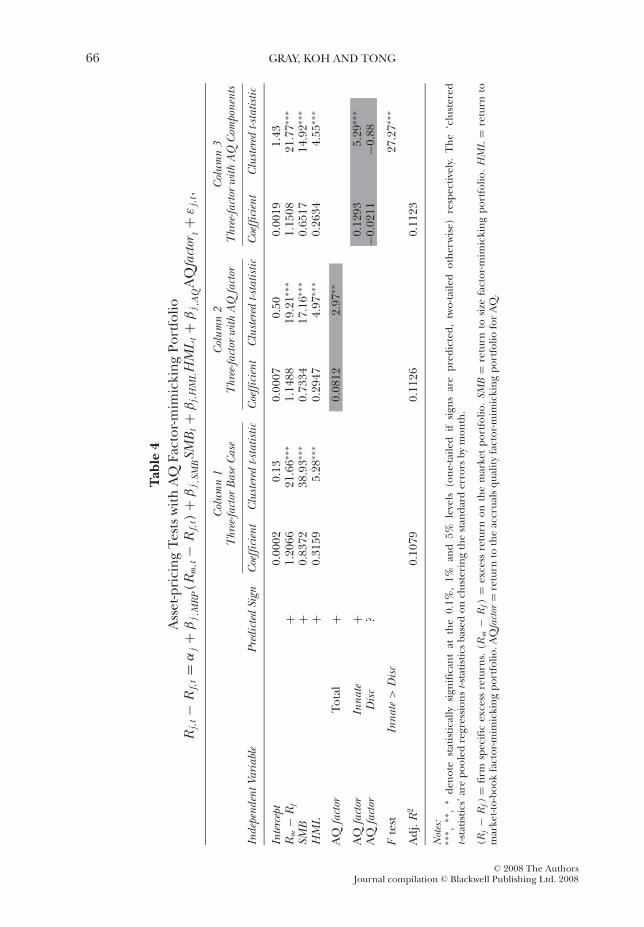
Our first analysis of the asset-pricing implications of accruals quality replicates theapproach of FLOS (2005) by estimating the loadings on AQfactor when it is addedto the three-factor asset-pricing model (5). Using a pooled regression, model (5) isestimated for firms with sufficient data to calculate their AQ measure and at least18 monthly returns between September 1998 and August 2006, resulting in a sample of736 firms and 65,110 firm-month observations.20 Table 4 reports the mean and standarddeviation of parameter estimates with t-statistics based on clustering by month, alongwith regression goodness-of-fit statistics.21
19 Note that, as in model (3), FLOS (2005) report t-statistics based on the mean coefficients of annualregressions of model (4). Replicating this approach, the results (not explicitly reported) are qualitativelysimilar to those using the pooled regression corrected for cross-sectional and time-series dependenciesreported in Table 3 Panel B.20 As a sensitivity check, we relax the data requirement that sample firms must have available data for AQto calculate the AQfactor , in addition to returns. Specifically, we repeat the analysis reported in Table 4for all firms that have at least 18 months of returns over our sample period. This increases the sample from736 firms to 1,828 firms. The untabulated results remain qualitatively similar and do not affect our inferences.21 The econometric concern here is cross-sectional dependence because, over long time windows, commonmarket shocks induce high cross-sectional correlation. As noted by Petersen (2008), clustering by time (e.g.,by month or by year) will correct the standard errors for cross-sectional dependence. We do not addresstime-series dependence econometrically in the model because the dependent variable is returns, which isexpected to be serially independent in an efficient market.
C© 2008 The AuthorsJournal compilation C© Blackwell Publishing Ltd. 2008
66 GRAY, KOH AND TONG
Tab
le4
Ass
et-p
rici
ngTe
sts
with
AQ
Fact
or-m
imic
king
Port
folio
Rj,
t−
Rf,
t=
αj+
βj ,
MR
P(R
m,t
−R
f,t)
+β
j ,SM
BSM
Bt+
βj,
HM
LH
ML
t+
βj ,
AQ
AQ
fact
ort+
εj,
t,
Col
umn
1C
olum
n2
Col
umn
3T
hree
-fact
orB
ase
Cas
eT
hree
-fact
orw
ithA
Qfa
ctor
Thr
ee-fa
ctor
with
AQ
Com
pone
nts
Inde
pend
entV
aria
ble
Pred
icte
dSi
gnC
oeffi
cien
tC
lust
ered
t-sta
tistic
Coe
ffici
ent
Clu
ster
edt-s
tatis
ticC
oeffi
cien
tC
lust
ered
t-sta
tistic
Inte
rcep
t0.
0002
0.13
0.00
070.
500.
0019
1.43
Rm
−R
f+
1.20
6621
.66∗∗
∗1.
1488
19.2
1∗∗∗
1.15
0821
.77∗∗
∗
SMB
+0.
8372
38.9
3∗∗∗
0.73
3417
.16∗∗
∗0.
6517
14.9
2∗∗∗
HM
L+
0.31
595.
28∗∗
∗0.
2947
4.97
∗∗∗
0.26
344.
55∗∗
∗
AQ
fact
orTo
tal
+0.
0812
2.97
∗∗
AQ
fact
orIn
nate
+0.
1293
5.29
∗∗∗
AQ
fact
orD
isc
?−0
.021
1−0
.88
Fte
stIn
nate
>D
isc
27.2
7∗∗∗
Adj
.R2
0.10
790.
1126
0.11
23
Not
es:
∗∗∗ ,
∗∗,
∗de
note
stat
istic
ally
sign
ifica
ntat
the
0.1%
,1%
and
5%le
vels
(one
-taile
dif
sign
sar
epr
edic
ted,
two-
taile
dot
herw
ise)
resp
ectiv
ely.
The
‘clu
ster
edt-s
tatis
tics’
are
pool
edre
gres
sion
st-s
tatis
tics
base
don
clus
teri
ngth
est
anda
rder
rors
bym
onth
.
(Rj−
Rf)
=fir
msp
ecifi
cex
cess
retu
rns.
(Rm
−R
f)=
exce
ssre
turn
onth
em
arke
tpo
rtfo
lio.S
MB
=re
turn
tosi
zefa
ctor
-mim
icki
ngpo
rtfo
lio.H
ML
=re
turn
tom
arke
t-to-
book
fact
or-m
imic
king
port
folio
.AQ
fact
or=
retu
rnto
the
accr
uals
qual
ityfa
ctor
-mim
icki
ngpo
rtfo
liofo
rA
Q.
C© 2008 The AuthorsJournal compilation C© Blackwell Publishing Ltd. 2008
ACCRUALS QUALITY, INFORMATION RISK AND COST OF CAPITAL 67
As a base case, a three-factor model is estimated initially (i.e., without the AQfactor).Table 4 Column 1 shows that market risk premium, SMB and HML factors are statisticallysignificant, with an adjusted R2 for the base-case model of 10.79%. When this modelis augmented with the factor-mimicking portfolio designed to capture accruals quality(AQfactor), Table 4 Column 2 shows a marginal increase in goodness of fit (11.26%).Most importantly, the loading on AQfactor is significantly positive. The decline inreported loading on SMB suggests that it may be correlated with AQfactor .22
Table 4 Column 3 shows that the significance of accruals quality is solely attributableto InnateAQ. When the single AQfactor in model (5) is replaced with separate factor-mimicking portfolios constructed for InnateAQ and DiscAQ, only the innate componentof AQ is associated with asset returns. An F -test suggests that the difference betweenthe loadings on InnateAQ and DiscAQ is statistically significant at the 1% level.This finding differs from FLOS (2005), who report that both InnateAQ and DiscAQare significantly related with stock returns. We attribute this difference to the CDRregulatory environment in existence in Australia.
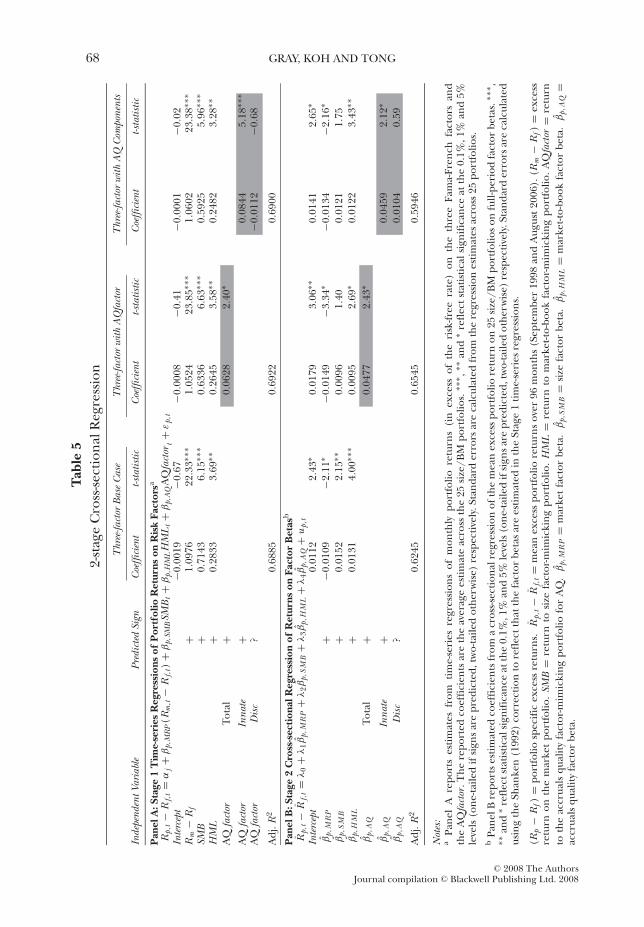
Our second asset-pricing analysis adopts the 2SCSR approach commonly employedto test proposed risk factors using 25 portfolios cross-sorted on size and book-to-marketratio. Table 5 Panel A reports the mean parameter estimates from the stage 1 time-seriesregression (5) estimated for each of the 25 size/BM portfolios. Similar to Table 4, wereport a base case using the three-factor model before including AQ as an additionalfactor. The parameter estimates for the portfolios are similar to those reported forindividual stock regressions in Table 4 for all three models (i.e., base case model,three-factor model with AQ and three-factor model with AQ components). This is notsurprising given that the sample of individual stocks represents a broad cross-section ofthe population. Further, and as expected, the average adjusted R2 (69%) is significantlyhigher in Table 5 Panel A – the portfolio-formation procedure attenuates much of theidiosyncratic noise surrounding individual stocks.23
The results reported in Table 5 are interesting on a number of dimensions. First,they are generally consistent with the conclusion from individual-stock regressions inTable 4 (namely, that the AQfactor is positively related with asset returns, and that thisassociation is driven by the innate component of AQ). Second, the findings are incontrast to CGV (2008) who find no association between the AQfactor and portfolioreturns for US stocks.24
According to CGV (2008), a well-specified test of whether a proposed risk factor ispriced is judged in the stage 2 cross-sectional regression of average portfolio excessreturns on the factor betas estimated in stage 1. Table 5 Panel B reports the estimatedfactor loadings (i.e., the λs) from estimating model (6). While CGV (2008) find little
22 Note that FLOS (2005) only report the mean coefficients from firm-specific regressions of model (5)instead of pooled regressions with clustering by time (i.e., month). As noted in Barth et al. (2006), aneconometric concern with averaging the coefficients from these firm-specific regressions is that the standarderrors (t-statistics) are not adjusted for cross-sectional correlation and are likely to be biased downwards(upwards). We also estimate model (5) using firm-specific regressions as in FLOS (2005) for comparison.The results based on the mean coefficients are qualitatively similar to those using pooled regression withclustering by month.23 Indeed, this is the original motivation for Black, Jensen and Scholes (1972) and Fama and MacBeth(1973) to use portfolios rather than individual stocks in their asset-pricing tests.24 CGV note that the appropriate test of whether model (5) constitutes a well-specified asset-pricing modelrequires a test of whether the intercepts (α j ) are jointly zero across the 25 SIZE/BM portfolios. Consistentwith the findings in CGV, the Gibbons et al. (1989) test of this hypothesis is unambiguously rejected for boththe three-factor and augmented models in Table 5.
C© 2008 The AuthorsJournal compilation C© Blackwell Publishing Ltd. 2008
68 GRAY, KOH AND TONG
Tab
le5
2-st
age
Cro
ss-se
ctio
nalR
egre
ssio
nT
hree
-fact
orB
ase
Cas
eT
hree
-fact
orw
ithA
Qfa
ctor
Thr
ee-fa
ctor
with
AQ
Com
pone
nts
Inde
pend
entV
aria
ble
Pred
icte
dSi
gnC
oeffi
cien
tt-s
tatis
ticC
oeffi
cien
tt-s
tatis
ticC
oeffi
cien
tt-s
tatis
tic
Pan
elA
:Sta
ge1
Tim
e-se
ries
Reg
ress
ions
ofP
ortf
olio
Ret
urns
onR
isk
Fact
orsa
Rp,
t−
Rf,
t=
αj+
βp,
MR
P(R
m,t
−R
f,t)
+β
p,SM
BSM
Bt+
βp,
HM
LH
ML
t+
βp,
AQ
AQ
fact
ort+
εp,
tIn
terc
ept
−0.0
019
−0.6
7−0
.000
8−0
.41
−0.0
001
−0.0
2R
m−
Rf
+1.
0976
22.3
3∗∗∗
1.05
2423
.85∗
∗∗1.
0602
23.3
8∗∗∗
SMB
+0.
7143
6.15
∗∗∗
0.63
366.
63∗∗
∗0.
5925
5.96
∗∗∗
HM
L+
0.28
333.
69∗∗
0.26
453.
58∗∗
0.24
823.
28∗∗
AQ
fact
orTo
tal
+0.
0628
2.40
∗
AQ
fact
orIn
nate
+0.
0844
5.18
∗∗∗
AQ
fact
orD
isc
?−0
.011
2−0
.68
Adj
.R2
0.68
850.
6922
0.69
00
Pan
elB
:Sta
ge2
Cro
ss-s
ecti
onal
Reg
ress
ion
ofR
etur
nson
Fact
orB
etas
b
R̄p,
t−
R̄f,
t=
λ0
+λ
1β̂p,
MR
P+
λ2β̂
p,S
MB
+λ
3β̂p,
HM
L+
λ4β̂
p,A
Q+
up,
tIn
terc
ept
0.01
122.
43∗
0.01
793.
06∗∗
0.01
412.
65∗
β̂p,
MR
P+
−0.0
109
−2.1
1∗−0
.014
9−3
.34∗
−0.0
134
−2.1
6∗β̂
p,S
MB
+0.
0152
2.15
∗∗0.
0096
1.40
0.01
211.
75β̂
p,H
ML
+0.
0131
4.00
∗∗∗
0.00
952.
69∗
0.01
223.
43∗∗
β̂p,
AQ
Tota
l+
0.04
772.
43∗
β̂p,
AQ
Inna
te+
0.04
592.
12∗
β̂p,
AQ
Dis
c?
0.01
040.
59
Adj
.R2
0.62
450.
6545
0.59
46
Not
es:
aPa
nel
Are
port
ses
timat
esfr
omtim
e-se
ries
regr
essi
ons
ofm
onth
lypo
rtfo
liore
turn
s(i
nex
cess
ofth
eri
sk-fr
eera
te)
onth
eth
ree
Fam
a-Fr
ench
fact
ors
and
the
AQ
fact
or.T
here
port
edco
effic
ient
sar
eth
eav
erag
ees
timat
eac
ross
the
25si
ze/B
Mpo
rtfo
lios.
∗∗∗ ,
∗∗an
d∗
refle
ctst
atis
tical
sign
ifica
nce
atth
e0.
1%,1
%an
d5%
leve
ls(o
ne-ta
iled
ifsi
gns
are
pred
icte
d,tw
o-ta
iled
othe
rwis
e)re
spec
tivel
y.St
anda
rder
rors
are
calc
ulat
edfr
omth
ere
gres
sion
estim
ates
acro
ss25
port
folio
s.b
Pane
lBre
port
ses
timat
edco
effic
ient
sfr
oma
cros
s-sec
tiona
lreg
ress
ion
ofth
em
ean
exce
sspo
rtfo
liore
turn
on25
size
/BM
port
folio
son
full-
peri
odfa
ctor
beta
s.∗∗
∗ ,∗∗
and
∗re
flect
stat
istic
alsi
gnifi
canc
eat
the
0.1%
,1%
and
5%le
vels
(one
-taile
dif
sign
sare
pred
icte
d,tw
o-ta
iled
othe
rwis
e)re
spec
tivel
y.St
anda
rder
rors
are
calc
ulat
edus
ing
the
Shan
ken
(199
2)co
rrec
tion
tore
flect
that
the
fact
orbe
tas
are
estim
ated
inth
eSt
age
1tim
e-se
ries
regr
essi
ons.
(Rp
−R
f)=
port
folio
spec
ific
exce
ssre
turn
s.R̄
p,t−
R̄f,
t=
mea
nex
cess
port
folio
retu
rns
over
96m
onth
s(S
epte
mbe
r19
98an
dA
ugus
t200
6).(
Rm
−R
f)=
exce
ssre
turn
onth
em
arke
tpo
rtfo
lio.
SMB
=re
turn
tosi
zefa
ctor
-mim
icki
ngpo
rtfo
lio.
HM
L=
retu
rnto
mar
ket-t
o-bo
okfa
ctor
-mim
icki
ngpo
rtfo
lio.
AQ
fact
or=
retu
rnto
the
accr
uals
qual
ityfa
ctor
-mim
icki
ngpo
rtfo
liofo
rA
Q.
β̂p,
MR
P=
mar
ket
fact
orbe
ta.
β̂p,
SM
B=
size
fact
orbe
ta.
β̂p,
HM
L=
mar
ket-t
o-bo
okfa
ctor
beta
.β̂
p,A
Q=
accr
uals
qual
ityfa
ctor
beta
.
C© 2008 The AuthorsJournal compilation C© Blackwell Publishing Ltd. 2008
ACCRUALS QUALITY, INFORMATION RISK AND COST OF CAPITAL 69
evidence that AQ loads as a significant factor, our evidence suggests that the AQfactor issignificantly related to average portfolio returns, in particular the innate component ofAQ. To summarize, using the 2SCSR methodology advocated by CGV (2008), we findevidence supporting the conclusion in FLOS (2005) that AQ is a priced risk factor.
5. SENSITIVITY ANALYSIS
The primary approach adopted in this paper to partition total AQ into innate anddiscretionary components is described in Section 3(i) (see model 2). Specifically, fivevariables representing economic fundamentals are used to estimate InnateAQ, whilethe regression residual estimates DiscAQ. This approach is useful in that it facilitatesstatistical inference for H2 on the differential impact of the two components of AQ.
However, this procedure has potential drawbacks.25 In model (2), non-systematicnoise (i.e., noise that is unrelated to the five innate variables) is captured in theregression residual, which is our proxy for DiscAQ. Further, the residual may beaffected by model mis-specification caused by any omitted innate variables. Both ofthese problems impact on our estimate of DiscAQ, potentially hindering our abilityto statistically detect a relation between cost of capital and DiscAQ. Noting thesedrawbacks, FLOS (2005) suggest that this approach provides a lower bound for theeffects of DiscAQ on the cost of capital.
To ensure that our lack of significant findings on the effects of discretionary AQon the cost of capital is not driven by measurement errors, we conduct two alternativeestimation procedures as robustness checks. First, we control for the five innate factors(SIZE, σ(CFO), σ (Sales), OpCycle and NegEarn) by including them directly in models(3) and (4) (cost of debt and equity respectively), together with total AQ. Under thisspecification, the coefficient on AQrank captures the cost of capital effect attributableto the portion of AQ that is incremental to the effects captured by the innate factors(i.e., attributable to DiscAQ). FLOS (2005) refer to this as ‘Method 2’ and note that itprovides an upper bound for the relation between discretionary AQ and costs of capital.While this approach does not allow statistical comparison on the differences betweenInnateAQ and DiscAQ, it does partially mitigate the econometric concerns noted above.The untabulated results under Method 2 do not change our inferences, and we continueto find that discretionary component of AQ is not significantly associated with the costof debt and equity.
Our second sensitivity check involves estimating models (3) and (4) (cost of debtand equity respectively) using fixed- and random-effects models. The main advantageof using fixed- and random-effects models is that these two models control for allunobservable firm-specific characteristics that potentially contribute to innate AQ.In the spirit of FLOS (2005) Method 2 discussed above, we interpret the estimatedcoefficient on total AQ (AQrank), after considering fixed- and random-effects, as theeffects of discretionary AQ on the costs of capital incremental to unobservable firm-specific innate factors that drive accruals quality. Untabulated results continue to showinsignificant coefficients on total AQ, suggesting that the effects of discretionary AQon the cost of capital are insignificant for Australian firms.
In summary, our conclusion that the effects of discretionary AQ on the cost ofcapital is negligible for Australia firms continue to hold after using both FLOS (2005)
25 We thank an anonymous referee for highlighting these issues.
C© 2008 The AuthorsJournal compilation C© Blackwell Publishing Ltd. 2008
70 GRAY, KOH AND TONG
Method 2 and the fixed- and random-effects models. Although we cannot completelyrule out concerns over measurement errors in the estimation of discretionary AQ, theadditional tests above suggest our findings on the relation between discretionary AQand cost of capital are robust.
6. CONCLUSIONS
Recent theoretical work argues that information risk is a non-diversifiable risk factorthat is priced in the capital market (e.g., EOH, 2004; and LLV, 2007). Using accrualsquality as a proxy for information risk, FLOS (2005) provide empirical support forthis hypothesis. They show that US firms with poorer accruals quality exhibit highercosts of debt and equity capital. This study extends the analysis of FLOS by examiningthe interplay of accruals quality, information risk and cost of capital for a sample ofAustralian firms. While the work may be viewed as an out of (US) sample test of theeffects of information risk on cost of capital, the Australian institutional and regulatoryenvironment provides a number of subtle differences which potentially impact on therelation between accruals quality and cost of capital.
Australian firms rely heavily on private debt which is likely to both increase theprecision of accounting information and lower the information asymmetry acrosslenders. To the extent that this mitigates information risk associated with opportunisticmanagerial reporting choices, the effect of discretionary reporting on cost of debt willbe reduced. In addition, over the duration of our sample period, Australian firms aresubject to a continuous disclosure regime that promotes the non-selective disclosure oftimely and high quality information to the capital markets. This reduces informationrisk associated with opportunistic managerial reporting and disclosure choices andconsequently the influence of discretionary reporting on the cost of equity. In such anenvironment, the cost of equity is more likely to be influenced by accruals quality arisingfrom economic fundamentals (i.e., InnateAQ) rather than accruals quality arising frommanagerial reporting discretion (i.e., DiscAQ).
Our empirical results are largely consistent with these predictions. In Australian debtmarkets, the innate component of AQ exerts an economically significant influenceon cost of debt. There is no association between discretionary AQ and cost of debt,consistent with the argument that the heavy reliance of Australian firms on privatedebt reduces information risk associated with managerial reporting choices, andconsequently the influence of discretionary AQ on cost of debt. In the equity market,there is evidence that total AQ affects the cost of equity. However, this relation is drivenmainly by the innate component rather than the discretionary component of AQ. Thisrelation is consistent with the argument that the continuous disclosure regime mitigatesthe information risk resulting from opportunistic financial reporting choice and hence,the influence of discretionary AQ on the cost of equity.
The paper also contributes to the debate over whether information risk is apriced risk factor. CGV (2008) argue that the econometric approach of FLOS (2005)does not explicitly test the hypothesis that AQ is priced. Instead, they advocate the2SCSR approach commonly-employed in the asset-pricing literature. Using the 2SCSRapproach, our asset-pricing analysis provides support for the conjecture of FLOS (2005)that AQ (and more so for the innate component of AQ) is a priced risk factor. Ourfindings also complement those of Kim and Qi (2008) and Ogneva (2008), who showthat AQ is a priced risk factor for US firms using the 2SCSR approach.
C© 2008 The AuthorsJournal compilation C© Blackwell Publishing Ltd. 2008
ACCRUALS QUALITY, INFORMATION RISK AND COST OF CAPITAL 71
Overall, the empirical results in this paper support the recent theoretical argumentsthat information risk is a non-diversifiable risk factor which is priced by the capitalmarkets. Reporting quality seemingly matters to capital-market participants and hasimportant economic consequences for firms’ cost of capital. These findings are likely tobe of interest to regulators, standard setters, managers and investors who are interestedin the quality of financial reporting in general.
REFERENCES
Aboody, D., J. Hughes and J. Liu (2005), ‘Earnings Quality, Insider Trading, and Cost ofCapital’, Journal of Accounting Research, Vol. 43, No. 5, pp. 651–73.
Barth, M., Y. Konchitchki and W. Landsman (2006), ‘Cost of Capital and Financial StatementTransparency’, Working Paper (Stanford University).
Bhattacharya, N., F. Ecker, P. Olsson and K. Schipper (2008), ‘Direct and Mediated AssociationAmong Earnings Quality, Information Asymmetry and the Cost of Equity’, Working Paper(Southern Methodist University and Duke University).
Black, F., M. Jensen and M. Scholes (1972), ‘The Capital Asset Pricing Model: Some EmpiricalFindings’, in M. Jensen (ed.), Studies in the Theory of Capital Markets (Praeger, New York).
Brennan, M.J., A. Wang and Y. Xia (2004), ‘Estimation and Test of a Simple Model ofIntertemporal Capital Asset Pricing’, Journal of Finance, Vol. 59, No. 4, pp. 1743–76.
Campbell, J.Y. and T. Vuoleenaho (2004), ‘Bad Beta, Good Beta’, American Economic Review,Vol. 94, No. 5, pp. 1249–75.
Chen, S., T. Shevlin and Y.H. Tong (2007), ‘Does the Pricing of Financial Reporting QualityChange Around Dividend Changes?’, Journal of Accounting Research, Vol. 45, No. 1,pp. 1–40.
Cochrane, J.H. (2005), Asset Pricing (Princeton: Princeton University Press).Core, J., W. Guay and R. Verdi (2008), ‘Is Accrual Quality a Priced Risk Factor?’, Journal of
Accounting and Economics, Vol. 46, No. 1, pp. 2–22.Cotter, J. (1998), ‘Utilisation and Restrictiveness of Covenants in Australian Private Debt
Contracts’, Accounting and Finance, Vol. 38, No. 2, pp. 181–96.Dechow, P. and I. Dichev (2002), ‘The Quality of Accruals and Earnings: The Role of Accrual
Estimation Errors’, The Accounting Review, Vol. 77 (Supplement), pp. 35–59.Easley, D. and M. O’Hara (2004), ‘Information and the Cost of Capital’, Journal of Finance,
Vol. 59, No. 4, pp. 1553–83.Fama, E.F. and K.R. French (1993), ‘Common Risk Factors in the Returns on Stocks and
Bonds’, Journal of Financial Economics, Vol. 33, No. 1, pp. 3–56.——— and J. MacBeth (1973), ‘Risk, Return and Equilibrium: Empirical Tests’, Journal of
Political Economy, Vol. 81, No. 3, pp. 607–36.Francis, J., R. LaFond, P. Olsson and K. Schipper (2005), ‘The Market Pricing of Accruals
Quality’, Journal of Accounting and Economics, Vol. 39, No. 2, pp. 295–327.Gibbons, M.R., S.A. Ross and J. Shanken (1989), ‘A Test of the Efficiency of a Given Portfolio’,
Econometrica, Vol. 57, No. 5, pp. 1121–52.Gietzmann, M. and J. Ireland (2005), ‘Cost of Capital, Strategic Disclosures and Accounting
Choice’, Journal of Business, Finance & Accounting , Vol. 32, Nos. 3&4 (April/May),pp. 599–634.
Guay, W., S.P. Kothari and R. Watts (1996), ‘A Market-Based Evaluation of DiscretionaryAccruals Models’, Journal of Accounting Research, Vol. 34 (supplement), pp. 83–105.
Hribar, P. and D. Collins (2002), ‘Errors in Estimating Accruals: Implications for EmpiricalResearch’, Journal of Accounting Research, Vol. 40, No. 1, pp. 105–34.
Hughes, J., J. Liu and J. Liu (2007), ‘Information Asymmetry, Diversification, and Cost ofCapital’, The Accounting Review, Vol. 82, No. 3, pp. 705–29.
Kaplan, R. and G. Urwitz (1979), ‘Statistical Models of Bond Ratings: A MethodologicalInquiry’, Journal of Business, Vol. 52, No. 2 (April), pp. 231–61.
Kim, D. and Y. Qi (2008), ‘Accounting Information Quality, Stock Returns, and Macroeco-nomic Conditions’, Working Paper (Korea University and Concordia University).
C© 2008 The AuthorsJournal compilation C© Blackwell Publishing Ltd. 2008
72 GRAY, KOH AND TONG
Lambert, R.A., C. Leuz and R. Verrecchia (2007), ‘Information Asymmetry, InformationPrecision, and the Cost of Capital’, Working Paper (University of Pennsylvania andUniversity of Chicago).
McNichols, M. (2002), ‘Discussion of The Quality of Accruals and Earnings: The Role ofAccrual Estimation Errors’, The Accounting Review, Vol. 77 (Supplement), pp. 61–9.
O’Brien, M.A., T. Brailsford and C. Gaunt (2008), ‘Size and Book-to-Market Factors inAustralia’, Working Paper (University of Queensland).
Ogneva, M. (2008), ‘Accrual Quality and Expected Returns: The Importance of Controllingfor Cash Flow Shocks’, Ph.D. Dissertation (University of Southern California).
O’Hara, M. (2003), ‘Presidential Address: Liquidity and Price Discovery’, Journal of Finance,Vol. 58, No. 4, pp. 1335–54.
Palepu, K., P. Healy and V. Bernard (2000), Business Analysis and Valuation (2nd ed.,Southwestern Publishing).
Petersen, M. (2008), ‘Estimating Standard Errors in Finance Panel Data Sets: ComparingApproaches’, Review of Financial Studies (forthcoming).
Petkova, R. (2006), ‘Do the Fama-French Factors Proxy for Innovations in PredictiveVariables?’, Journal of Finance, Vol. 61, No. 2, pp. 581–612.
Shanken, J. (1992), ‘On the Estimation of Beta-Pricing Models’, Review of Financial Studies,Vol. 5, No. 1, pp. 1–33.
Subramanyam, K.R. (1996), ‘The Pricing of Discretionary Accruals’, Journal of Accounting andEconomics, Vol. 22, No. 1, pp. 249–81.
C© 2008 The AuthorsJournal compilation C© Blackwell Publishing Ltd. 2008