Embed Size (px)
Citation preview

Mikael Mazighi Service de neurologie and Centre d’accueil et
de traitement de l’attaque cérébrale Hôpital Bichat, Paris


Prévalence hémorragies cérébrales liées aux AVK
Flaherty ML, et al. Neurology. 2007

• 4052 patients avec ACFA, anticoagulant ou aspirine • Patients avec anticoagulant ont moins d’AVC (2.4 vs 4.5 ev pour 100 patient-années; [HR], 0.55; 95%, 0.43-0.71), • 1000 patients traités pour ACFA pdt 1 an avec anticoagulant prévient 23 infarctus cérébraux et cause 9 hémorragies majeures
Anticoagulant & Avc cardioembolique
van Walraven C JAMA. 2002 :2441-8.

van Walraven C JAMA. 2002 :2441-8.
Figure 1. Outcomes Survival Curves
No. at Risk
Oral Anticoagulants
Aspirin
No. at Risk
Oral Anticoagulants
Aspirin
0.25!2 = 14.7, P<.0010.20
0.15
0.10
0.05
00
1939
2113
1
1409
1514
829
881
432
165
140
348
352
Year
Pro
porti
onW
ith E
vent
Cardiovascular Events
2113
0.25!2 = 21.7, P<.0010.20
0.15
0.10
0.05
0
Pro
porti
onW
ith E
vent
All Strokes
1939 1413
1525
831
890
163
145
351
358
!2 = 9.5, P = .02
0
1939
2113
1
1413
1553
821
925
432
158
146
347
365
Year
Major Bleeding
!2 = 29.5, P<.001
Ischemic Strokes
1939
2113
1415
1526
833
893
165
145
352
358
OralAnticoagulants
Aspirin
!2 = 0.6, P = .44
0
1939
2113
1
1434
1569
844
938
432
168
153
360
377
Year
Death
!2 = 2.7, P = .19
Hemorrhagic Strokes
1939
2113
1432
1568
842
935
166
153
359
376
In each plot, the horizontal axis represents time in years. The P value is a log-rank statistic. All strokes included ischemic and hemorrhagic events. Cardiovascular eventsincluded ischemic strokes, myocardial infarctions, systemic emboli, and vascular death. Major bleeding events included intracranial and major systemic bleeds.
Figure 2. Relationship of Therapy With Outcomes in Individual Trials
0 1 3 42Hazard Ratio
Major BleedingP = .87
Ischemic StrokesP = .88
AFASAK 1EAFTPATAFSPAF 2AFASAK 2SPAF 3
Overall
0 1 3 42Hazard Ratio
Cardiovascular EventsP = .96
AFASAK 1EAFTPATAFSPAF 2AFASAK 2SPAF 3
Overall
All StrokesP = .83
0 1 3 42Hazard Ratio
DeathP = .99
Hemorrhagic StrokesP = .98
For each study, the relative effect of oral anticoagulants vs aspirin (with or without low-dose warfarin) is presented for all 6 outcomes as a hazard ratio. Hazard ratiosbelow 1 indicate that oral anticoagulant decreases the risk of the event. Hazard ratios whose 95% confidence interval (error bars) excludes 1 are statistically significantat the 5% level. Because hemorrhagic strokes were uncommon events, a hazard ratio could not be estimated for each study individually. The P value for the DerSimonianand Laird Q statistic, as a measure of heterogeneity, is presented for each outcome in the top right-hand corner. AFASAK indicates Atrial Fibrillation, Aspirin, Antico-agulation study2,3; EAFT, European Atrial Fibrillation Trial5; PATAF, Primary Prevention of Atrial Thromboembolism in patients with Nonrheumatic Atrial Fibrillation inPrimary Care4; SPAF, Stroke Prevention in Atrial Fibrillation studies.7,9
ORAL ANTICOAGULANTS AND ASPIRIN IN ATRIAL FIBRILLATION
©2002 American Medical Association. All rights reserved. (Reprinted) JAMA, November 20, 2002—Vol 288, No. 19 2445
by guest on December 3, 2011jama.ama-assn.orgDownloaded from
Infarctus cérébral (HR, 0.48; 95% CI, 0.37-0.63)
AVK
Aspirine
Figure 1. Outcomes Survival Curves
No. at Risk
Oral Anticoagulants
Aspirin
No. at Risk
Oral Anticoagulants
Aspirin
0.25!2 = 14.7, P<.0010.20
0.15
0.10
0.05
00
1939
2113
1
1409
1514
829
881
432
165
140
348
352
Year
Pro
porti
onW
ith E
vent
Cardiovascular Events
2113
0.25!2 = 21.7, P<.0010.20
0.15
0.10
0.05
0
Pro
porti
onW
ith E
vent
All Strokes
1939 1413
1525
831
890
163
145
351
358
!2 = 9.5, P = .02
0
1939
2113
1
1413
1553
821
925
432
158
146
347
365
Year
Major Bleeding
!2 = 29.5, P<.001
Ischemic Strokes
1939
2113
1415
1526
833
893
165
145
352
358
OralAnticoagulants
Aspirin
!2 = 0.6, P = .44
0
1939
2113
1
1434
1569
844
938
432
168
153
360
377
Year
Death
!2 = 2.7, P = .19
Hemorrhagic Strokes
1939
2113
1432
1568
842
935
166
153
359
376
In each plot, the horizontal axis represents time in years. The P value is a log-rank statistic. All strokes included ischemic and hemorrhagic events. Cardiovascular eventsincluded ischemic strokes, myocardial infarctions, systemic emboli, and vascular death. Major bleeding events included intracranial and major systemic bleeds.
Figure 2. Relationship of Therapy With Outcomes in Individual Trials
0 1 3 42Hazard Ratio
Major BleedingP = .87
Ischemic StrokesP = .88
AFASAK 1EAFTPATAFSPAF 2AFASAK 2SPAF 3
Overall
0 1 3 42Hazard Ratio
Cardiovascular EventsP = .96
AFASAK 1EAFTPATAFSPAF 2AFASAK 2SPAF 3
Overall
All StrokesP = .83
0 1 3 42Hazard Ratio
DeathP = .99
Hemorrhagic StrokesP = .98
For each study, the relative effect of oral anticoagulants vs aspirin (with or without low-dose warfarin) is presented for all 6 outcomes as a hazard ratio. Hazard ratiosbelow 1 indicate that oral anticoagulant decreases the risk of the event. Hazard ratios whose 95% confidence interval (error bars) excludes 1 are statistically significantat the 5% level. Because hemorrhagic strokes were uncommon events, a hazard ratio could not be estimated for each study individually. The P value for the DerSimonianand Laird Q statistic, as a measure of heterogeneity, is presented for each outcome in the top right-hand corner. AFASAK indicates Atrial Fibrillation, Aspirin, Antico-agulation study2,3; EAFT, European Atrial Fibrillation Trial5; PATAF, Primary Prevention of Atrial Thromboembolism in patients with Nonrheumatic Atrial Fibrillation inPrimary Care4; SPAF, Stroke Prevention in Atrial Fibrillation studies.7,9
ORAL ANTICOAGULANTS AND ASPIRIN IN ATRIAL FIBRILLATION
©2002 American Medical Association. All rights reserved. (Reprinted) JAMA, November 20, 2002—Vol 288, No. 19 2445
by guest on December 3, 2011jama.ama-assn.orgDownloaded from
Hémorragies majeures (2.2 vs 1.3 evts pour 100 patient-années; HR, 1.71; 1.21-2.41)
AVK Aspirine
Figure 1. Outcomes Survival Curves
No. at Risk
Oral Anticoagulants
Aspirin
No. at Risk
Oral Anticoagulants
Aspirin
0.25!2 = 14.7, P<.0010.20
0.15
0.10
0.05
00
1939
2113
1
1409
1514
829
881
432
165
140
348
352
Year
Pro
porti
onW
ith E
vent
Cardiovascular Events
2113
0.25!2 = 21.7, P<.0010.20
0.15
0.10
0.05
0
Pro
porti
onW
ith E
vent
All Strokes
1939 1413
1525
831
890
163
145
351
358
!2 = 9.5, P = .02
0
1939
2113
1
1413
1553
821
925
432
158
146
347
365
Year
Major Bleeding
!2 = 29.5, P<.001
Ischemic Strokes
1939
2113
1415
1526
833
893
165
145
352
358
OralAnticoagulants
Aspirin
!2 = 0.6, P = .44
0
1939
2113
1
1434
1569
844
938
432
168
153
360
377
Year
Death
!2 = 2.7, P = .19
Hemorrhagic Strokes
1939
2113
1432
1568
842
935
166
153
359
376
In each plot, the horizontal axis represents time in years. The P value is a log-rank statistic. All strokes included ischemic and hemorrhagic events. Cardiovascular eventsincluded ischemic strokes, myocardial infarctions, systemic emboli, and vascular death. Major bleeding events included intracranial and major systemic bleeds.
Figure 2. Relationship of Therapy With Outcomes in Individual Trials
0 1 3 42Hazard Ratio
Major BleedingP = .87
Ischemic StrokesP = .88
AFASAK 1EAFTPATAFSPAF 2AFASAK 2SPAF 3
Overall
0 1 3 42Hazard Ratio
Cardiovascular EventsP = .96
AFASAK 1EAFTPATAFSPAF 2AFASAK 2SPAF 3
Overall
All StrokesP = .83
0 1 3 42Hazard Ratio
DeathP = .99
Hemorrhagic StrokesP = .98
For each study, the relative effect of oral anticoagulants vs aspirin (with or without low-dose warfarin) is presented for all 6 outcomes as a hazard ratio. Hazard ratiosbelow 1 indicate that oral anticoagulant decreases the risk of the event. Hazard ratios whose 95% confidence interval (error bars) excludes 1 are statistically significantat the 5% level. Because hemorrhagic strokes were uncommon events, a hazard ratio could not be estimated for each study individually. The P value for the DerSimonianand Laird Q statistic, as a measure of heterogeneity, is presented for each outcome in the top right-hand corner. AFASAK indicates Atrial Fibrillation, Aspirin, Antico-agulation study2,3; EAFT, European Atrial Fibrillation Trial5; PATAF, Primary Prevention of Atrial Thromboembolism in patients with Nonrheumatic Atrial Fibrillation inPrimary Care4; SPAF, Stroke Prevention in Atrial Fibrillation studies.7,9
ORAL ANTICOAGULANTS AND ASPIRIN IN ATRIAL FIBRILLATION
©2002 American Medical Association. All rights reserved. (Reprinted) JAMA, November 20, 2002—Vol 288, No. 19 2445
by guest on December 3, 2011jama.ama-assn.orgDownloaded from
van Walraven C JAMA. 2002 :2441-8.
AVK versus aspirine
Figure 1. Outcomes Survival Curves
No. at Risk
Oral Anticoagulants
Aspirin
No. at Risk
Oral Anticoagulants
Aspirin
0.25!2 = 14.7, P<.0010.20
0.15
0.10
0.05
00
1939
2113
1
1409
1514
829
881
432
165
140
348
352
Year
Pro
porti
onW
ith E
vent
Cardiovascular Events
2113
0.25!2 = 21.7, P<.0010.20
0.15
0.10
0.05
0
Pro
porti
onW
ith E
vent
All Strokes
1939 1413
1525
831
890
163
145
351
358
!2 = 9.5, P = .02
0
1939
2113
1
1413
1553
821
925
432
158
146
347
365
Year
Major Bleeding
!2 = 29.5, P<.001
Ischemic Strokes
1939
2113
1415
1526
833
893
165
145
352
358
OralAnticoagulants
Aspirin
!2 = 0.6, P = .44
0
1939
2113
1
1434
1569
844
938
432
168
153
360
377
Year
Death
!2 = 2.7, P = .19
Hemorrhagic Strokes
1939
2113
1432
1568
842
935
166
153
359
376
In each plot, the horizontal axis represents time in years. The P value is a log-rank statistic. All strokes included ischemic and hemorrhagic events. Cardiovascular eventsincluded ischemic strokes, myocardial infarctions, systemic emboli, and vascular death. Major bleeding events included intracranial and major systemic bleeds.
Figure 2. Relationship of Therapy With Outcomes in Individual Trials
0 1 3 42Hazard Ratio
Major BleedingP = .87
Ischemic StrokesP = .88
AFASAK 1EAFTPATAFSPAF 2AFASAK 2SPAF 3
Overall
0 1 3 42Hazard Ratio
Cardiovascular EventsP = .96
AFASAK 1EAFTPATAFSPAF 2AFASAK 2SPAF 3
Overall
All StrokesP = .83
0 1 3 42Hazard Ratio
DeathP = .99
Hemorrhagic StrokesP = .98
For each study, the relative effect of oral anticoagulants vs aspirin (with or without low-dose warfarin) is presented for all 6 outcomes as a hazard ratio. Hazard ratiosbelow 1 indicate that oral anticoagulant decreases the risk of the event. Hazard ratios whose 95% confidence interval (error bars) excludes 1 are statistically significantat the 5% level. Because hemorrhagic strokes were uncommon events, a hazard ratio could not be estimated for each study individually. The P value for the DerSimonianand Laird Q statistic, as a measure of heterogeneity, is presented for each outcome in the top right-hand corner. AFASAK indicates Atrial Fibrillation, Aspirin, Antico-agulation study2,3; EAFT, European Atrial Fibrillation Trial5; PATAF, Primary Prevention of Atrial Thromboembolism in patients with Nonrheumatic Atrial Fibrillation inPrimary Care4; SPAF, Stroke Prevention in Atrial Fibrillation studies.7,9
ORAL ANTICOAGULANTS AND ASPIRIN IN ATRIAL FIBRILLATION
©2002 American Medical Association. All rights reserved. (Reprinted) JAMA, November 20, 2002—Vol 288, No. 19 2445
by guest on December 3, 2011jama.ama-assn.orgDownloaded from
van Walraven C JAMA. 2002 :2441-8.

Contre indication: L’hémorragie cérébrale

Qureshi Lancet 2009

• Hémorragies surviennent en cas de INR en zone thérapeutique
• Age avancé et angiopathie amyloide =facteur d’ hémorragie associé à AVK
• Aggravation dans les premières 24-48 heures ds 50% des cas
Rosand. Neurology 2000 Palareti Lancet 1996 Sjoblom Stroke 2001

• Traitement anticoagulant (niveau d’anticoagulation) • HTA • Age • Dialyse • Antécédents d’AVC ou maladie cérébrovasculaire • Angiopathie amyloide (hémorragie lobaire,
microsaignements) et leucoaraiose
Pengo V, et al. Thromb Haemost. 2001 418-22 Campbell et al. Arch Intern Med. 1996
Fan YH,et al. Stroke. 2003 Smith EE, et al. Neurology. 2002
VazquezE, et al Int J Cardiol. 2003
Facteurs de risque d’hémorragie


La topographie condi/onne le mécanisme de l’hémorragie
hémorragie lobaire: risque de récidive de 4% patient-année

• Scanner: examen de débrouillage. Injection de PdC détecte saignement actif
• IRM: séquence écho de gradient, T2* pour microsaignement, certaines malformations vasculaires (cavernome) • Angiographie conventionelle: malformation vasculaire (anévrysme, malformation artério-veineuse, thrombose veineuse, vascularite)
Imagerie

Les micro-‐saignements
Kumar et al Neurology 2010 Roob et al . Curr Opin Neurol. 2000 Feb;13(1):69-73
Dépots d‘hémosidérine = saignements antérieurs
Association entre microsaignement et maladie des petites
artères (HTA, angiopathie amyloide)
Microsaignements, risque hémorragique 9.3% vs 1.3%
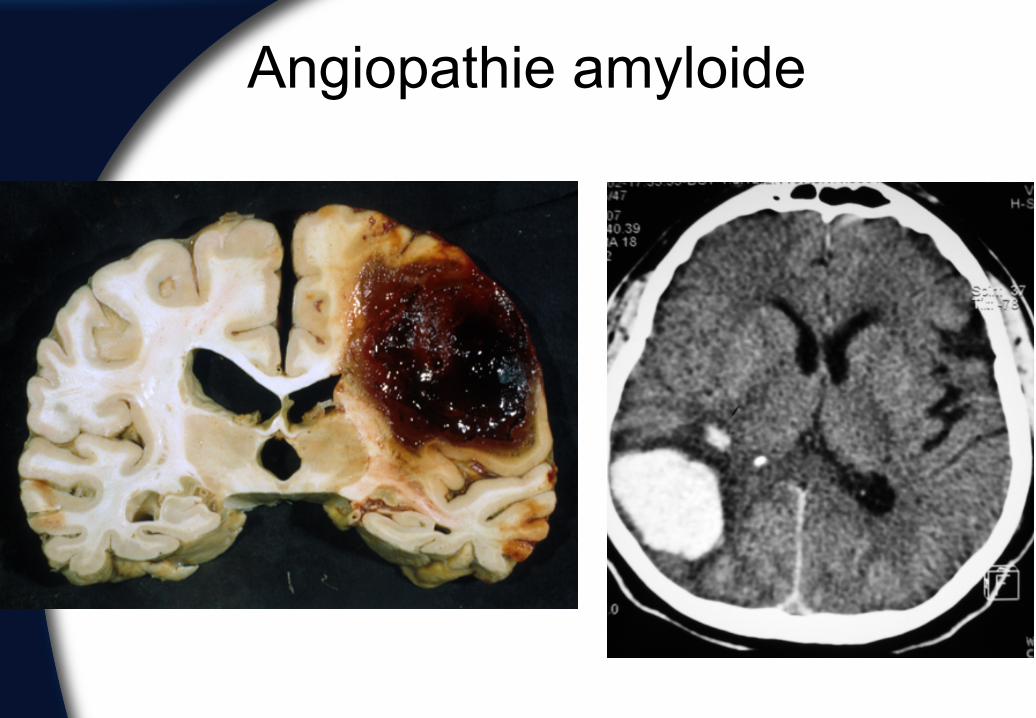
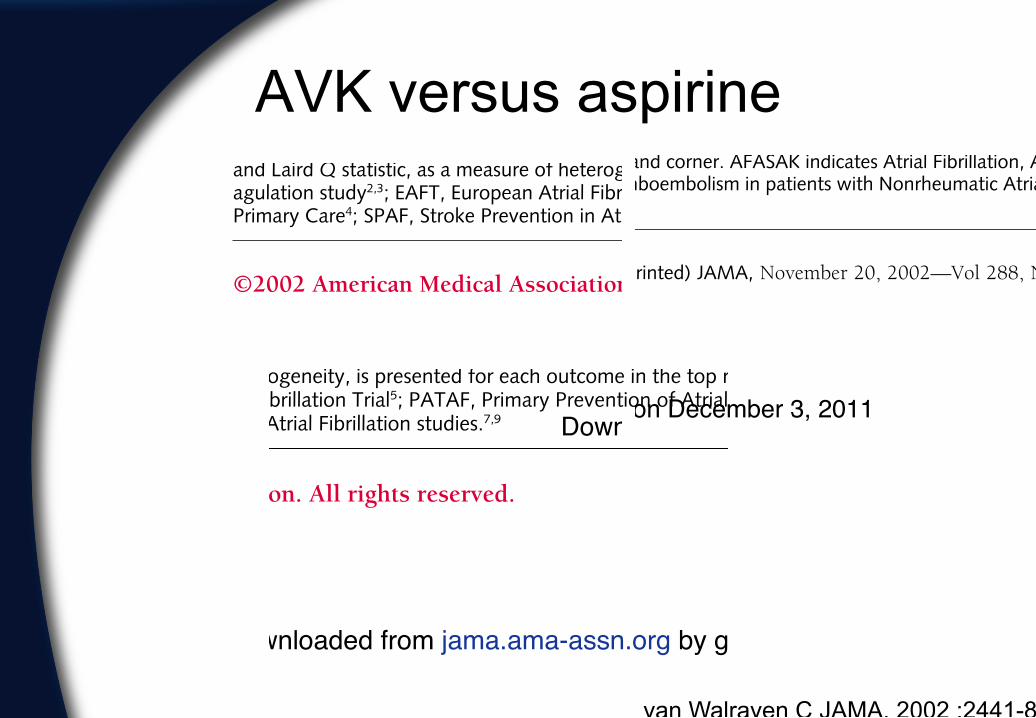
Angiopathie amyloide

Angiopathie amyloide

Angiopathie amyloide
• Angiopathie amyloide : dépôts de peptide amyloide-β et formation de microanévrysme, infiltrats inflammatoires, nécrose fibrinoide dans les capillaires, artérioles, artères de petits et moyen calibres des artères du cortex, cervelet méninges
• Hémorragies parenchymateuses sporadiques intracerebrales, forme familliale chez jeune
• Anomalies de la substance blanche
Rosand et al Neurology 2000 Rost et al Stroke 2008

Eléments clés
Type d’hémorragie
Age
Facteur de récidive

• Dépend du risque de récidive événement thromboembolique, récidive d’hémorragie, état général du patient • Faible risque d’infarctus cérébral: ACFA sans ATCD d’infarctus cérébral • Risque élevé d’hémorragie: angiopathie amyloide (patients âgés avec hémorragie lobaire), altération des fonctions cognitives • Risque thromboembolique très élevé: reprise AVK, 7-10 jours après hémorragie (Class IIb; Level of Evidence B, Nouvelle recommandation) • Transformation hémorragique: continuer anticoagulation(Class IIb; Level of Evidence C).

Recommandations ASA, EUSI
• Contre-indication aux traitements anti-thrombotiques en cas d’hémorragies aigues
• Sous groupe de patient à haut risque d’événements thrombo-emboliques/faible risque de récidive hémorragique pourrait bénéficier d’une anticoagulation à long terme.
• Reprise des AVK en cas de risque très élevé d’événement thrombo-embolique à 7–14 jours après la survenue d’hémorragie intracrânienne
Furie et al Stroke 2011 Qureshi Lancet 2009