Embed Size (px)
Citation preview
ARCTIC
VOL. 55, NO. 2 (JUNE 2002) P. 109– 122
Accumulation in East Greenland Fjords and on the Continental ShelvesAdjacent to the Denmark Strait over the Last Century Based on 210Pb Geochronology
L. MICAELA SMITH,1,2 CLARK ALEXANDER3 and ANNE E. JENNINGS1
(Received 10 October 2000; accepted in revised form 24 July 2001)
ABSTRACT. Sediment (SAR) and mass (MAR) accumulation rates for the last 100 years are derived from 210Pb profiles of boxcores collected in three fjords and on the continental shelf in the Kangerlussuaq region, East Greenland, and on the SW Icelandcontinental shelf. The MAR is lower on East Greenland (0.09 g/cm2·yr) than on SW Iceland (0.14 g/cm2·yr) because of differencesin the biogenic component of the sediments, although SAR is similar. The differences in accumulation rates of the three EastGreenland fjords are due to their dominant sediment sources and basin areas. Kangerlussuaq Fjord, the largest fjord, is dominatedby iceberg sediment input and has a MAR of 0.43 g/cm2·yr at 50 km from the fjord head. Miki Fjord, the smallest fjord, is dominatedby glaciofluvial sediment input with a MAR of 0.29 g/cm2·yr of sediment at 10 km from the fjord head. Nansen Fjord isintermediate in size, with an iceberg-dominated sediment supply; MAR is 1.01 g/cm2·yr near the fjord head and 0.17 g/cm2·yr at20 km from the fjord head. 137Cs is used as a secondary indicator of sediment source, and the high activity level of 137Cs in MikiFjord indicates glaciofluvial sediment sources. Zones of constant activity in some of the box cores are attributed to eitherbioturbation in the surface mixed layer or turbidites. We would be hesitant to extend the recent 210Pb-based accumulation rates toestimate the Holocene accumulation rates.
Key words: mass accumulation, sediment accumulation, lead-210, cesium-137, Greenland, Iceland, fjords
RÉSUMÉ. On a calculé les taux d’accumulation de sédiments (TAS) et de masse (TAM) pour les cent dernières années à partirdes profils du 210Pb dans des carottes rectangulaires prélevées dans trois fjords et sur le plateau continental de la région deKangerlussuaq (est du Groenland), et sur le plateau continental du sud-ouest de l’Islande. Le TAM est plus faible dans l’est duGroenland (0,09 g/cm2 par an) que dans le sud-ouest de l’Islande (0,14 g/cm2 par an) en raison des différences dans la composantebiogène des sédiments, bien que le TAS soit similaire. La différence entre les taux d’accumulation des trois fjords de l’est duGroenland est due à leurs sources majeures de sédiments et à leurs bassins de réception. Le fjord Kangerlussuaq, le plus granddes trois, est dominé par un apport de sédiments provenant d’icebergs et a un TAM de 0,43 g/cm2 par an à 50 km de son extrémitéamont. Le fjord Miki, qui est le plus petit, est dominé par un apport de sédiments fluvio-glaciaires avec un TAM de 0,29 g/cm2
par an de sédiments à 10 km de son extrémité amont. Le fjord Nansen est de taille moyenne, et l’apport sédimentaire y provienten majorité d’icebergs; le TAM est de 1,01 g/cm2 par an près de l’extrémité amont et de 0,17 g/cm2 par an à 20 km de l’extrémitéamont. Le 137Cs est utilisé comme indicateur secondaire de la source de sédiments, et le niveau d’activité élevé du 137Cs dans lefjord Miki révèle que les sédiments sont d’origine fluvio-glaciaire. Dans certaines des carottes rectangulaires, on attribue les zonesd’activité constante soit à une bioturbation dans la couche mixte de surface, soit à des turbidités. Nous hésiterions à recourir auxrécents taux d’accumulation fondés sur le 210Pb pour estimer les taux d’accumulation durant l’holocène.
Mots clés: accumulation de masse, accumulation de sédiments, plomb 210, césium 137, Groenland, Islande, fjords
Traduit pour la revue Arctic par Nésida Loyer.
1 Department of Geological Sciences and Institute of Arctic and Alpine Research, University of Colorado, Campus Box 450, Boulder,Colorado 80309-0450, U.S.A
2 Present address: BP Exploration (Alaska), Inc., 900 E. Benson Blvd., Anchorage, Alaska 99519, U.S.A.; [email protected] Skidaway Institute of Oceanography, 10 Ocean Science Circle, Savannah, Georgia 31411, U.S.A.
© The Arctic Institute of North America
INTRODUCTION
High-resolution terrestrial, ice-core, and marine recordshave shown that the Holocene climate and ocean environ-ments are not stable, but are instead influenced by decadalto century-scale variability, especially in the Arctic(Dickson et al., 1988; Jennings and Weiner, 1996; An-drews et al., 1997; Overpeck et al., 1997). Additionally,although the Arctic may be one of the least populated
regions of the world, it may be highly susceptible toanthropogenically induced climate warming (Overpeck etal., 1997). Hence, studies of Arctic records of the recentpast provide information on both natural and human-induced climate variability.
In order to best interpret paleoenvironmental records,we need to calibrate the last 100 years of the record to thehistorical record. Yet, the calibration hinges on establish-ing a reliable chronology for the last 100 years of the
110 • L.M. SMITH et al.
paleoenvironmental record. Radiocarbon dating is thechronological tool most frequently used in paleoenviron-mental studies, but the fluctuating ∆14C of the atmosphereover the last 1000 years makes it difficult to developreliable chronologies for the most recent past (Stuiver,1993; Stuiver and Pearson, 1993). 210Pb is a better tool fordeveloping sediment and mass accumulation rates forsediments deposited during the last 150 years (Applebyand Oldfield, 1992). Yet, 210Pb is not a geochronologicaltool suitable for every glacial marine environment (Hardenet al., 1992; Jaeger and Nittrouer, 1999), and its usefulnessmust be evaluated for the marine setting under study.
To investigate the feasibility of constructing reliablechronologies for the last 100 years on the continentalshelves adjacent to the Denmark Strait, we applied 210Pbgeochronology methods to six box cores that recovered themost recently deposited sediments from the East Green-land shelf and fjords and the SW Iceland shelf. The boxcores were collected from different environmental set-tings, from the iceberg-dominated glacial marine environ-ment of East Greenland to the hemipelagic marineenvironment of the SW Iceland continental shelf (Fig. 1,Table 1). Sediment and mass accumulation rates are esti-mated from the 210Pb data and used to evaluatepaleoenvironmental changes in the study region over thelast century. This study has three objectives: (1) to develop210Pb-based accumulation rates for the fjords and continen-tal shelves bordering the Denmark Strait; (2) to compare210Pb-based accumulation rates of the two high-latitudecontinental shelves and the three contrasting fjords in thecontext of local sedimentary processes; and (3) to docu-ment any changes in sedimentation-related processes inthis region over the last century.
BACKGROUND
Physical Setting
The fjords and continental shelves of East Greenlandand West Iceland (Fig. 1) are a result of modification bytectonic, climatic, marine, and glaciological processes.Presently, East Greenland remains heavily glaciated(Dwyer, 1995) and is cooled by the cold, southward-flowing East Greenland Current. Marine sediments depos-ited within the Kangerlussuaq Trough on the East Greenlandshelf are rich in biogenic silica and contain a small compo-nent of iceberg-rafted detritus (Clapsaddle, 1994; Williamset al., 1995; Andersen, 1998). In contrast, southwest Ice-land is predominantly ice-free and is warmed by the warm,northward-flowing Irminger Current. The SW Icelandmarine sediments are characterized by tephra grains in thesand fraction and biogenic carbonate and fecal pellets(Jennings et al., 2000).
Three East Greenland fjords were investigated:Kangerlussuaq, Miki, and Nansen. Kangerlussuaq Fjord isthe largest and deepest of the three fjords (Fig. 1). The maintidewater glacier at the head drains the Greenland Ice Sheetand maintains a sikkusaq, a mélange of sea ice and icebergsat the tidewater terminus (Dwyer, 1995). Approximately15 km3 of ice is calved into the sikkusaq each year (Reeh,1985), and these icebergs take up to two years to transitthrough the sikkusaq (Dwyer, 1995; Syvitski et al., 1996).Miki Fjord is sinuous, narrow, and shallow (Fig. 1). Thereis a proglacial outwash delta at the fjord head formed bymeltwater streams emanating from the Sødalen Gletscher,which lies 5 km away in the hinterland (Geirsdóttir et al.,2000). Nansen Fjord is wide and short, and it is partiallysilled along the southwest (Fig. 1). Christian IV Gletscher,
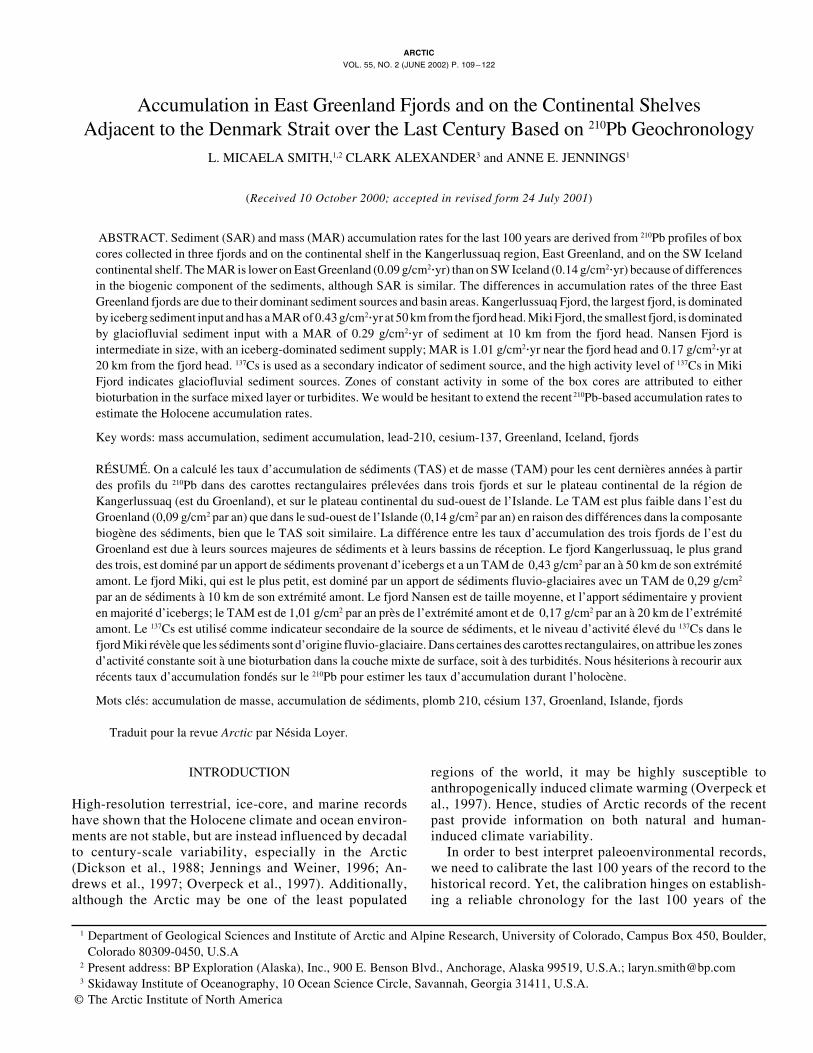
TABLE 1. 210Pb SAR and MAR rates for the six sediment cores from the East Greenland fjords and the East Greenland and southwest Icelandcontinental shelves used in this study (above), and radiocarbon dates for one of those (96-1212) and three other sediment cores (below).(Core 93-28 is from Syvitski et al., 1996; 91-K10 and 91-K14 are from Smith and Andrews, 2000.)
Core Core Latitude Longitude Water Core 14C sample Lab # Rep. Error Cal age One σ 10Pb 210Pb 210Pbtype1 (N) (W) Depth Length depth Age (yrs) (cal yrs) range method MAR SAR
(m) (cm) (cm) (cal yrs)
93-3 BC 64˚18.00 24˚13.9 250 55 alpha 0.14 0.2293-19 BC 67˚08.73 30˚49.34 713 60 alpha 0.09 0.2093-23 BC 68˚08.19 31˚52.62 878 54 alpha 0.43 0.4296-1212 LBC 68˚09.8 31˚21.6 30 45 gamma 0.25 0.396-1209 LBC 68˚17.8 29˚47.9 320 60 gamma 1.01 1.3696-1210 SBC 68˚11.00 29˚36.00 452 25 gamma 0.17 0.22
93-282 LCF 68˚08.05 31˚52.08 874 1560 1560 CAM-13044 1430 60 806 906 – 72196-12122 GC 68˚09.8 31˚21.6 30 100 20 AA-27762 5 40 modern n/a91-K102 GC 68˚09.51 31˚23.70 199 122 0 – 10 AA-8959 10530 135 n/a n/a
194 – 199 AA-8960 12220 130 n/a n/a91-K142 GC 68˚11.49 29˚35.74 459 162 49 – 51 AA-12891 855 60 313 431 – 270
114 – 117 AA-10567 1440 70 827 916 – 723>170 AA-8332 1798 111 1202 1295 – 1059
1 BC = box core, LBC = large box core, SBC = short box core, LCF = long core facility, and GC = gravity core.2 14C date references – 93-28 and 96-1212: Smith and Licht, 2000; 91-K10: Manley and Jennings, 1996; 91-K14: Jennings and Weiner,
1996.
210PB RATES OF SEDIMENT ACCUMULATION • 111
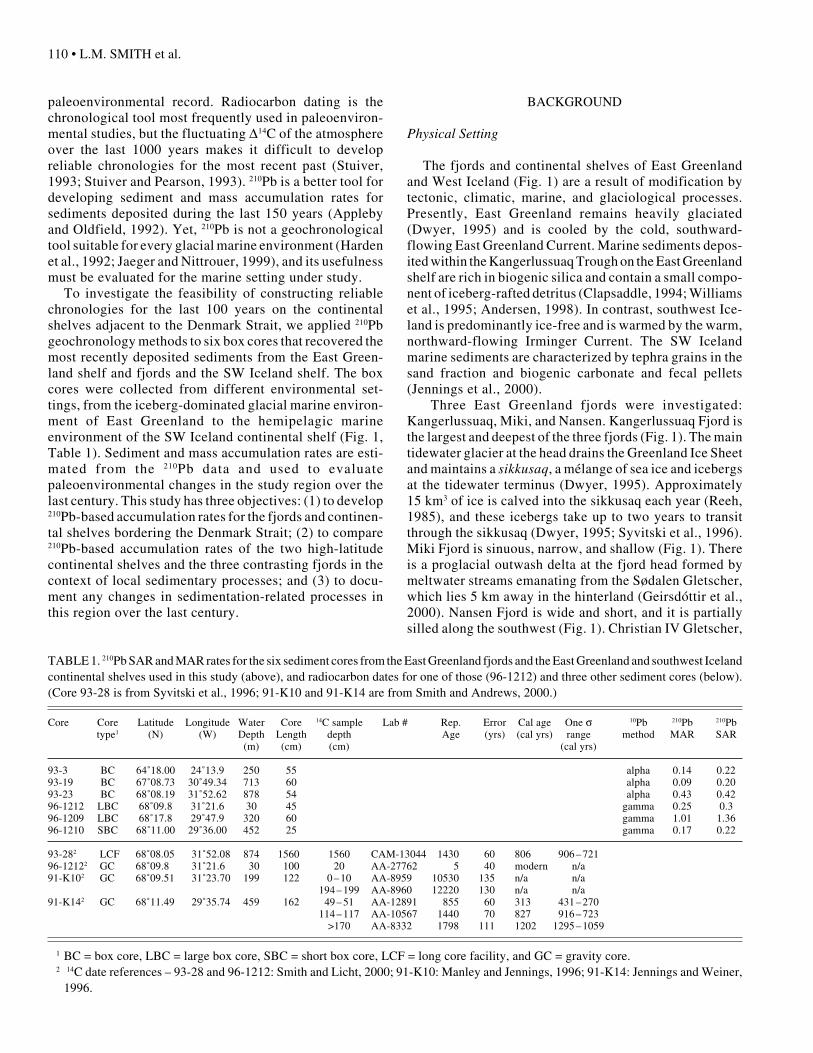
FIG. 1. Location map showing bathymetry (m), core locations, and ice cover extent (white areas on land) in the fjords and the inner continental shelf of theKangerlussuaq region, East Greenland, and southwest Iceland.
at the fjord head, drains a local ice cap and calves anestimated 2 km3 of icebergs per year (Andrews et al., 1994).The sediment input of the East Greenland fjords is domi-nated by rain-out processes from glacial marine sources,including tidewater-glacier margins, proglacial rivers, oriceberg-rafted debris, with secondary depositional proc-esses of gravity flows, either turbidites or debris flows(Andrews et al., 1994; Jennings and Weiner, 1996; Syvitskiet al., 1996; Smith and Andrews, 2000).
Previous Research
Previously published estimates of sediment accumula-tion rates (SAR) in the fjords and continental shelves ofEast Greenland and SW Iceland (Table 2) were based onradiocarbon dating of foraminifera and molluscs (An-drews et al., 1994, 1996; Jennings and Weiner, 1996;Syvitski et al., 1996; Jennings et al., 2000, 2001). There isone study of the modern-day SAR and mass accumulation
112 • L.M. SMITH et al.
rate from Kangerlussuaq Fjord (Syvitski et al., 1996). Thebiogenic, silica-rich sediments of the East Greenland fjordsand continental shelves are sometimes deficient in enoughcarbonate material for radiocarbon dating at close inter-vals (Andrews et al., 1994, 1996, 1997; Jennings andWeiner, 1996; Syvitski et al., 1996; Smith, 1997). Radio-carbon dating of bulk sedimentary organic material in EastGreenland produced erroneously old ages because of con-tamination by old carbon from ancient sedimentary rocksand coal deposits (Andrews et al., 1994).
The most recent radiocarbon-based estimates of SARfor East Greenland fjords (Table 2) are 0.83 cm/yr forKangerlussuaq Fjord, 0.12 cm/yr for Miki Fjord, and from0.18 to 0.13 cm/yr for two sites in Nansen Fjord (Jenningsand Weiner, 1996; Smith, 1997). The modern-day SARestimates for Kangerlussuaq Fjord, based on shipboardobservations and floc-camera data, range from 2.4 cm/yrat the fjord head to 0.6 cm/yr at the mouth of the fjord, witha basin average of 0.9 cm/yr (Syvitski et al., 1996). InKangerlussuaq Trough, the radiocarbon-based estimate ofSAR is 0.006 cm/yr (Andrews et al., 1996). In SW Iceland,the radiocarbon-based SAR is 0.002 cm/yr (Hagen, 1995;Jennings et al., 2001).
Use of 210Pb and 137Cs Activity as Geochronological Tools
The application of 210Pb as a dating tool for high-resolu-tion records deposited over the past 150 years was firstintroduced by Goldberg (1963). Lead-210 is not an absoluteclock; instead, it yields a relationship between depth andtime from which sediment accumulation rates are derived(Crusius and Anderson, 1992). These rates can be verifiedby a second radiotracer, such as 137Cs, 241Pu, or 239+240Pu(Alexander et al., 1991; Appleby and Oldfield, 1992; Crusiusand Anderson, 1992). Lead-210 enters lakes, estuaries, ormarine environments primarily from two sources. The firstis scavenging of unsupported (termed “excess”) 210Pb de-rived from decay of gaseous 222Rn, the daughter of 226Ra,which diffuses out of soils to decay to 210Pb in the atmos-phere, in rivers, and in the ocean. The second source is in-situ decay of 226Ra within deposited sediments (termed“supported” 210Pb) (Oldfield, 1983). Supported 210Pb is theresult of in-situ decay of 222Rn within sediments and isconsidered to be in secular equilibrium with its parent, 226Ra
(Oldfield, 1983; Appleby and Oldfield, 1992). The excess210Pb provides the data needed to calculate accumulationrates and age dating. Excess 210Pb is calculated by subtract-ing the amount of measured supported 210Pb from the totalmeasured amount of 210Pb and is usually reported indisintegrations per minute/gram (dpm/g).
The use of 210Pb to calculate sediment accumulationrates from the amount of unsupported 210Pb is dependentupon the basic assumption that the initial excess 210Pbactivity in sediment is constant, is not redistributed orremobilized by post-depositional processes, and decaysexponentially with time in accordance with the radioactivedecay law (Oldfield, 1983; Appleby, 1993). The source ofexcess 210Pb in marine sediments cannot always be attrib-uted solely to atmospheric flux, because the atmosphericflux of excess 210Pb to marine environments decreases withdistance from the lithogenic source of 226Ra. Other sourcesof excess 210Pb include riverine runoff, glacial, iceberg orsea-ice meltwater, and decay of 226Ra within the watercolumn. The decay of 226Ra within the water column isespecially important in the ocean because upwelled waterhas large amounts of excess 210Pb. Bioturbation or re-suspension of sediment (or both) after deposition maysignificantly alter the activity profile of excess 210Pb andproduce incorrect sediment accumulation rates unless takeninto account (Appleby and Oldfield, 1992). Determinationof the surficial mixed layer, typically formed by bioturbationor current or wave action, is crucial to 210Pb chronologybecause the measured activity of excess 210Pb will beconstant through the sediment mixed layer (Nittrouer,1978). Deeper in the sediment column, intervals of con-stant 210Pb activity levels may be attributed to sedimentgravity flows or current winnowing (Harden et al., 1992).
Cesium-137 is a particle-reactive impulse tracer derivedfrom atmospheric nuclear weapons testing. It was firstintroduced into the environment in 1954, reaching a peak ininput in 1963, and its input has declined with the shift tobelow-ground testing in subsequent decades. Cesium-137on particles derived from land and freshwater environ-ments is tightly bound, whereas the 137Cs scavenged bymarine particles is relatively exchangeable (Zucker et al.,1984; Olsen et al., 1989). Thus, a high activity level of 137Csin marine sediments typically indicates terrestrial sources.The integrity of the 137Cs signal can be influenced by
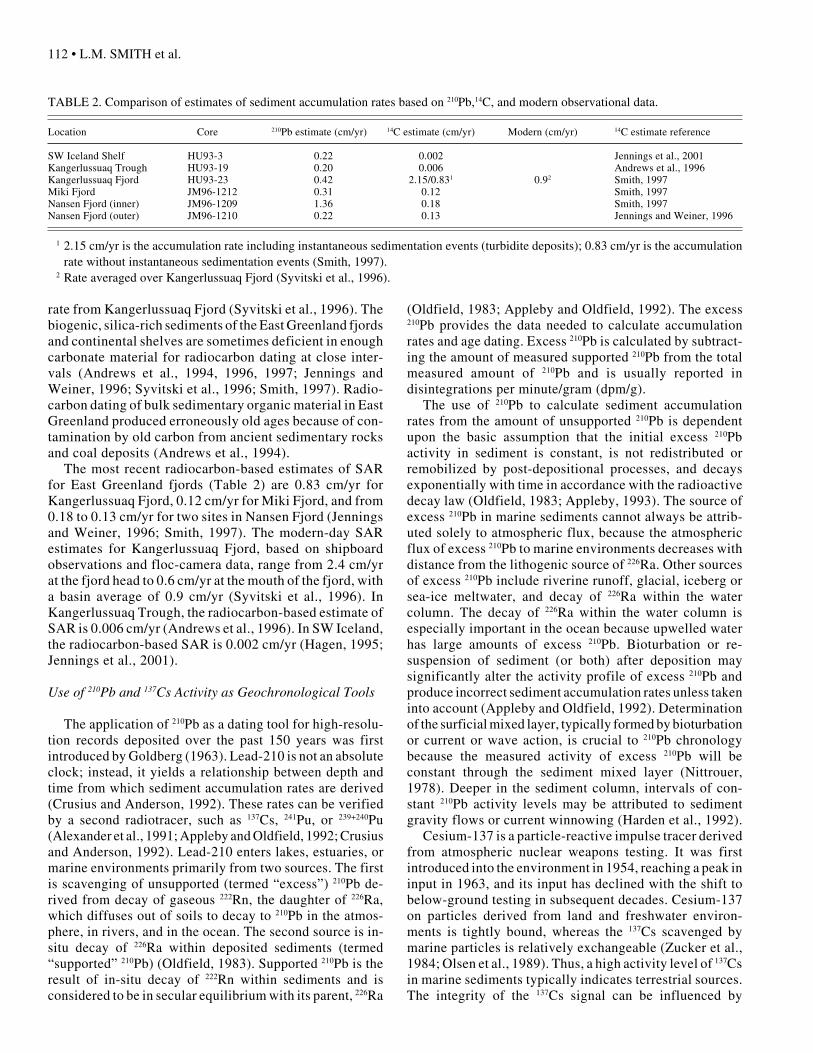
TABLE 2. Comparison of estimates of sediment accumulation rates based on 210Pb,14C, and modern observational data.
Location Core 210Pb estimate (cm/yr) 14C estimate (cm/yr) Modern (cm/yr) 14C estimate reference
SW Iceland Shelf HU93-3 0.22 0.002 Jennings et al., 2001Kangerlussuaq Trough HU93-19 0.20 0.006 Andrews et al., 1996Kangerlussuaq Fjord HU93-23 0.42 2.15/0.831 0.92 Smith, 1997Miki Fjord JM96-1212 0.31 0.12 Smith, 1997Nansen Fjord (inner) JM96-1209 1.36 0.18 Smith, 1997Nansen Fjord (outer) JM96-1210 0.22 0.13 Jennings and Weiner, 1996
1 2.15 cm/yr is the accumulation rate including instantaneous sedimentation events (turbidite deposits); 0.83 cm/yr is the accumulationrate without instantaneous sedimentation events (Smith, 1997).
2 Rate averaged over Kangerlussuaq Fjord (Syvitski et al., 1996).
210PB RATES OF SEDIMENT ACCUMULATION • 113
drainage basin storage of sediment, biological mixing, andsedimentary processes that redistribute seabed material. Inglacierized drainage basins, 137Cs may clarify whether thesediment is sourced directly from the glacier or is erodedand transported in the proglacial area by glaciofluvialprocesses (Hasholt and Walling, 1992).
METHODOLOGY
Field Methods
Sediment cores were collected from the fjords and innercontinental shelves during joint oceanographic cruises ofthe Institute of Arctic and Alpine Research (INSTAAR)with the Bedford Institute of Oceanography in the fall of1993 (cruise HU93030) and with the University of Tromsøin the fall of 1996 (cruise JM96) (Table 1). Box cores wererecovered and at least two subcores (10 cm diameter) wereremoved. One subcore from each of the 1993 box coreswas split lengthwise, described, x-radiographed, and sam-pled at INSTAAR in 2 cm intervals for 210Pb andsedimentological analysis. A second subcore was sampledon board for living foraminifera assemblage data. Aftercore collection, all of the 1996 subcores were immediatelyfrozen on board in an upright position because of ex-tremely high water content. We do not think that freezingthe cores had any major effect on core stratigraphy or thesedimentology data collected from the cores. The frozencores were extruded from the core liner and sliced into2 cm intervals on board, thus the cores were not describedor x-radiographed. The outer rind of sediment from each 2cm thick sample was removed because of possible sampledisturbance. These samples were stored in the cold roomand shipped to INSTAAR for sample preparation for 210Pband sedimentological analysis.
Laboratory Methods
Radionuclide Measurement: Sediments from box coresin all three fjords and the continental shelves were analyzedfor 210Pb activity (Table 1). The 210Pb samples from the1993 box cores recovered in Kangerlussuaq Fjord (HU93-23) and at the two continental shelf sites (HU93-19 andHU93-3) were shipped wet to Skidaway Institute of Ocea-nography, Georgia, for 210Pb measurement by alpha count-ing, using the technique described in Nittrouer (1978).Alpha counting determines 210Pb activity by measuring theactivity of 210Po, the granddaughter of 210Pb. 210Pb and 210Poare typically in equilibrium in the seabed. Samples weredried and ground, spiked with 208Po tracer (for yield deter-mination), and leached in nitric and hydrochloric acids.The leachate was separated from the solids by centrifuga-tion, and the dissolved polonium isotopes in the liquidwere plated spontaneously onto a silver planchet. Cesium-137, typically analyzed by gamma techniques, was notdetermined for samples by alpha counting.
The 210Pb samples from the 1996 box cores recovered inMiki Fjord (JM96-1212) and Nansen Fjord (JM96-1209,JM96-1210) were weighed wet, freeze-dried, and weigheddry, and 30 g of sediment was ground in a porcelain mortarand pestle. The ground sediment samples were shipped toSkidaway Institute of Oceanography for 210Pb measure-ment by gamma counting techniques. Ground samples forgamma analysis of 210Pb and 137Cs were sealed in samplecontainers for 20 days to allow ingrowth of 222Rn. Total210Pb was determined by measurement of the 46.5-KeV210Pb gamma peak (Cutshall et al., 1983). Supported 210Pbfrom the decay of 226Ra within the seabed was determinedby measurement of the granddaughters of 226Ra, 214Pb (at295 and 352-KeV) and 214Bi (at 609-KeV). Unsupported210Pb was determined by subtracting total 210Pb activityfrom supported 210Pb activity for each interval. Cesium-137 activity in each interval was determined directly bygamma spectroscopic measurement of its 662-KeVgamma peak (Kuehl et al., 1986), with a detection limit of0.05 dpm/g. Samples were corrected for self-adsorptionusing the technique of Cutshall et al. (1983). Accumula-tion rates were calculated by applying a constant initialconcentration model to profiles of unsupported 210Pb activ-ity versus cumulative mass with depth (Oldfield andAppleby, 1984). Cumulative errors associated with the210Pb dating technique typically result in variation of 25%in calculated values (Kuehl et al., 1986; Alexander et al.,1991; Sommerfield and Nittrouer, 1999).
Sedimentology: Bulk density, total organic carbon(TOC), and magnetic susceptibility (MS) measurementswere made on 10 cm3 size samples from both the 1993 andthe 1996 box cores. The bulk density of both the wet anddry unit weights was calculated for each sample. The wetsample was weighed, divided by the sample volume, dried,and disaggregated through a 2000 µm screen. A repre-sentative sample of the material smaller than 2000 µm wasweighed and then oven-dried. The ratio of the weight of theoven-dried sample to the air-dried sample was calculatedand multiplied by the total weight of the air-dried samplesmaller than 2000 µm in order to obtain an oven-driedweight for the fraction smaller than 2000 µm. The oven-dried weight for this fraction was added to the oven-driedweight of the sample larger than 2000 µm, and the resultwas divided by the volume of the total sample in order tocalculate the dry unit weight.
Samples for organic carbon measurements were freezedried, milled to smaller than 500 µm, and analyzed on aUIC Coulometrics CM5012 CO2 Coulometer. Magneticsusceptibility data for the 1993 box cores were collectedon board on the whole core (volume MS) and converted tomass MS with the bulk density; mass MS data from the1996 box cores were collected on discrete samples. BothMS measurements were made using a Barlington M.S. 2Susceptibility Meter.
Porosity was calculated by water loss. Wet sedimentwas weighed, oven-dried, and reweighed to determine thevolume of water in each sample. Porosity was determined

114 • L.M. SMITH et al.
after correcting for salt content, assuming a mineral den-sity of 2.65 g/cc.
Bioturbation Evidence: Foraminifera samples weretaken every cm from the 1993 box cores and were fixed inbuffered Formalin on board. The samples were washed ona 63 µm sieve. The greater than 63 µm fraction was stainedwith Rose Bengal solution overnight to distinguish livingfrom dead specimens. Samples were dried and sieved at125 µm. A Soiltest, Inc. microsplitter was used to obtain arepresentative split of about 300 foraminifera from thefraction larger than 125 µm. Benthic foraminifera, bothliving (stained) and dead (unstained), were picked andidentified using a stereomicroscope. The number of livingforaminifera per milliliter is used as a bioturbation index,with a higher number of living foraminifera per ml indicat-ing more bioturbation.
RESULTS
Continental Shelves
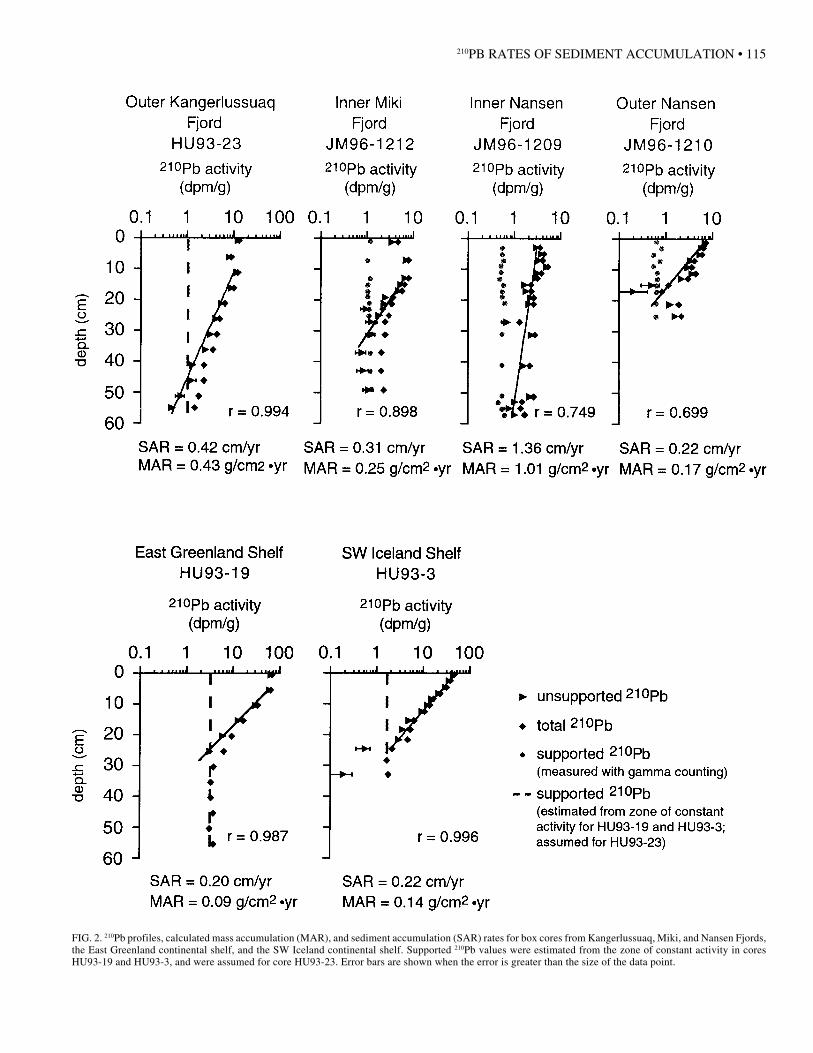
The two continental shelf sites are situated within shelfbasins and are located approximately the same distance(150 km) from the coast. The core raised from the EastGreenland shelf (HU93-19) consists of gray, silty claywith few, small dropstones, minor bioturbation at the coretop, and sand-filled burrows scattered throughout the core.The 210Pb estimate of mass accumulation rate for HU93-19is 0.09 g/cm2·yr, with an equivalent sediment accumula-tion of 0.20 cm/yr (Fig. 2). Across the Denmark Strait onthe SW Iceland shelf, sediment recovered in core HU93-3consists of tan-gray silty clay, with bioturbation evidentthroughout the core. But sediment structures are still visiblein x-radiograph, regardless of bioturbation. Core HU93-3has a 210Pb estimate of mass accumulation of 0.14 g(cm2 ·yr)and sediment accumulation of 0.22 cm/yr (Fig. 2).
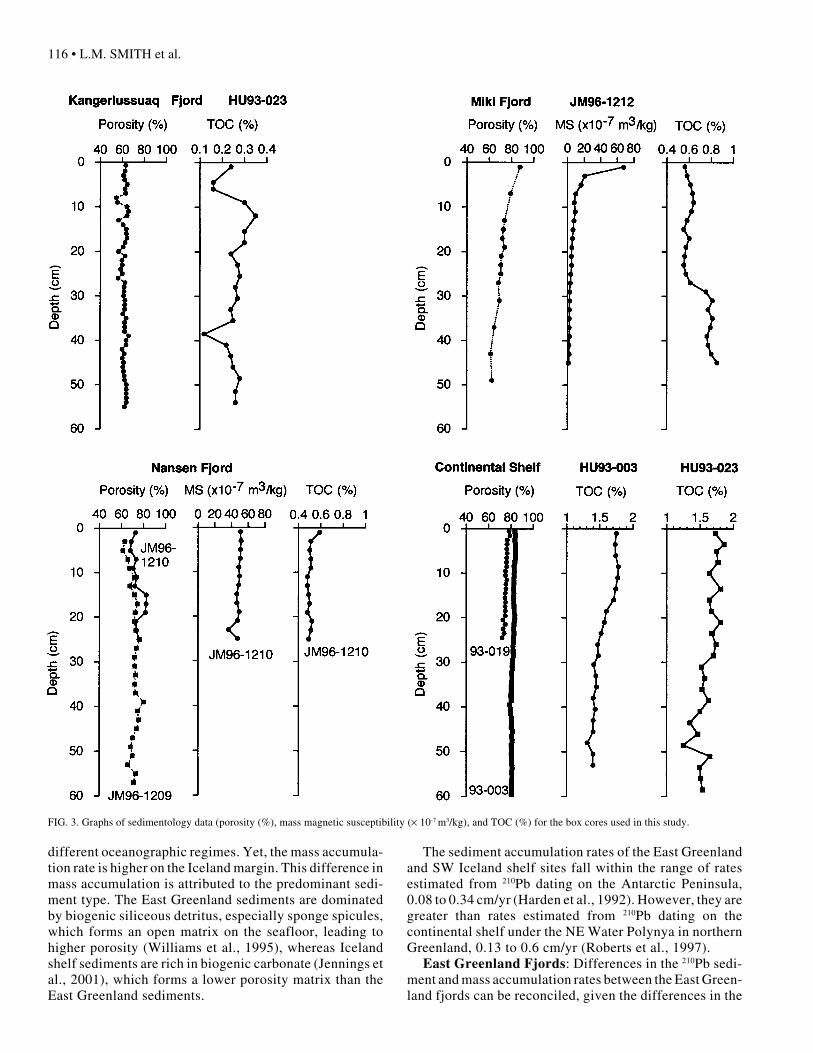
The East Greenland shelf sediments have a higherporosity (83%) than the SW Iceland shelf sediments (75%)(Fig. 3). The TOC and MS are similar on both continentalshelves, varying from 1.3 to 1.85% and from 30 to 120 ×10-7 m3/kg, respectively (Fig. 3).
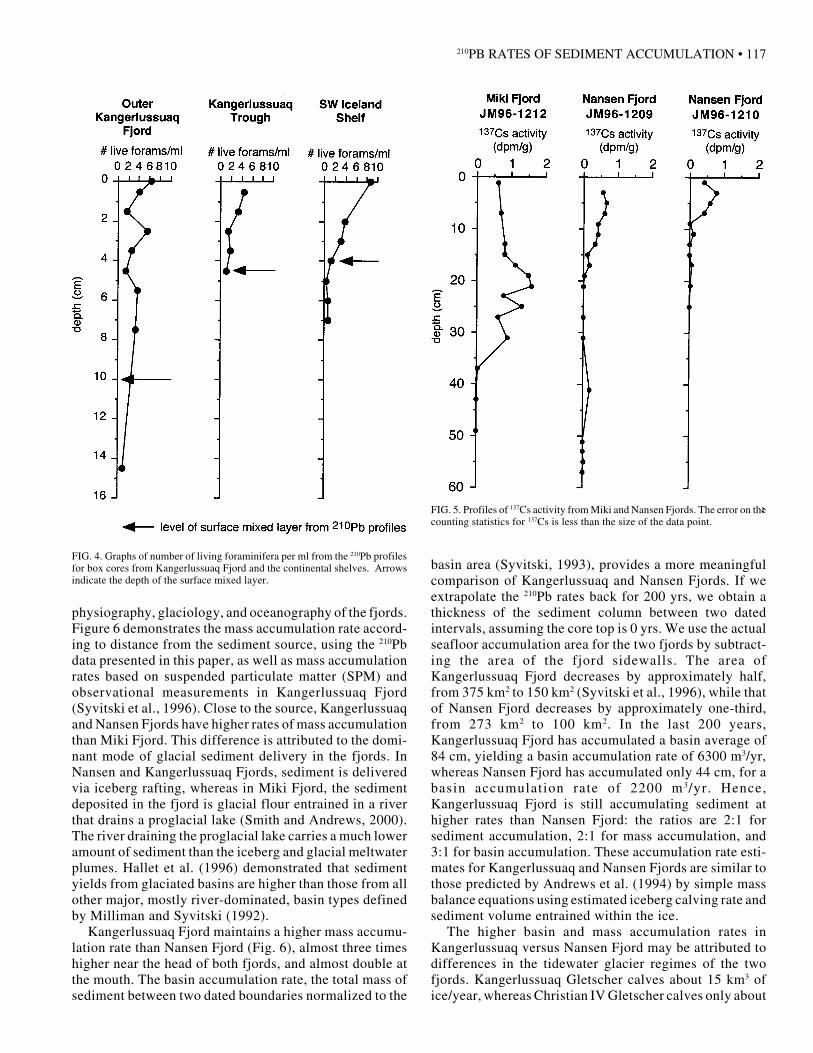
Bioturbation is occurring to approximately 5 cm depthin the continental shelf cores, as indicated by the presenceof 2 – 10 live foraminifera/ml down to this depth (Fig. 4).
East Greenland Fjords
Sediment recovered in core HU93-23 fromKangerlussuaq Fjord consists of dark gray, silty clay withhigh amounts of dropstones throughout the core and littleevidence for bioturbation. The 210Pb data from core HU93-23, located close to the fjord mouth, indicates that the massaccumulation in outer Kangerlussuaq Fjord is 0.43 g/cm2·yrand the sediment accumulation is 0.42 cm/yr (Fig. 2). ForMiki Fjord (JM96-1212), the 210Pb activity from the innerfjord, a few kilometers from the fjord head, produces a
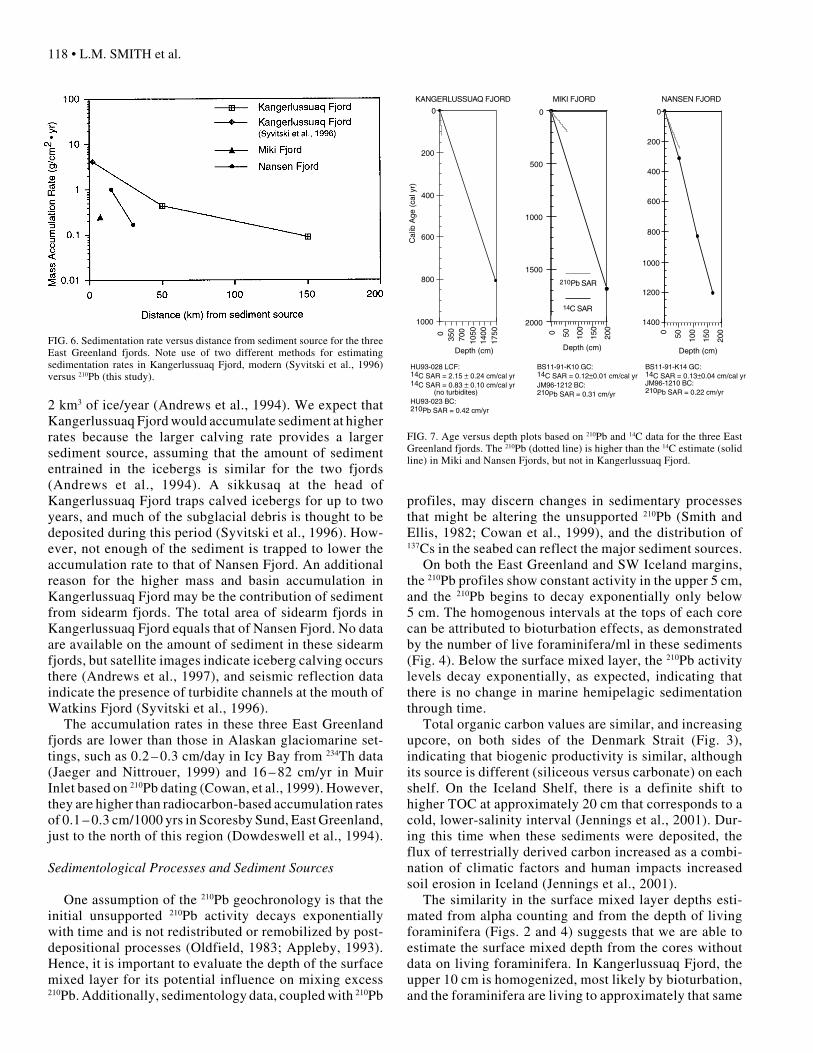
mass accumulation rate of 0.29 g/cm2·yr and a sedimentaccumulation rate of 0.37 cm/yr (Fig. 2). The 137Cs peak inMiki Fjord is found at 21 cm depth (Fig. 5). In NansenFjord, two box cores, one at mid-fjord and one at the fjordmouth, were measured for 210Pb activity. Core JM96-1209is located approximately 15 km from the fjord head and hasa mass accumulation rate of 1.01 g/cm2·yr and a sedimentaccumulation rate of 1.36 cm/yr (Fig. 2). JM96-1210 islocated at the fjord mouth, 30 km from the head, andproduces a mass accumulation of 0.17 g/cm2·yr and asediment accumulation of 0.22 cm/yr (Fig. 2). The 137Csspike is at 5 cm depth in inner Nansen Fjord (JM96-1209)and at 2.5 cm depth in outer Nansen Fjord (JM96-1210)(Fig. 5).
The porosity differs in sediments from each of the EastGreenland fjord box cores (Fig. 3). In Kangerlussuaq Fjord,the porosity is fairly constant downcore at 62%. There aresome intervals with slightly lower porosity. In Miki Fjord,the porosity steadily decreases downcore from 96% toalmost 60%. In Nansen Fjord, the inner fjord site (JM96-1209) has a lower porosity than the outer fjord (JM96-1210). The porosity at both sites increases downcore.
Kangerlussuaq Fjord has the lowest TOC of the threefjords, and Miki and Nansen Fjords have similar TOC(Fig. 3). All three fjords have lower TOC than was ob-served in cores recovered from the fjords in 1991 (Smithand Andrews, 2000). MS in Kangerlussuaq Fjord is lessthan 30 × 10-7 m3/kg. The MS in Miki Fjord is highest(70 × 10-7 m3/kg) at the core top, and steadily decreasesdowncore to approximately 10 × 10-7 m3/kg. The MS inNansen Fjord is approximately 50 × 10-7 m3/kg. The differ-ences in the TOC and MS values in the three fjords areattributed to the physiographic differences of the threefjords (Smith and Andrews, 2000).
In Kangerlussuaq Fjord, bioturbation is evident to ap-proximately 5 cm depth, as indicated by the approximately2 – 10 foraminifera/ml living to this depth (Fig. 4).
DISCUSSION
Sediment and mass accumulation rates based on 210Pbdata are, as expected, higher in the East Greenland fjordsthan on the East Greenland continental margin (Andrewsand Syvitski, 1994). Hence, the fjords are acting as trapsfor sediment, as is typical for fjords in interglacial periods(Syvitski et al., 1987). The continental shelf has a steadierrate of sediment accumulation than the fjords; thus, the210Pb profiles for the shelf cores (Fig. 2) reflect this steadi-ness and are not an artifact of having used alpha versusgamma counting techniques.
Comparison of Mass Accumulation Rates
Continental Shelves: The two continental shelves havesimilar rates of sediment accumulation (Fig. 2), althoughthe two sites are on opposite sides of the polar front and in
210PB RATES OF SEDIMENT ACCUMULATION • 115
FIG. 2. 210Pb profiles, calculated mass accumulation (MAR), and sediment accumulation (SAR) rates for box cores from Kangerlussuaq, Miki, and Nansen Fjords,the East Greenland continental shelf, and the SW Iceland continental shelf. Supported 210Pb values were estimated from the zone of constant activity in coresHU93-19 and HU93-3, and were assumed for core HU93-23. Error bars are shown when the error is greater than the size of the data point.
116 • L.M. SMITH et al.
different oceanographic regimes. Yet, the mass accumula-tion rate is higher on the Iceland margin. This difference inmass accumulation is attributed to the predominant sedi-ment type. The East Greenland sediments are dominatedby biogenic siliceous detritus, especially sponge spicules,which forms an open matrix on the seafloor, leading tohigher porosity (Williams et al., 1995), whereas Icelandshelf sediments are rich in biogenic carbonate (Jennings etal., 2001), which forms a lower porosity matrix than theEast Greenland sediments.
The sediment accumulation rates of the East Greenlandand SW Iceland shelf sites fall within the range of ratesestimated from 210Pb dating on the Antarctic Peninsula,0.08 to 0.34 cm/yr (Harden et al., 1992). However, they aregreater than rates estimated from 210Pb dating on thecontinental shelf under the NE Water Polynya in northernGreenland, 0.13 to 0.6 cm/yr (Roberts et al., 1997).
East Greenland Fjords: Differences in the 210Pb sedi-ment and mass accumulation rates between the East Green-land fjords can be reconciled, given the differences in the
FIG. 3. Graphs of sedimentology data (porosity (%), mass magnetic susceptibility (× 10-7 m3/kg), and TOC (%) for the box cores used in this study.
210PB RATES OF SEDIMENT ACCUMULATION • 117
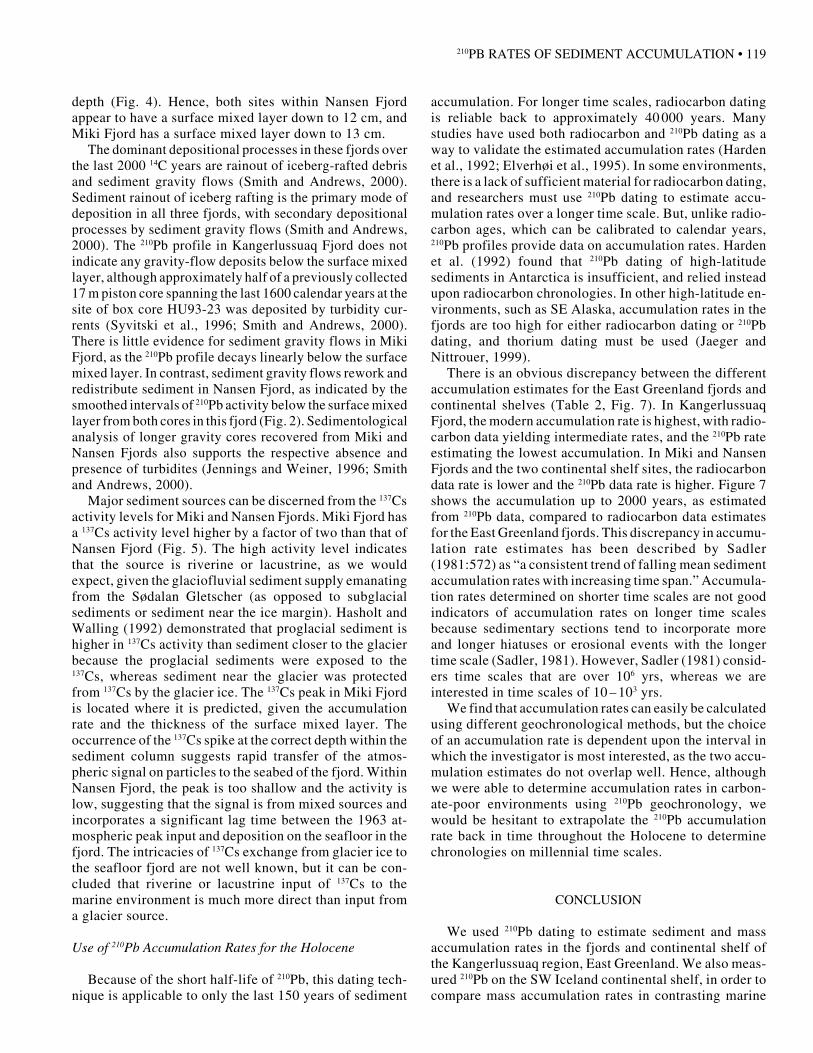
physiography, glaciology, and oceanography of the fjords.Figure 6 demonstrates the mass accumulation rate accord-ing to distance from the sediment source, using the 210Pbdata presented in this paper, as well as mass accumulationrates based on suspended particulate matter (SPM) andobservational measurements in Kangerlussuaq Fjord(Syvitski et al., 1996). Close to the source, Kangerlussuaqand Nansen Fjords have higher rates of mass accumulationthan Miki Fjord. This difference is attributed to the domi-nant mode of glacial sediment delivery in the fjords. InNansen and Kangerlussuaq Fjords, sediment is deliveredvia iceberg rafting, whereas in Miki Fjord, the sedimentdeposited in the fjord is glacial flour entrained in a riverthat drains a proglacial lake (Smith and Andrews, 2000).The river draining the proglacial lake carries a much loweramount of sediment than the iceberg and glacial meltwaterplumes. Hallet et al. (1996) demonstrated that sedimentyields from glaciated basins are higher than those from allother major, mostly river-dominated, basin types definedby Milliman and Syvitski (1992).
Kangerlussuaq Fjord maintains a higher mass accumu-lation rate than Nansen Fjord (Fig. 6), almost three timeshigher near the head of both fjords, and almost double atthe mouth. The basin accumulation rate, the total mass ofsediment between two dated boundaries normalized to the
basin area (Syvitski, 1993), provides a more meaningfulcomparison of Kangerlussuaq and Nansen Fjords. If weextrapolate the 210Pb rates back for 200 yrs, we obtain athickness of the sediment column between two datedintervals, assuming the core top is 0 yrs. We use the actualseafloor accumulation area for the two fjords by subtract-ing the area of the fjord sidewalls. The area ofKangerlussuaq Fjord decreases by approximately half,from 375 km2 to 150 km2 (Syvitski et al., 1996), while thatof Nansen Fjord decreases by approximately one-third,from 273 km2 to 100 km2. In the last 200 years,Kangerlussuaq Fjord has accumulated a basin average of84 cm, yielding a basin accumulation rate of 6300 m3/yr,whereas Nansen Fjord has accumulated only 44 cm, for abasin accumulation rate of 2200 m3/yr. Hence,Kangerlussuaq Fjord is still accumulating sediment athigher rates than Nansen Fjord: the ratios are 2:1 forsediment accumulation, 2:1 for mass accumulation, and3:1 for basin accumulation. These accumulation rate esti-mates for Kangerlussuaq and Nansen Fjords are similar tothose predicted by Andrews et al. (1994) by simple massbalance equations using estimated iceberg calving rate andsediment volume entrained within the ice.
The higher basin and mass accumulation rates inKangerlussuaq versus Nansen Fjord may be attributed todifferences in the tidewater glacier regimes of the twofjords. Kangerlussuaq Gletscher calves about 15 km3 ofice/year, whereas Christian IV Gletscher calves only about
FIG. 4. Graphs of number of living foraminifera per ml from the 210Pb profilesfor box cores from Kangerlussuaq Fjord and the continental shelves. Arrowsindicate the depth of the surface mixed layer.
FIG. 5. Profiles of 137Cs activity from Miki and Nansen Fjords. The error on thecounting statistics for 137Cs is less than the size of the data point.
118 • L.M. SMITH et al.
HU93-028 LCF:14C SAR = 2.15 ± 0.24 cm/cal yr14C SAR = 0.83 ± 0.10 cm/cal yr
(no turbidites)HU93-023 BC:210Pb SAR = 0.42 cm/yr
0
200
400
600
800
1000
035
070
010
5014
0017
50
Cal
ib A
ge (
cal y
r)
Depth (cm)
KANGERLUSSUAQ FJORD MIKI FJORD
BS11-91-K10 GC:14C SAR = 0.12±0.01 cm/cal yrJM96-1212 BC:210Pb SAR = 0.31 cm/yr
NANSEN FJORD
BS11-91-K14 GC:14C SAR = 0.13±0.04 cm/cal yrJM96-1210 BC:210Pb SAR = 0.22 cm/yr
0
500
1000
1500
2000
0 50 100
150
200
Depth (cm)
0
200
400
600
800
1000
1200
1400
0 50 100
150
200
Depth (cm)
210Pb SAR
14C SAR
2 km3 of ice/year (Andrews et al., 1994). We expect thatKangerlussuaq Fjord would accumulate sediment at higherrates because the larger calving rate provides a largersediment source, assuming that the amount of sedimententrained in the icebergs is similar for the two fjords(Andrews et al., 1994). A sikkusaq at the head ofKangerlussuaq Fjord traps calved icebergs for up to twoyears, and much of the subglacial debris is thought to bedeposited during this period (Syvitski et al., 1996). How-ever, not enough of the sediment is trapped to lower theaccumulation rate to that of Nansen Fjord. An additionalreason for the higher mass and basin accumulation inKangerlussuaq Fjord may be the contribution of sedimentfrom sidearm fjords. The total area of sidearm fjords inKangerlussuaq Fjord equals that of Nansen Fjord. No dataare available on the amount of sediment in these sidearmfjords, but satellite images indicate iceberg calving occursthere (Andrews et al., 1997), and seismic reflection dataindicate the presence of turbidite channels at the mouth ofWatkins Fjord (Syvitski et al., 1996).
The accumulation rates in these three East Greenlandfjords are lower than those in Alaskan glaciomarine set-tings, such as 0.2 – 0.3 cm/day in Icy Bay from 234Th data(Jaeger and Nittrouer, 1999) and 16 – 82 cm/yr in MuirInlet based on 210Pb dating (Cowan, et al., 1999). However,they are higher than radiocarbon-based accumulation ratesof 0.1 – 0.3 cm/1000 yrs in Scoresby Sund, East Greenland,just to the north of this region (Dowdeswell et al., 1994).
Sedimentological Processes and Sediment Sources
One assumption of the 210Pb geochronology is that theinitial unsupported 210Pb activity decays exponentiallywith time and is not redistributed or remobilized by post-depositional processes (Oldfield, 1983; Appleby, 1993).Hence, it is important to evaluate the depth of the surfacemixed layer for its potential influence on mixing excess210Pb. Additionally, sedimentology data, coupled with 210Pb
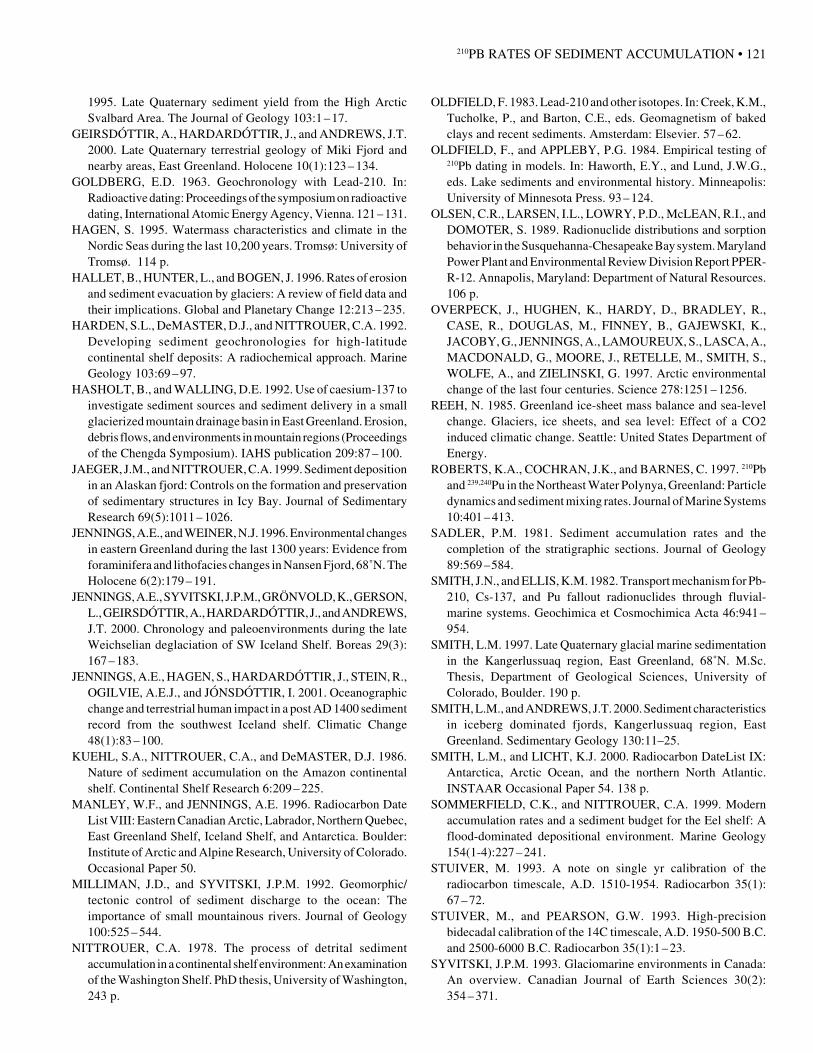
FIG. 7. Age versus depth plots based on 210Pb and 14C data for the three EastGreenland fjords. The 210Pb (dotted line) is higher than the 14C estimate (solidline) in Miki and Nansen Fjords, but not in Kangerlussuaq Fjord.
FIG. 6. Sedimentation rate versus distance from sediment source for the threeEast Greenland fjords. Note use of two different methods for estimatingsedimentation rates in Kangerlussuaq Fjord, modern (Syvitski et al., 1996)versus 210Pb (this study).
profiles, may discern changes in sedimentary processesthat might be altering the unsupported 210Pb (Smith andEllis, 1982; Cowan et al., 1999), and the distribution of137Cs in the seabed can reflect the major sediment sources.
On both the East Greenland and SW Iceland margins,the 210Pb profiles show constant activity in the upper 5 cm,and the 210Pb begins to decay exponentially only below5 cm. The homogenous intervals at the tops of each corecan be attributed to bioturbation effects, as demonstratedby the number of live foraminifera/ml in these sediments(Fig. 4). Below the surface mixed layer, the 210Pb activitylevels decay exponentially, as expected, indicating thatthere is no change in marine hemipelagic sedimentationthrough time.
Total organic carbon values are similar, and increasingupcore, on both sides of the Denmark Strait (Fig. 3),indicating that biogenic productivity is similar, althoughits source is different (siliceous versus carbonate) on eachshelf. On the Iceland Shelf, there is a definite shift tohigher TOC at approximately 20 cm that corresponds to acold, lower-salinity interval (Jennings et al., 2001). Dur-ing this time when these sediments were deposited, theflux of terrestrially derived carbon increased as a combi-nation of climatic factors and human impacts increasedsoil erosion in Iceland (Jennings et al., 2001).
The similarity in the surface mixed layer depths esti-mated from alpha counting and from the depth of livingforaminifera (Figs. 2 and 4) suggests that we are able toestimate the surface mixed depth from the cores withoutdata on living foraminifera. In Kangerlussuaq Fjord, theupper 10 cm is homogenized, most likely by bioturbation,and the foraminifera are living to approximately that same
210PB RATES OF SEDIMENT ACCUMULATION • 119
depth (Fig. 4). Hence, both sites within Nansen Fjordappear to have a surface mixed layer down to 12 cm, andMiki Fjord has a surface mixed layer down to 13 cm.
The dominant depositional processes in these fjords overthe last 2000 14C years are rainout of iceberg-rafted debrisand sediment gravity flows (Smith and Andrews, 2000).Sediment rainout of iceberg rafting is the primary mode ofdeposition in all three fjords, with secondary depositionalprocesses by sediment gravity flows (Smith and Andrews,2000). The 210Pb profile in Kangerlussuaq Fjord does notindicate any gravity-flow deposits below the surface mixedlayer, although approximately half of a previously collected17 m piston core spanning the last 1600 calendar years at thesite of box core HU93-23 was deposited by turbidity cur-rents (Syvitski et al., 1996; Smith and Andrews, 2000).There is little evidence for sediment gravity flows in MikiFjord, as the 210Pb profile decays linearly below the surfacemixed layer. In contrast, sediment gravity flows rework andredistribute sediment in Nansen Fjord, as indicated by thesmoothed intervals of 210Pb activity below the surface mixedlayer from both cores in this fjord (Fig. 2). Sedimentologicalanalysis of longer gravity cores recovered from Miki andNansen Fjords also supports the respective absence andpresence of turbidites (Jennings and Weiner, 1996; Smithand Andrews, 2000).
Major sediment sources can be discerned from the 137Csactivity levels for Miki and Nansen Fjords. Miki Fjord hasa 137Cs activity level higher by a factor of two than that ofNansen Fjord (Fig. 5). The high activity level indicatesthat the source is riverine or lacustrine, as we wouldexpect, given the glaciofluvial sediment supply emanatingfrom the Sødalan Gletscher (as opposed to subglacialsediments or sediment near the ice margin). Hasholt andWalling (1992) demonstrated that proglacial sediment ishigher in 137Cs activity than sediment closer to the glacierbecause the proglacial sediments were exposed to the137Cs, whereas sediment near the glacier was protectedfrom 137Cs by the glacier ice. The 137Cs peak in Miki Fjordis located where it is predicted, given the accumulationrate and the thickness of the surface mixed layer. Theoccurrence of the 137Cs spike at the correct depth within thesediment column suggests rapid transfer of the atmos-pheric signal on particles to the seabed of the fjord. WithinNansen Fjord, the peak is too shallow and the activity islow, suggesting that the signal is from mixed sources andincorporates a significant lag time between the 1963 at-mospheric peak input and deposition on the seafloor in thefjord. The intricacies of 137Cs exchange from glacier ice tothe seafloor fjord are not well known, but it can be con-cluded that riverine or lacustrine input of 137Cs to themarine environment is much more direct than input froma glacier source.
Use of 210Pb Accumulation Rates for the Holocene
Because of the short half-life of 210Pb, this dating tech-nique is applicable to only the last 150 years of sediment
accumulation. For longer time scales, radiocarbon datingis reliable back to approximately 40 000 years. Manystudies have used both radiocarbon and 210Pb dating as away to validate the estimated accumulation rates (Hardenet al., 1992; Elverhøi et al., 1995). In some environments,there is a lack of sufficient material for radiocarbon dating,and researchers must use 210Pb dating to estimate accu-mulation rates over a longer time scale. But, unlike radio-carbon ages, which can be calibrated to calendar years,210Pb profiles provide data on accumulation rates. Hardenet al. (1992) found that 210Pb dating of high-latitudesediments in Antarctica is insufficient, and relied insteadupon radiocarbon chronologies. In other high-latitude en-vironments, such as SE Alaska, accumulation rates in thefjords are too high for either radiocarbon dating or 210Pbdating, and thorium dating must be used (Jaeger andNittrouer, 1999).
There is an obvious discrepancy between the differentaccumulation estimates for the East Greenland fjords andcontinental shelves (Table 2, Fig. 7). In KangerlussuaqFjord, the modern accumulation rate is highest, with radio-carbon data yielding intermediate rates, and the 210Pb rateestimating the lowest accumulation. In Miki and NansenFjords and the two continental shelf sites, the radiocarbondata rate is lower and the 210Pb data rate is higher. Figure 7shows the accumulation up to 2000 years, as estimatedfrom 210Pb data, compared to radiocarbon data estimatesfor the East Greenland fjords. This discrepancy in accumu-lation rate estimates has been described by Sadler(1981:572) as “a consistent trend of falling mean sedimentaccumulation rates with increasing time span.” Accumula-tion rates determined on shorter time scales are not goodindicators of accumulation rates on longer time scalesbecause sedimentary sections tend to incorporate moreand longer hiatuses or erosional events with the longertime scale (Sadler, 1981). However, Sadler (1981) consid-ers time scales that are over 106 yrs, whereas we areinterested in time scales of 10 – 103 yrs.
We find that accumulation rates can easily be calculatedusing different geochronological methods, but the choiceof an accumulation rate is dependent upon the interval inwhich the investigator is most interested, as the two accu-mulation estimates do not overlap well. Hence, althoughwe were able to determine accumulation rates in carbon-ate-poor environments using 210Pb geochronology, wewould be hesitant to extrapolate the 210Pb accumulationrate back in time throughout the Holocene to determinechronologies on millennial time scales.
CONCLUSION
We used 210Pb dating to estimate sediment and massaccumulation rates in the fjords and continental shelf ofthe Kangerlussuaq region, East Greenland. We also meas-ured 210Pb on the SW Iceland continental shelf, in order tocompare mass accumulation rates in contrasting marine

120 • L.M. SMITH et al.
environments across the Denmark Strait. The 210Pb dataallowed us to establish modern mass accumulation ratesfor high-latitude marine and glacial marine environments,as well as to discern sedimentological processes occurringover the last century and to evaluate the use of extrapolat-ing 210Pb accumulation rates to the Holocene. Sedimentaccumulation rates are similar on the continental shelvesacross the Denmark Strait, although the mass accumula-tion rates differ because the different biogenic composi-tion of the sediments influences the bulk density.
Hemipelagic marine sedimentation has been the domi-nant depositional process on the continental shelves overthe last 200 years, and both shelves experienced an in-crease in total organic carbon. On SW Iceland, the carbonincrease is attributed to increased erosion from terrestrialcarbon, whereas no direct anthropogenic forcing is knownon the East Greenland margin.
Mass accumulation rates are higher in the fjords than onthe continental shelves. The fjords have been acting assediment traps over the last 200 years, and probablythrough much of the Holocene. Iceberg sediment rainoutand sediment gravity flows have been the dominantdepositional processes in the East Greenland fjords overthe last 200 years. Within the three East Greenland fjords,the differences in mass accumulation rates is attributed todifferences in sediment source, fluvial versus glacial ma-rine (dominated by iceberg rafting). The differences be-tween the Kangerlussuaq and Nansen Fjords are attributedto the amount of supplied sediment in calved icebergs andphysiological differences in basin size.
ACKNOWLEDGEMENTS
We wish to thank the scientists and crew of the CSS Hudson andthe RV Jan Mayen for core collection. Ship time on the CSS Hudsonwas supported by the Geological Survey of Canada and the BedfordInstitute of Oceanography as part of the CANAM-PONAM project,and time on the RV Jan Mayen was provided by Dr. M. Hald,University of Tromsø. Thanks to R. Kihl and N. Weiner forpreparation of radiocarbon samples; to W. Freeman forsedimentological analyses of the JM96 samples; to W. Cunninghamfor TOC measurements on the HU93 cores; to J. Hardardóttir andM. Berlin for help with the preparation of 210Pb samples; and to A.Simoneau, T. Elfers, and D. DeMaster for assistance with 210Pbanalyses. Many thanks to the reviewers for their helpful andinformative comments. This research was supported by grants fromthe National Science Foundation, Office of Polar Programs (OPP-9615935, OPP-9707161 and OPP-9224254) and by a NOAAConsortium grant (NA47GP0188).
REFERENCES
ALEXANDER, C.R., DeMASTER, D.J., and NITTROUER, C.A.1991. Sediment accumulation in a modern epicontinental-shelfsetting: The Yellow Sea. Marine Geology 98:51 –72.
ANDERSEN, C. 1998. Studier av klimavariabilitet i De NordiskeHav og Danmarkstredet med hovedvekt pa de siste 2000 ar,basert pa diatomesammensetninger i marine kjerner. Cand.scient. oppgave i geologi, studieretning marin geologi,Universitetet i Bergen. 92 p.
ANDREWS, J.T., and SYVITSKI, J.P.M. 1994. Sediment fluxesalong high latitude continental margins (NE Canada and EGreenland). In: Hay, W. Material fluxes on the surface of theEarth. Washington, D.C.: National Academy Press. 99 –115.
ANDREWS, J.T., MILLIMAN, J.D., JENNINGS, A.E., RYNES,N., and DWYER, J. 1994. Sediment thicknesses and Holoceneglacial marine sedimentation rates in three East Greenlandfjords (ca. 68˚N). Journal of Geology 102:669 –683.
ANDREWS, J.T., JENNINGS, A.E., COOPER, T., WILLIAMS,K.M., and MIENERT, J. 1996. Late Quaternary sedimentationalong a fjord to shelf (trough) transect, East Greenland (c. 68˚N).In: Andrews, J.T., Austin, W.E.N., Bergsten, H., and Jennings,A.E., eds. Late Quaternary paleoceanography of the NorthAtlantic margins. London: Geological Society, SpecialPublication 111. 153 –166.
ANDREWS, J.T., SMITH, L.M., PRESTON, R., COOPER, T., andJENNINGS, A.E. 1997. Holocene patterns of ice-rafted detritus(IRD) in cores from the East Greenland shelf. Journal ofQuaternary Science 12:1 – 13.
APPLEBY, P.G. 1993. Foreword to the 210Pb dating anniversaryseries. Journal of Paleolimnology 9:155 – 160.
APPLEBY, P.G., and OLDFIELD, F. 1992. Application of Lead-210 to sedimentation studies. In: Ivanovich, M., and Harmon,R.S., eds. U-series disequilibrium; applications to Earth, marine,and environmental studies. Oxford: Clarendon Press. 731 –778.
CLAPSADDLE, K. 1994. Silica extraction from the East Greenlandshelf as a measure of productivity. 24th International ArcticWorkshop, Arctic and Alpine Environments, Past and Present,Program with Abstracts, 1994. Boulder: Institute of Arctic andAlpine Research, University of Colorado at Boulder. 169 p.
COWAN, E.A., SERAMUR, K.C., CAI, J., and POWELL, R.D.1999. Cyclic sedimentation produced by fluctuations in meltwaterdischarge, tides, and marine productivity in an Alaskan fjord.Sedimentology 46:1109 – 1126.
CRUSIUS, J., and ANDERSON, R.F. 1992. Inconsistencies inaccumulation rates of Black Sea sediments inferred from recordsof laminae and 210Pb. Paleoceanography 7(2):215 –227.
CUTSHALL, N.H., LARSON, I.L., and OLSEN, C.R. 1983. Directanalysis of 210Pb in sediment samples: Self-absorption corrections.Nuclear Instruments and Methods 206:309 –312.
DICKSON, R.R., MEINCKE, J., MALMBERG, S., and LEE, A.1988. The “Great Salinity Anomaly” in the northern NorthAtlantic 1968 –1982. Progress in Oceanography 20:103 –151.
DOWDESWELL, J.A., UENZELMANN-NEBEN, G.,WHITTINGTON, R.J., and MARIENFELD, P. 1994. The LateQuaternary sedimentary record in Scoresby Sund, EastGreenland. Boreas 23:294 –310.
DWYER, J.L. 1995. Mapping tide-water glacier dynamics in EastGreenland using Landsat data. Journal of Glaciology41(139):584 –595.
ELVERHØI, A., SVENDSEN, J.I., SOLHEIM, A., ANDERSEN,E.S., MILLIMAN, J., MANGERUD, J., and HOOKE, R.LeB.
210PB RATES OF SEDIMENT ACCUMULATION • 121
1995. Late Quaternary sediment yield from the High ArcticSvalbard Area. The Journal of Geology 103:1 –17.
GEIRSDÓTTIR, A., HARDARDÓTTIR, J., and ANDREWS, J.T.2000. Late Quaternary terrestrial geology of Miki Fjord andnearby areas, East Greenland. Holocene 10(1):123 – 134.
GOLDBERG, E.D. 1963. Geochronology with Lead-210. In:Radioactive dating: Proceedings of the symposium on radioactivedating, International Atomic Energy Agency, Vienna. 121 –131.
HAGEN, S. 1995. Watermass characteristics and climate in theNordic Seas during the last 10,200 years. Tromsø: University ofTromsø. 114 p.
HALLET, B., HUNTER, L., and BOGEN, J. 1996. Rates of erosionand sediment evacuation by glaciers: A review of field data andtheir implications. Global and Planetary Change 12:213 –235.
HARDEN, S.L., DeMASTER, D.J., and NITTROUER, C.A. 1992.Developing sediment geochronologies for high-latitudecontinental shelf deposits: A radiochemical approach. MarineGeology 103:69 –97.
HASHOLT, B., and WALLING, D.E. 1992. Use of caesium-137 toinvestigate sediment sources and sediment delivery in a smallglacierized mountain drainage basin in East Greenland. Erosion,debris flows, and environments in mountain regions (Proceedingsof the Chengda Symposium). IAHS publication 209:87 –100.
JAEGER, J.M., and NITTROUER, C.A. 1999. Sediment depositionin an Alaskan fjord: Controls on the formation and preservationof sedimentary structures in Icy Bay. Journal of SedimentaryResearch 69(5):1011 – 1026.
JENNINGS, A.E., and WEINER, N.J. 1996. Environmental changesin eastern Greenland during the last 1300 years: Evidence fromforaminifera and lithofacies changes in Nansen Fjord, 68˚N. TheHolocene 6(2):179 –191.
JENNINGS, A.E., SYVITSKI, J.P.M., GRÖNVOLD, K., GERSON,L., GEIRSDÓTTIR, A., HARDARDÓTTIR, J., and ANDREWS,J.T. 2000. Chronology and paleoenvironments during the lateWeichselian deglaciation of SW Iceland Shelf. Boreas 29(3):167 –183.
JENNINGS, A.E., HAGEN, S., HARDARDÓTTIR, J., STEIN, R.,OGILVIE, A.E.J., and JÓNSDÓTTIR, I. 2001. Oceanographicchange and terrestrial human impact in a post AD 1400 sedimentrecord from the southwest Iceland shelf. Climatic Change48(1):83 –100.
KUEHL, S.A., NITTROUER, C.A., and DeMASTER, D.J. 1986.Nature of sediment accumulation on the Amazon continentalshelf. Continental Shelf Research 6:209 –225.
MANLEY, W.F., and JENNINGS, A.E. 1996. Radiocarbon DateList VIII: Eastern Canadian Arctic, Labrador, Northern Quebec,East Greenland Shelf, Iceland Shelf, and Antarctica. Boulder:Institute of Arctic and Alpine Research, University of Colorado.Occasional Paper 50.
MILLIMAN, J.D., and SYVITSKI, J.P.M. 1992. Geomorphic/tectonic control of sediment discharge to the ocean: Theimportance of small mountainous rivers. Journal of Geology100:525 – 544.
NITTROUER, C.A. 1978. The process of detrital sedimentaccumulation in a continental shelf environment: An examinationof the Washington Shelf. PhD thesis, University of Washington,243 p.
OLDFIELD, F. 1983. Lead-210 and other isotopes. In: Creek, K.M.,Tucholke, P., and Barton, C.E., eds. Geomagnetism of bakedclays and recent sediments. Amsterdam: Elsevier. 57 –62.
OLDFIELD, F., and APPLEBY, P.G. 1984. Empirical testing of210Pb dating in models. In: Haworth, E.Y., and Lund, J.W.G.,eds. Lake sediments and environmental history. Minneapolis:University of Minnesota Press. 93 –124.
OLSEN, C.R., LARSEN, I.L., LOWRY, P.D., McLEAN, R.I., andDOMOTER, S. 1989. Radionuclide distributions and sorptionbehavior in the Susquehanna-Chesapeake Bay system. MarylandPower Plant and Environmental Review Division Report PPER-R-12. Annapolis, Maryland: Department of Natural Resources.106 p.
OVERPECK, J., HUGHEN, K., HARDY, D., BRADLEY, R.,CASE, R., DOUGLAS, M., FINNEY, B., GAJEWSKI, K.,JACOBY, G., JENNINGS, A., LAMOUREUX, S., LASCA, A.,MACDONALD, G., MOORE, J., RETELLE, M., SMITH, S.,WOLFE, A., and ZIELINSKI, G. 1997. Arctic environmentalchange of the last four centuries. Science 278:1251 –1256.
REEH, N. 1985. Greenland ice-sheet mass balance and sea-levelchange. Glaciers, ice sheets, and sea level: Effect of a CO2induced climatic change. Seattle: United States Department ofEnergy.
ROBERTS, K.A., COCHRAN, J.K., and BARNES, C. 1997. 210Pband 239,240Pu in the Northeast Water Polynya, Greenland: Particledynamics and sediment mixing rates. Journal of Marine Systems10:401 – 413.
SADLER, P.M. 1981. Sediment accumulation rates and thecompletion of the stratigraphic sections. Journal of Geology89:569 –584.
SMITH, J.N., and ELLIS, K.M. 1982. Transport mechanism for Pb-210, Cs-137, and Pu fallout radionuclides through fluvial-marine systems. Geochimica et Cosmochimica Acta 46:941–954.
SMITH, L.M. 1997. Late Quaternary glacial marine sedimentationin the Kangerlussuaq region, East Greenland, 68˚N. M.Sc.Thesis, Department of Geological Sciences, University ofColorado, Boulder. 190 p.
SMITH, L.M., and ANDREWS, J.T. 2000. Sediment characteristicsin iceberg dominated fjords, Kangerlussuaq region, EastGreenland. Sedimentary Geology 130:11–25.
SMITH, L.M., and LICHT, K.J. 2000. Radiocarbon DateList IX:Antarctica, Arctic Ocean, and the northern North Atlantic.INSTAAR Occasional Paper 54. 138 p.
SOMMERFIELD, C.K., and NITTROUER, C.A. 1999. Modernaccumulation rates and a sediment budget for the Eel shelf: Aflood-dominated depositional environment. Marine Geology154(1-4):227 –241.
STUIVER, M. 1993. A note on single yr calibration of theradiocarbon timescale, A.D. 1510-1954. Radiocarbon 35(1):67 –72.
STUIVER, M., and PEARSON, G.W. 1993. High-precisionbidecadal calibration of the 14C timescale, A.D. 1950-500 B.C.and 2500-6000 B.C. Radiocarbon 35(1):1 –23.
SYVITSKI, J.P.M. 1993. Glaciomarine environments in Canada:An overview. Canadian Journal of Earth Sciences 30(2):354 –371.

122 • L.M. SMITH et al.
SYVITSKI, J.P.M., BURRELL, D.C., and SKEI, J.M. 1987. Fjords:processes and products. New York: Springer Verlag. 379 p.
SYVITSKI, J.P.M., ANDREWS, J.T., and DOWDESWELL, J.A.1996. Sediment deposition in an iceberg-dominated glaciomarineenvironment, East Greenland: Basin fill implications. Globaland Planetary Change 12(1-4):251 –270.
WILLIAMS, K.M., ANDREWS, J.T., WEINER, N.J., and MUDIE,P.J. 1995. Late Quaternary paleoceanography of the mid- toouter continental shelf, East Greenland. Arctic and AlpineResearch 27(4):352 – 363.
ZUCKER, C.L., OLSEN, C.R., LARSEN, L.L., and CUTSHALL,N.H. 1984. Inventories and sorption-desorption trends inradiocesium and radiocobalt in James River Estuary sediments.Environmental Geology 6:171 –182.