Embed Size (px)
Citation preview
Eur Respir J 1991, 4, 115-119
TECHNICAL NOTE
Accuracy and precision of fourteen pulse oximeters
B. Hannhart*, J-P. Haberer**, C. Saunier*, M-C. Laxenaire**
Accuracy and precision of fourteen pulse oxi~ters. B. Hannhart, 1-P. Haberer, C. Saunier, M-C. Laxenaire.
• INSERM Unit~ 14, CO 10, Vandoeuvre-les-Nancy, France.
ABSTRACT: Two sets or seven pulse oxlmeters (Crltlcare CSI-502; Nellcor-NZOO; Datex-Satllte; Pbyslo-Controi-L lfestat 1600; Crltlkon-Oxyshuttle; Ohmeda-Biox 3700; Ohmeda-Dlox 3740; Radiometer-Ox!; Spectramed-Pulsat; Kontron-7840; Blochem-Ox2000; Invlvo-4500; Engstrom-EOS; Novametrlx-505) were studied In two groups of elgbt healthy subjects, aged 26-50 yrs. The transcutaneous oxygen saturation (Spo,) was compared wUb arterial oxygen saturation (Sao,) measured In simultaneously with drawn blood samples (OSM2 Radlom· eter) at four 20 mln steady-state levels or Inspired oxygen fraction (Fio,) (0.21, 0.10, 0.08 and 0.07; Sao, 99-55%) In a conditioned chamber. Both the error In accuracy (mean Spo,-Sao, difference), and the error In precision (so of tbe differences) remained <3% for the two highest Fto, levels (Sao2 >83%) but, during deeper hypoxia, they were Increased to 8% and 5%, respectively. An Instrumental systematic bias affected accuracy In particular. We concluded that a good agreement between Spo, and Sao,, as refiected by the Bartko's lntraclass coerrlclent, was observed In nine Instruments.
•• D6partement d'AnestMsiologie, CHRU Nancy, France.
Correspondence: B. Hannhart, INSERM U-14, CO 10, 54511 Vandoeuvre-les-Nancy CMex, France.
Keywords: Arterial oxygen sablration; equipment; hypoxia; pulse oximetry.
Received: December 1989; accepted after revision June 20, 1990.
Eur Respir J., 1991, 4, 115-119.
Since their clinical introduction in the early 1980s, pulse oximeters have rapidly established themselves as an essential device for monitoring arterial oxygen saturation (Sao
2) in anaesthesia and resuscitation, and
in pneumology for monitoring chronic respiratory diseases or sleep studies [1, 2]. Many experimental and clinical studies have proved the reliability of new pulse oximeters, usually in a range of 80-100% Sao2 [3, 4]. However, few studies [5, 6] have been devoted to more severe hypoxaemia Sao
2, <70% levels which can be
observed in clinical practice, during intensive care, sleep studies or hypoxic response tests. These studies have often shown a gradual decrease in the accuracy of pulse oximeters during short-term deep hypoxia [7, 8]. However, the observations have been conflicting, probably as a result of the different oximeters tested and the various study designs used.
The present study was designed to assess and directly compare accuracy and precision, in estimating Sao
2 with
two series of seven pulse oximeters, using the same protocol, in two groups of eight healthy volunteers, in a large range of steady-state Sao
2•
Methods
Sixteen healthy adult volunteers, aged 25-50 yrs, gave informed consent, as approved by the local Ethical Committee, to participate in the study. Amongst them,
13 were nonsmokers and three light smokers who had refrained from smoking for one day before the experiments. The clinical examination was nonnal and they were free of any cardiopulmonary symptoms. Fourteen pulse oximeters, commercially available from 13 manufacturers, were tested in two series. The first series was composed of the following instruments: Criticare CSI-502; Nellcor-N200; Datex-Satlite; Physio-Control-Lifestat 1600; Critikon-Oxyshuttle; Ohmeda-Biox 3700 and Ohmeda-Biox 3740. The second series was compos of the following: Radiometer-Oxi; Spectramed-Pulsat; Kontron-7840; Biochem-Ox2000; Invivo-4500; Engstrom-EOS and Novametrix-505. One instrument of each type was tested. They were all equipped with reusable finger probes. They were operated in the "normal" response mode. A 20 gauge radial catheter was inserted under local anaesthesia to allow arterial blood samples to be withdrawn.
The study was carried out in a 45 m3 conditioned chamber at barometric pressure and with 0 1 and CO levels strictly controlled. Temperature was kept to 2o·c and humidity at 50%. The seven instruments of each series were consecutively tested during the same session, at four different levels of inspired oxygen fraction (FioJ (0.21, 0.07, 0.08 and 0.10). The order of testing each instrument was chosen at random. The finger probe was placed by one operator on the third finger of the opposite hand to that of the radial catheter. The repeated application of the probe did not change local
116 B. HANNHART ET AL.
conditions. Each series was evaluated in eight subjects at rest in semi-recumbent position. During hypoxia, the insp ired carbon dioxide fraction (Frco2) was maintained at 0.035 to avoid hypocapnia due to hyperventilation. After each 20 min steady-state level of FIO.z, a blood sample was taken before and immediately after readings of the seven oximeters in order to check the stability of the arterial hypoxia in the subjects. Only the mean of the two Sao
2 measurements
was considered. The display of the oximeter was read only when the pulse signal was appropriate and stable. All arterial blood samples were immediately analysed, always by the same operator. Arterial oxygen tension (Pao
2), arterial carbon dioxide tension (Paco
2) and pH
were determined in a Radiometer ABL-30 (Copenhagen) and Sao
2 was measured in a Radiometer OSM-2
haemoximeter (Copenhagen). The haemoximeter was calibrated according to the manufacturer's recommendations: complete blood calibration every three months and daily zero-point adjusunent.
Data analysis
The error in accuracy of the transcutaneous oxygen saturation (Spo2) measured with each oximeter was defined as the mean of the Spo
2-Sao
2 differences
observed in the eight subjects of each series at different levels of hypoxia.
The error in precision was defined as the standard deviation (so) of the distribution of the Spo
2-Sao
2 differences [4, 9].
The uncertainty of the oximeters' readings depends on the range of Sao2 studied. We analysed, separately, measurements made at the two highest levels of FI0
2 (Sao2 between 99-83%) and those made at the two lowest levels (Sao2 between 78.3-55.2%). These two ranges were statistically compared using Student's paired Hest.
It is usual to present on a graph the readings of Spo2
from an oximeter versus the blood reference Sao2
•
However, since several measurements were performed in each subject, the coefficient of correlation could not strictly be calculated from all the data. This is particularly true when the number of measurements is not the same in all subjects. The coefficient of correlation depends on the range of Sao
2 studied and,
moreover, it does not take into account an obvious systematic bias. This is, therefore, a poor index of concordance between Spo
2 and Sao
2 [9]. A better
approach consists in the calculation of a single index derived from a repeated measures analysis of variance: the intraclass correlation coefficient of Bartko [10]. It combines an estimation of the difference of slope and the difference of intercept of the correlations. It is an index of agreement between two measurements. A value of 0.75 or more reflects good agreement.
Since measurements at four levels of F102
were obtained in each subject, the individual linear relationships between the Spo2-Sao2 differences and the corresponding Sao2 could be calculated. The linearity
of these relationships was evaluated with the test for trend. The parallelism between the individual lines (homogeneity of within-subject regression) and the between-subject variations were tested using covariance analysis [11].
A probability of 0.05 was accepted as the minimum level of statistical significance. All values are reported as means±so.
Results
The Sao2 and Spo2 varied from 55.2-99% and 44-100%, respectively. In all subjects, Paco2 and pH were maintained within the normal range in the course of the experiments (38.6±3.0 and 7 .42±0.02 mmHg, respectively).
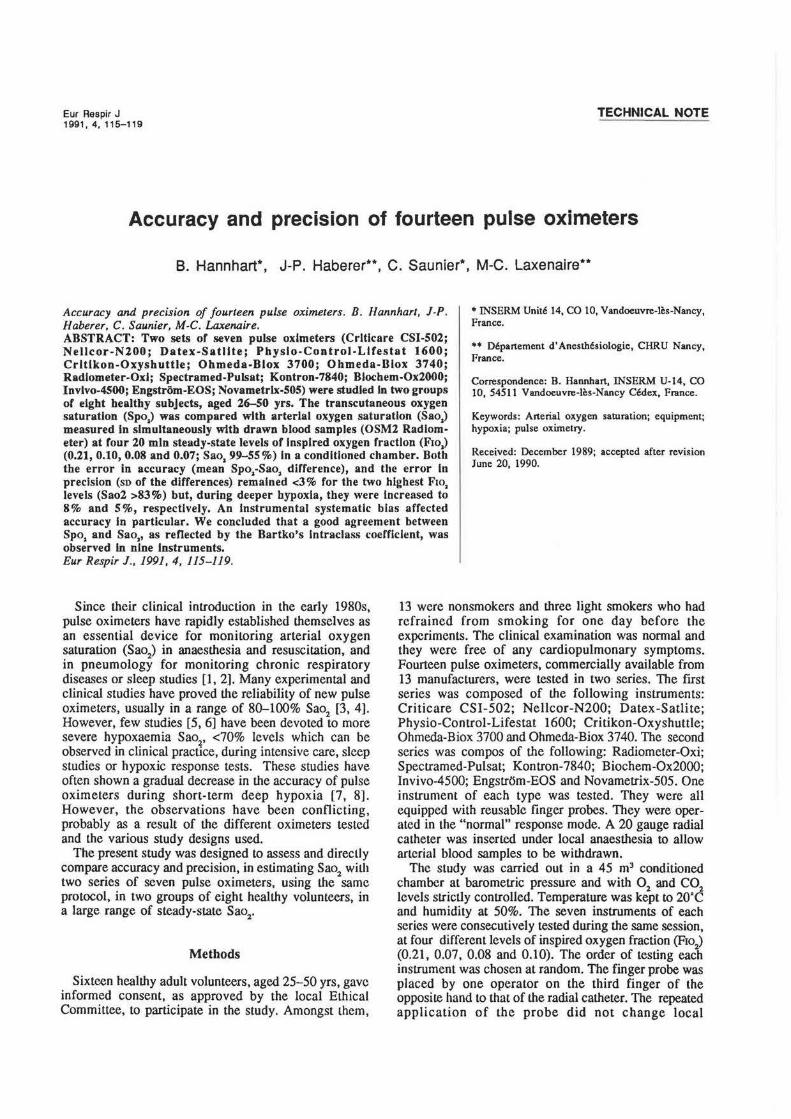
In most instruments, the error in accuracy increased as the Sao
2 levels fell. Table 1 illustrates that on
average, for the highest range of Sao2 (left-hand column), this error remained below 3% although it increased significantly with nine instruments during deeper hypoxia (right-hand column).
Table 1.- Ranking of tested oximeters according to the error in accuracy
High Sao1
Low Sao1 Difference
(99-83% range) (78.3-55.2% range) p
Engstrom 0.1 Engstrom -0.4 NS Novametrix -0.2 Spectramed 0.5 NS Spectramed 0.4 Invivo 1.2 NS Ohmeda 3740 0.7 Nellcor 1.4 NS Biochem 0.8 CSI-502 2.0 NS Nellcor 0.9 Ohmeda 3740 -2.1 <0.05 Ohmcda 3700 0.9 Novametrix 2.2 <0.01 lnvivo 0.9 Biochem -3.2 <0.01 CSI-502 1.2 Ohmeda 3700 -3.2 <0.05 Radiometer -1.5 Physio-Control 5.4 <0.01 Datex 1.6 Radiometer -5.4 <0.05 Physio-Control 1.7 Kontron 6.4 <0.001 Kontron 2.3 Datex 6.4 <0.001 Critikon 3.1 Critikon 8.0 <0.001
The error in accuracy is defined as the mean Spo2-Sao
1 difference. p: probability that the error at the two lowest levels of Fto2 (Sao
1 between 78.3-55.2%) is significantly
different from the error at tJ1e two highest levels of F1o2
(Sao2
between 99-83%). NS: not significant; Sao1: arterial oxygen saturation; Spo
2: transcutaneous oxygen saturation; Fm
2:
fraction of inspired oxygen.
In table 2, the 14 pulse oximeters are ranked according to the error in precision. In all instruments, except Kontron-7840 and Datex-Satlite, for low Sao
2 levels
(right-hand column), the precision had clearly deteriorated compared to high Sao2 levels (left-hand column).
In table 3, the tested oximeters are ranked according to the Bartko's intraclass coefficient. A good agreement between Spo2 and Sao2 was observed with nine instruments.
15
.,. 10
!! 5
• 0 0
~ ·5 c. 0
· 10 ·15
15
~ 10
f.: ·10
·15
EVALUATION OF FOURTEEN PULSE OXIMETERS 117
CSI-502 15 Nelleor 15 Datex 15 Physio-eontrol
...... ~ .. ·: ····~ ·: ...... ~ ·: ... 2~ .. ·5 ·5 ·5
·10 ·15
50 60 70 80 90 100
15
.,. 10
~ 5 • 0 0 c ·5 tl;
·10 ·15
50 60 70 80
Radiometer 15
10
5 0
·5
·10
·15
·10 ·10
·15 ·15 50 60 70 80 90 100 50 60 70 80 90 100 50 60 70 80 90 100
Sao2%
15 Ohmeda3700 15 Ohmeda3740
10 10
5 5
0 0 ..... ~ ·5 ·5
·10 p<0.05 ·15
90 100 50 60 70 80 90 50 60 70 80 90 100
Sao2 %
Speetramed 15 Kontron 15 Bloehem
10
--~-10
--~ 5 5 0 0
·5 ·5
·10 ·10
·15 ·15 50 60 70 80 90 100 50 60 70 80 90 100 50 60 70 80 90 100 50 60 70 80 90 100
Sao2 %
15 lnvlvo 15 Engstrom 15 Novametrlx
~ 10 10 10 ~ s 5 5
··~ i 0 0 0
0 ·5 ·5 ·5 ·10 ·10 ·10 ·15 ·15 ·15
50 60 70 80 90 100 50 60 70 80 90 100 50 60 70 80 90 100
Sao2 %
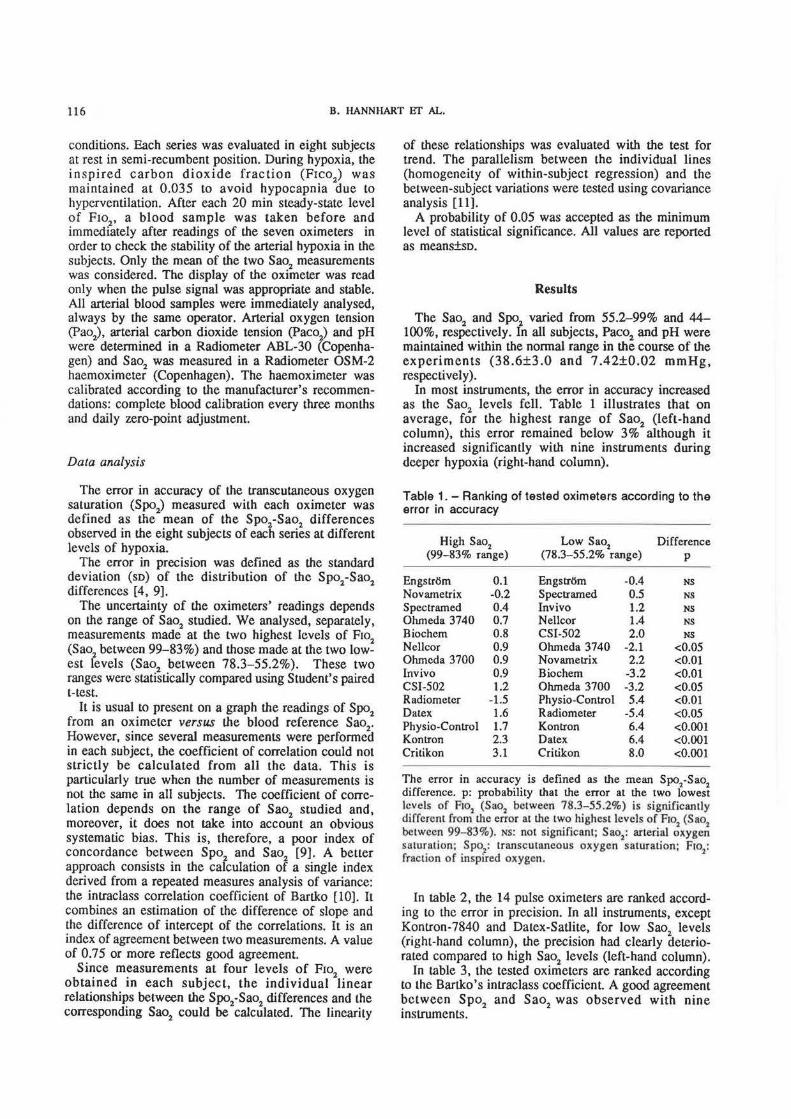
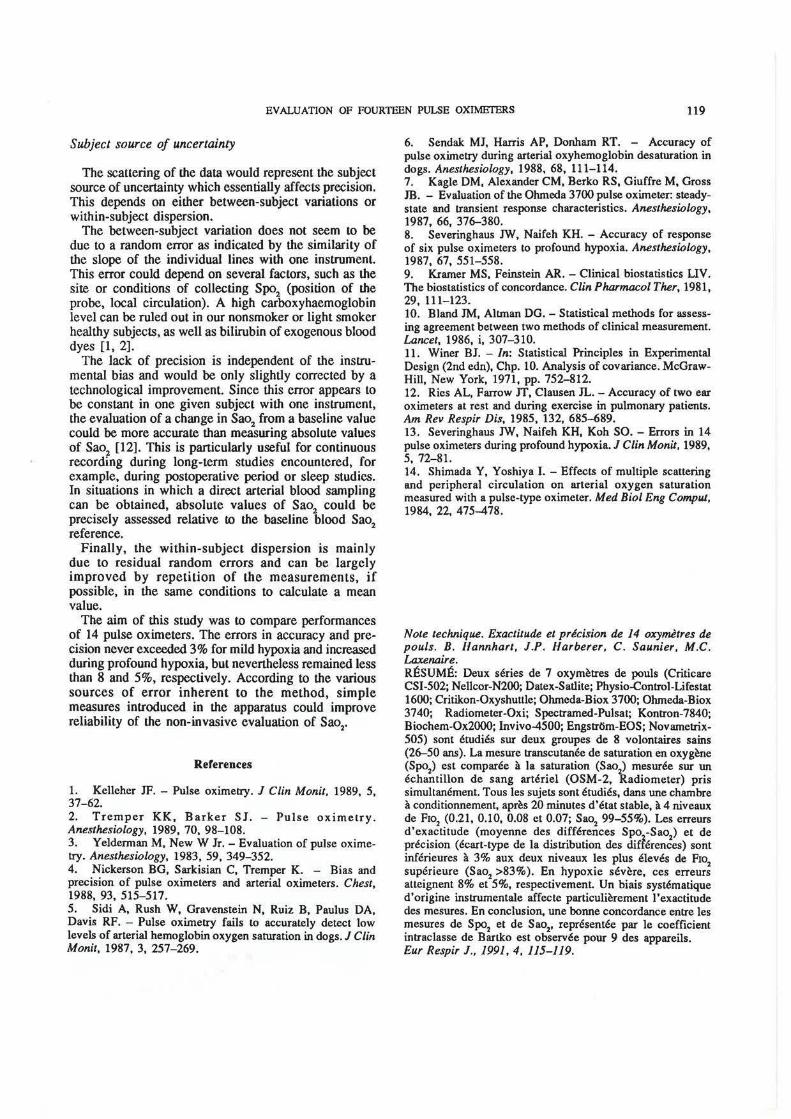
Fig. 1. - Individual Spo2-Sao1 differences obtained wilh the two seriCls of seven pulse oximeters are plotted against simultaneously measured Sao1• The four points representing data from each of the eight subjects are connected. The dashed line is lhe zero difference Line. For each instrument, the mean (S) of lhe individual slopes and the statistical probability (p) that the slopes are different from zero (non-null bias) are presented. Spo1: transcutaneous oxygen saturation; Sao
1: arterial oxygen saturation.
118 B. HANNHART liT AL.
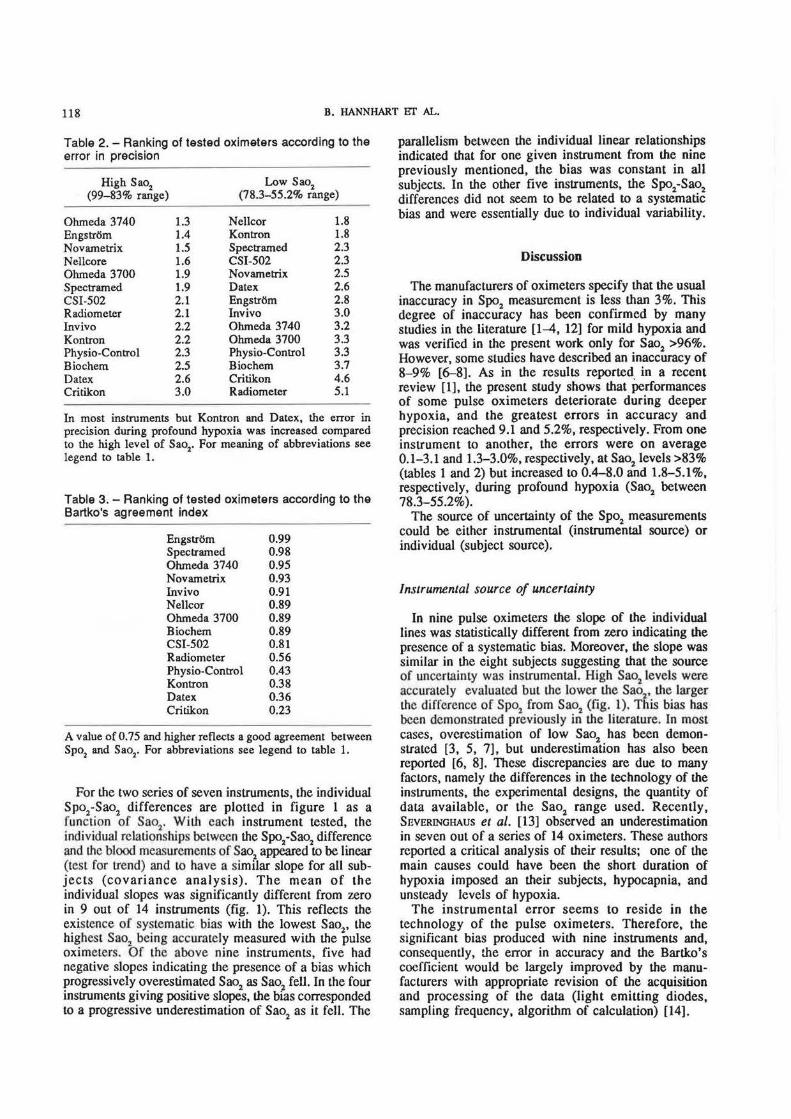
Table 2. - Ranking of tested oximeters according to the error in precision
High Sao2
(99-83% range) Low Sao1
(78.3-55.2% range)
Ohmeda 3740 Engstrom Novametrix Nellcore Ohmeda 3700 Spectramed CSI-502 Radiometer Invivo Kontron Physio-Control Biochem Datex Critikon
1.3 1.4 1.5 1.6 1.9 1.9 2.1 2.1 2.2 2.2 2.3 2.5 2.6 3.0
Nellcor Kontron Spectramed CSI-502 Novametrix Datex Engstrom lnvivo Ohmeda 3740 Ohmeda 3700 Physio-Control Biochem Critikon Radiometer
1.8 1.8 2.3 2.3 2.5 2.6 2.8 3.0 3.2 3.3 3.3 3.7 4.6 5.1
In most instruments but Kontron and Datex, the error in precision during profound hypoxia was increased compared to the high level of Sao
2• For meaning of abbreviations see
legend to table 1.
Table 3. -Ranking of tested oximeters according to the Bartko's agreement index
Engstrom 0.99 Spectramed 0.98 Ohmeda 3740 0.95 Novametrix 0.93 Invivo 0.91 Nellcor 0.89 Ohmeda 3700 0.89 Biochem 0.89 CSI-502 0.81 Radiometer 0.56 Physio-Control 0.43 Kontron 0.38 Datex 0.36 Critikon 0.23
A value of 0. 75 and higher reflects a good agreement between Spo
1 and Sao2• For abbreviations see legend to table 1.
For the two series of seven instruments, the individual Spo1-Sao2 differences are plotted in figure 1 as a function of Sao1 . With each instrument tested, the individual re la tionships between the Spo
2-Sao
1 difference
and the blood measurements of Sao1
appeared to be linear (test for trend) and to have a similar slope for all subjects (covariance analysis). The mean of the individual slopes was significantly different from zero in 9 out of 14 instruments (fig. 1). This reflects the exis tence of systematic bias with the lowest Sao
2, the
highest Sao7
being accurately measured with the pulse oximeters. Of the above nine instruments, five had negative slopes indicating the presence of a bias which progressively overestimated Sao2 as Sao
2 fell. In the four
instruments giving positive slopes, the bias corresponded to a progressive underestimation of Sao2 as it fell. The
parallelism between the individual linear relationships indicated that for one given instrument from the nine previously mentioned, the bias was constant in all subjects. In the other five instruments, the Spo1-Sao2 differences did not seem to be related to a systematic bias and were essentially due to individual variability.
Discussion
The manufacturers of oximeters specify that the usual inaccuracy in Spo
2 measurement is less than 3%. This
degree of inaccuracy has been confirmed by many studies in the literature [1-4, 12] for mild hypoxia and was verified in the present work only for Sao1 >96%. However, some studies have described an inaccuracy of 8-9% [6-8]. As in the results reported in a recent review (1], the present study shows that Performances of some pulse oximeters deteriorate during deeper hypoxia, and the greatest errors in accuracy and precision reached 9.1 and 5.2%, respectively. From one instrument to another, the errors were on average 0.1-3.1 and 1.3-3.0%, respectively, at Sao2 levels >83% (tables 1 and 2) but increased to 0.4-8.0 and 1.8-5.1 %, respectively, during profound hypoxia (Sao2 between 78.3-55.2%).
The source of uncertainty of the Spo2
measurements could be either instrumental (instrumental source) or individual (subject source).
Instrumental source of uncertainty
In nine pulse oximeters the slope of the individual lines was statistically different from zero indicating the presence of a systematic bias. Moreover, the slope was similar in the eight subjects suggesting that the source of uncertainty was instrumental. High Sao2 levels were accurate ly evaluated but the lower the Sao2, the larger the difference of Spo2 from Sao2 (fig. 1). This bias has been demonstrated previously in the literature. In most cases, overes·timation of low Sao2 has been demonstrated [3, 5, 7], but underestimation has also been reported [6, 8]. These discrepancies are due to many factors, namely the differences in the technology of the instruments, the experimental designs, the quantity of data available, or the Sao2 range used. Recently, SEVERINGHAUS et al. [13) observed an underestimation in seven out of a series of 14 oximeters. These authors reported a critical analysis of their results; one of the main causes could have been the short duration of hypoxia imposed an their subjects, hypocapnia, and unsteady levels of hypoxia.
The instrumental error seems to reside in the technology of the pulse oximeters. Therefore, the significant bias produced with nine instruments and, consequently, tile error in accuracy and the Bartko's coefficient would be largely improved by the manufacturers with appropriate revision of the acquisition and processing of the data (light emitting diodes, sampling frequency, algorithm of calculation) [14].
EVALUATION OF FOURTEEN PULSE OXIMETERS 119
Subject source of uncertainty
The scattering of the data would represent the subject source of uncertainty which essentially affects precision. This depends on either between-subject variations or within-subject dispersion.
The between-subject variation does not seem to be due to a random error as indicated by the similarity of the slope of the individual lines with one instrument. This error could depend on several factors, such as the site or conditions of collecting Spo2 (position of the probe, local circulation). A high carboxyhaemoglobin level can be ruled out in our nonsmoker or light smoker healthy subjects, as well as bilirubin of exogenous blood dyes [1, 2].
The lack of precision is independent of the instrumental bias and would be only slightly corrected by a technological improvement. Since this error appears to be constant in one given subject with one instrument, the evaluation of a change in Sao2 from a baseline value could be more accurate than measuring absolute values of Sao2 [12]. This is particularly useful for continuous recording during long-term studies encountered, for example, during postoperative period or sleep studies. In situations in which a direct arterial blood sampling can be obtained, absolute values of Sao
2 could be
precisely assessed relative to the baseline blood Sao2 reference.
Finally, the within-subject dispersion is mainly due to residual random errors and can be largely improved by repetition of the measurements, if possible, in the same conditions to calculate a mean value.
The aim of this study was to compare performances of 14 pulse oximeters. The errors in accuracy and precision never exceeded 3% for mild hypoxia and increased during profound hypoxia, but nevertheless remained less than 8 and 5%, respectively. According to the various sources of error inherent to the method, simple measures introduced in the apparatus could improve reliability of the non-invasive evaluation of Sao
2•
References
1. Kelleher JP. -Pulse oximetry. J Clin Monil, 1989, 5, 37-62. 2. Tremper KK, Barker SJ. - Pulse oximetry. Anesthesiology, 1989, 70, 98- 108. 3. Yelderman M, New W Jr.- Evaluation of pulse oximetry. Anesthesiology, 1983, 59, 349-352. 4. Nickerson BG, Sarkisian C, Tremper K. - Bias and precision of pulse oximeters and arterial oximeters. Chest, 1988, 93, 515-517. 5. Sidi A, Rush W, Gravenstein N, Ruiz B, Paulus DA, Davis RF. - Pulse oximetry fails to accurately detect low levels of arterial hemoglobin oxygen saturation in dogs. J Cl in Monit, 1987, 3, 257-269.
6. Sendak MJ, Harris AP, Donham RT. - Accuracy of pulse oximetry during arterial oxyhemoglobin desaturation in dogs. Anesthesiology, 1988, 68, 111-114. 7. Kagle DM, Alexander CM, Berko RS, Giuffre M, Gross JB. - Evaluation of the Ohmeda 3700 pulse oximeter: steadystate and transient response characteristics. AMslhesiology, 1987, 66, 376-380. 8. Severinghaus JW, Naifeh KH. - Accuracy of response of six pulse oximeters to profound hypoxia. AMsthesiology, 1987, 67, 551- 558. 9. Kramer MS. Feinstein AR.- Clinical biostatistics LIV. The biostatistics of concordance. Clin Pharmacal Ther, 1981, 29, 111-123. 10. Bland JM, Altman DG.- Statistical methods for assessing agreement between two methods of clinical measurement. Lancet, 1986, i, 307-310. 11. Winer BJ. - In: Statistical Principles in Experimental Design (2nd edn), Chp. 10. Analysis of covariance. McGrawHill, New York, 1971, pp. 752-812. 12. Ries AL. Farrow IT, Clausen JL.- Accuracy of two ear oximeters at rest and during exercise in pulmonary patients. Am Rev Respir Dis, 1985, 132, 685-689. 13. Severinghaus JW, Naifeh KH, Koh SO. - Errors in 14 pulse oximeters during profound hypoxia. J Clin Monit, 1989, 5. 72-81. 14. Shimada Y, Yoshiya I. - Effects of multiple scattering and peripheral circulation on arterial oxygen saturation measured with a pulse-type oximeter. Med Biol Eng Compul, 1984, 22, 475-478.
Note technique. Exactitude et precision de 14 oxymetres de pouls. B. llannharl, J.P. Harberer, C. Saunier, M.C. LaxentJire. RESUME: Deux series de 7 oxymetres de pouls (Criticare CSI-502; Nellcor-N200; Datex-Satlite; Physio-Control-Lifestat 1600; Critikon-Oxyshuttle; Ohmeda-Biox 3700; Ohmeda-Biox 3740; Radiometer-Oxi; Spectramed-Pulsat; Kontron-7840; Biochem-Ox2000; Invivo-4500; Engstr6m-EOS; Novametrix-505) sont etudies sur deux groupes de 8 volontaires sains (26-50 ans). La mesure transcutanee de saturation en oxygene (Spo2) est comparee a la saturation (Sao
2) mesuree sur un
echantillon de sang arteriel (OSM-2, Radiometer) pris simultanement. Tous les sujets sont etudies, dans une chambre a conditionnement, apres 20 minutes d'etat stable, a 4 niveaux de Fro
2 (0.21, 0.10, 0.08 et 0.07; Sao
2 99-55%). Les erreurs
d'exactitude (moyenne des differences Spo -Sao2
) et de precision (ecart-type de la distribution des differences) sont inferieures a 3% aux deux niveaux Ies plus eleves de Fro
2 superieure (Sao
2 >83%). En hypoxie severe, ces erreurs
aueignent 8% et 5%, respectivement Un biais systematique d 'origine instrumentale affecte particulierement I' exactitude des mesures. En conclusion. une bonne concordance entre Ies mesures de Spo2 et de Sao2, representee par le coefficient intraclasse de Bartko est observee pour 9 des appareils. Eur Respir J., 1991, 4, 115-119.