Embed Size (px)
Citation preview
Accuracy of the skin model in quantifying blood and epidermalmelanin
S A Hojjatoleslami, E Claridgea and M Moncrieffb
aSchool of Computer Science, University of Birmingham, Birminghamb Addenbrooke’s Hospital, Cambridge
Abstract. Quantifying different skin parameters may help the specialists to detect skin cancers. A new methodof skin imaging developed by Cotton and Claridge [1] produces quantitative images of the main componentsof the skin. This paper evaluates the accuracy of the new skin imaging method in quantifying the levels ofepidermal melanin and blood supply in the normal skin and in thin skin lesions. Theoretical analysis showsthat the method is capable of detecting small changes in melanin level (less than5%). Changes in blood supplycan typically be assessed to within20%. Correlation with measurements Sciteusing Mexameter is excellent formelanin (r = 0:985) and moderate for blood (r = 0:621), withp < 0:001 for both.
1 Introduction
A new method of skin imaging developed by Cotton and Claridge [1, 2], uses an optical model of the skin torelate the distribution of skin colours in a 3-dimensional colour space to the skin structure and composition. Fornormal skin, colours form a 2D surface whose principal axes can be calibrated in units related to the level of twomain skin pigments, melanin and blood. Any colour deviating from this surface by a given amount represents aquantifiable change in the skin structure, such as the descent of melanin into the dermis or change in the thicknessof the papillary dermis, both diagnostically important. Using the model, skin colours can be interpreted in termsof quantitative parameters related to the skin histology.
This paper presents an analysis of the accuracy of the skin imaging method in quantifying the levels of epidermalmelanin and dermal blood, in the normal skin and in the presence of a thin layer of melanin in the dermis. Changein pigmentation associated with the appearance of a new ”mole” (a skin lesion), change in pigmentation withinan existing lesion, and increase in blood supply around a lesion, can all be indicative of an incipient malignancy.As the early detection can lead to a complete cure, the ability to detect subtle changes is important. Only if thesystem’s accuracy is well understood, its results can be reliably interpreted.
To assess the system accuracy, theoretical analysis was carried out first. Using the optical model of the skin,changes in the histological parameters were related to the changes in skin colouration. Theoretical detectabilitythreshold was then determined assuming a particular noise level for a CCD camera used to acquire images. Further,experimental validation was performed by comparing the levels of melanin and blood returned by our system withthose obtained with Mexameter, a commercial device used to assess skin colouration.
2 Sensitivity measure
The colour space of the skin model uses Red (R), Green (G) and Blue (B) primaries. Given an (r,g,b) tripletfor an unknown sample of the normal skin, its levels of blood and melanin are returned through reference to thehistologically parametrised model of the skin colouration. The accuracy of the returned parameters depends on (1)the nature of changes in each primary w.r.t. changes in a histological parameter value; and (2) the noise level inimaging system (e.g. a CCD camera), which has variance� = 0:5 for the camera used in this work.
The measure of accuracy was taken to be detectability threshold, DT, the smallest detectable increment in themagnitude of a given parameter. This can be defined as the minimum increment in the parameter value,x, whichresults in the increment in the value of a measured primary,y, by 2�. DT (x) = �x=�y = �x=2�. Value of DTis thus a measure of error and these two terms will be used as synonyms in the remainder of the paper. Sensitivityis the inverse of detectability threshold and, in the limit, is proportional to a partial derivative of the measuredprimary with respect to a parameter value. If the value of the derivative is greater than2�, each single incrementin the value of a primary is error free.
3 Analysis for normal skin and for thin lesions
Two skin models were considered, one representing the normal skin structure, the other representing an early stageof invasive melanoma where a thin layer of melanin (0:01mm thick) is present in the dermis, adjacent to thedermal-epidermal junction. In both cases the model generates colours spanning the full range of melanin (0-0.02)and blood (0-700), for the nominal level of papillary dermis thickness of (0:2mm). The increment was set equalto 1=30 of the maximum amounts of blood and melanin [3]. For reference, the Caucasian skins normally showmelanin levels below0:006.
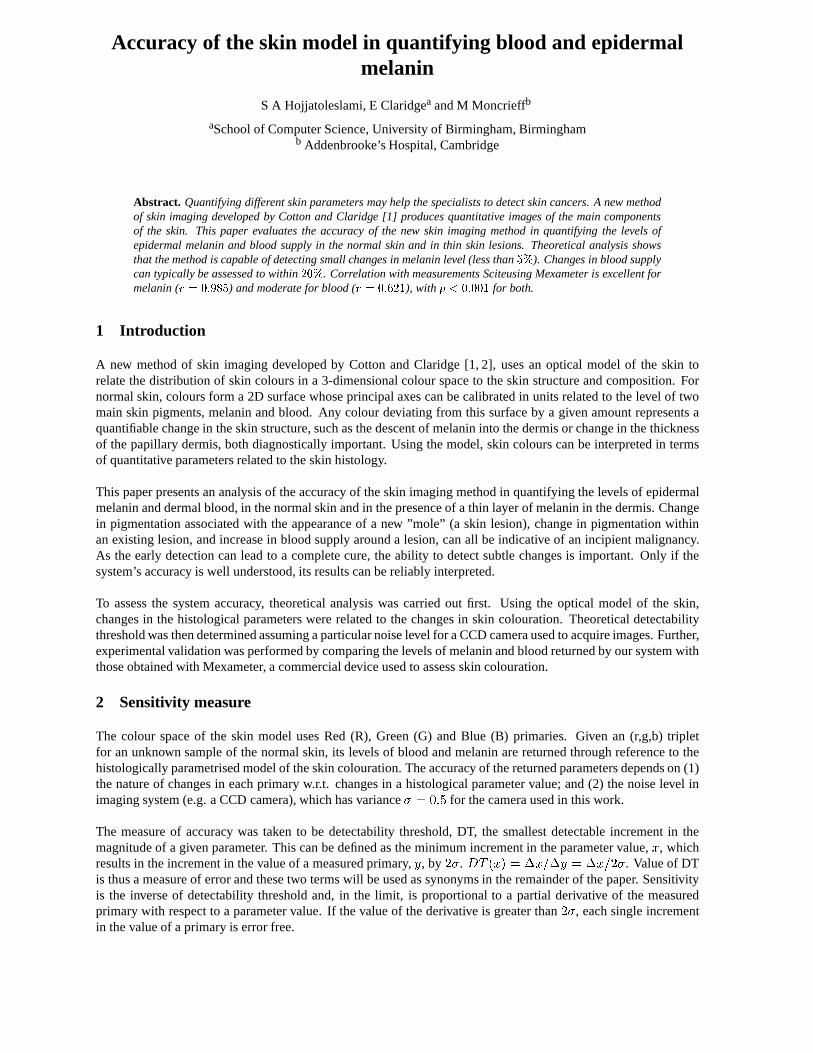
The initial analysis was carried out independently for each primary, followed by calculation of the overall de-tectability. We first consider the normal skin model. Figure 1 shows the variations in each primary (R, G and B)for a normal range of blood and melanin concentrations, as computed by the model. It can be observed that the Rprimary shows a steady decrease as the level of melanin increases and that it is effectively independent of bloodconcentration. The decrease in levels of G and B primaries is exponential for both, blood and melanin. This be-haviour can be related to their optical properties as shown by the absorption coefficients [4]. Blood has the highestabsorption level in the spectral region of Blue primary (300 � 500nm wavelength). This indicates that a smallchange in blood level affects the blue primary more than the others. From the melanin absorption spectrum it canalso be concluded that the blue primary should be most affected by change in melanin level. However, the highabsorption in blue will result in early saturation of this primary and, consequently, contribute to lower sensitivity.This behaviour is confirmed by the behaviour of the blue primary in Figure 1.
Following the discussion in Section 2, let us consider partial derivatives (the gradients) of R, G, and B primarieswith respect to the change in blood and melanin levels; the higher the level of the gradient versus the parameter,the more sensitive the system to the parameter.
Æ(Primary)
Æ(Blood)and
Æ(Primary)
Æ(Melanin)(1)
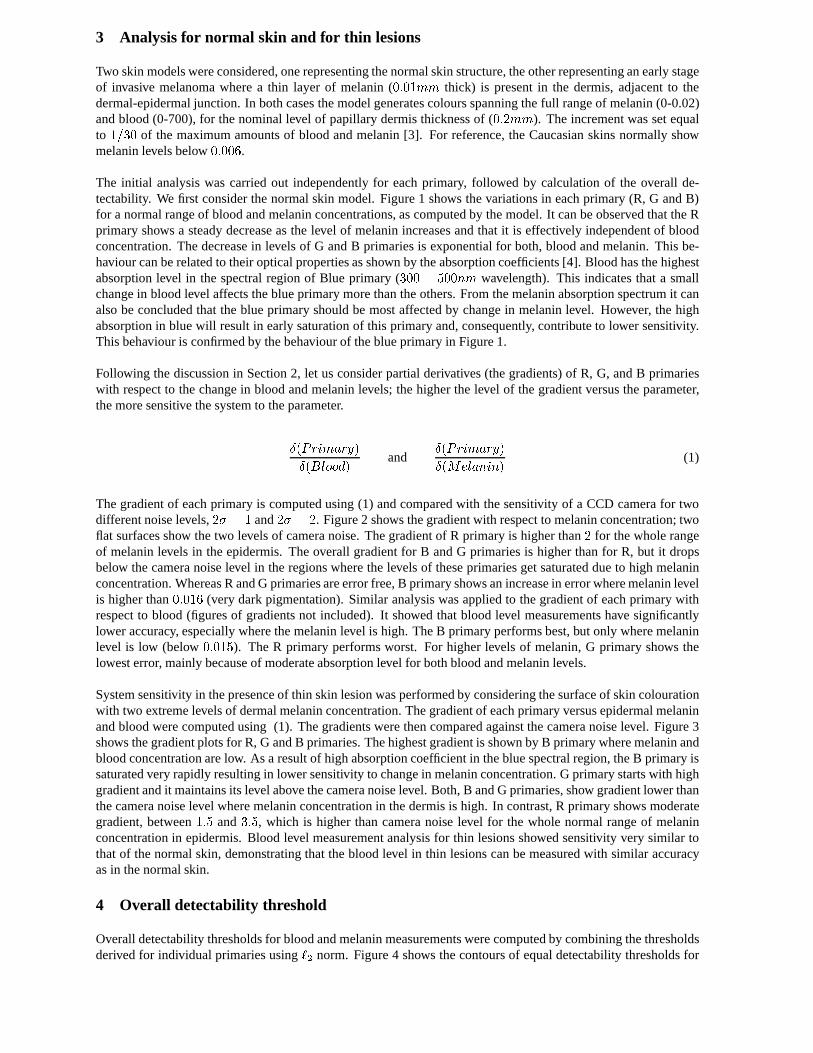
The gradient of each primary is computed using (1) and compared with the sensitivity of a CCD camera for twodifferent noise levels,2� = 1 and2� = 2. Figure 2 shows the gradient with respect to melanin concentration; twoflat surfaces show the two levels of camera noise. The gradient of R primary is higher than2 for the whole rangeof melanin levels in the epidermis. The overall gradient for B and G primaries is higher than for R, but it dropsbelow the camera noise level in the regions where the levels of these primaries get saturated due to high melaninconcentration. Whereas R and G primaries are error free, B primary shows an increase in error where melanin levelis higher than0:016 (very dark pigmentation). Similar analysis was applied to the gradient of each primary withrespect to blood (figures of gradients not included). It showed that blood level measurements have significantlylower accuracy, especially where the melanin level is high. The B primary performs best, but only where melaninlevel is low (below0:015). The R primary performs worst. For higher levels of melanin, G primary shows thelowest error, mainly because of moderate absorption level for both blood and melanin levels.
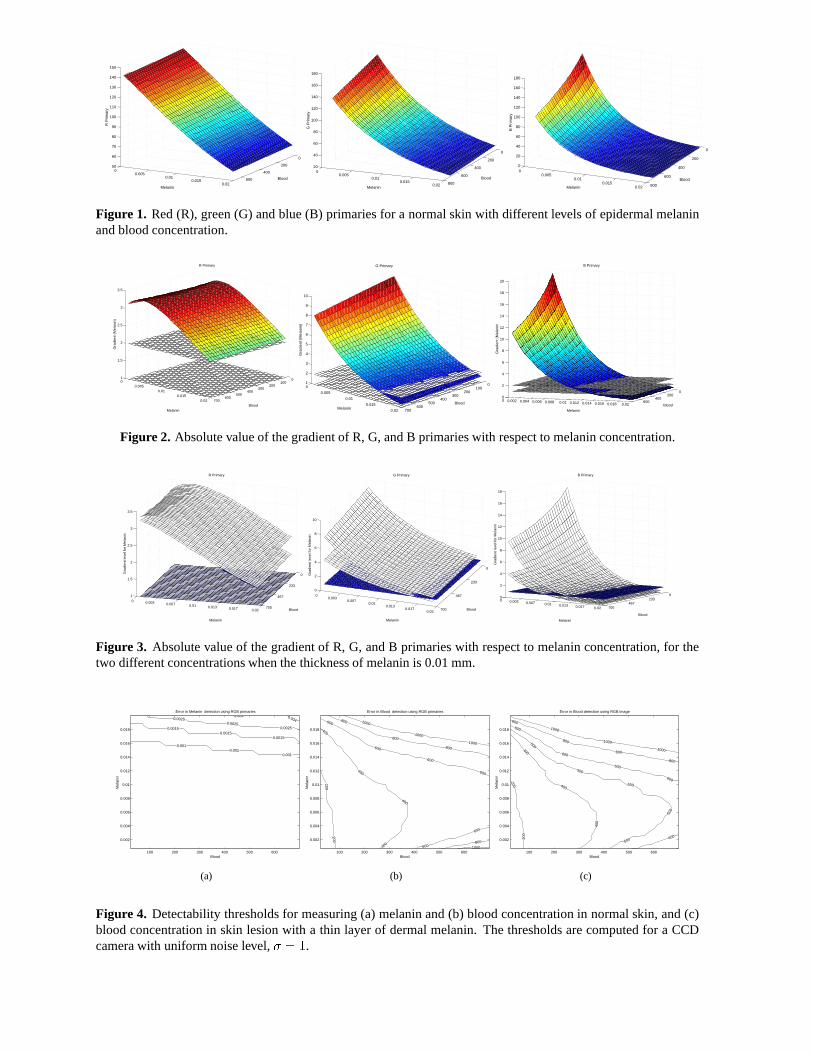
System sensitivity in the presence of thin skin lesion was performed by considering the surface of skin colourationwith two extreme levels of dermal melanin concentration. The gradient of each primary versus epidermal melaninand blood were computed using (1). The gradients were then compared against the camera noise level. Figure 3shows the gradient plots for R, G and B primaries. The highest gradient is shown by B primary where melanin andblood concentration are low. As a result of high absorption coefficient in the blue spectral region, the B primary issaturated very rapidly resulting in lower sensitivity to change in melanin concentration. G primary starts with highgradient and it maintains its level above the camera noise level. Both, B and G primaries, show gradient lower thanthe camera noise level where melanin concentration in the dermis is high. In contrast, R primary shows moderategradient, between1:5 and3:5, which is higher than camera noise level for the whole normal range of melaninconcentration in epidermis. Blood level measurement analysis for thin lesions showed sensitivity very similar tothat of the normal skin, demonstrating that the blood level in thin lesions can be measured with similar accuracyas in the normal skin.
4 Overall detectability threshold
Overall detectability thresholds for blood and melanin measurements were computed by combining the thresholdsderived for individual primaries using̀2 norm. Figure 4 shows the contours of equal detectability thresholds for

melanin and blood in the normal skin. The threshold for melanin detection is very low for most of the parameterrange. The threshold for blood detection shows an increase when the level of melanin increases. The figure alsoshows an increase in the detectability threshold level where the level of blood increases. To increase the sensitivityof the system, either the most reliable primary should be used individually or a higher quality camera with lowernoise level should be employed. The overall detectability threshold for blood and melanin measurement in thinskin lesions shows similar behaviour but with decreased sensitivity, as shown in Figure 4.
5 Validation
Ideally, validation should compare measurement results with ”the gold standard” representing true quantities. Thequantificationin vivo of the absolute levels of melanin and blood is not practicable.In vitro measurements ofthe pigment levels were validated for the LIR method (Logarithm of Inverse Reflectance) [5]. The agreement forlow concentrations of blood was to within2%, rising to the underestimate of17% for higher concentrations. Formelanin the error was negligible. Estimates obtained for LIR in vivo indicated8% underestimation for melanin.
Practical validation of our method was done in the first instance by comparing its measurements with LIR indices.This was carried out using Mexameter, a commercial device based on LIR. The assessment of melanin and bloodlevels was carried out using both systems on a range of subjects from a broad ethnic range. 73 subjects took partin the study. Correlation analysis was carried out to compare the results. For melanin measurements correlationcoefficient wasr = 0:985 (p < 0:001) and for blood,r = 0:621 (p < 0:001). Relatively low correlation for bloodmeasurement was partially due to a very small range of blood concentration levels present in normal skins (evenwith the use of the Tourniquet). We plan to extend this part of the study by taking measurements on skin conditionswhere abnormally high blood supply is present. However, in the light of the theoretical analysis above, showingthat blood measurements can have significant error margin, correlation for blood is likely to remain lower than thatfor melanin.
6 Conclusion
The new skin imaging method can reliably detect very small changes (less than 5%) in melanin level for almostentire range of skin pigmentations. For very high melanin contents the detectable increment reaches approximately20% of the maximum concentration. There is an excellent correlation with Mexameter measurements of melaninlevel. Changes in blood concentration can be detected with less sensitivity. For the normal Caucasian skin a typicaldetectable increment is around 20% of the maximum level assumed and slightly less in the presence of thin lesions.This can be improved by a careful selection of primaries and is the subject of current work. There is moderatecorrelation with Mexameter measurements. As our method uses three spectral values of measurement of bothpigments, its accuracy is likely to be superior to that of Mexameter. This will be investigated in future work.
Quantitative sensitivity analysis exploiting the model of image formation demonstrates theoretical capabilities ofthe imaging system and can give valuable insights for its further improvement. The availability of the detectionthresholds as a function of the skin parameters will enable critical evaluation of the parametric images producedby the new skin imaging method and will give confidence in their interpretation.
7 Acknowledgement
This work is supported by EPSRC grant GR /M53035.
References
1. S. Cotton & E. Claridge. “Noninvasive monitoring skin imaging.”Inf. Proc. in Med. Imag.1230, pp. 501–507, 1997.2. S. Cotton, E. Claridge & P. Hall. “A skin imaging method based on a colour formation model and its application to the
diagnosis of pigmented skin lesions.” InProc. MIUA 99, pp. 49–52. 1999.3. S. Cotton. A noninvasive imaging system for assisting in diagnosis of malignant melanoma. Ph.D. thesis, School of
Computer Science, Univ. of Birmingham, 1998.4. R. Anderson, B. S. Parrish & J. Parrish. “The optics of human skin.”The Journal of Investigative Dermatology77(1), 1981.5. J. W. Feather, D. J. Ellis & L. G. “A portable reflectometer for the rapid quantification of cutaneous haemoglobin and
melanin.” Phys. Med. Biol.33(6), pp. 711–723, 1988.
0
200
400
600
00.005
0.010.015
0.02
50
60
70
80
90
100
110
120
130
140
150
Blood
Melanin
R P
rimar
y
0
200
400
600
800
00.005
0.010.015
0.02
20
40
60
80
100
120
140
160
180
Blood
Melanin
G P
rimar
y
0
200
400
600
800
00.005
0.010.015
0.02
0
20
40
60
80
100
120
140
160
180
Blood
Melanin
B P
rimar
y
Figure 1. Red (R), green (G) and blue (B) primaries for a normal skin with different levels of epidermal melaninand blood concentration.
0100
200300
400500
600700
00.005
0.010.015
0.02
1
1.5
2
2.5
3
3.5
Blood
R Primary
Melanin
Gra
dien
t (M
elan
in)
0100
200300
400500
600700
0
0.005
0.01
0.015
0.02
1
2
3
4
5
6
7
8
9
10
Blood
G Primary
Melanin
Gra
dien
t (M
elan
in)
0200
4006000 0.002 0.004 0.006 0.008 0.01 0.012 0.014 0.016 0.018 0.02
0
2
4
6
8
10
12
14
16
18
20
Blood
B Primary
Melanin
Gra
dien
t (M
elan
in
Figure 2. Absolute value of the gradient of R, G, and B primaries with respect to melanin concentration.
0
233
467
700
0 0.003 0.007 0.01 0.013 0.017 0.02
1
1.5
2
2.5
3
3.5
Blood
Melanin
R Primary
Gra
dien
t lev
el fo
r M
elan
in
0
233
467
700
00.003
0.0070.01
0.0130.017
0.02
0
2
4
6
8
10
Blood
G Primary
Melanin
Gra
dien
t lev
el fo
r M
elan
in
0233
467700
0 0.003 0.007 0.01 0.013 0.017 0.02
0
2
4
6
8
10
12
14
16
18
Blood
B Primary
Melanin
Gra
dien
t lev
el fo
r M
elan
in
Figure 3. Absolute value of the gradient of R, G, and B primaries with respect to melanin concentration, for thetwo different concentrations when the thickness of melanin is 0.01 mm.
100 200 300 400 500 600
0.002
0.004
0.006
0.008
0.01
0.012
0.014
0.016
0.018
Blood
Mel
anin
Error in Melanin detection using RGB primaries
0.0010.001
0.001
0.00150.0015
0.0015
0.00250.0025
0.0025
0.004 0.004
(a)
100 200 300 400 500 600
0.002
0.004
0.006
0.008
0.01
0.012
0.014
0.016
0.018
Blood
Mel
anin
Error in Blood detection using RGB primaries
200
200
400
400
400
400
600
600
600
600
600
600
800
800
800
800
1000
1000
1000
1000
(b)
100 200 300 400 500 600
0.002
0.004
0.006
0.008
0.01
0.012
0.014
0.016
0.018
Blood
Mel
anin
Error in Blood detection using RGB image
200
200
400
400
400
500
500
500
500
500
600
600
600
600
600
800
800
800
800
1000
1000
1000
(c)
Figure 4. Detectability thresholds for measuring (a) melanin and (b) blood concentration in normal skin, and (c)blood concentration in skin lesion with a thin layer of dermal melanin. The thresholds are computed for a CCDcamera with uniform noise level,� = 1.
![Recovering Bloody Fingerprints from Skin red is a well-known blood-staining agent [7]. Experiments – Blood Preliminary Experiment Before using on human cadaver skin, we conducted](https://img.pdfslide.net/doc/110x75/5b0747f67f8b9ac33f8e0e2d/recovering-bloody-fingerprints-from-skin-red-is-a-well-known-blood-staining-agent.jpg)