Embed Size (px)
Citation preview
Proceedings of the 19th Central Hardwood Forest Conference GTR-NRS-P-142 299
ACCURATeLy DeTeRMINING LoG AND bARk voLUMeS oF SAw LoGS USING HIGH-ReSoLUTIoN LASeR SCAN DATA
R. edward Thomas and Neal D. bennett1
Abstract.—Accurately determining the volume of logs and bark is crucial to estimating the total expected value recovery from a log. Knowing the correct size and volume of a log helps to determine which processing method, if any, should be used on a given log. However, applying volume estimation methods consistently can be difficult. Errors in log measurement and oddly shaped logs can make log and residue volume estimates inaccurate. Laser log scanning systems consistently measure the surface points on a log to accuracies of 0.01 inch and finer. Using the measurement data from a laser scanning system and traditional volume equations, or using volume measurements directly from the laser scanning systems, provides highly accurate volume calculations. Such volume measurements are comparable to those obtained using water immersion and displacement methods.
INTRoDUCTIoN
There is much more to a saw log than the lumber that is sawn from it. The remainder, often called residue, is composed of bark removed by a debarker, wood chips produced from grinding the slabs, and sawdust from sawing the lumber. Residue can be measured by cubic volume or weight. There may be as much as 500 pounds of residue for every 1000 board feet of lumber produced (Harkin and Rowe 1971). If the residue is not being used or sold, there is a disposal cost. It is important to grasp the economic value for each saw log that is purchased and to garner maximum utilization of all the components.
Bark has value, be it from selling as landscaping mulch, burning it to heat dry kilns, making charcoal briquettes or carbon filters, or converting it to biomass energy. When logs are purchased, they are priced individually according to size and grade. Various log scales are employed to determine the amount of lumber that can be acquired from each log. The method used when a log is scaled in a log yard excludes the bark content from the purchase price, resulting in it being a free commodity. Every log processed incurs a cost in separating the bark from the wood. Hopefully, the value of the bark exceeds this cost plus the cost of transportation to its end user. Proximity to a market to minimize transportation costs plays an important role in deciding a profitable end use for the bark. Most sawmills have an idea how much bark is produced by how many trucks they fill over a period of time, thus it is volume based or weight based if the trucks are weighed as part of the sales agreement.
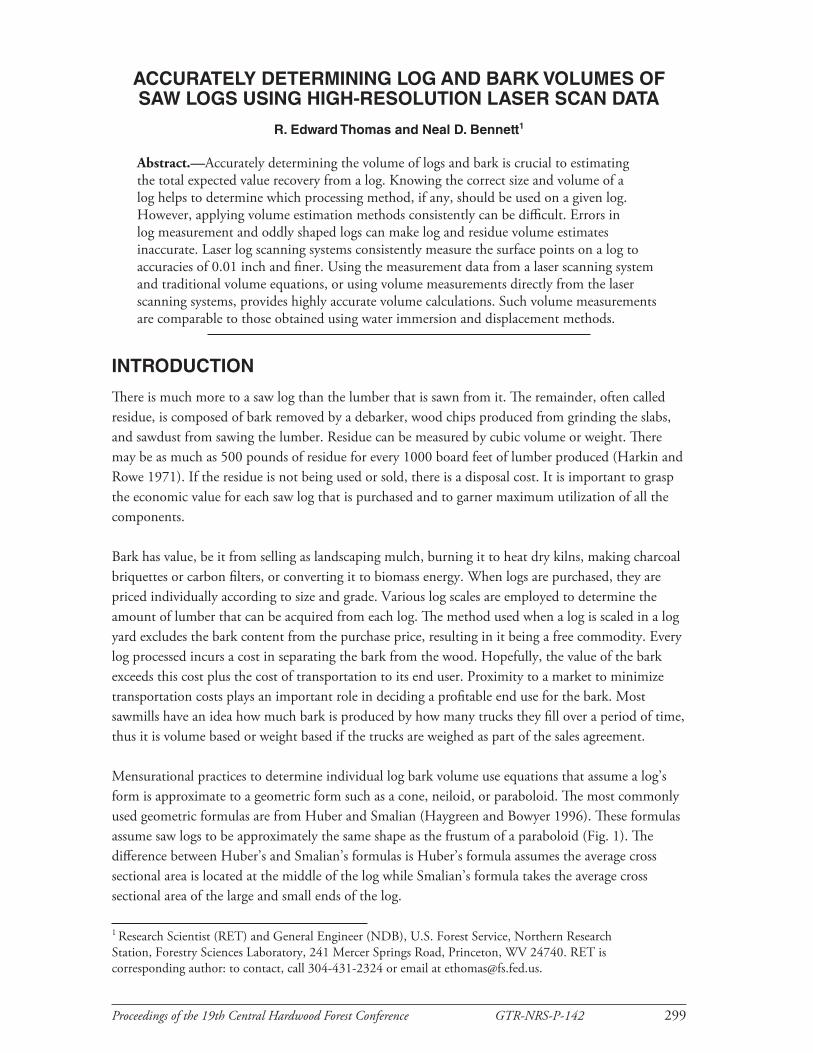
Mensurational practices to determine individual log bark volume use equations that assume a log’s form is approximate to a geometric form such as a cone, neiloid, or paraboloid. The most commonly used geometric formulas are from Huber and Smalian (Haygreen and Bowyer 1996). These formulas assume saw logs to be approximately the same shape as the frustum of a paraboloid (Fig. 1). The difference between Huber’s and Smalian’s formulas is Huber’s formula assumes the average cross sectional area is located at the middle of the log while Smalian’s formula takes the average cross sectional area of the large and small ends of the log.
1 Research Scientist (RET) and General Engineer (NDB), U.S. Forest Service, Northern Research Station, Forestry Sciences Laboratory, 241 Mercer Springs Road, Princeton, WV 24740. RET is corresponding author: to contact, call 304-431-2324 or email at [email protected].
Proceedings of the 19th Central Hardwood Forest Conference GTR-NRS-P-142 300
The first step in using these equations to calculate bark volume is to calculate whole log volume outside of the bark. Then bark thickness, either measured or taken from published tables, is subtracted to determine log volume of wood under the bark. Bark volume is the difference between the two results. One other method (Dobie and Wright 1975) to determine bark volume is to assume the ratio of bark volume to whole log volume is equal to the ratio of twice bark thickness to log diameter measured outside of the bark.
To date, perhaps the most accurate examination of log volumes was performed by Martin (1984). Martin compared the log volume estimates using Smalian’s, Huber’s, and other formulas to actual log volume determined using a xylometer or log immersion tank. The volume of displaced water was then compared to the calculated volume of the different volume equations. Martin found that Huber’s formula was the most accurate volume estimator with a mean absolute difference of 0.36 cubic feet.
Currently, the U.S. Forest Service research lab in Princeton, WV is conducting a line of research using a high-resolution laser log scanner to create detailed three-dimensional external log images. From this image data the total volume of a log can be very accurately determined. If bark thickness is known, the value can be subtracted from the raw data points to determine wood volume. Bark volume is the difference between total log volume and total wood volume. Determining bark volume of each log becomes a matter of programming the computer to allow a sawmill operator to accurately track the bark produced from each log as it is processed at the sawmill. Laser systems are currently being used in larger sawmills in the East for the purpose of judging the best opening face of a log or predicting lumber volumes that can be produced. Adding bark and volume calculators would be a benefit to the sawmill operator without any added cost to the laser system, thus giving the sawmill operator the ability to determine the economic value of each log and to garner maximum utilization of all the components
Figure 1.—Frustrum of a paraboloid, the common log shape assumed by the Huber and Smalian volume formulas.
Proceedings of the 19th Central Hardwood Forest Conference GTR-NRS-P-142 301
MeTHoDS
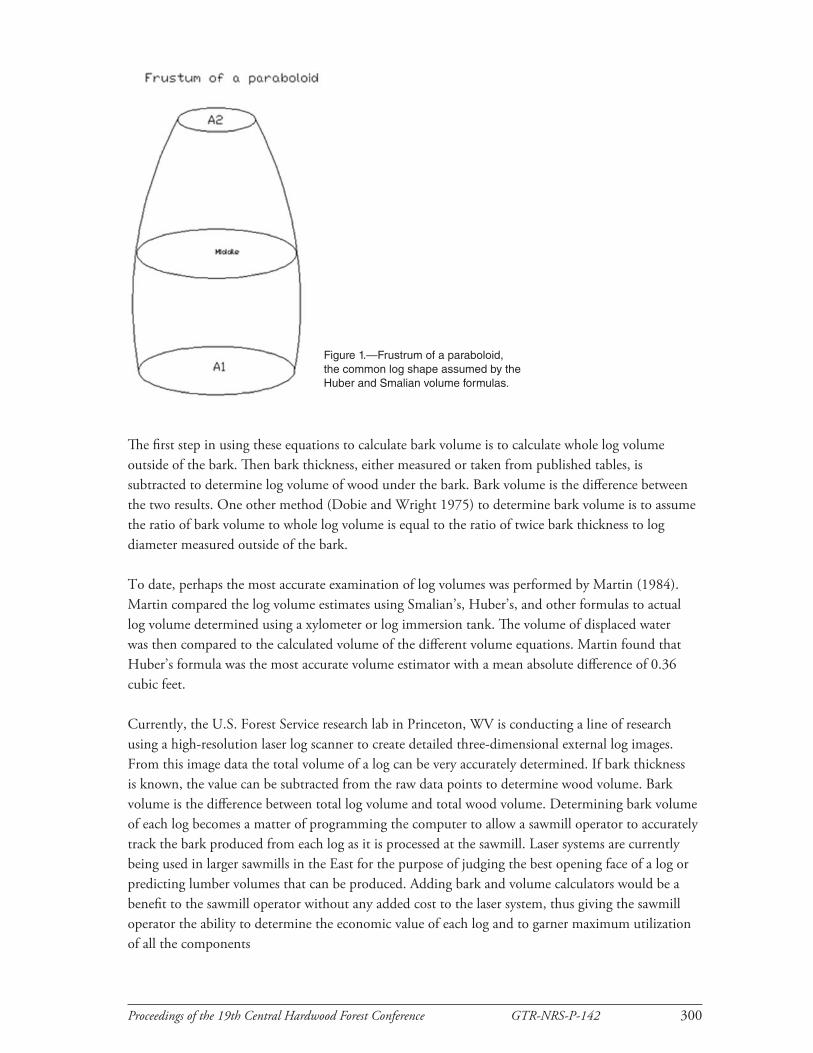
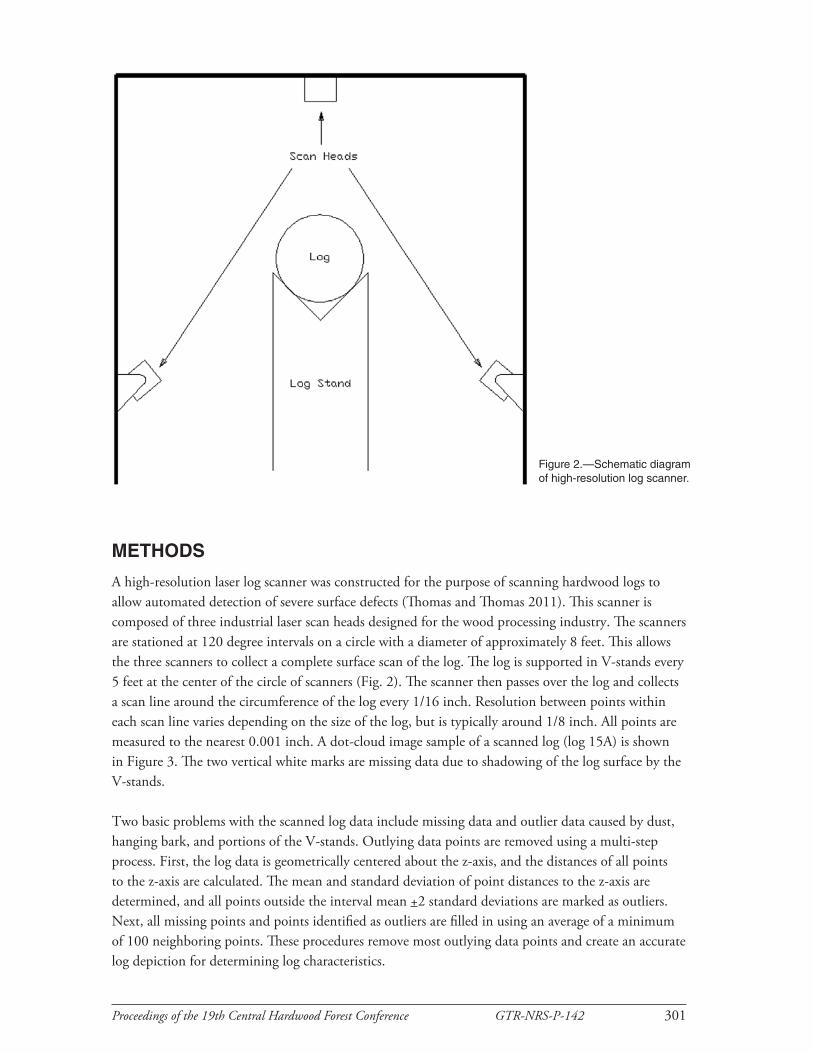
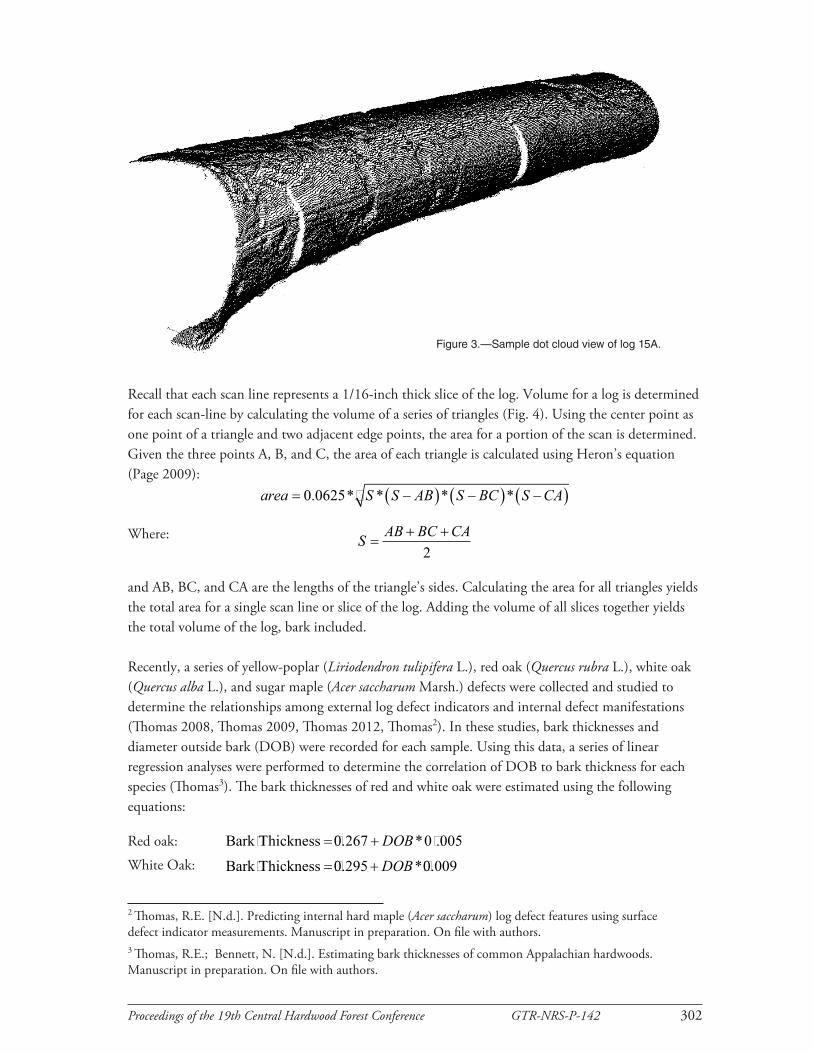
A high-resolution laser log scanner was constructed for the purpose of scanning hardwood logs to allow automated detection of severe surface defects (Thomas and Thomas 2011). This scanner is composed of three industrial laser scan heads designed for the wood processing industry. The scanners are stationed at 120 degree intervals on a circle with a diameter of approximately 8 feet. This allows the three scanners to collect a complete surface scan of the log. The log is supported in V-stands every 5 feet at the center of the circle of scanners (Fig. 2). The scanner then passes over the log and collects a scan line around the circumference of the log every 1/16 inch. Resolution between points within each scan line varies depending on the size of the log, but is typically around 1/8 inch. All points are measured to the nearest 0.001 inch. A dot-cloud image sample of a scanned log (log 15A) is shown in Figure 3. The two vertical white marks are missing data due to shadowing of the log surface by the V-stands.
Two basic problems with the scanned log data include missing data and outlier data caused by dust, hanging bark, and portions of the V-stands. Outlying data points are removed using a multi-step process. First, the log data is geometrically centered about the z-axis, and the distances of all points to the z-axis are calculated. The mean and standard deviation of point distances to the z-axis are determined, and all points outside the interval mean +2 standard deviations are marked as outliers. Next, all missing points and points identified as outliers are filled in using an average of a minimum of 100 neighboring points. These procedures remove most outlying data points and create an accurate log depiction for determining log characteristics.
Figure 2.—Schematic diagram of high-resolution log scanner.
Proceedings of the 19th Central Hardwood Forest Conference GTR-NRS-P-142 302
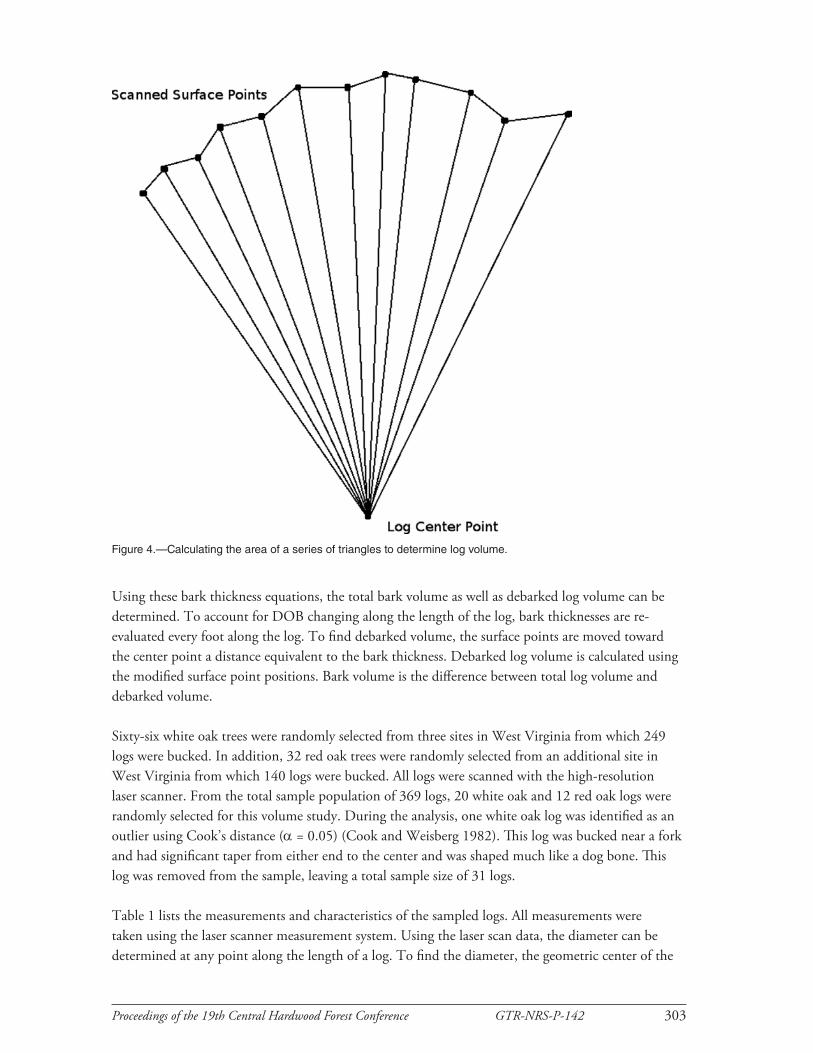
Recall that each scan line represents a 1/16-inch thick slice of the log. Volume for a log is determined for each scan-line by calculating the volume of a series of triangles (Fig. 4). Using the center point as one point of a triangle and two adjacent edge points, the area for a portion of the scan is determined. Given the three points A, B, and C, the area of each triangle is calculated using Heron’s equation (Page 2009):
area S S AB S BC S CA= −( ) −( ) −( )0 0625. *� * * *
Where: S AB BC CA=
+ +2
and AB, BC, and CA are the lengths of the triangle’s sides. Calculating the area for all triangles yields the total area for a single scan line or slice of the log. Adding the volume of all slices together yields the total volume of the log, bark included.
Recently, a series of yellow-poplar (Liriodendron tulipifera L.), red oak (Quercus rubra L.), white oak (Quercus alba L.), and sugar maple (Acer saccharum Marsh.) defects were collected and studied to determine the relationships among external log defect indicators and internal defect manifestations (Thomas 2008, Thomas 2009, Thomas 2012, Thomas2). In these studies, bark thicknesses and diameter outside bark (DOB) were recorded for each sample. Using this data, a series of linear regression analyses were performed to determine the correlation of DOB to bark thickness for each species (Thomas3). The bark thicknesses of red and white oak were estimated using the following equations:
Red oak: Bark�Thickness = +�. * �.0 267 0 005DOBWhite Oak: Bark�Thickness = +�. *�.0 295 0 009DOB
2 Thomas, R.E. [N.d.]. Predicting internal hard maple (Acer saccharum) log defect features using surface defect indicator measurements. Manuscript in preparation. On file with authors.3 Thomas, R.E.; Bennett, N. [N.d.]. Estimating bark thicknesses of common Appalachian hardwoods. Manuscript in preparation. On file with authors.
Figure 3.—Sample dot cloud view of log 15A.
Proceedings of the 19th Central Hardwood Forest Conference GTR-NRS-P-142 303
Using these bark thickness equations, the total bark volume as well as debarked log volume can be determined. To account for DOB changing along the length of the log, bark thicknesses are re-evaluated every foot along the log. To find debarked volume, the surface points are moved toward the center point a distance equivalent to the bark thickness. Debarked log volume is calculated using the modified surface point positions. Bark volume is the difference between total log volume and debarked volume.
Sixty-six white oak trees were randomly selected from three sites in West Virginia from which 249 logs were bucked. In addition, 32 red oak trees were randomly selected from an additional site in West Virginia from which 140 logs were bucked. All logs were scanned with the high-resolution laser scanner. From the total sample population of 369 logs, 20 white oak and 12 red oak logs were randomly selected for this volume study. During the analysis, one white oak log was identified as an outlier using Cook’s distance (α = 0.05) (Cook and Weisberg 1982). This log was bucked near a fork and had significant taper from either end to the center and was shaped much like a dog bone. This log was removed from the sample, leaving a total sample size of 31 logs.
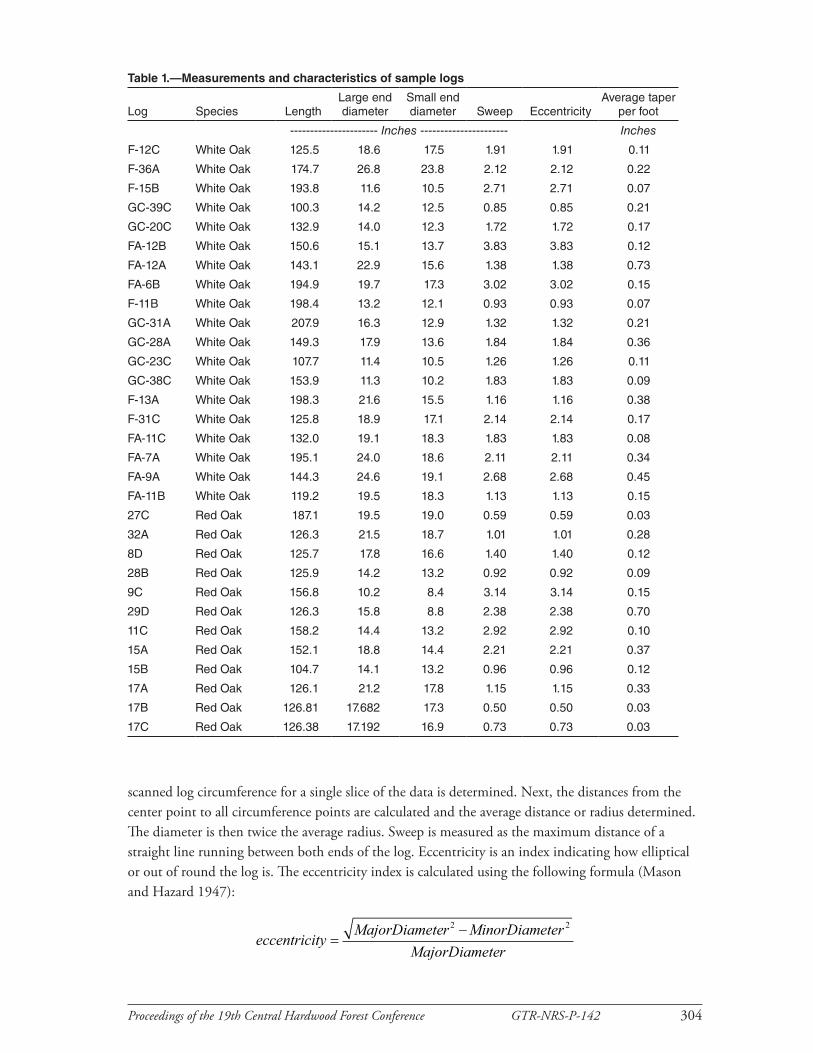
Table 1 lists the measurements and characteristics of the sampled logs. All measurements were taken using the laser scanner measurement system. Using the laser scan data, the diameter can be determined at any point along the length of a log. To find the diameter, the geometric center of the
Figure 4.—Calculating the area of a series of triangles to determine log volume.
Proceedings of the 19th Central Hardwood Forest Conference GTR-NRS-P-142 304
Table 1.—Measurements and characteristics of sample logs
Log Species LengthLarge end diameter
Small end diameter Sweep Eccentricity
Average taper per foot
---------------------- Inches ---------------------- Inches
F-12C White Oak 125.5 18.6 17.5 1.91 1.91 0.11
F-36A White Oak 174.7 26.8 23.8 2.12 2.12 0.22
F-15B White Oak 193.8 11.6 10.5 2.71 2.71 0.07
GC-39C White Oak 100.3 14.2 12.5 0.85 0.85 0.21
GC-20C White Oak 132.9 14.0 12.3 1.72 1.72 0.17
FA-12B White Oak 150.6 15.1 13.7 3.83 3.83 0.12
FA-12A White Oak 143.1 22.9 15.6 1.38 1.38 0.73
FA-6B White Oak 194.9 19.7 17.3 3.02 3.02 0.15
F-11B White Oak 198.4 13.2 12.1 0.93 0.93 0.07
GC-31A White Oak 207.9 16.3 12.9 1.32 1.32 0.21
GC-28A White Oak 149.3 17.9 13.6 1.84 1.84 0.36
GC-23C White Oak 107.7 11.4 10.5 1.26 1.26 0.11
GC-38C White Oak 153.9 11.3 10.2 1.83 1.83 0.09
F-13A White Oak 198.3 21.6 15.5 1.16 1.16 0.38
F-31C White Oak 125.8 18.9 17.1 2.14 2.14 0.17
FA-11C White Oak 132.0 19.1 18.3 1.83 1.83 0.08
FA-7A White Oak 195.1 24.0 18.6 2.11 2.11 0.34
FA-9A White Oak 144.3 24.6 19.1 2.68 2.68 0.45
FA-11B White Oak 119.2 19.5 18.3 1.13 1.13 0.15
27C Red Oak 187.1 19.5 19.0 0.59 0.59 0.03
32A Red Oak 126.3 21.5 18.7 1.01 1.01 0.28
8D Red Oak 125.7 17.8 16.6 1.40 1.40 0.12
28B Red Oak 125.9 14.2 13.2 0.92 0.92 0.09
9C Red Oak 156.8 10.2 8.4 3.14 3.14 0.15
29D Red Oak 126.3 15.8 8.8 2.38 2.38 0.70
11C Red Oak 158.2 14.4 13.2 2.92 2.92 0.10
15A Red Oak 152.1 18.8 14.4 2.21 2.21 0.37
15B Red Oak 104.7 14.1 13.2 0.96 0.96 0.12
17A Red Oak 126.1 21.2 17.8 1.15 1.15 0.33
17B Red Oak 126.81 17.682 17.3 0.50 0.50 0.03
17C Red Oak 126.38 17.192 16.9 0.73 0.73 0.03
scanned log circumference for a single slice of the data is determined. Next, the distances from the center point to all circumference points are calculated and the average distance or radius determined. The diameter is then twice the average radius. Sweep is measured as the maximum distance of a straight line running between both ends of the log. Eccentricity is an index indicating how elliptical or out of round the log is. The eccentricity index is calculated using the following formula (Mason and Hazard 1947):
eccentricityMajorDiameter MinorDiameter
MajorDiameter=
−2 2�
Proceedings of the 19th Central Hardwood Forest Conference GTR-NRS-P-142 305
For example, a perfectly round log will have an index of 0.00, a log with a major diameter of 16 and a minor diameter of 14 would have an eccentricity index of 0.48. The greater the index value, the greater the degree of eccentricity or ellipticality. Taper per foot is the difference between large and small end diameter outside bark measurements divided by the scaled log length, and the greater the number, the greater the degree of taper present in the log.
Traditionally, log volumes have been estimated using one of several possible methodologies (Haygreen and Bowyer 1996), including Huber’s (Eq. 1) and Smalian’s (Eq. 2) geometric methods shown below:
Volume= L x A (1)
Volume= (
A1+ A2
2)xL (2)
Where L is log length, A is the cross sectional area at the middle of the log, and A1 and A2 are the cross sectional areas of the large and small ends of the log, respectively.
Huber’s and Smalian’s formulas (Eqs. 1 and 2) find the volume of the log. To find the bark volume, the cross-sectional areas must be calculated twice, once with the bark and once excluding the bark. Subtracting the excluded bark volume from total volume yields bark volume. Another way to determine bark volume is to use Dobie and Wright’s formula (Dobie and Wright 1975) listed below (Eq. 3) which assumes the ratio between double bark thickness and log diameter outside bark is the same ratio as bark volume to total log volume.
BarkVolume= DOB2− DIB2
DOB2 x100 (3)
DOB is the diameter measured outside the bark and DIB is diameter measured inside the bark. We used DOB and DIB measurements that were averages of the midpoint and small and large end diameters. To get bark volume from the Dobie and Wright equation (Eq. 3), you still have to determine total log volume by one of the previously described methods.
Using the 2011 R statistical package (R Foundation for Statistical Computing, Vienna, Austria), Anderson-Darling normality tests (α=0.05) (Anderson and Darling 1952) were performed to determine if the variables and volumes involved in this study were normally distributed. The tests revealed that sweep, eccentricity, scanner determined volumes, Smalian calculated volumes, and the Huber calculated volumes were normally distributed. However, log taper and the differences between the scanner volumes and both the Huber and Smalian calculated volumes were not normally distributed.
Paired-t tests were used to compare Huber and Smalian calculated volumes to the scanner determined volumes. As these comparisons involved two tests, the significance level was adjusted for each individual test using the Bonferonni correction (Abdi 2007). An overall significance level of 0.05 was used with an adjusted significance of 0.025 for each individual test.
To determine if sweep, taper, or eccentricity had a significant relationship to the differences between scanner calculated volume and the Huber and Smalian volume estimation methods, a series of simple linear regression analyses were performed. Sweep, taper, and eccentricity were the independent variables and the dependent variable was the volume difference. The correlation for each independent
Proceedings of the 19th Central Hardwood Forest Conference GTR-NRS-P-142 306
variable was analyzed separately. Cook’s distance (Cook and Weisenberg 1982) was used to determine if any individual observation had a high influence over the regression. The residuals from each analyses were tested using the Anderson-Darling normality tests (α=0.05) (Anderson and Darling 1952) to determine if the residuals were normally distributed. In all cases where a log feature had a significant correlation to a volume difference, the residuals had a normal distribution.
Due to the non-normal distributive nature of the bark volumes, Wilcoxon signed rank tests (α = 0.05) were used to compare the results of the different bark volume estimation methods (Wilcoxon 1945). Five tests were performed comparing the scanner determined bark volume to the volumes calculated using the Smalian, Huber, and the Dobie and Wright equation variants. The significance level for the tests was adjusted using the Bonferroni correction (Abdi 2007).
ReSULTS AND DISCUSSIoN
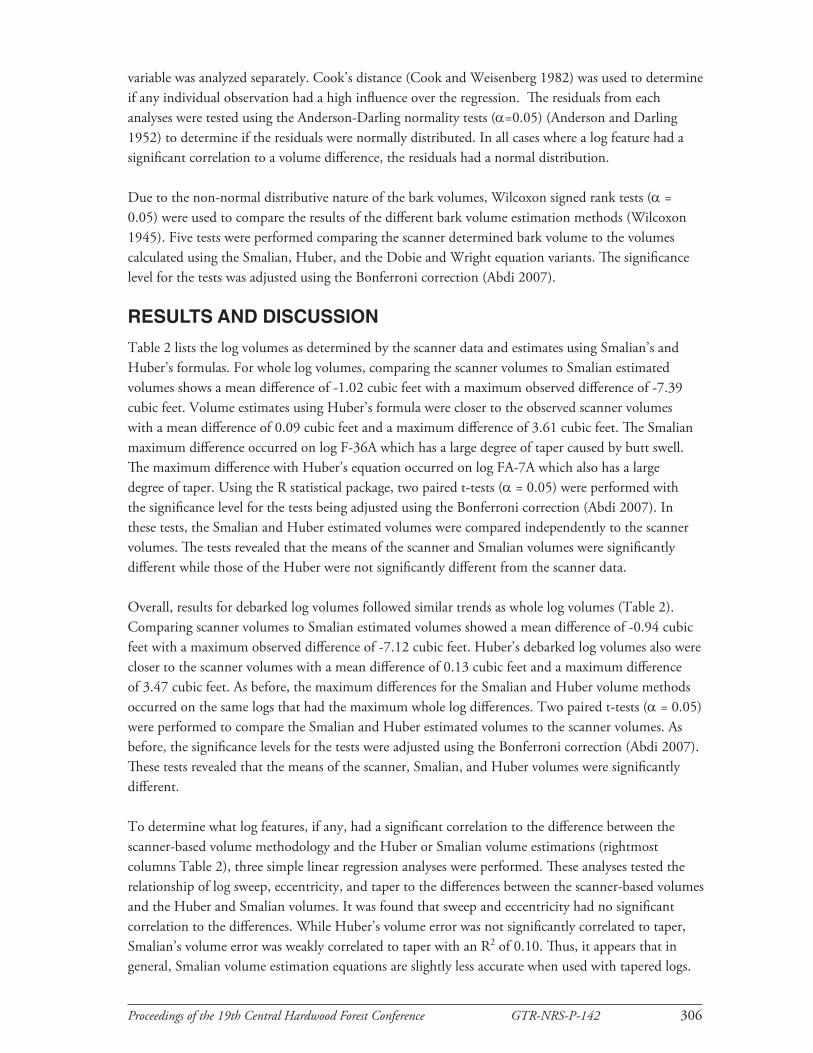
Table 2 lists the log volumes as determined by the scanner data and estimates using Smalian’s and Huber’s formulas. For whole log volumes, comparing the scanner volumes to Smalian estimated volumes shows a mean difference of -1.02 cubic feet with a maximum observed difference of -7.39 cubic feet. Volume estimates using Huber’s formula were closer to the observed scanner volumes with a mean difference of 0.09 cubic feet and a maximum difference of 3.61 cubic feet. The Smalian maximum difference occurred on log F-36A which has a large degree of taper caused by butt swell. The maximum difference with Huber’s equation occurred on log FA-7A which also has a large degree of taper. Using the R statistical package, two paired t-tests (α = 0.05) were performed with the significance level for the tests being adjusted using the Bonferroni correction (Abdi 2007). In these tests, the Smalian and Huber estimated volumes were compared independently to the scanner volumes. The tests revealed that the means of the scanner and Smalian volumes were significantly different while those of the Huber were not significantly different from the scanner data.
Overall, results for debarked log volumes followed similar trends as whole log volumes (Table 2). Comparing scanner volumes to Smalian estimated volumes showed a mean difference of -0.94 cubic feet with a maximum observed difference of -7.12 cubic feet. Huber’s debarked log volumes also were closer to the scanner volumes with a mean difference of 0.13 cubic feet and a maximum difference of 3.47 cubic feet. As before, the maximum differences for the Smalian and Huber volume methods occurred on the same logs that had the maximum whole log differences. Two paired t-tests (α = 0.05) were performed to compare the Smalian and Huber estimated volumes to the scanner volumes. As before, the significance levels for the tests were adjusted using the Bonferroni correction (Abdi 2007). These tests revealed that the means of the scanner, Smalian, and Huber volumes were significantly different.
To determine what log features, if any, had a significant correlation to the difference between the scanner-based volume methodology and the Huber or Smalian volume estimations (rightmost columns Table 2), three simple linear regression analyses were performed. These analyses tested the relationship of log sweep, eccentricity, and taper to the differences between the scanner-based volumes and the Huber and Smalian volumes. It was found that sweep and eccentricity had no significant correlation to the differences. While Huber’s volume error was not significantly correlated to taper, Smalian’s volume error was weakly correlated to taper with an R2 of 0.10. Thus, it appears that in general, Smalian volume estimation equations are slightly less accurate when used with tapered logs.
Proceedings of the 19th Central Hardwood Forest Conference GTR-NRS-P-142 307
Table 2.—volume measurements of sample logs using three different measurement methods
Log
Scannerwhole logvolume
Scannerdebarked
log volume
Smalianwhole logvolume
Smaliandebarked
log volume
Huberwhole
log volume
Huberdebarked
log volume
Scannervs. Smalianwhole logdifference
Scannervs. Huberwhole logdifference
Scannervs. Smaliandebarkeddifference
Scannervs. Huberdebarkeddifference
------------------------------------------------------------------------- Cubic feet -------------------------------------------------------------------------
F-12C 20.3 18.7 18.5 17.0 18.6 17.1 1.72 1.62 1.67 1.58
F-36A 43.6 40.5 50.9 47.6 46.0 42.9 -7.39 -2.49 -7.12 -2.39
F-15B 10.5 9.4 10.8 9.6 10.7 9.5 -0.24 -0.21 -0.17 -0.14
GC-39C 7.4 6.8 8.2 7.4 6.6 5.8 -0.71 0.89 -0.54 0.98
GC-20C 9.2 8.3 10.4 9.4 9.2 8.2 -1.23 -0.03 -1.14 0.00
FA-12B 15.6 14.2 14.3 12.9 14.3 12.9 1.30 1.30 1.35 1.35
FA-12A 18.8 17.2 24.9 23.1 16.9 15.3 -6.05 1.99 -5.81 1.92
FA-6B 31.9 29.4 30.4 28.0 33.0 30.4 1.43 -1.12 1.38 -1.06
F-11B 14.5 13.0 14.5 13.0 15.0 13.5 -0.04 -0.54 -0.02 -0.49
GC-31A 18.8 17.2 20.4 18.5 17.8 16.1 -1.58 0.98 -1.39 1.06
GC-28A 14.6 13.2 17.1 15.6 13.9 12.5 -2.56 0.69 -2.43 0.68
GC-23C 5.8 5.2 5.9 5.2 5.8 5.2 -0.06 -0.01 -0.04 0.01
GC-38C 7.4 6.6 8.1 7.2 7.0 6.1 -0.72 0.44 -0.61 0.49
F-13A 24.8 22.9 31.9 29.4 25.1 22.8 -7.10 -0.27 -6.52 0.05
F-31C 20.3 18.7 18.6 17.0 21.3 19.7 1.69 -1.09 1.64 -1.03
FA-11C 19.6 18.0 21.0 19.3 18.8 17.2 -1.34 0.78 -1.25 0.78
FA-7A 34.5 31.8 40.9 38.0 30.9 28.3 -6.40 3.61 -6.17 3.47
FA-9A 32.2 29.9 31.8 29.5 34.8 32.3 0.39 -2.58 0.38 -2.47
FA-11B 19.6 18.1 19.4 17.8 21.5 19.9 0.20 -1.90 0.20 -1.81
27C 32.4 30.1 31.6 29.2 32.6 30.2 0.83 -0.18 0.85 -0.13
32A 22.8 21.1 23.2 21.6 22.7 21.1 -0.47 0.03 -0.45 0.04
8D 15.3 14.1 16.8 15.5 15.6 14.3 -1.51 -0.29 -1.42 -0.25
28B 10.7 9.7 10.8 9.7 10.7 9.7 -0.05 0.02 -0.03 0.04
9C 6.2 5.4 6.2 5.4 6.6 5.8 -0.05 -0.44 0.03 -0.33
29D 12.3 11.2 9.4 8.4 12.7 11.6 2.92 -0.41 2.79 -0.33
11C 13.1 11.9 13.7 12.4 12.6 11.3 -0.58 0.57 -0.48 0.61
15A 16.6 15.1 19.3 17.8 15.3 13.9 -2.75 1.23 -2.61 1.21
15B 9.2 8.3 8.9 8.0 9.2 8.3 0.30 -0.03 0.31 -0.01
17A 20.2 18.7 22.0 20.4 19.7 18.2 -1.74 0.54 -1.67 0.53
17B 17.1 15.7 17.7 16.3 17.1 15.7 -0.59 -0.04 -0.55 -0.02
17C 17.5 16.1 16.7 15.4 17.9 16.5 0.73 -0.40 0.74 -0.35
Mean -1.02 0.09 -0.94 0.13
Maximum difference -0.04 -0.01 -0.02 0.01
Minimum difference -7.39 3.61 -7.12 3.47
Proceedings of the 19th Central Hardwood Forest Conference GTR-NRS-P-142 308
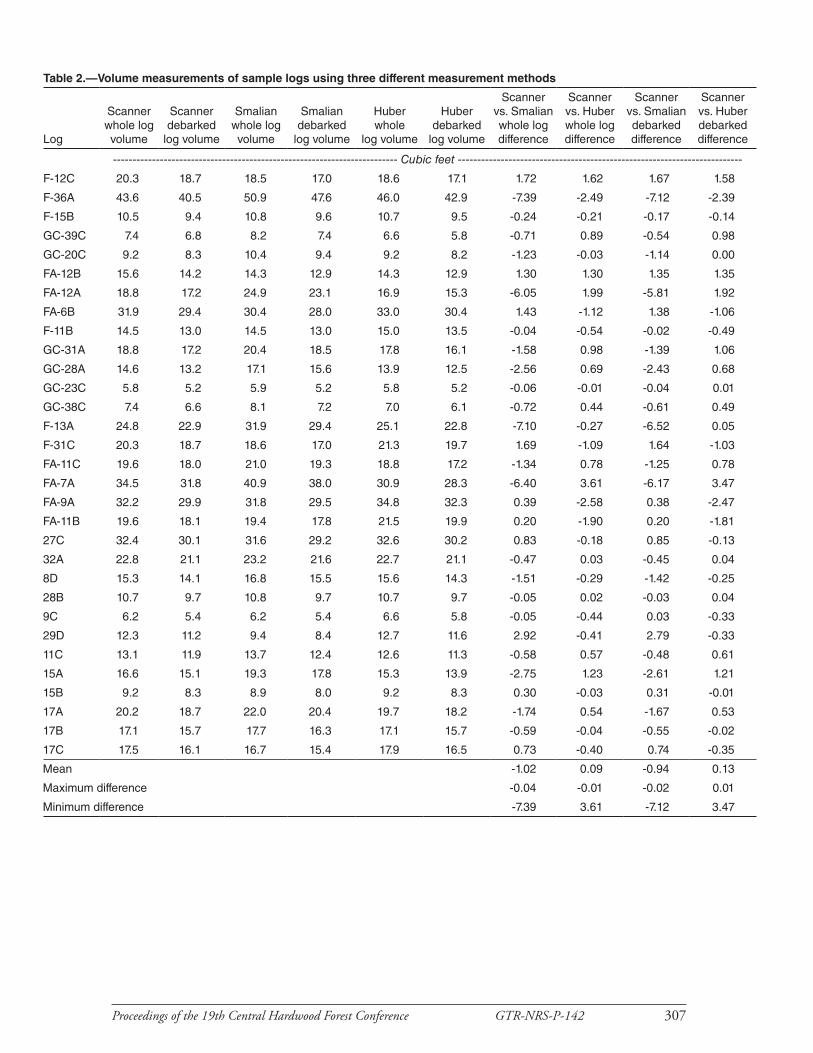
In addition to the bark volume as determined by the scanner, we examined five different approaches to estimating bark volume. Two methods were simply the difference between whole log and debarked volume estimates calculated using the Smalian and Huber formulas. The other three methods used the Dobie and Wright bark estimation formula where bark volume is estimated directly using the scanner data and by using the Smalian and Huber whole log volume estimates.
Table 3 contains the bark volume estimates for these methods. The rightmost column contains the standard deviation of the different bark volume calculation methods for each log. Higher standard deviation values indicate logs that have the greatest volume discrepancies among the different volume estimation methods. Six of seven logs with the six highest standard deviation values (>0.10) were all butt logs. In addition, all seven logs had high degrees of taper (Table 1), indicating that one or more methods were more error prone when estimating the volume characteristics of butt logs, specifically those with taper or butt swell. This observation was consistent given the earlier finding that taper is significantly correlated with whole log volume estimation error. The results indicated that there were no significant differences between the means of the scanner methodology and the Dobie and Wright Huber-based and the Huber methods. The means of all other methods were significantly different from the scanner methodology.
SUMMARy AND CoNCLUSIoN
Whole log and debarked volumes as determined by the scanner were most comparable to the volumes calculated using Huber’s formula, with mean differences of 0.09 and 0.13 cubic feet, respectively. These results are similar to those found by Martin (1984), where Huber’s formula more accurately estimated volume than Smalian’s formula. Recall that Smalian’s formula is based on an average of large and small end cross-sectional area, while Huber’s formula is based on the midpoint cross-sectional area. Thus, the volume of logs with a large degree of taper, specifically butt logs, will be overestimated using Smalian’s formula.
While the mean differences between the Huber and scanner volume methods were acceptably small, one must remember that the diameter and length measurements were from the laser scanning system. The laser scanner measures surface point locations accurate to 0.01 inch. As such, these measurements provide very accurate input data for Huber’s formula. Field measurements for estimating volume will not likely be this accurate. All volume equations are dependent on accurate measurements of log diameter and length. Any error in measuring either is magnified when volume is calculated.
Calculating bark volume using the scanner-based methodology yields a solid volume. This removes the normal concerns of particle size and compaction when measuring bark volume. Using weight to measure residue also has problems. The moisture content of the bark varies among logs and from day to day. Similarly, there are specific gravity differences between species. Using the data from the laser scanner provides the most accurate way of determining bark and log volume. In mills where the logs are scanned at the headrig after debarking, it would be trivial, in terms of both cost and effort, to estimate bark thickness based on the log’s diameter and calculate total bark volume or weight at a specific moisture content. Even in situations where DOB varied significantly along the log, the scanner-based method described here would still provide accurate bark and log volume estimates.
Proceedings of the 19th Central Hardwood Forest Conference GTR-NRS-P-142 309
Table 3.—bark volumes as calculated from scanner and estimation formulas
Log
Calculatedbark
thickness
Scannerbark
volume
Smalianbark
volume
Huberbark
volume
Dobie andWright
bark volumeusing scanner
Dobie andWright
bark volumeusing Smalians
Dobie andWright
bark volumeusing Hubers Mean
Standarddeviation
(Inches) ----------------------------------------------- Cubic feet ------------------------------------------------
F-12C 0.383 1.61 1.54 1.55 1.71 1.56 1.55 1.59 0.06
F-36A 0.419 3.45 3.31 3.15 3.05 3.57 3.06 3.26 0.21
F-15B 0.319 1.14 1.20 1.20 1.18 1.21 1.21 1.19 0.03
GC-39C 0.335 0.65 0.80 0.71 0.76 0.83 0.67 0.73 0.07
GC-20C 0.334 0.95 1.03 0.97 0.94 1.06 0.94 0.98 0.05
FA-12B 0.357 1.35 1.37 1.38 1.51 1.38 1.38 1.39 0.06
FA-12A 0.375 1.60 1.84 1.53 1.57 2.07 1.40 1.67 0.24
FA-6B 0.384 2.53 2.46 2.57 2.59 2.48 2.65 2.55 0.07
F-11B 0.337 1.49 1.50 1.53 1.49 1.49 1.55 1.51 0.03
GC-31A 0.347 1.72 1.87 1.75 1.79 1.94 1.70 1.80 0.09
GC-28A 0.354 1.35 1.48 1.34 1.34 1.57 1.27 1.39 0.11
GC-23C 0.322 0.65 0.67 0.67 0.66 0.67 0.67 0.66 0.01
GC-38C 0.314 0.81 0.92 0.85 0.85 0.94 0.81 0.86 0.05
F-13A 0.379 2.07 2.49 2.23 2.08 2.68 2.11 2.28 0.25
F-31C 0.380 1.59 1.53 1.65 1.68 1.54 1.73 1.62 0.08
FA-11C 0.380 1.58 1.67 1.58 1.60 1.71 1.53 1.61 0.07
FA-7A 0.390 2.74 2.89 2.53 2.67 3.16 2.35 2.72 0.28
FA-9A 0.407 2.50 2.29 2.41 2.44 2.41 2.53 2.43 0.08
FA-11B 0.386 1.56 1.55 1.63 1.57 1.55 1.69 1.59 0.06
27C 0.363 2.33 2.34 2.37 2.40 2.34 2.40 2.36 0.03
32A 0.364 1.63 1.65 1.63 1.66 1.69 1.63 1.65 0.02
8D 0.350 1.25 1.34 1.29 1.24 1.36 1.26 1.29 0.05
28B 0.337 1.01 1.03 1.03 1.03 1.03 1.03 1.03 0.01
9C 0.317 0.74 0.81 0.84 0.80 0.80 0.87 0.81 0.04
29D 0.341 1.08 0.93 1.14 1.32 1.01 1.37 1.14 0.17
11C 0.336 1.20 1.30 1.24 1.27 1.32 1.21 1.26 0.05
15A 0.345 1.42 1.55 1.39 1.41 1.65 1.31 1.45 0.12
15B 0.337 0.86 0.85 0.87 0.88 0.85 0.88 0.87 0.01
17A 0.359 1.51 1.58 1.50 1.51 1.64 1.45 1.53 0.07
17B 0.353 1.36 1.40 1.37 1.36 1.41 1.36 1.38 0.02
17C 0.353 1.35 1.35 1.40 1.40 1.34 1.43 1.38 0.04
Mean 0.357 1.52 1.57 1.53 1.54 1.62 1.52
The content of this paper reflects the views of the authors(s), who are responsible for the facts and accuracy of the information presented herein.
Proceedings of the 19th Central Hardwood Forest Conference GTR-NRS-P-142 310
LITeRATURe CITeD
Abdi, H. 2007. The Bonferonni and Šidák corrections for multiple comparisons. In: Salkind, N.J., ed. Encyclopedia of measurement and statistics. Thousand Oaks, CA: Sage. 1416 p.
Anderson, T.W.; Darling, D.A. 1952. Asymptotic theory of certain “goodness of fit” criteria based on stochastic processes. Annals of Mathematical Statistics. 23: 193-212.
Cook, D.R.; Weisberg, S. 1982. Residuals and influence in regression. New York, NY: Chapman and Hall. 240 p.
Dobie, J.; Wright, D. 1975. Conversion factors for the forest products industry in Western Canada. Inf. Rep. VP-X-97. Gatineau, QC: Environment Canada, Forestry Directorate, Western Forest Products Laboratory.
Harkin, J.M.; Rowe, J.W. 1971. Bark and its possible uses. Res. Note FPL-091. Madison, WI: U.S. Department of Agriculture, Forest Service, Forest Products Laboratory. 56 p.
Haygreen, J.G.; Bowyer, J.L. 1996. Forest products and wood science. 3rd ed. Ames, IA: Iowa State University Press. 484 p.
Martin, A.J. 1984. Testing volume equation accuracy with water displacement techniques. Forest Science. 30(1): 41-50.
Mason, T.E.; Hazard, C.T. 1947. Brief analytic geometry. 2nd ed. Boston, MA: Ginn and Company Publishers. 228 p.
Page, J. 2009. Heron’s formula for the area of a triangle. Available at www.mathopenref.com/heronsformula.html. (Accessed April 1, 2013).
Thomas, L.; Thomas, E. 2011. A graphical automated detection system to locate external hardwood log surface defects using high resolution 3-D laser scan data. In: Fei, S.; Lhotka, J.M.; Stringer, J.W.; Gottschalk, K.W.; Miller, G.W., eds. Proceedings, 17th Central Hardwood Forest conference. Gen. Tech. Rep. P-78. Newtown Square, PA: U.S. Department of Agriculture, Forest Service, Northern Research Station: 92-101.
Thomas, R.E. 2008. Predicting internal yellow-poplar log defect features using surface indicators. Wood and Fiber Science. 40(1): 14-22.
Thomas, R.E. 2009. Modeling the relationships among internal defect features and external Applachian hardwood log defect indicators. Silva Fennica. 43(3): 447-456.
Thomas, R.E. 2012. Predicting internal white oak (Quercus alba) log defect features using surface defect indicator measurements. Forest Products Journal. 61(8): 656-663.
Wilcoxon, F. 1945. Individual comparisons by ranking methods. Biometrics Bulletin. 1(6): 80-83.