Embed Size (px)
Citation preview

Achieving and Sustaining Open Defecation Free
Communities: Learning from East Java
Nilanjana Mukherjee with
Amin Robiarto, Saputra, Effentrif, and Djoko Wartono
March 2012

2
By Nilanjana Mukherjee with Amin Robiarto, Saputra, Effentrif, and Djoko Wartono
Today, 2.6 billion people live without access to improved sanitation. Of these, 75 percent live in
rural communities. To address this challenge, WSP is working with governments and local
private sectors to build capacity and strengthen performance monitoring, policy, financing, and
other components needed to develop and institutionalize large scale, sustainable rural
sanitation programs. With a focus on building a rigorous evidence base to support replication,
WSP combines Community-Led Total Sanitation, behavior change communication, and
sanitation marketing to generate sanitation demand and strengthen the supply of sanitation
products and services, leading to improved health for people in rural areas. For more
information, please visit www.wsp.org/scalingupsanitation.
This research report is one in a series of knowledge products designed to showcase project
findings, assessments, and lessons learned through WSP’s Scaling Up Rural Sanitation
initiatives. This paper is conceived as a work in progress to encourage the exchange of ideas
about development issues. For more information please email Djoko Wartono at
[email protected] or visit www.wsp.org.
WSP is a multi-donor partnership created in 1978 and administered by the World Bank to support poor
people in obtaining affordable, safe, and sustainable access to water and sanitation services. WSP’s
donors include Australia, Austria, Canada, Denmark, Finland, France, the Bill & Melinda Gates
Foundation, Ireland, Luxembourg, Netherlands, Norway, Sweden, Switzerland, United Kingdom, United
States, and the World Bank.
WSP reports are published to communicate the results of WSP’s work to the development community.
Some sources cited may be informal documents that are not readily available.
The findings, interpretations, and conclusions expressed herein are entirely those of the author and
should not be attributed to the World Bank or its affiliated organizations, or to members of the Board of
Executive Directors of the World Bank or the governments they represent. The World Bank does not
guarantee the accuracy of the data included in this work. The map was produced by the Map Design Unit
of the World Bank. The boundaries, colors, denominations, and other information shown on any map in
this work do not imply any judgment on the part of the World Bank Group concerning the legal status of
any territory or the endorsement or acceptance of such boundaries.
The material in this publication is copyrighted. Requests for permission to reproduce portions of it
should be sent to [email protected]. WSP encourages the dissemination of its work and will normally
grant permission promptly. For more information, please visit www.wsp.org.
© 2012 Water and Sanitation Program

3
Contents
Acknowledgements .................................................................................................................................................................... 5
Abbreviations and Acronyms ............................................................................................................................................... 6
Executive Summary ................................................................................................................................................................... 8
I. Introduction… ................................................................................................................................................................... 17
II. Methodology ……………………………………………………………………………………………………………………….23
III. Similarities and Differences Between ODF and NOT ODF Communities ...................................... 28
IV. Understanding Open Defecators and Sharers ............................................................................................... 37
V. Access Gained and ODF: What is Achieved and Sustained? .................................................................. 50
VI. Factors Influencing Demand Generation and Sustainable Behavior Change………… ............. 57
VII. What People Have Invested in and Why .......................................................................................................... 78
VIII. Institutional Roles for Rural Sanitation Improvement .......................................................................... 97
VIII. Conclusions, Implications, and Recommendations ................................................................................ 109
References…………………………………………………………………………………………………………………………….…121
Annexes
Basic Concepts and Definitions……………122
Recommended Implementation Sequence in New Province or Small Country …… 107
Figures
1: Percentage of Triggered Communities Achieving ODF…….15 2: Total umber Persons Gaining Access to Improved Sanitation During Implementation in East Java… 16
3: Trend of ODF Achievement During TSSM Implementation in East Java… 16
4: Action Research Sites in 20 Districts in East Java….. 20
5: Sample Distribution by Community Category and Topography…26 6: Sample Distribution by Community Category and Soil Type……26 7: Sample Distribution by Community Category and Distance to Sanitation Supplies……27 8: Sample Distribution by Community Category and Proximity to Water Bodies………27 9: Percentage Increase in HH Access to Improved Sanitation in FourTypes of Communities in Twenty
Districts……38 10: Total Persons Who Gained Access to Improved Sanitation in Four Types of Communities in Twenty
Districts … 39 11: Process History Comparison (Triggering) ………43 12: Process History Comparison (Post Triggering)…… 45 13: What Helped Collective Behaviour Change—Villagers Opinions……..… 50 14: What Hindered Collective Behaviour Change—Villagers’ Opinions……..…… 52 15: Sanitation Ladder Derived from 574 Latrines Observed in 80 Communities... 58a 16: Sanitation Ladder of Facilities observed in 80 Communties, Pictorially………58b 17: Sanitation Solutions Typically Chosen by Communities to Become ODF……..62 18: Additional Facilities in 574 Latrines Observed in ODF and Not ODF Communities………..………..………..…………..………..………..…...........................................64
19: Sources of Information, Advice, and Services for Sanitation Improvements….65 20: TSSM Informed Choice Catalogue Options………..………..………..………………66
Tables 1: Extent of Open Defecation Practiced …………………………………………………… 29 2: Open Defecation Practice by Welfare Category………..………..………..……………30 3: Sites Used for Open Defecation as Reported by Open Defecators..………..………30

4
4: Observed Access to School Latrines………..………..………..…………..………..…..36 5: Handwashing Facilities in Schools ………..………..………..…………………………..36 6: Summary of Access Gained and Time Taken………..………..………..………………39 7: Time Taken from Triggering to Verification and ODF Declaration…………………..40 8: Time Taken from Triggering to Verification and ODF Declaration…………………..41 9: Tools Used for Triggering in the Four Types of Communities……………………….46 10: Use of CLTS Tools by Different Groups of Facilitators………………………………47 11: ODF and Not ODF Communities’ Social Mapping History…………………………..47 12: Not ODF Communities Lack Internal and External Monitoring……………………..48 13: Sanitation Subsidies Received and Behavior Change Outcomes………………….54 14: Summary of Progress after Triggering in 40 Not ODF Communities……………...55 15: Strategies Used to Overcome Obstacles to Progress………………………………..56 16: Sanitation Ladder Derived from 574 HH Latrines in 80 Communties………..………..………..………..……59 17: Why Poor/Rich/In-Between Households Chose Different Latrine Types………….60 18: Costs of Latrine Types Built after Triggering in ODF Communities……………….63 19: Current District Government Institutional Capacity and Incentives for Essential Components of Rural
Sanitation Program………..………..………..…………..………..………..73 20: Institutional Roles and Implications–Based on Action Research Findings………76 21: CLTS Process Quality Evaluation Checklist—Recommendation Based on Study Findings……...80 22: Example of Segmenting Populations for Behavior Change Communication……89

5
Acknowledgements
This action research grew out of discussions within WSP’s rural sanitation team on issues
related to scalability and sustainability of project outcomes. From the beginning, the research
received enthusiastic support and substantive guidance from Almud Weitz, WSP regional team
leader for East Asia and Pacific, and Eduardo Perez, WSP’s business area leader for Rural
Sanitation and Hygiene. Drawing from their extensive global experience and perspectives, both
Almud and Eddy contributed significantly to the development of the research concept,
methodology, and instruments, and to the analysis framework. Their peer review comments
and suggestions at each stage of the study and of the draft report went far beyond usual quality
assurance measures. The study and this report owes equally and immeasurably to them both.
The research team is deeply grateful to the members of the 80 communities in East Java who
shared their knowledge and experience, and gave freely of their time and energy to inform the
study, despite the fact that the data-gathering period coincided with Ramadan in Indonesia.
Pracihno Kurniawan, Ronie Prasetyo, Toni Fathoni, and Wida Indrayanti carried out fieldwork.
They also participated in data analysis.
Sincere thanks are due to the local government Health Department personnel from 20 districts
in East Java who facilitated fieldwork implementation and participated in workshops to
finalize draft findings and their institutional implications. The national government (Ministry
of Home Affairs) funded these workshops. We greatly appreciate the interest and continuing
support received for presentation and dissemination of the action research study findings at
the national level from Nugroho Tri Utomo, Director, Housing and Settlements, BAPPENAS
(Ministry of Planning), Wilfred H. Purba, Director, Environmental Health, Ministry of Health,
and Zainal Nampira, Chief of Sub Directorate Water and Sanitation, Ministry of Health,
Government of Indonesia.
Additional peer reviewers include Soma Ghosh Moulik (World Bank’s Water Anchor), and
Yolande Coombes (WSP). We are deeply indebted to them for their incisive comments and
questions, which added much needed balance, depth, and clarity to the presentation of
research results. Editorial and final presentation advice and assistance from Amy Grossman
and Keri Schreiner are gratefully acknowledged.

6
Abbreviations and Acronyms
BCC Behavior Change Communication
Bidan Desa Trained midwife, often resident in village
BPS Badan Pusat Statistik (Central Board of Statistics)
Bupati Regent, or district administrative head
Camat Sub-district administrative head
CLTS Community-Led Total Sanitation
Depkes or MOH Health Ministry
Desa Village
Dusun Sub-village or hamlet
HH(s) Household(s)
HWWS Handwashing with Soap
IE Impact Evaluation
JMP Joint Monitoring Program
Kabupaten District
Kecamatan Sub-disrict
Kepala Desa/Kades Village Chief
Kepala Dusun/adus Hamlet Chief
MOHA Ministry of Home Affairs
OD Open Defecation
ODF Open Defecation Free
OSS One Stop Shop model of service delivery
PKK Pembinaan Kesejahteraan Keluarga (Family Welfare Movement in
Indonesia, implemented by women volunteers from community to
national levels)
Puskesmas Community Health Center
Sanitarian Puskesmas staff, responsible for environmental sanitation activities

7
SToPS Sanitasi Total dan Pemasaran Sanitasi (Indonesian translation of
TSSM)
TSSM Total Sanitation and Sanitation Marketing (initial name of The Scaling
Up Rural Sanitation project)
UNICEF United Nations Children’s Fund
VIP Ventilated Improved Pit
WHO World Health Organization
WSP Water and Sanitation Program

8
Executive Summary
Scaling Up Rural Sanitation, an at-scale rural sanitation initiative, was implemented in East
Java province from 2007 to 2010 by the Government of Indonesia with technical assistance
from the Water and Sanitation Program. The aim was to learn how to accelerate population
access to improved sanitation sustainably, cost-effectively, and at scale.
As a part of the learning strategy, action research was conducted in August and September
2010 in communities that received CLTS1 triggering through the intervention to better
understand the triggering processes and their consequences from the perspective of the
people who had experienced them. Objectives of this research study were: a) to identify the
principal factors influencing the achievement and sustainability of collective behavior change
by communities to become open defecation free (ODF); b) to identify links between influencing
factors, in order to help prioritize actions in response by various sector stakeholders; and c)
based on the findings, recommend strategies to accelerate the achievement and ensure the
sustainability of ODF status by communities.
Twenty of East Java’s twenty-nine district governments chose to participate in the research.
Eighty communities from twenty districts were selected from the universe of all triggered
communities using a randomized approach. As the chart below shows, the communities were
grouped into four categories that were expected to represent a range of best to worst case
situations in terms of sanitation behavior change achieved. WSP’s field team used qualitative
and participatory research methods to consult members of the 80 communities.
COMMUNITY GROUPS AND HYPOTHESIS
QUICKLY ODF
20 communities
Self-declared ODF within two months
of CLTS triggering, even if verified at a
later date.
Communities would represent the best-
case scenario, whereby factors
influencing collective behavior change
positively could best be studied.
LATE ODF
20 communities
Self-declared ODF during 7-12 months
of triggering, even if verified at a later
date.
Communities would show factors that
tend to inhibit collective change and delay
ODF outcomes.
1 Community-Led Total Sanitation—an approach pioneered in Bangladesh by Kamal Kar working with the NGO Village
Education Resource Centre (VERC) in 1999–2000.

9
NOT ODF
(High coverage)
20 communities
Failed to become ODF even one year
after triggering, but have high
sanitation coverage, i.e., over 80
percent of households.
Communities would illustrate situations
where change starts but fails to proceed
to full ODF achievement.
NOT ODF
(Low coverage)
20 communities
Failed to become ODF even one year
after triggering, and have low
sanitation coverage, i.e., less than 50
percent of households.
Communities would show situations
where the collective change process fails
to take off.
Key Findings
1. QUICKLY ODF communities represent the most efficient model for scaling up
sustainably. Communities that achieved ODF status within two months of triggering achieved
markedly faster and higher access gains and remained ODF more often than communities that
took many months to achieve ODF status.
Progress monitoring systems and records in 80 communities showed that QUICKLY ODF
communities also bested all other categories at behavior monitoring, detecting, and
sanctioning violators of community commitment to stop open defecation. The sanitation
facilities built for becoming QUICKLY ODF satisfied the requirements of “improved sanitation”
by JMP definitions, but were of lower cost and quality than in LATE ODF and NOT ODF
communities (as observed in 574 homes in 80 communities).
Ninety-five percent of the QUICKLY ODF communities had sustained their behavior change 4-
28 months after ODF declaration, as evidenced from environmental observation, latrine
ownership records, reported usage, and observation of maintenance of facilities.
2. ODF outcomes that materialize after many months should be subject to periodic re-
checks. Only 80 percent LATE ODF communities reported remaining ODF. Because sanctions
against open defecation (particularly defecation into rivers) were rarely enforced, the actual
percentage that remains ODF could be even lower. Possibly, 20 percent of the LATE ODF
communities had never really achieved ODF status, although 100 percent households had
gained access to improved sanitation. LATE ODF communities had focused on monitoring
latrine ownership rather than on behavior change to eliminate open defecation.
3. Implementing agencies can effectively influence most factors associated with
achievement and sustainability of ODF outcomes for scaling up rural sanitation. While a
number of factors can be associated with ODF outcome achievement and sustainability, no
single factor of those listed in the charts below guaranteed ODF achievement. It is not possible
to rank them in terms of importance, although some are associated and reinforce each other.
QUICKLY ODF communities displayed the characteristics listed in the “Factors Working in

10
Favor” column. Both charts group factors associated with ODF achievement and sustainability
in the last column. Factors associated with poor ODF achievement and low sustainability of
ODF outcomes are summarized in the “Factors Working Against” columns.
While local governments cannot control some of these factors, such as high social capital in a
village (factor #1), they can directly influence a number of others—from triggering in response
of demand to access to information about affordable latrines—and support factors such as
access at easier payment terms and regular community monitoring, to cumulatively enhance
ODF outcomes.
FACTORS SUPPORTING OR WORKING AGAINST ODF ACHIEVEMENT
FACTORS SUPPORTING OR WORKING AGAINST SUSTAINABILITY OF ODF OUTCOMES

11
4. ODF and NOT ODF communities were significantly different in terms of proximity to
water bodies. They were not significantly different in terms of topography (hills, plains,
coastal regions), soil types (sandy, rocky, swampy), or proximity to forests and access to
markets for sanitation supplies. Nor were notable differences found in terms of exposure to
behavior change communication messages, which were reportedly seen or heard in less than
10 percent of all communities. ODF and NOT ODF communities were, however, significantly
different in terms of proximity to water bodies. In all 20 districts, riverbank, beach, or
lakeshore communities had the lowest sanitation access rates and were significantly less likely
to achieve ODF status. This could be due to a strong preference for defecation into water
bodies; a practice recalled in focus group sessions as “clean, hygienic, pleasant, convenient, free
of cost” and one that has been a socially accepted tradition for many generations “without
problems.” Even latrine owners defecate into water bodies from time to time. Comments
captured in focus group sessions included: “Shit is not something to be kept in or near home. The
river takes it away; We enjoy defecating in running water. It is also convenient, and free of cost;
As long as rivers flow, why spend money and time to build latrines?”
5. Open defecator households in rural East Java have the ability and opportunities, but
often lack the motivation to acquire and use latrines. Open defecator and sharer
households in all NOT ODF communities reported having easy access to markets for sanitation
products and services. They also commonly owned permanent or semi-permanent homes,
color television sets, either bicycles or motorbikes, and (more recently) cell phones. Some of
these assets, costing much more than basic models of improved latrines, were acquired
through installment credit or deferred payment arrangements matched with seasonal
surpluses in income.
In ODF communities, the poorest had invested up to Rp. 300,000 (US$33) in building their
starter-level permanent latrine, and Rp. 750,000 (US$82) for pour-flush systems offered on
installment credit. Thus, improved sanitation facilities do not appear to be beyond the means
of the rural poor in East Java. If sanitation improvement can be made into a higher household
priority and offered on easier payment terms, open defecator and sharer households have the
economic ability to acquire it in the same way.

12
6. Externally provided subsidies were associated with lack of ODF outcomes but
community-provided subsidies were instrumental in ODF achievement. Despite the
Health Ministry’s 2008 STBM2 strategy banning them, subsidies for household sanitation are
still being provided in almost all districts by local government programs and national projects
for poverty alleviation, and the private sector’s corporate social responsibility funds. In
communities where a few households had received subsidy packages, collective action to
become ODF was reportedly hampered by the expectations raised among the rest of more such
packages becoming available. External subsidies were never available for all households that
might have warranted them, and thus had a socially divisive effect. All communities in the
sample that had received external subsidy packages in any form, during or before the project
period, did not become ODF, and were, in fact, still not ODF at the time of observation.
In contrast, community leaders’ initiatives to enable all households to acquire the means to
stop open defecation directly contributed to ODF outcomes. Examples include providing
durable pit covers or low-cost latrine pans or cement from village development funds to those
lacking latrines, or mutual self-help (gotong royong) drives to build latrines for all. The
internally provided subsidies were precisely targeted, covered all whose behaviors needed to
change, and were provided as a social solidarity measure to achieve a collective goal. The
receivers reported that they felt accountable to their larger community for making the
behavior change desired of them.
7. When CLTS ignited demand for improved sanitation in study communities, local
markets failed to meet expectations of poor consumers. A smell-free and easy to clean
pour-flush water seal latrine with ceramic pan is what the poor consumers said they really
want, but found unaffordable as it costs upwards of Rp. 1 million (US$108). They were able to
invest up to Rp. 300,000 (US$38) on a starter-level improved latrine, the dry pit cemplung,
which was highly affordable but smelly and not desirable. Dry pit owners saw them as
temporary measures not worth sustaining over the long-term. Many non-owners of latrines
reported putting off constructing a latrine (and continuing with open defecation presumably)
until they can afford the desired type.
In only nine percent of the sample communities, the desired model was found to cost much
less, around Rp. 750,000 (US$82), where project-trained masons had offered several reduced-
cost options of the facility and also offered installment payment options. All poor customers in
those communities had gone directly for pour-flush systems as their starter models and
entrepreneurs offering such options were overwhelmed with orders. In the remaining 91
percent communities no one had seen the Informed Choice Catalogue of low-cost options
2 Sanitasi Total Berbasis Masyarakat or the Community-Based Total Sanitation Strategy, launched as a ministerial decree
in August 2008.

13
developed by the project. Locally resident masons in the communities, who were the principal
source of information to consumers, had generally missed out on project-provided training on
lower-cost sanitation options and were not promoting them.
These anomalies arose out of the long delay in delivering the sanitation marketing component
of the project implementation. Sanitation market research results were unavailable until two
years into project implementation. The marketing strategy was developed by early 2009 and
local supply capacity improvement interventions began only by mid-2009, whereas demand
creation through CLTS had been ongoing since November 2007. Findings from this study
suggest that reversing the sequence, (that is, first understanding both consumer preferences
and the supply capacity of local markets using market research, secondly developing pro-poor
marketing strategies in response, and then using CLTS and behavior change communication
(BCC) interventions to generate demand while simultaneously helping local supply capacity to
grow), might better accelerate sustainable behavior change. Doing this would enable both poor
and non-poor consumers to invest in what they really desire, at prices they can afford, and
make better-informed choices for sanitation improvement. All three factors are likely to
produce more sustainable outcomes.
Implications for Programming to Scale Up
Based on the action research findings, the following insights are offered for the consideration
of policymakers, implementers, and rural sanitation program financiers seeking to scale up the
achievement of “sustainably ODF” communities.
1. To provide the basis for planning effective behavior change interventions at scale, it
is worth investing into market research before starting demand generation. It could
be more productive to schedule CLTS triggering after provincial3 market research results
are used to:
Identify a pro-poor marketing strategy for the province, namely: product and
price options based on poor consumers’ preferences, and ways of promoting
and delivering those options on demand.
Identify gaps between what poor consumers want and what local markets are
providing, to improve local supply capacity simultaneously with demand
creation.
Sharpen the focus of demand generation strategies (CLTS and BCC) with
reliable information about the target population’s motivations abilities and
opportunities to improve them.
3 Province-level market research and strategy in Indonesia; may be applicable for country-level research in smaller
countries.

14
2. Districts hoping to scale up sanitation access sustainably need a ‘subsidy funds
management strategy’ that prevents subsidies from hampering the growth of
both consumer demand and local supply capacity. Unregulated and practically
untargeted inflows of funds for sanitation subsidies to households from several public
and private sector sources were observed in many study communities. These
constitute a serious threat to the effectiveness of the new rural sanitation approaches.
Political leaders such as Bupatis (Head of district) and district legislators have the
power to regulate the use of all local funds. Evidence-based advocacy with them can
lead to a district subsidy funds management strategy supportive of, or at least not
detrimental to, approaches to achieve collective community sanitation and hygiene
behavior outcomes.
3. For cost-efficient scaling up, districts need to plan rural sanitation interventions
by zoning, clustering, and phasing communities in response to specific
conditions. The study found evidence that CLTS triggering, follow-up support, and
monitoring strategies need to be adjusted to both specific locations and conditions that
affect open defecation practices and to the factors that motivate people to continue
such practices, such as: riverbank and beach communities; swamp regions with high
water tables, little dry land and transportation problems; or water scarce regions.
Using these criteria to plan interventions by segmenting, zoning, and phasing sub-
districts or clusters of villages, would make for more cost-efficient logistics for demand
creation, follow up, monitoring, and supply improvement facilitation.
4. CLTS interventions can be provided in response to expressed demand from
village leadership, to improve community response to triggering. The study
identified demand-responsive CLTS triggering as a key to success. Focus groups in ODF
villages emphasized that community leaders who want their villages to become ODF
tend to mobilize all community sub-groups to participate in triggering, reinforce the
triggering effects through community institutions and events thereafter, and monitor
progress effectively. In the post-triggering period, they also ensured that all households
changed their OD practices and did not slip back into them. On the other hand,
uninterested and uninvolved village leaders were found mostly in the NOT ODF
communities. It is therefore recommended that:
Sub-district government functionaries utilize available institutional
mechanisms for generating a competitive spirit among village leaders and raise
demand from them for interventions to help make their villages sustainably
ODF.
Triggering interventions be made conditional to formally expressed demand
from village leaders.
Sub-district offices or Puskemas (community health centers) draw up annual
plans and budgets for triggering and follow-up by aggregating the expressed
demand.
5. Improve triggering outcomes at scale based on study findings about what helped
and what hindered collective behavior change.
CLTS facilitators’ training currently provided can be improved in the following ways:

15
Review training being provided by various government agencies and NGOs
and establish quality standards for training delivery.
Emphasize in both operation manuals and training guidelines the need to
de-link CLTS triggering from advice/information about latrine construction,
and make triggering fully gender and socially inclusive.
Sensitize facilitators to the need to adjust triggering and follow-up
strategies to community characteristics that determine people’s ability and
motivations to change behavior. Market research findings on open
defecators’ and sharers’ motivations, abilities, and opportunities to change
behavior should be discussed in CLTS facilitators’ training.
Include information on ways to encourage reliable progress monitoring by
communities and clarify an adequately structured post-triggering follow-up
process within the training.
Advise local governments to allocate annual budgets for learning exchange
events and refresher training of CLTS facilitators with the goal of continuing
to improve triggering, follow-up, and monitoring processes.
Post-triggering follow-up can be improved in the following ways:
Post-triggering processes should be given a verifiable structure by
establishing and periodically checking for desired progress quality
indicators/milestones4 for success in triggered communities in order to
improve institutional accountability for and the quality of follow-up.
Institutional adoption of a structured follow-up process also makes it more
likely to be adequately funded.
District governments should reward facilitators for ODF outcomes in order
to incentivize the quality of triggering and follow-up. This reward could be
linked with independent ODF verification systems.
Periodically check whether ODF status is sustained in already verified ODF
communities through the use of established institutional monitoring
systems. The results should lead to sanctions like withdrawal of ODF status
when communities fail to keep up ODF conditions.
6. Open defecators and sharers can be targeted for behavior change more
effectively by segmenting them. Open defecators and sharers in twenty districts
reported no major constraints in terms of their ability and opportunities to change
their defecation practices. However, motivations to change behavior were weak, and
open defecators and sharers had different motivations for continuing their existing
practice. Open defecators into water bodies were generally happy with their practice,
whereas sharers were frequently embarrassed and unsatisfied about sharing,5 but
4 A sample Process Quality Indicators Checklist is included in Chapter 8.
5 TSSM Market Research in East Java (Nielsen 2009) reported a similar conclusion among a section of sharers.

16
continued sharing because they lack awareness of affordable options or land to build
their own facilities. In the post-triggering phase, behavior change communications to
open defecators and sharers could be more effective if messages targeted them
differently by segmenting them according to their underlying motivations for
continuing the current practice.

17
I. Introduction
What does it take to bring about sustainable sanitation behavior change cost-effectively
and at scale?
The search for answers to this question has intensified in the rural sanitation sector in
Indonesia, where access to improved sanitation has grown much too slowly from 22 percent in
1990 to just 36 percent in 2008,6 and the Millennium Development Goal target for rural
sanitation seems well beyond reach. Meanwhile economic losses from poor sanitation and
hygiene are costing Indonesia US$6.3 billion or 2.3 percent of its GDP per year.7
WSP’s Scaling Up Rural Sanitation initiative, a learning-by-doing initiative implemented in
partnership with local and national governments in Indonesia, India, and Tanzania,8 sought
answers by working at scale from the beginning and by testing a combination of two relatively
new and promising approaches. The project combined three components: Community-Led
Total Sanitation (CLTS) and sanitation marketing (SM) to generate demand and increase
supply of sanitation goods and services, and efforts to strengthen the enabling environment
(EE) so that demand and supply improvements could grow and sustain each other with
supportive—and ultimately institutionalized and sustained—policies and practices. The
project target was to increase access to basic sanitation for a total of 4.46 million people in four
years. In 2011, building on this work, WSP recognized rural sanitation and hygiene as a core
business area and is engaging governments in an additional 14 countries to build on lessons
learned.9
Scaling Up Rural Sanitation (initially known as the Total Sanitation and Sanitation Marketing,
or TSSM, project) was launched in the East Java province of Indonesia in January 2007. At
project inception, East Java was home to 20 percent of the country’s poor and had a total
population of 37.4 million of whom 32.35 million lived in rural areas. By early 2010, the fourth
and final year of project implementation in East Java, with nearly 2000 communities triggered
using the CLTS approach, over 700,000 people had gained access to improved sanitation and
35 percent of all triggered communities had become Open Defecation Free (ODF). But the
percentage becoming ODF in different districts varied widely between 10-95 percent, raising
policymakers’ concerns about scaling up, and the urgency to better understand what
6 WHO-UNICEF. 2010. Progress on Sanitation and Drinking Water: 2010 Update, available at www.wsssinfo.org
7 Water and Sanitation Program2008. Economic Impacts of Sanitation in Indonesia: A Five country study under the
Economics of Sanitation Initiative (ESI), Research Report.
8 For more information see www.wsp.org/scalingupsanitation
9 For more information, see www.wsp.org/scalingupsanitation

18
influenced triggered-to-ODF conversion rates, as well as what sustained ODF outcomes, once
achieved. The present action research study was carried out in response.
1.1 Study Objectives
During the last year of project implementation in Indonesia, WSP offered all districts a
research opportunity to learn from communities how they had experienced project
implementation, so that conclusions could be drawn about how triggered communities could
both become open defecation free (ODF) faster and sustain their status, and how overall
implementation effectiveness could be improved. Twenty districts chose to participate in the
Action Research Study designed and carried out by the project during August and September
2010. The study covered 80 communities selected using stratified sampling from four
categories of CLTS- triggered communities, specifically: a) QUICKLY ODF; b) LATE ODF; c) NOT
ODF but having high sanitation coverage; and d) NOT ODF and having low coverage.
Specific objectives were:
1. To identify the principal factors influencing the achievement and sustainability of
collective behavior change by communities to become ODF.
2. To identify links between influencing factors, in order to help prioritize actions in
response by various sector stakeholders.
3. Based on the findings, recommend strategies to accelerate the achievement and ensure
the sustainability of ODF status by communities.
1.2 Project Background in Indonesia and Study Rationale
Indonesia is highly decentralized and district local governments are fully responsible for
planning, funding and implementing their development agendas, including that for rural
sanitation. Sector policies and strategies are designed at the national level, albeit with
extensive sub-national level consultations. Their implementation depends on the extent to
which local governments buy into and fund operations. This reality influenced WSP’s strategies
for project implementation and institutionalization of innovations. The project was introduced
using a demand-driven strategy. To increase buy-in and the adoption of approaches that would
be institutionalized—and funded—after the project ended, district governments were asked to
make a formal request to participate and to pledge co-funding and manpower commitments.
Project implementation started in November 2007. By February 2010, 3043 communities had
been triggered using CLTS approaches.10 Of these, only 1290, or about one-third, had become
10 Community-Led Total Sanitation (CLTS) uses a participatory analysis and action process to trigger community-wide
commitment to end open defecation. Triggered communities make action plans about how they will change sanitation
behavior and by when. In the Scaling Up Rural Sanitation project in Indonesia, in order to achieve open defecation free
(ODF) status, all households must have access to and be using improved sanitation facilities for all human excreta disposal.
When communities succeed and the claim of success is verified, they are declared open defecation free (ODF). However, in

19
ODF. Analysis showed that the conversion rate of triggered communities becoming ODF ranged
from 10 to 95 percent in different districts, averaging 45 percent across all (see Figure 1).
FIGURE 1: PERCENTAGE OF TRIGGERED COMMUNITIES ACHIEVING ODF
Source: TSSM Monitoring Information System
Further, access gains and ODF conversion rates tended to fluctuate annually, with the pace
decreasing from December to May, early in the annual budget cycle, and increasing 3-4 months
later, as newly triggered communities begin to reach ODF status (see Figures 2 and 3).
FIGURE 2: NUMBER OF PERSONS GAINING ACCESS TO IMPROVED SANITATION DURING
TSSM IMPLEMENTATION IN EAST JAVA (CUMULATIVE)
some communities, action plans are not always fully realized, as the process is open to various internal and extraneous
influences.
0
50
100
150
200
250
300
350
400
Paci
tan
Tren
ggal
ek
Tulu
ngag
ung
Kedi
ri
Lum
ajan
g
Pasu
ruan
Nga
njuk
Bang
kala
n
Pam
ekas
an
Sum
enep
Pono
rogo
Blita
r
Jem
ber
Bany
uwan
gi
Bond
owos
o
Situ
bond
o
Prob
olin
ggo
Jom
bang
Mad
iun
Nga
wi
Tuba
n
Mal
ang
Sido
arjo
Moj
oker
to
Mag
etan
Bojo
nego
ro
Lam
onga
n
Gre
sik
Sam
pang
Phase-1 Phase-2 Phase-3
No. of dusuns
TSSM Project in all 29 districts of East Java3228 Communities triggered, 1469 Communities ODF
Over 900,000 gained access to improved sanitation Progress during Nov. 2007 – Sep. 2010
.
On-going triggered communities Number of ODF communities
Rata rata 48% ODF 20% ODF 38% ODF

20
Source: TSSM Monitoring Information System
FIGURE 3: TREND OF ODF ACHIEVEMENT DURING TSSM IMPLEMENTATION IN EAST
JAVA
Source: TSSM Monitoring Information System
Improving CLTS to ODF Conversion Rates. To achieve efficiency in scaled up sanitation
programs, program financiers (donors, national and local governments, elected legislators)
need to understand why the CLTS triggering-ODF conversion rate is low, and what strategies
can be adopted by social intermediary agencies (local governments, NGOs, etc.) to make this
conversion both more efficient at scale and sustainable.
0
100,000
200,000
300,000
400,000
500,000
600,000
700,000
800,000
900,000
1,000,000
Jun/08 Dec/08 Jun/09 Dec/09 Jun/10 Dec/10
No
. of
pe
rso
ns
-
200
400
600
800
1,000
1,200
1,400
1,600
Jun/08 Dec/08 Jun/09 Dec/09 Jun/10 Dec/10
No
. of
com
mu
nit
ies

21
Understanding Health Impacts. When a community fails to reach ODF status there may yet
be significant changes among segments of the population that have gained access to improved
sanitation. It is not yet known what impact this has on health,11 whether improved sanitation
access must be 100 percent to reach evident health improvements, or whether 80 to 90
percent access might reduce the incidence and prevalence of diarrhea.12 In project areas, the
reported incidence of childhood diarrhea fell markedly in communities declared ODF.13 This
sparked extensive interest among stakeholders to identify what can help increase the
proportion of triggered communities that become ODF.
Reaching ODF. Project monitoring data analysis shows that as much as 80 percent of the total
gain in access to improved sanitation happened in communities that became ODF. It is
important to understand the processes and conditions associated with those communities to
scale up and replicate cost-effectively.
Understanding Follow-Up Requirements and Sustainability. CLTS is not entirely new to
Indonesia, having been introduced in several provinces through two large-scale rural water
and sanitation projects. However, the way CLTS was implemented through these projects led
to the perception that CLTS was a “triggering activity.” As a result, many triggered
communities received no further follow up and sanitation programs did not budget for post-
triggering support; further, there were no clear guidelines to support cost-effective follow-up
at scale.
Studies in countries where CLTS had been implemented 8 to 10 years ago found that 10 to 30
percent of households slip back to or continue open defecation in communities previously
declared ODF.14 Reasons reported for backtracking have been as varied as annual flooding of
living environments, disputes between households sharing latrines, latrines being unavailable
at worksites and children’s fear of falling through the hole. It is clear that scaling up sanitation
requires programs with built-in incentives and checks to support sustainable behavior change.
This study sought to identify relevant and feasible checks and incentives and identify what
follow up strategies will maximize desired outcomes.
11 WSP is conducting an independent impact evaluation study in each country to measure health impacts from the
interventions.
12 In other public health interventions, such as vaccination or bed-net programs for malaria, health benefits have been noted
at coverage rates of about 80 percent because that was enough to lower the incidence and prevalence of the disease.
13 As noted in Puskesmas (sub-district level Community Health Center) records.
14 Howes and Huda, 2009; Hanchette, et al, 2011

22
How to Sustain Behavior Change. Kamal Kar and Robert Chambers classify individual
communities as “matchbox in a gas station” (fully ignited into action), “promising flames”
(about to ignite), “scattered sparks” (ignition not yet widespread in the community, but
potential is evident) and "damp matchbox" (communities resistant to igniting). They assert
that ineffective triggering is the result of poor CLTS facilitation, which they link to poor
training of CLTS trainers.15 A rapid assessment of the Total Sanitation Campaign in India
conducted by WSP found a strong positive correlation between program processes and desired
outcomes, including processes for catalyzing behavior change.16 A WSP study in Bangladesh on
the sustainability of CLTS outcomes concluded that behavior change at scale was sustained by
a shift in social norms away from open defecation, and that sustained latrine usage and
ownership were associated with market availability of goods and services, and continued
government programs for sanitation promotion.17
There has not yet been systematic investigation from the triggered community’s point of view
of all possible influencing factors such as: availability of community incentives or rewards for
ODF achievement; availability of affordable sanitation products and services that meet
consumer preferences; availability of access to credit for households; and level of poverty of
the households. Additional factors could be the capacity of the local government to facilitate
CLTS at scale and effectiveness of donors and national governments in providing capacity
building and related tools and resources. The relative importance of such factors needs to be
understood in order to prioritize and focus on key factors.
Increasing Supply and Demand. The project supplemented CLTS with behavior change
communications designed to help increase demand for improved sanitation in villages that
have been ignited. The project also built the capacity and motivation of local sanitation service
providers to offer a wider range of low-cost sanitation options, tapping latent demand among
poorer segments of rural consumers. Feedback from consumers is needed to understand how
the combination of approaches reach them and what can be done or sequenced better or
differently, so as to provide information about available options and to motivate and support
behavior change.
These questions suggested an opportunity for additional research. Following consultation with
government stakeholders WSP designed an action research, or participatory, study to learn
from communities how they had experienced project implementation in an effort to better
understand (1) how triggered communities could become open defecation free (ODF) faster
and sustain their status; and (2) how overall implementation effectiveness could be improved.
15 Plan International and IDS, 2008
16 WSP and Government of India Ministry of Rural Development, 2011
17 Hanchette, et al, 2011

23
II. Methodology
The researchers worked with community members using an action research approach to
analyze outcomes of project interventions and what influenced them. Information gathered
was discussed with the local government implementers and used to identify actions to make
the sanitation behavior change process more effective and efficient at scale. Information was
also aggregated and analyzed with district-level government agencies. This process was used
to build understanding in district health offices about participatory learning and sampling
methodologies, how to investigate program effectiveness, and how to draw implications for
follow up action based on research findings. Research was conducted during August and
September 2010.
2.1 Sampling Procedure and Sample Size
District participation in this study was based on demand. All 29 districts in East Java were
invited and 20 chose to participate (see Figure 4). The districts were evenly distributed across
all three phases18 of project implementation, with seven districts each from the first and third
phases, and six districts from the second phase. A total of 80 communities were randomly
selected from four sub-categories to allow further investigation of factors influencing a wide
range of outcomes: Sample categories reflected the range of outcomes to be studied in terms of
the ODF status of communities. The project had introduced ODF verification procedures in all
districts, with process guidelines based on those definitions. Different districts use the process
with varying levels of rigor. Twenty communities were selected from each of the four sample
categories, with the following assumptions:
QUICKLY ODF: self-declared ODF within two months, even if verified at a later
date. These communities would represent the best-case scenario, whereby factors
influencing collective behavior change positively could best be studied;
LATE ODF: Self-declared ODF within seven to 12 months of triggering. These
communities would reveal factors that tend to inhibit collective change and delay
ODF outcomes;
NOT ODF (High): Failed to become ODF even 1 year after triggering, but
having High sanitation coverage, i.e., over 80 percent households. These
18 The project was implemented in East Java in three phases, with each phase lasting 8 to 9 months in a district.
Phase 1 covered 10 districts; phases 2 and 3 covered 11 and 8 districts, respectively. Phasing was done in response
to demand formally expressed by districts for participation in the project, and by their being ready with necessary
co-funding and manpower.

24
communities would illustrate situations in which change starts but fails to proceed
to full coverage and ODF achievement; and
NOT ODF (Low): Failed to become ODF even 1 year after triggering, and
having Low sanitation coverage, i.e., less than 50 percent households. These
communities would identify situations in which collective change processes fail to
take off.
Categorization of communities was done in keeping with the monitoring information available
at the district health office, and data accuracy verified through telephone calls to the relevant
puskesmas (sub-district health centers) where more detailed community data are kept. A final
check was made by the researchers during pre-investigation visits to selected communities to
verify that they fulfilled the stratification criteria.
In each district the universe comprised all communities triggered by the project or local
government and previous projects. They were first grouped into ODF and NOT ODF categories
by the district health office. Action researchers verified correct categorization and
completeness of the lists. Random selection of four study communities per district was done as
follows in district health offices.
Folded slips carrying single community names were placed in two bags labeled ODF and NOT
ODF. From each bag a slip was randomly picked, and the relevant Puskesmas or village leader
was telephoned to verify ODF status or lack thereof, and how long the community had taken to
become ODF. The procedure was repeated, until four communities were found to fit the four
sub-sample categories. Two districts did not have QUICKLY ODF communities. Two additional
communities were picked from neighboring districts, using the same procedure.
FIGURE 4: ACTION RESEARCH SITES IN 20 DISTRICTS IN EAST JAVA
25
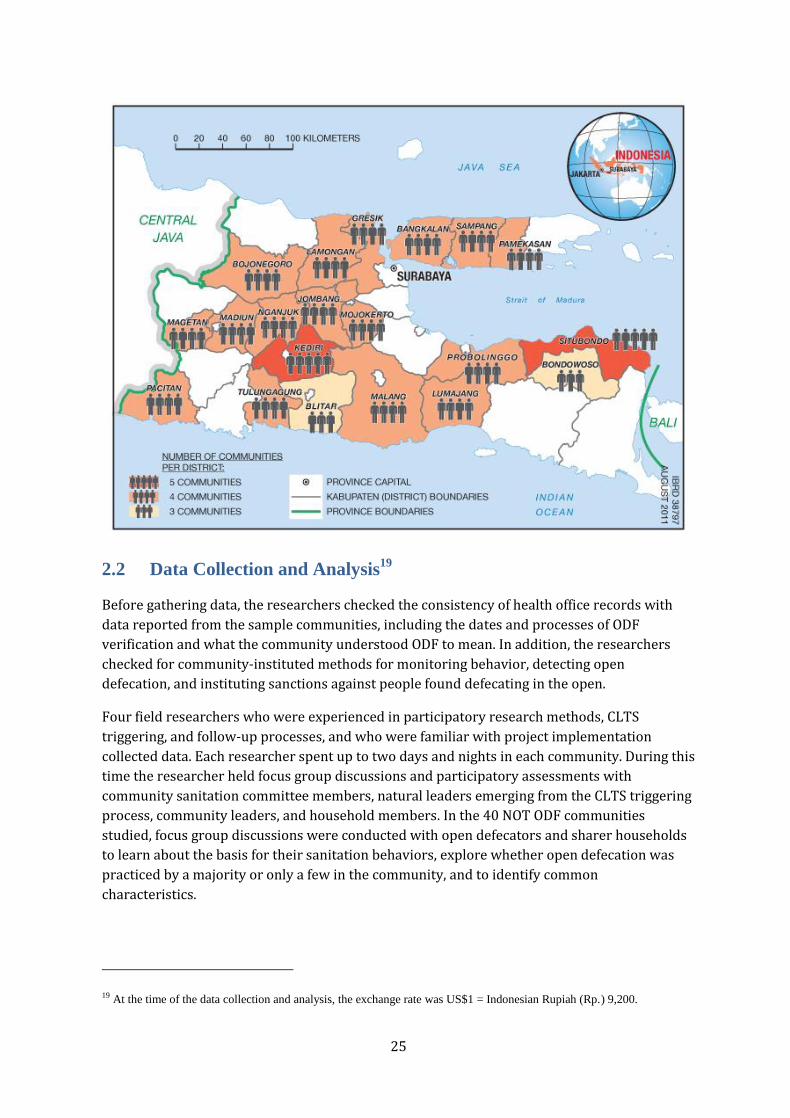
2.2 Data Collection and Analysis19
Before gathering data, the researchers checked the consistency of health office records with
data reported from the sample communities, including the dates and processes of ODF
verification and what the community understood ODF to mean. In addition, the researchers
checked for community-instituted methods for monitoring behavior, detecting open
defecation, and instituting sanctions against people found defecating in the open.
Four field researchers who were experienced in participatory research methods, CLTS
triggering, and follow-up processes, and who were familiar with project implementation
collected data. Each researcher spent up to two days and nights in each community. During this
time the researcher held focus group discussions and participatory assessments with
community sanitation committee members, natural leaders emerging from the CLTS triggering
process, community leaders, and household members. In the 40 NOT ODF communities
studied, focus group discussions were conducted with open defecators and sharer households
to learn about the basis for their sanitation behaviors, explore whether open defecation was
practiced by a majority or only a few in the community, and to identify common
characteristics.
19 At the time of the data collection and analysis, the exchange rate was US$1 = Indonesian Rupiah (Rp.) 9,200.

26
In addition, in each community, the researchers observed community monitoring tools being
used, sites previously used or still used for open defecation, environmental sanitation
conditions, and latrines constructed during project implementation in homes of poor, rich, and
in-between households. Community-provided information was triangulated with project
monitoring data, puskesmas staff involved in triggering CLTS and monitoring, and sanitation
suppliers and masons operating in the community.
WSP designed and provided tools, data recording formats, and training. The tools were pre-
tested in Gresik district and finalized in July 2010. Documentation of site reports in MS Access
facilitated content analysis of qualitative and quantitative data. Non-parametric statistical tests
were used where appropriate.
2.3 Study Limitations
The action research study was carried out in 20 districts of East Java. The findings may
not be fully applicable to other provinces of Indonesia for reasons of cultural,
demographic, and socio-economic diversities.
The sample of 80 communities does not claim to be completely representative of all
triggered communities, as they were selected from four purposively defined sub-
categories of triggered communities.
Each district contributed four communities representing the four types to the total
sample, but these communities do not represent district averages of any kind. Blitar
and Bondowoso districts did not have any communities in at least one of the categories.
Box 1: Data Collection Instruments
Focus group discussions with community men and women’s groups, including
Community Sanitation Committee members.
Focus group discussions with open defecator household members and sharer
household members.
Participatory analysis tools, including Tracing Timelines, Welfare Classification
(in communities which did not have welfare classes marked on their Social
Maps), transect walk and diagramming for fecal contamination routes (these
tools were integrated within the overall Focus Group Discussion Guide).
Observation of latrines in poor, rich, and in-between households in each
community.
Interviews with owners of the latrines in each home.
Demonstration of the Informed Choice Catalogue with open defecators and
sharers in NOT ODF communities.
Environmental observation with checklists.
Checking of community maps/records of monitoring sanitation access and
ownership of improved/unimproved latrines in all communities.

27
To fill the gaps, two more communities were selected from Kediri and Situbondo
districts which are contiguous to Blitar and Bodowoso respectively.
Quantitative data reported in the findings must be interpreted within the context of
methods used to collect the data.
Poverty indicators used in this study are not based on socio-economic surveys or
income quintiles. Community households are categorized as poor, rich, or in-between
based on Welfare Classification20 exercises with communities. This is a participatory
assessment tool that groups households in different well-being categories using the
community’s own criteria. It was introduced by the project in triggered communities
for the purpose of participatory progress monitoring.
20 This study uses economic categories of households (Poor, Rich, In-between) derived from Social Welfare Classification,
a participatory analysis tool whereby each community categorizes its households using locally applicable criteria.
Typically, such criteria include livelihoods, ownership of land and types of homes, livestock, means of transportation and
other assets, amount of schooling of household head, extent of indebtedness, aspirations, etc. The project introduced this
tool along with social mapping for community monitoring, and many communities already had households classified by
welfare categories at the time of the study. For a full description of the Welfare Classification Tool, see Mukherjee, N and.
van Wijk, C. 2003. Sustainability Planning and Monitoring in Community Water Supply and Sanitation: A Guide to the
Methodology for Participatory Assessment (MPA). WSP-IRC-World Bank.

28
III. Similarities and Differences Between ODF and NOT
ODF Communities
Key Findings
Similarities include:
Topography, soil type, proximity to forest
Preference for OD in forest/ravine/crop field/bamboo grove
Expectation of subsidy
Reported lack of money and manpower to build latrine
Local access to markets, building materials, and masons
Differences include:
Process history of triggering and post-triggering follow up
Extent of social capital
Strategies they used to address obstacles to progress towards ODF status
Monitoring methods
Proximity to flowing water: Communities located near flowing water bodies have the
lowest access to sanitation and are less likely to become ODF (significant at p = 0.05
level)
3.1 ODF and NOT ODF: Similarities and Differences
The ODF verification system introduced by the project in Indonesia is stringent by global
standards in that being certified as ODF requires all community households to own and use
improved sanitation facilities, unlike as reported in Bangladesh, Nepal and Nigeria.21
Research showed that people in both ODF and NOT ODF communities understand ODF to
mean: a) all community members defecate only into latrines; and b) all households own and
use improved sanitation facilities (jamban sehat) when “jamban sehat” meant latrines that
confine feces in ways that make them inaccessible to insect vectors and animals, prevent
contact between people and feces, do not pollute water bodies, and prevent foul smell.
Community members were clear that open pit latrines and hanging latrines over water should
not be classified as jamban sehat, and that the use of latrines that discharge feces directly into
water bodies is tantamount to open defecation—even if the latrine includes a ceramic or
concrete water closet.
21 WaterAid 2009; Kullmann and Ahmed et al. 2011

29
This study found that 38 out of the 40 sample communities classified as ODF (both QUICKLY
and LATE) fulfilled the requirement for 100 percent household ownership of latrines that
confine feces safely, although the quality of the facility varied greatly. The rich invariably had
pour flush systems with septic tanks or twin pits, while the poor had direct or offset pit latrines
with well-fitting lids. Those in between had a mix of improved dry or offset pit latrines with
cemented slabs or pour flush systems with a single leaching pit. Further details of latrine types
and costs are discussed in Chapter 7.
Two exceptions, Dusuns Proyek and Ledok, present situations that flag important questions
about post-ODF monitoring. In Proyek (see Box 2) the facility in question is ‘improved’ by JMP
technical standards, but is co-owned and shared by several households. How should the co-
owning user households be classified? Are they people “lacking access to improved
sanitation”? Are they open defecators? In Ledok (see Box 3) some ODF communities were
rendered NOT ODF over a period of time, not due to slippage in behavior, but because of lost or
damaged latrine pit covers which were not replaced.
Discussions with district health offices and puskesmas personnel clarified that “sharer”
households owning no facilities were initially mapped in the project monitoring system, but
were later coded as “open defecators” because project implementation had shown it was risky
for a community to declare ODF yet include a segment of the community sharing latrines.
Sharers do not consistently defecate in latrines. Continued open defecation is common among
sharers. Also, when there is institutional pressure to show more ODF results, communities
which are close to, but not ODF, may be declared ODF by simply designating the last remaining
households resisting change as “sharers.”
When the project started to raise the profile of sanitation issues in the province, several
Bupatis and Camats prioritized sanitation programs for attention due to the JPIP evaluation
including sanitation performance as a criterion.22 To extract political mileage and capture
media attention, political leaders sometimes set unrealistic target dates for their sub-districts
and districts to become ODF. The resulting pressure on implementing agencies can cause
misreporting and fudging of community monitoring data when actual achievements fall short
of targets.23 The “sharer” category initially provided the loophole through which this could be
done.
22 Jawa Pos Institut Pro-Otonomi (JPIP) is a part of East Java’s largest media network, Java Post. JPIP evaluates district
governance and awards the best-governed district every year. For the district leaders (Bupatis) and their next in command
at sub-district level (Camats), it is a coveted and prestigious award. Starting in 2009, JPIP has adopted sanitation program
performance as an indicator of district governance and uses the indicators introduced by the TSSM project to measure
performance.
23 This trend has been observed in other countries where ODF achievement is rewarded by the state. The annual Nirmal
Gram Puraskar scheme in India is grappling with very large scale verification challenges as tens of thousands of ODF
claims are submitted from many provinces every year and certified ODF communities are found to be so only on paper.

30
Box 2: Access Monitoring Needs to Differentiate Between Co-Owners Sharing Latrines
and Simply Usage Sharers
Researchers found that only 60 percent of households had improved sanitation facilities in
Dusun Proyek of village Sariwani , district Probolinggo, but it was recorded as ODF in the
district database. This was reported to the relevant puskesmas and district health office, and
further research raised a wider question relevant to JMP-compliant monitoring.
Proyek was verified on February 3, 2009. According to the community and puskesmas staff
that verified them, household ownership of improved sanitation was 20% at baseline. After
triggering it rapidly increased to 60%. Access to improved sanitation was considered to be
100% during verification because many of the new improved facilities were co-owned by two
or three households that had each invested in building them. Reasons for co-ownership were
attributed to shortage of land to build; sufficient social cohesion to make sustained sharing
feasible; and the appeal of pooling resources to acquire a facility that would have been
unaffordable for individual households.
The researchers found that the co-owners were sharing and maintaining their facilities
together satisfactorily. However, because the JMP definitions do not recognize shared facilities
as being “improved,” the project monitoring system recorded access to improved facilities only
for those households which housed the latrine, and not for those who jointly owned but did not
house it.
3.2 Soil Type, Access to Markets, Proximity to Water
Box 3: Cessation of External Monitoring After ODF Declaration Is Risky
Dusun Ledok in Grobogan village of Lumajang district is noted for extreme water-scarcity. At
the time of triggering, most households had open pit latrines. Ledok became ODF in
September 2008, one month after triggering. The community decided to cover the pits but,
because the community lacked access to water, pour-flush latrines were not an option.
Household contributions in cash and in kind and gotong royong organized at a local timber
merchants’ workshop led to all households being able to place wooden platforms and well-
fitting lids on latrine pits. Ledok reported a drop in diarrhea cases, from 11 cases in
September 2008 to six cases in September 2009 and one case in September 2010.
Two years after becoming ODF, nearly a fifth of the pit covers had been damaged or lost.
Obviously the community did not remain ODF. A visit conducted as part of the action
research sparked off plans by the village government to replace all missing and damaged
covers. Reportedly, it has been done.

31
Assumptions have often been made about inherent characteristics of communities as well as
external factors that influence the likelihood of achieving or failing to achieve ODF. The study
cross-tabulated sample communities by selected situational characteristics to reveal possible
correlations.
Research showed that ODF and NOT ODF communities were distributed similarly across
different topographical conditions and soil types and proximity to forests. Also, there were no
appreciable differences in terms of their proximity to markets for sanitation supplies and
service providers (Figures 5, 6, and 7).
Proximity to flowing water bodies, however, is a significant factor. The closer the community to
a river, canal or the sea, the less likely it is to become ODF. Figure 8 shows the sample
distribution of ODF and NOT ODF communities by distance from water bodies. Residing on a
riverbank or the beach, or within 100 meters of a riverbank or beach can be associated with
failure to reach ODF status. In other words, people living very close to water bodies tend to
continue to defecate in them. This association yielded a Chi–square value of 6.797, significant
p=0.05 (Figure 8).
Sixty percent of communities studied were crossed by a river, stream, or irrigation canal and
another 20 percent were within half a kilometer of these bodies or the sea. Ninety percent of
communities were within one to five kilometers of a market to access sanitation supplies and
service providers. Poor access to markets and supplies was not found to be a problem except in
two communities that were located in swamps and depended on boats as the only means of
transport.

32
FIGURE 5: SAMPLE DISTRIBUTION BY COMMUNITY CATEGORY AND TOPOGRAPHY
FIGURE 6: SAMPLE DISTRIBUTION BY COMMUNITY CATEGORY AND SOIL TYPE
0%
10%
20%
30%
40%
50%
60%
70%
80%
90%
100%
Hilly area plains Coastal area
Pe
rce
nta
ge
of
com
mu
nit
ies
QUICKLY ODF
LATE ODF
NOT ODF-High Cov.
NOT ODF - Low Cov.
0%
10%
20%
30%
40%
50%
60%
70%
80%
90%
100%
Nomal/sandy soil Rocky soil Swampy soil
Pe
rce
nta
ge
of
com
mu
nit
ies
QUICKLY ODF
LATE ODF
NOT ODF -High Cove.
NOT ODF -Low Cov.

33

34
FIGURE 7: SAMPLE DISTRIBUTION BY COMMUNITY CATEGORY AND DISTANCE TO
SANITATION SUPPLIES
FIGURE 8: SAMPLE DISTRIBUTION BY COMMUNITY CATEGORY AND PROXIMITY TO
WATER BODIES*
*Chi-square value = 6.797, df =2, Significant at .05 level. Communities close to water bodies significantly less likely to become ODF.
0%
10%
20%
30%
40%
50%
60%
70%
80%
90%
100%
Market/vendor < 1 km.away
Market/vendor 1- 5 Km.away
Market/vendor >5 Km.away
Pe
rce
nta
ge
of
com
mu
nit
ies
QUICKLY ODF
LATE ODF
NOT ODF -High Cov.
NOT ODF -Low Cov.
0%
10%
20%
30%
40%
50%
60%
70%
80%
90%
100%
On bank of river/canal, beach, or within 100
meters of it
100-500 meters from water bodies
More than 500 meters away from water bodies
Pe
rce
nta
ge
of
com
mu
nit
ies
ODF Not ODF

35
3.3 Social Capital
The highest levels of social capital among all categories characterized QUICKLY ODF
communities. They usually had enthusiastic and effective community leadership. They held the
concerned leaders in high regard and trusted and followed their directions. In several districts,
particularly those on Madura Island, when the religious leader exhorted communities to stop
open defecation, his word was given the highest priority, even above that of village chief. Men,
women, and youth in these communities already functioned in a variety of organized groups
formed for social, religious, or financial purposes. As a result they were easy to mobilize for
gotong royong (mutual self-help) movements, which is a well-known strategy of rural
communities in Java for accomplishing goals that bring common benefits for all.
In comparison, LATE ODF communities had lower levels of social capital and greater
expectations of receiving subsidized latrines. In LATE ODF communities, people responded
more slowly to calls for behavior change than their counterparts in QUICKLY ODF
communities. Those who lacked sanitation facilities aspired to higher quality, entry- level
latrines and took longer to gather resources to obtain them. After triggering and follow up
monitoring by village leaders, sanitation access grew gradually, at the convenience and
discretion of the latrine-less households rather than in the rapid campaign mode that
characterized progress in the QUICKLY ODF communities.
By their own admission, residents of many NOT ODF (both high and low coverage)
communities described themselves as difficult to mobilize and that gotong royong was
reportedly “difficult to organize for any purpose”. Village chiefs or dusun heads wielded less
influence over other residents in these communities. Reasons included lack of trust in corrupt
village and dusun chiefs and a newly elected village chief lacking support of hamlets other than
his own (Panbetes, Sampang; Modung Timur, Bangkalan).
Community leaders in Baduk (Kediri) and Karang Ayam Dusun 2 (Blitar) owned fish ponds
over which they had constructed hanging latrines in order to feed their fish. They did not want
people to stop defecating in their ponds. In other cases, community leaders were uninterested
either because poor CLTS processes had failed to “ignite” them, or they had no interest in
programs or projects that brought no subsidy packages (Nglawan/Jombang, Modung
Timur/Bangkalan, Tambaksari/Gresik, Turi Turi/Magetan, Glindah Lor/Gresik,
Banyumas/Pamekasan, and Wonosari/Mojokerto). In several of these communities defecating
in a neighbor’s latrine was also considered a taboo.
Apart from differences in selected physical features and inherent social characteristics, the
LATE ODF, QUIKLY ODF, and NOT ODF (both high and low coverage) communities also differed
greatly in terms of their triggering experiences and responses to triggering. These differences
are presented in Chapter 6.

36

37
IV. Understanding Open Defecators and Sharers
Key Findings
In general, East Java villagers have opportunities and the ability to change behavior (from
open defecation to building and using latrines), but the motivation to change is weak.
Open defecators and sharers are not differentiable in practice. Sharers continue to practice
open defecation from time to time.
Sharers and open defecators have different reasons for continuing with open defecation,
and require different strategies for behavior change.
4.1 Overview
In the 40 NOT ODF communities the researchers sought out open defecator and sharer
households and held separate focus group discussions with them, in order to understand the
basis for their sanitation behaviors. In approximately half the communities, social maps were
found showing households marked as Miskin/Tidak mampu (poor), Kaya/mampu/Sejahteraa
(rich), and Sedang (in-between/average/middle class). Project facilitators had introduced
welfare classification (see footnote in Chapter 2 for explanation) of community households as a
monitoring tool along with social mapping. In communities where the classification was not
available, the researchers facilitated a welfare classification exercise to identify socio-economic
categories characteristics of the open defecator and sharers.
Table 1 summarizes the extent of open defecation (OD) in the community as reported by the
open defecators. Table 2 shows the socio-economic classes of households that practice OD,
along with primary OD sites. Table 3 summarizes the site preferences for open defecation.
TABLE 1: EXTENT OF OPEN DEFECATION PRACTICED
Community Category Most/Many Households
Practice Open Defecation
Only a Few Households
Practice Open Defecation
NOT ODF—High coverage
(N=20)
14 communities 6 communities
NOT ODF—Low coverage
(N=20)
19 communities 1 community
Open defecation is widely practiced by the majority of households in NOT ODF communities
regardless of their sanitation coverage. Over 60 percent of sample communities were located

38
on the banks of rivers or small streams where most households defecate into the water
regularly, even when some households have latrines at home. Those living farther away from
water bodies go to open pits, bamboo and banana groves behind homes, or to ravines on the
village outskirts. Exceptions were in the two coastal fishing communities in which open
defecators went to mangroves. All households of the coastal Tabugah community in
Pamekasan district had contributed money and labor to build a raised walkway on stilts to
approach the mangroves and defecate in the water – rather than using the money to build
latrines.
TABLE 2: OPEN DEFECATION PRACTICE BY WELFARE CATEGORY
Community
Category
Welfare Categories of Majority of Open Defecators
NOT ODF—
High coverage
All (Rich, Middle and Poor)—2 communities (in swamp/ mangroves)
Middle and Poor—10 communities (in river/canal)
Middle—1 community (own fish pond)
Poor—7 communities (open pits/crop fields/forest)
NOT ODF—
Low coverage
All (Rich, Middle, Poor)—7 communities (river/canal /fish ponds)
Middle and Poor—9 communities (Swamp/ river )
Middle—1 community (own fish pond)
Poor—3 communities (open pits)
TABLE 3: SITES USED FOR OPEN DEFECATION AS REPORTED BY OPEN DEFECATORS
Who in the Community
Practices OD?
River/
Canal
Fish
Pond
Mangroves/
Swamp
Ravine/
Ditches
Bamboo Grove/
Open Pits/Crop
Field/Plantation/
Forest
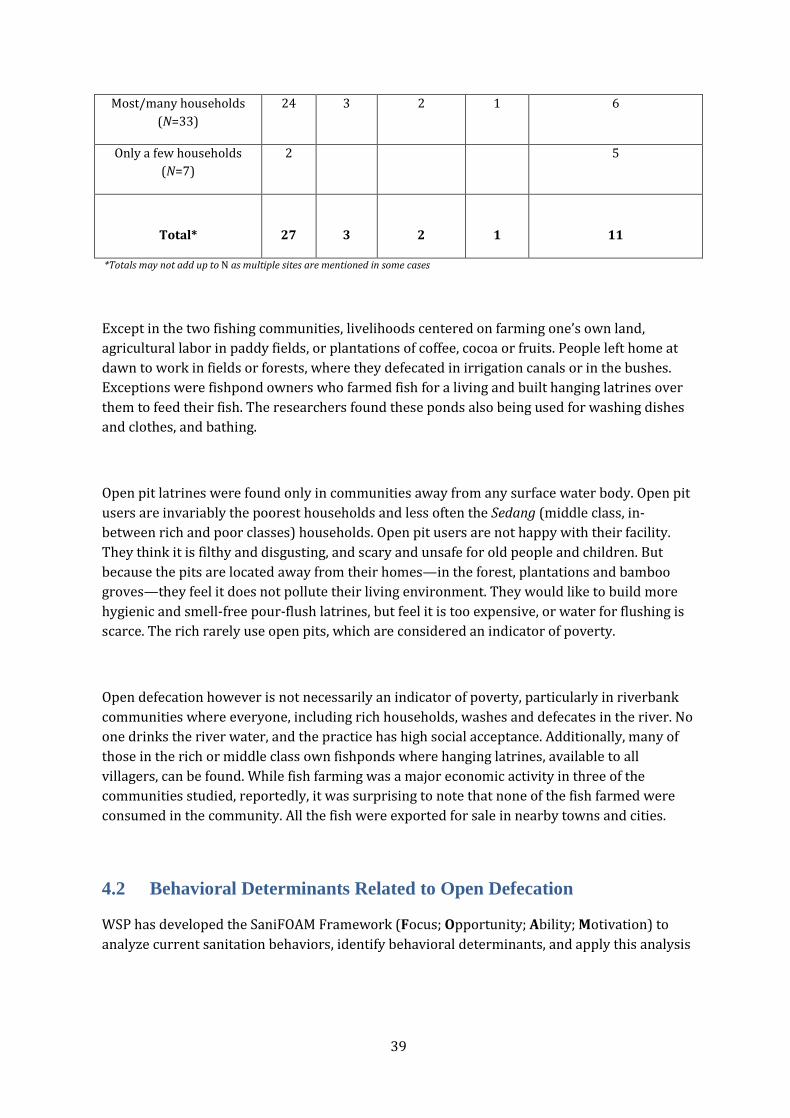
39
Most/many households
(N=33)
24 3 2 1 6
Only a few households
(N=7)
2 5
Total* 27 3 2 1 11
*Totals may not add up to N as multiple sites are mentioned in some cases
Except in the two fishing communities, livelihoods centered on farming one’s own land,
agricultural labor in paddy fields, or plantations of coffee, cocoa or fruits. People left home at
dawn to work in fields or forests, where they defecated in irrigation canals or in the bushes.
Exceptions were fishpond owners who farmed fish for a living and built hanging latrines over
them to feed their fish. The researchers found these ponds also being used for washing dishes
and clothes, and bathing.
Open pit latrines were found only in communities away from any surface water body. Open pit
users are invariably the poorest households and less often the Sedang (middle class, in-
between rich and poor classes) households. Open pit users are not happy with their facility.
They think it is filthy and disgusting, and scary and unsafe for old people and children. But
because the pits are located away from their homes—in the forest, plantations and bamboo
groves—they feel it does not pollute their living environment. They would like to build more
hygienic and smell-free pour-flush latrines, but feel it is too expensive, or water for flushing is
scarce. The rich rarely use open pits, which are considered an indicator of poverty.
Open defecation however is not necessarily an indicator of poverty, particularly in riverbank
communities where everyone, including rich households, washes and defecates in the river. No
one drinks the river water, and the practice has high social acceptance. Additionally, many of
those in the rich or middle class own fishponds where hanging latrines, available to all
villagers, can be found. While fish farming was a major economic activity in three of the
communities studied, reportedly, it was surprising to note that none of the fish farmed were
consumed in the community. All the fish were exported for sale in nearby towns and cities.
4.2 Behavioral Determinants Related to Open Defecation
WSP has developed the SaniFOAM Framework (Focus; Opportunity; Ability; Motivation) to
analyze current sanitation behaviors, identify behavioral determinants, and apply this analysis

40
to the design of behavior change communication campaigns.24 Researchers used this
framework to help identify the behavioral determinants that contribute to open defecation.
Sharers, who do not own latrines and use other people’s latrines, were separately consulted
about their reasons for continuing to share or wanting to change their
status.
Opportunity. Focus group participants in NOT ODF communities reported that supplies of
sanitation materials and skilled masons were easily available in rural East Java. However, a
majority of those surveyed reported that land to build upon and options for latrine types and
materials were limited.
In East Java, where communities are densely populated, it is not customary to build latrines
within homes. However, poor and middle-income classes often lack land outside the
dwelling unit on which to build a latrine. The local markets and service providers offered
only two standard designs for those who could afford to spend upwards of Rp.1,500,000
(US$163), reinforcing public impressions that sanitation facilities were unaffordable for the
poor. There were also no options for payment other than paying the entire cost in cash at
one time. Sanitation suppliers who offer more affordable design and material packages
along with easier payment options find it easy to capture the latent demand among the
untapped poorer segments of the market.
Ability. Reasons cited for not having a latrine and therefore continuing to defecate in the
open included lack of land (mentioned in two communities) and a lack of money (mentioned
in 12 communities). However, the same households reported owning assets, including:
Television (reported in 33 focus groups)
Motorbike (reported in 24 focus groups)
Permanent house with brickwork walls, masonry floors, and tiled roofs (reported by 21
focus groups, with another 13 mentioning semi-permanent houses)
Bicycle (reported in 15 focus groups)
1-3 heads of livestock (reported in 12 focus groups)
Cell phones or paddy fields (reported in 4 focus groups each)
These findings indicate that those who defecate into water can afford to build latrines, since
they own many other assets of much higher value than latrines. A basic pour-flush latrine of
the type that consumers most prefer costs around Rp.1 million (US$110), less than a color
television (Rp.500,000-1,000,000), permanent house (Rp 25 – 60 million), motorbike (Rp.4-
15 million), for example. Payment for and acquisition of these assets were explored in the
focus groups.
House building and renovations are generally paid for with surplus income at harvest time
or with funds remitted by family members working in cities or other countries. Products such
as a motorbike, television, or cell phone are bought on credit and paid for in monthly
installments. Community members became aware of products though targeted promotion
24 For further explanation, see Devine 2009.
41
and after seeing neighbors buy similar products. They were able to acquire desired
products, even those that cost many times more than a latrine, when affordable financing
options were available such as installment credit and deferred payments. These lessons
need to be transferred to the market for sanitation goods and services.
Motivation. Research showed that a majority of open defecators are happy and
comfortable with open defecation and feel no need to change this behavior. This finding
applied especially to open defecation in rivers and canals.
Motivation to continue the practice abound when people are habituated to open defecation for
generations, have easy access to perennial rivers and streams, live in a society where
defecation into water bodies is considered normal way of life, and have many priorities other
than sanitation competing for their limited economic resources.
Many of those interviewed believe that defecation into water is not only free of cost, but also
pleasant, hygienic, and smell-free; they also fear that they cannot ease themselves unless they
are squatting in water. Those who defecate in forests, bamboo groves, crop fields and pits
located away from their homes are often complacent in the belief that these sites are at a
sufficient distance and cannot pollute their living environment: The following quotes from
focus groups illustrate prevalent beliefs:
“It is cleaner, more hygienic to defecate in rivers than in pit latrines.”
“Cemplungs (pit latrines) are filthy and smelly. I would be ashamed to own or use one."
"Will never build a (pit) latrine at home – it will smell bad and attract flies, and cause
complaints and fights with neighbors."
“As long as the river is flowing, why do we need to build latrines? Better to use the money
for children’s education.”
“Better to work and earn rather than use the time to dig latrine pits.”
“When we work in fields and forests far from home, how can we come home to defecate?”
A quarter of those participating in the focus groups also reported that they do not believe that
their defecation practices can harm themselves or others. Reasons stated included:

42
“River/canal/sea carry the feces away from our homes, and our village remains clean”
“Fish eat up the feces"
"We have a clean water supply system, nobody drinks the river water."
“OD in rivers our normal, common practice for generations—has never caused any
problems!”
“Open pits are in forests or far from homes, the smell does not reach and disturb
neighbors in any way.”
However, the focus group discussions revealed that motivation to stop open defecation can be
awakened under certain conditions:
In communities where rivers or canals dry up in the dry season exposing stinking
feces, people are less satisfied with open defecation. This is especially anathema
during the holy month of Ramadan.
A majority of focus group participants agreed that OD harms themselves and others
by polluting rivers, spreading disease, and spreading stench in the community.
Causing harm or losses to others with one’s own behavior is against the values of
social harmony and responsibility to one’s community. It may be condoned only if
there are no other options open to the person causing the harm.
Using open pits, even if far away from homes, provokes feelings of disgust. Old
people and children are afraid of falling in and pits collapsing.
Several focus groups mentioned religious taboos, since open defecation causes
women to expose themselves to the public eye in ways considered sinful.
These motivations can be used to sharpen the focus of behavior change communication
campaigns.
Sharers. It was clear that most sharers have not given up open defecation and continue to use
others’ latrines while also defecating in the open from time to time. They have discovered the
convenience and comfort of latrine use, but have not been able to build one for themselves.

43
They find sharing on a regular basis embarrassing and use others’ latrines only when open
defecation is inconvenient or risky Thus sharers are not very satisfied with their current
practice, whereas habitual open defecators, particularly those using water bodies, are
generally happy with their practice. The discussions also clarified that the two categories
require different strategies for behavior change
Sharing others’ latrines does not come naturally to villagers. Sharer households were present
in 14 out of 40 NOT ODF communities. Defecating in the neighbor’s house is a taboo in several
districts. Those who share are embarrassed and hesitate to ask this favor of neighbors. They
report that sharing is done only occasionally, such as when sick, in bad weather, or at night
when it is risky to go the river. They reported sharing on a regular basis only if: a) it is a
relative’s latrine rather than the neighbor’s; b) the latrine is situated within the same family
compound; or c) they had contributed or co-invested in building of the latrine. This is one
solution adopted by those who want to build latrines but do not have land to build on.
Illustrative quotes from focus groups with Sharers:
“Better to defecate in rivers than to share someone else’s latrine.”
“It is not in our culture to defecate in our neighbor’s home.”
”If there is a queue at the neighbor’s latrine, we go to the river.”
“It is embarrassing to go to a neighbor’s house to defecate everyday—they also feel
burdened.”
Sharers were already unhappy with their practice and emotional drivers such as shame, fear,
disgust, etc. are not needed in order to change their behavior. According to them, the factors
that could bring about behavior change from sharing to building and using own latrines are as
follows, in terms of frequency of mentions:
Information on options for low-cost latrines, including those that can be built within
homes (reported from 14 communities)
Co-investment with a relative to jointly build a latrine, particularly if they themselves
have no land (reported from 13 communities)

44
Arisans/ Soft loans/material credit from suppliers/ installment payment terms
(reported from 11 communities)
Community leadership support in terms of regulation to stop OD/gotong
royong/monitoring (reported from 8 communities)
Subsidy (mentioned in 1 community)
4.3 Hygiene Awareness
Hygiene awareness was not a major study objective. Nevertheless, during data collection,
researchers facilitated a participatory visualization exercise,25 asking focus groups to trace
fecal contamination transmission routes in the community and whether they could be blocked.
Research showed that:
The greatest majority identified a three-step transmission route from exposed feces
through flies and food to mouths. River defecators also identified this route, although
flies cannot access feces deposited under water.
Except on one community, river defecators did not identify the transmission of fecal
contamination through washing and bathing in a river where people defecate.
The hand was identified as part of the contamination route only in connection with
cleaning feces from an infant.
In slightly more than half of focus groups conducted in the NOT ODF communities,
participants could identify ways to block transmission of fecal contamination. Barriers
to transmission identified most often were “defecating in latrines” and “covering food.”
Handwashing with soap, which is the most powerful preventive practice, was identified
as a barrier in just six of the 40 NOT ODF communities.
The findings indicate critical gaps in people’s hygiene awareness about how defecation into
rivers affects the whole community, particularly when the river and water is also used for
washing, bathing and cleaning of teeth. Since most East Java villagers have alternate safe water
sources for drinking and rarely drink the river water, they feel that defecation into rivers is of
no health consequence. CLTS triggering practices need to be tailored better to catalyze
connections between local behaviors and their consequences.
25 Contamination route diagramming, a PHAST (Participatory Hygiene and Sanitation Transformation) tool.

45
A hanging latrine on the pond next to a home (left). Another part of the pond is used to wash,
bathe and wash dishes (right).

46
4.4 Strategies for Behavior Change
Most open defecation takes place in water. For the most part, this practice is not visible and
does not smell. Thus, the usual CLTS change lever of disgust was not the most important
motivator. Instead, fear and shame were the levers identified by open defecators in all NOT
ODF communities. Motivations could include fear of diseases, sinning, harming others by one’s
action, defiling one’s community, accident and injury from going to the river at night/during
rainstorms/animal attack, and risk for women from the same. Shame included being seen by
others when defecating in the open, inability to offer a latrine to guests, and having to share a
neighbor’s latrine. Promoting the benefits of convenience, safety, and saving time by not having
to queue up at neighbor’s facilities can reinforce these drivers.
To these motivations the following enabling strategies and opportunities could be added:
Community leadership support for change, through regulations, sanctions, monitoring,
organizing gotong royong, network building with sanitation suppliers and sources of
financing. This was reported from 30 out of 40 communities.
Facilitation of soft loans or sanitation supplies and services at affordable rates—
reported from 24 out of 40 communities.
Information on more low-cost options and alternative materials to reduce cost—
reported from 15 out of 40 communities.
Subsidies were mentioned, but only in four communities.
4.5 School Sanitation and Hygiene Facilities
Although the project did not target school sanitation programs, the researchers observed 76
school facilities in 75 communities to check whether schools in triggered communities were
equipped to support community commitments to stop open defecation.26
Schools were found to have one to two pour-flush water-seal latrines in every community
visited. All latrines were accessible to students. All except two were functional and in use. Only
53 percent of the schools had separate facilities for boys and girls. The rest had common
facilities for both. Access to school latrines was lowest in the NOT ODF-Low coverage
communities, as concluded from the ratios of latrines to students. Surprisingly, access was
lower in QUICKLY ODF communities than in the LATE ODF and NOT ODF-High coverage
26 In five communities schools were closed for holidays and were not accessible. One of the 75 observed
communities had two schools, thus 76 latrines were observed in total.
*Recommended for optimal use: ratio not exceeding 1 latrine per 30 students, as specified by Ministry of
Education and Culture, Government of Indonesia

47
communities. Possibly the school sanitation situation has not received community attention in
the hurry to improve household access figures (Table 4).
The school latrine-to-student ratio varied widely, from as low as 18 students per latrine in
Ledokan Dusun 2 (QUICKLY ODF) in MAGETAN district, to 417 students per latrine in Panbetes
(NOT ODF-Low coverage)in SAMPANG district. While recommended norm from the Ministry of
Education and Culture is one latrine for 30 students, ratios were far higher in more than 90
percent of all school latrines observed, and all the latrines observed in some districts. When
ratios are more than 50-55 students per latrine, it is likely that access for students is limited
during school breaks and some open defecation around school premises is likely to occur.

48
TABLE 4: OBSERVED ACCESS TO SCHOOL LATRINES
School Latrines
Observed in
Different
Community Types
Functional and
in Use
Separate
Latrines for
Girls/Boys
Averaged Ratio:*
Latrines
Available for
BOYS
Averaged Ratio:*
Latrines
Available for
GIRLS
QUICKLY ODF (N=18) 18 12 1:119 1:118
LATE ODF
(N=21)
21 9 1:91 1:89
NOT ODF—High
Coverage (N=19)
19 13 1:89 1:83
NOT ODF—Low
Coverage (N=18)
16 5 1:158 1:154
TOTAL (N=76) 74 39 of 76
Handwashing facilities were found in 72 or 85 percent of the schools visited. Of these, 70
percent were constructed to wash hands (e.g., wash basins, standpipes and water storage
facility/tank fitted with taps); the rest were simply buckets of water and mugs kept at suitable
spots.
Schools that had handwashing facilities had between one and six handwashing stations.
Schools observed in ODF communities had better handwashing facilities, as indicated in Table
5. All schools in QUICKLY ODF communities had handwashing facilities and almost all facilities
had water available in them. Soap, however was available at less than half the schools. At the
bottom of the list the NOT ODF-Low coverage communities had barely a third of the schools
with handwashing facilities, only half of which had water, and soap was seen in only 1 out of
the 18 schools observed.
TABLE 5: HANDWASHING FACILITIES IN SCHOOLS
No. of Schools Observed in
Different Community Types
Schools with
Handwashing
Facility Available
(%)
Facilities with
Water Available
(%)
Facilities with
Soap Available
(%)
Quickly ODF (N=18) 100 94 47
LATE ODF (N=21) 79 79 68

49
NOT ODF–High coverage (N=19) 72 94 44
Not ODF–Low coverage (N=18) 33 50 5

50
V. Access Gained and ODF: What is Achieved and
Sustained?
Key Findings
QUICKLY ODF communities represent the most efficient model worth replicating.
These communities almost doubled their baseline household access from 52
percent to 97 percent and achieved access gains for 7,016 persons in less than two
months. LATE ODF communities took four times as much time to achieve only half
the access gains.
NOT ODF communities took as long as 18 months to add only 8-20 percent
additional household access.
Communities did not always achieve ODF status at first verification. On an average,
QUICKLY ODF communities had claimed ODF status and were verified as ODF
within 46 days of triggering. Those that did not qualify at first verification averaged
another 22 days to qualify with a re-verification.
In contrast, LATE ODF communities claimed ODF status and were verified as ODF
171 days after triggering on average. Those that needed re-verification became
ODF another 73 days later on average.
The QUICKLY ODF communities, observed 4-28.5 months after being verified as
ODF, remained ODF with no slippage backwards into Open Defecation, and with
behavior monitoring and sanctions against violators applied by the communities.
However, in one community out of 20, some latrines had become unsafe causing
the community to be technically no longer ODF.
Among the 20 LATE ODF communities, observed 1-25 months after ODF
achievement, open defecation was continuing unchecked in 20 percent of the
communities, as self-reported.
Once verified communities declared as ODF are not being re-checked by local
government agencies for sustainability of behaviour change.
5.1 Access Gained and Time Taken to Become ODF
Although NOT ODF communities had records of baseline access and some had social maps,
progress updates were not regularly recorded by sanitation committees. Researchers checked
recorded data and updated them when necessary through field observations and checking
records at lower levels, i.e. with neighborhood chiefs, who keep detailed records of many
aspects of all member households, including latrine ownership and latrine type. The results,
averaged for 20 communities in each category, are presented in Figures 9 and 10.27 The total
27 The percentage in Figure 9 adds up to only 97 instead of 100 percent in the QUICKLY ODF bar because two out of 20
communities did not have 100 percent ownership of improved household facilities.

51
number of persons who gained access to improved sanitation in each community category
appears in Figure 10.
Figures 9 and 10 show that the largest gains in access have happened in the QUICKLY ODF
category. Table 6 shows that they also achieved these gains fastest of all. Both QUICKLY ODF
and LATE ODF communities recorded much higher proportions of households gaining access,
in contrast to the NOT ODF communities. The NOT ODF – Low coverage group achieved the
smallest percentage of gain, having started from the lowest (28 percent) baseline access.

52
FIGURE 9: PERCENTAGE INCREASE IN HOUSEHOLD ACCESS TO IMPROVED SANITATION
IN FOUR TYPES OF COMMUNITIES IN 20 DISTRICTS
In terms of persons gaining access, the QUICKLY ODF communities recorded seven times as
much access gain as the NOT ODF-low coverage communities. While access gains in NOT ODF-
high coverage group compares well with the two ODF community groups, the gains were far
slower. As Table 6 clarifies, QUICKLY ODF communities almost doubled their baseline
household access and achieved access gains for 7,016 persons in less than two months. In
comparison, LATE ODF communities took nearly 8 months to achieve access gains for about
half that many households and persons. NOT ODF communities took as long as 18 months to
add only 8-20 percent additional household access, and for as few as 313 to 1,341 additional
persons. This finding underscores the importance of doing evidence-based learning in real
time and using it to improving implementation efficiency.
0%
20%
40%
60%
80%
100%
Quickly ODF
Late ODF Not ODF
(High coverage)
Not ODF (Low
coverage)
52% 63% 67%
28%
45% 37%
21%
8%
Household access to
improved latrine (%)
Average of baseline access Average of additonal access

53
FIGURE 10: TOTAL PERSONS WHO GAINED ACCESS TO IMPROVED SANITATION IN FOUR
TYPES OF COMMUNITIES IN 20 DISTRICTS
TABLE 6: SUMMARY OF ACCESS GAINED AND TIME TAKEN
Community
Type
Average
Time to
Become
ODF
Average %
Increase in
Household Access
to Improved
Sanitation
Additional
House-
holds that
Gained
Access
Additional
Persons
that
Gained
Access
QUICKLY ODF 57 days 5297 1,916 7,016
LATE ODF 230 days 63100 1,160 3,878
Time since
triggering
NOT ODF -
High coverage
555 days 6788 1,341 5,034
NOT ODF –
Low coverage
534 days 2836 313 1,112
0
1000
2000
3000
4000
5000
6000
7000
8000
Quickly ODF
Late ODF Not ODF
(High coverage)
Not ODF (Low
coverage)
7016
3878 5034
1122
Access to improved latrine
(people)

54
Total 4,727
households
17,040
persons
When communities first claim to have become ODF, they are not always found to be so. This
finding should be taken positively, as it indicates that the ODF verification process is not a
ritualistic formality but has some rigor and transparency.
At the first verification, 12 out of 20 QUICKLY ODF communities did not satisfy all criteria for
ODF and requested a re-verification after having addressed the shortcomings. They took 22
additional days on average to be re-verified as ODF. The remaining eight claimed ODF status
and were verified as ODF within 46 days of triggering. The average thus worked out to 57 days
from triggering to ODF for the group of QUICKLY ODF communities (see Table 7). LATE ODF
communities took much longer. They averaged 171 days from triggering to the first
verification. 15 out of 20 LATE ODF communities needed a second round and took 73
additional days. Community effort and mobilization for change was weaker in the LATE ODF
communities, a finding confirmed by the villagers. There was also a greater desire to wait till
they could afford the type of facility that they really wanted, rather than take immediate action
to stop open defecation. The urgency to change was missing.
TABLE 7: TIME TAKEN FROM TRIGGERING TO VERIFICATION AND ODF DECLARATION
Community
Type
Average Number of Days from
Triggering to Verification
Average Number of Days from First
Verification to ODF Achievement
QUICKLY ODF 57 22
LATE ODF 171 73
5.2 Is ODF Status Sustained?
To investigate issues of sustainability of ODF status and slippage, researchers observed
household facilities and community environs, checked latrine ownership records, and probed
the subject in focus group discussions.
Of the 20 QUICKLY ODF communities, 18 had remained ODF some 4–28 months after being
declared ODF, i.e., improved latrine ownership and usage was 100 percent in the 18
communities. The remaining two communities were found to have 80 percent and 60 percent
improved latrine ownership. However, actual slippage had happened in only one community,
where latrines had become unsafe when pit covers were damaged and not replaced. The action
research activity resulted in a commitment to replace lost pit covers. The second community
with 60 percent improved latrine ownership, as explained earlier, was due to 40 percent of

55
improved latrines in the community being co-owned, jointly constructed, used, and maintained
by groups of three to four households each.
All 20 QUICKLY ODF communities continued to monitor people’s behavior and had
mechanisms to detect OD, such as early morning riverside watch and rewards for spotters of
anyone defecating in the open, in one case even photographing people in action. Community-
instituted sanctions against OD included naming and shaming in various ways, monetary or
material fines, and social service penalties. More details about the means and methods are
presented in Chapter 5, under Community Monitoring.
In the 20 LATE ODF communities, the findings are not really “slippage”. Research revealed that
20 percent of these communities had never really become ODF in the first place. In four LATE
ODF communities, even though all households had acquired improved sanitation facilities and
used them at home, open defecation was continuing in rivers where people went for washing
and bathing every day. In these four communities, sanctions against open defecation were
agreed to but community members report that these sanctions were rarely enforced.
Sanitation behavior was not being monitored by a third of the LATE ODF communities. The
ODF verification process had checked for and found 100 percent ownership and usage of
improved sanitation, but had failed to capture the fact that people had continued defecation
into rivers despite the availability of improved sanitation.
All of the communities declared ODF in the sample reported that local government agencies
are no longer monitoring them. Puskesmas staff members, such as a sanitarian and a Bidan
Desa (trained midwife), usually monitor sanitation progress with help from village level
volunteers from various programs. They had been monitoring communities after triggering,
but have stopped once they were declared ODF. There are no systems for periodic re-checking
of ODF status thereafter. Communities have the capacity to sustain their ODF status, but do not
have any incentives to do so, at present. As the experience in Dusun Ledok suggests (see Box 3,
in Chapter 3), the sustainability of ODF communities is not guaranteed by a declaration of ODF.
Without continued monitoring, community members can inadvertently slip into unsafe
practices.
5.3 Time Lags between ODF Achievement and ODF Declaration
An unexpected research finding was a long time lag between achieving ODF status through
independent verification and formal declaration of ODF. After achieving ODF status within 46
days of triggering, QUICKLY ODF communities had to wait up to five months before they were
officially declared ODF. LATE ODF communities also had long waits (see Table 8).
TABLE 8: TIME TAKEN FROM TRIGGERING TO VERIFICATION AND ODF DECLARATION
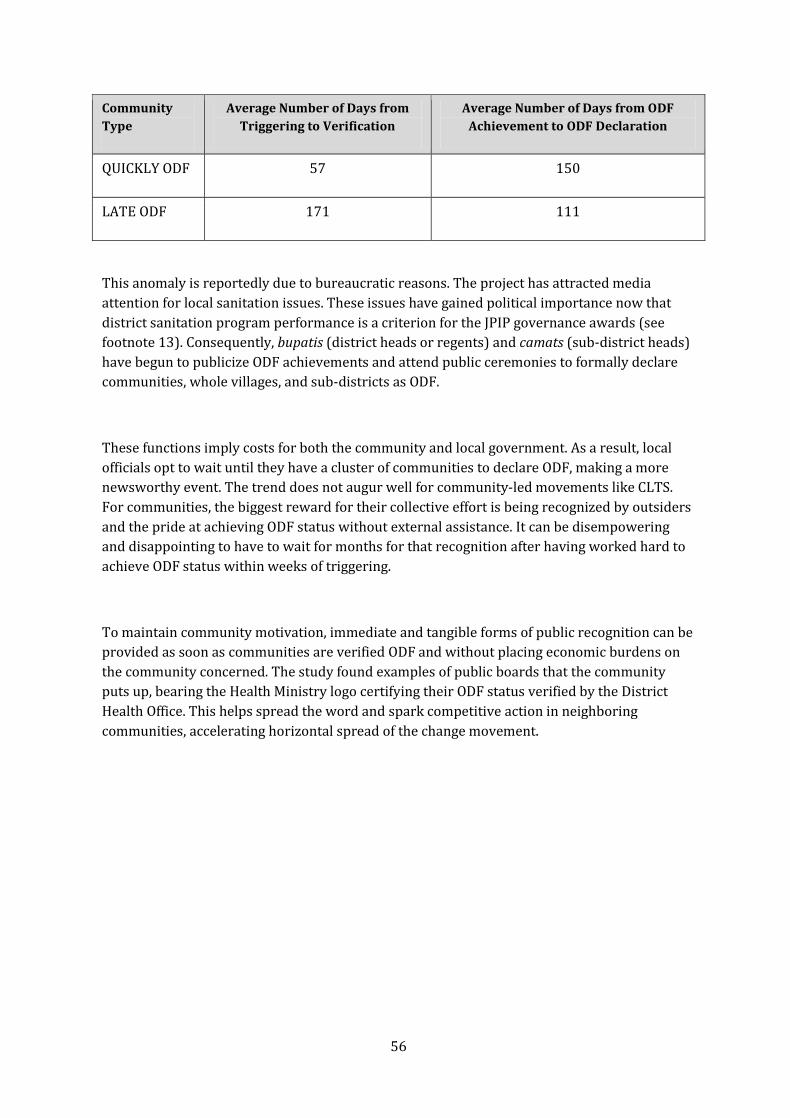
56
Community
Type
Average Number of Days from
Triggering to Verification
Average Number of Days from ODF
Achievement to ODF Declaration
QUICKLY ODF 57 150
LATE ODF 171 111
This anomaly is reportedly due to bureaucratic reasons. The project has attracted media
attention for local sanitation issues. These issues have gained political importance now that
district sanitation program performance is a criterion for the JPIP governance awards (see
footnote 13). Consequently, bupatis (district heads or regents) and camats (sub-district heads)
have begun to publicize ODF achievements and attend public ceremonies to formally declare
communities, whole villages, and sub-districts as ODF.
These functions imply costs for both the community and local government. As a result, local
officials opt to wait until they have a cluster of communities to declare ODF, making a more
newsworthy event. The trend does not augur well for community-led movements like CLTS.
For communities, the biggest reward for their collective effort is being recognized by outsiders
and the pride at achieving ODF status without external assistance. It can be disempowering
and disappointing to have to wait for months for that recognition after having worked hard to
achieve ODF status within weeks of triggering.
To maintain community motivation, immediate and tangible forms of public recognition can be
provided as soon as communities are verified ODF and without placing economic burdens on
the community concerned. The study found examples of public boards that the community
puts up, bearing the Health Ministry logo certifying their ODF status verified by the District
Health Office. This helps spread the word and spark competitive action in neighboring
communities, accelerating horizontal spread of the change movement.

57
VI. Factors Influencing Demand Generation and Sustainable
Behavior Change
Key Findings
The CLTS triggering process for generating demand for behavior change was of the
highest quality in the QUICKLY ODF communities. LATE ODF communities experienced
a process of lower quality. NOT ODF communities received the poorest quality
triggering of all, with 10 percent not experiencing any of the usual CLTS triggering
tools.
All QUICKLY ODF communities had
o Triggered all age-sex-socio-economic groups in communities;
o Made follow up plans for self help;
o Not received external subsidies; and
o Continued monitoring behavior after ODF declaration
The majority of them had also
o Experienced three or more CLTS tools during triggering (70 percent);
o Followed up initial triggering through multiple events/channels to reinforce
collective disgust, shame, and fear first generated during triggering (55
percent);
o Formed sanitation action committees/gotong royong groups following
triggering (65 percent); and
o Made collective commitments to become ODF within three days to two months
of triggering (95 percent).
Failure to achieve ODF outcomes was not the result of poor quality of CLTS triggering
alone. A range of additional factors worked in combinations to halt or delay progress
such as: nearness of flowing water bodies, local livelihoods-related open defecation,
history and expectations of receiving subsidies, and availability and affordability of
sanitation improvement options of the kind that the community members considered
worth buying.
6.1 Triggering Process and Responses in ODF and NOT ODF
Communities
Responses from ODF and NOT ODF communities are aggregated in Figure 11. The bars in the
chart are arranged chronologically, starting with the triggering event at the bottom, and the
consequences unfolding upwards. The progression from the bottom to the top of the chart
represents the process milestones that could be used to evaluate progress after triggering.
When triggering is successful, all the steps included in Figure 11 occur within the first week of
the triggering event.
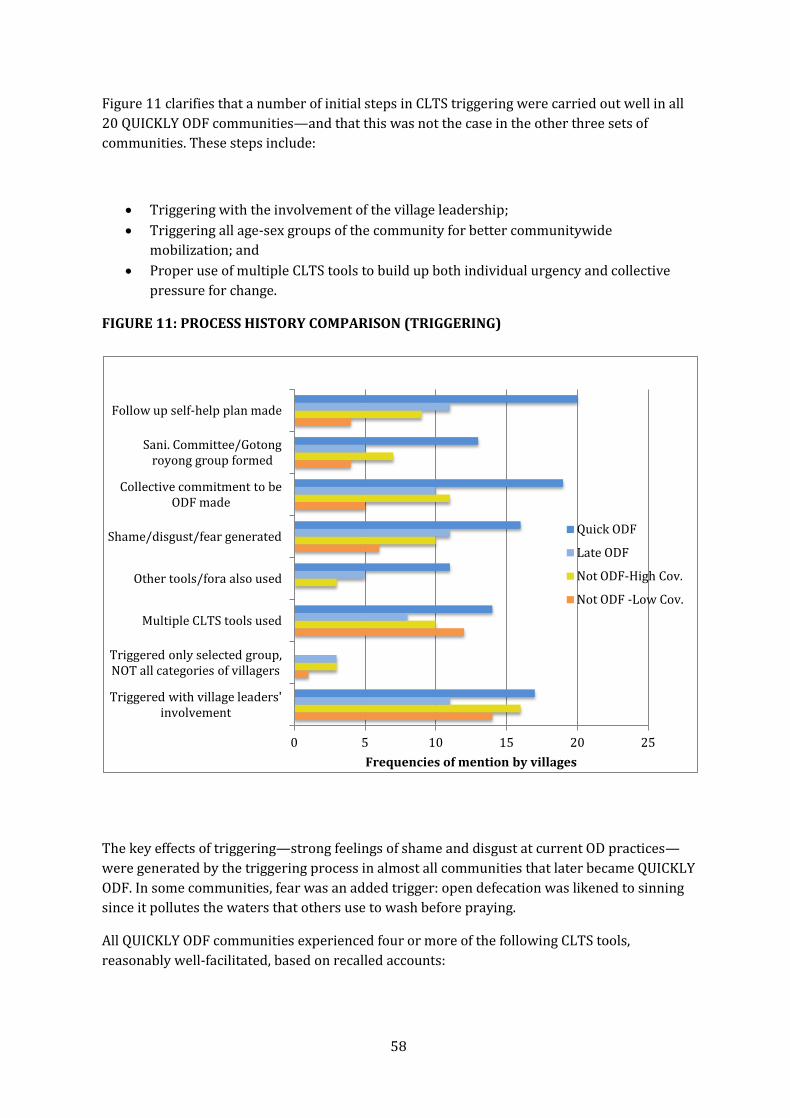
58
Figure 11 clarifies that a number of initial steps in CLTS triggering were carried out well in all
20 QUICKLY ODF communities—and that this was not the case in the other three sets of
communities. These steps include:
Triggering with the involvement of the village leadership;
Triggering all age-sex groups of the community for better communitywide
mobilization; and
Proper use of multiple CLTS tools to build up both individual urgency and collective
pressure for change.
FIGURE 11: PROCESS HISTORY COMPARISON (TRIGGERING)
The key effects of triggering—strong feelings of shame and disgust at current OD practices—
were generated by the triggering process in almost all communities that later became QUICKLY
ODF. In some communities, fear was an added trigger: open defecation was likened to sinning
since it pollutes the waters that others use to wash before praying.
All QUICKLY ODF communities experienced four or more of the following CLTS tools,
reasonably well-facilitated, based on recalled accounts:
0 5 10 15 20 25
Triggered with village leaders' involvement
Triggered only selected group, NOT all categories of villagers
Multiple CLTS tools used
Other tools/fora also used
Shame/disgust/fear generated
Collective commitment to be ODF made
Sani. Committee/Gotong royong group formed
Follow up self-help plan made
Frequencies of mention by villages
Quick ODF
Late ODF
Not ODF-High Cov.
Not ODF -Low Cov.

59
Mapping defecation practices
Transect walk to visit defecation sites (walk of shame)
Simulation of water contamination with feces
Tracing fecal contamination routes active in the community
Calculation of daily weight/volume of feces discharged into community
environments.
In 95 percent of the QUICKLY ODF communities, the triggering resulted in a spontaneous
collective commitment to immediately eliminate the “now suddenly unbearable” practice of
open defecation, and the setting of a date within the next three days to two months by when
they would achieve that target. A community sanitation committee was formed in 65 percent
of QUICKLY ODF communities by the end of the triggering process; self-help plans on how OD
would be eliminated by the target date were formulated in 100 percent of communities.
The plans being based entirely on self-help is a key indicator that the QUICKLY ODF
communities were not willing to wait for any kind of external assistance or subsidies. The
plans were also immediately put into action, as evident in the immediate post-triggering
period, when other community forums and events picked up and began reinforcing the
triggering appeals in weekly religious discourses, Friday prayers at mosques, saving and credit
groups (arisan) meetings, women’s welfare movement (PKK) meetings, farmers’ credit and
savings group meetings, local schools, village meetings and monthly Posyandus (growth
monitoring and health service posts, jointly managed by communities and Puskesmas staff).
In contrast, 10-15 percent of the LATE ODF and NOT ODF communities experienced selective
triggering of only the leaders or community volunteers, only the latrine-less households, only
the women, or had less than 15 people attended a triggering event. Triggering selective age-
sex-social groups usually led to no further action. The poor were sometimes singled out for
triggering as they were the open defecators—and this did not help either. Selective triggering
hindered a communitywide build up of momentum for change.
Furthermore, multiple CLTS tools were not used in 20 percent LATE ODF communities and 15
percent of all NOT ODF communities, which weakened their progressive emotional impact.
CLTS tools were also not reinforced through other channels and forums in the NOT ODF
communities. The result was that people’s emotional levers of shame, disgust and fear were
activated in only half the LATE ODF and NOT ODF-High coverage communities, and only a
quarter of the NOT ODF-Low coverage communities. This too did not happen in all levels and
groups of community members, leaving them in a “not really ignited” state.
Inevitably, collective commitments to become ODF did not happen in half the cases. The
remaining 50 percent of LATE ODF communities set targets of becoming ODF within three
months. The NOT ODF communities that did set targets did so with targets of 3-12 months

60
later. Less than a quarter NOT ODF-Low coverage communities established action committees.
Half or fewer NOT ODF communities made follow-up plans.
Figure 12 illustrates that an important characteristic that set the NOT ODF group apart was the
kinds of plans they made. Forty-five percent of NOT ODF communities did not make self-help
plans. They prepared proposals requesting infrastructure projects to build free communal
latrines (see Figure 12). A fifth of these communities had received subsidized latrines from
various poverty alleviation programs in the past, which made them firm believers that they
would get more such freebies and need not spend their own funds to get latrines. They also
started latrine arisans whereby a group of households contributed small sums every week or
month, and by turns each household received the total amount collected, to enable them to
receive a lump sum amount that they may find difficult to otherwise save up. While arisans are
useful in principle, they slowed down the rate of growth of sanitation access as members of an
arisan needed to wait weeks or even months to collect enough money to pay for a latrine.

61
FIGURE 12: PROCESS HISTORY COMPARISON (POST TRIGGERING)
QUICKLY ODF communities were a complete contrast. They were aware that subsidized latrine
packages are provided by certain government programs, but did not themselves have a history
of having received subsidized latrines from external sources. They did not want to wait for
external help. They were not even willing to start arisans for funding household latrines
because “arisans are too slow.” Their self-help plans included both gotong royong as well as
using village development funds to improve the supply of sanitation improvement services of
the kind desired by community consumers. This took various forms such as advancing village
funds for bulk buying of materials or bulk orders to local masons, while allowing consumers to
pay back to the village council or service providers in installments or at after-harvest. In 10
percent of the QUICKLY ODF communities the village chief had provided free drop hole covers
and cement pans from village development funds to families that were holding up progress to
ODF status. This hastened the ODF status achievement but probably short-circuited the
emotional triggering which helps sustain behavioral change. People in these communities
reported they “do not remember the triggering process.”
6.2 How the Triggering Tools Were Used
Examination of the communities’ triggering process experience further reveals that the
QUICKLY ODF and LATE ODF communities experienced four or more CLTS triggering tools
more often than the NOT ODF communities. The NOT ODF groups experienced mainly Social
Mapping. Clearly, these differences affected the quality of the change-igniting process (see
Table 9).
0 5 10 15 20 25
Used village funds to improve supply/provide financing/supply
networking
Planned for sanitation arisan
Planned for external help/subsidy
Received external subsidies as material or revolving loan
Progress monitored by community
Progress monitored by PUSKESMAS
Frequencies of mention by villages
Quick ODF
Late ODF
Not ODF-High Cov.
Not ODF -Low Cov.

62
TABLE 9: TOOLS USED FOR TRIGGERING IN THE FOUR TYPES OF COMMUNITIES
Triggering Process Experience
Frequencies Reported in the Four Community Categories
NOT ODF–
Low
Coverage
Communities
(N=20)
NOT ODF–
High
Coverage
Communities
(N=20)
LATE ODF
Communities
(N=20)
QUICKLY
ODF
Communities
(N=20)
4-5 CLTS tools used* 5 4 7 10
2-3 CLTS tools used 8 5 3 4
1 tool only/Map only/Mapping on
paper
6 9 5 2
No CLTS tools used 0 1 3 2
Community members “can’t
remember process”
1 1 2 2
Total 20 20 20 20
*Social mapping/Transect walk of shame/Water contamination simulation/Contamination route tracing/Feces volume calculation
CLTS tools are meant to be used in a sequence, which helps to progressively build up collective
realization of the repugnant consequences of open defecation. Those who experience their
proper use are able to recall the triggering process and the emotions they evoked in vivid
detail. Not using these tools may be a reflection of the quality of training received by CLTS
facilitators or simply a desire to use short cuts. Social mapping produces a tangible output
which can be checked by others, while the other tools do not. A facilitator hard-pressed for
time, lacking adequate resources for field work, or under-confident of his/her facilitation skills
may therefore skip the use of tools other than the social map, and do it with a few community

63
representatives on a sheet of paper, rather than on the ground with active participation of a
large community group.
Of the 80 sample communities, 57 were triggered by project-trained facilitators. Thirty-two
(56 percent) became ODF. Twenty-three were triggered by other facilitators, of which eight
(35 percent) became ODF. Exploration of the process history revealed major differences
between triggering processes and use of CLTS tools by the two groups of facilitators, as seen in
Table 10.
Local government functionaries were trained by the project’s Resource Agency personnel in
each district. They were trained on-the-job, through actual CLTS triggering in communities
during the project period from November 2007 onward. The other facilitators were provincial
and district level health office employees who had been trained by the Health Ministry initially
in the WSLIC 2 project during 2005-2006, or later by specific district government health offices
in East Java.
The facilitators trained by resource agencies tended to use multiple and well-known CLTS
triggering tools most of the time, while the other facilitator often relied upon a single tool, i.e.,
social mapping. The CLTS tools are not the only means to ignite change, and depending on the
facilitators’ skills, other methods may work well. However, the process history exploration
indicates that the non-project-trained facilitators did not substitute CLTS tools with other
methods. They simply cut the process short by excluding other CLTS tools and used only social
mapping, and it was not used in empowering ways (see Table 11). Over a third of the
communities they had triggered did not remember much about the process.

64
TABLE 10: USE OF CLTS TOOLS BY DIFFERENT GROUPS OF FACILITATORS
Triggering Process Experience
Frequencies Reported
In 57 Communities
Triggered by Project-
Trained Facilitators
In 23 Communities
Triggered by other
Facilitators
Three or more CLTS tools used 39 1
Two CLTS tools used 10 2
One tool only/Map only/Map on
paper
5 10
No CLTS tools used 1 3
Community members “can’t
remember process”
2 7
Total communities triggered 57 (32 became ODF) 23 ( 8 became ODF)
The researchers traced timelines and descriptive histories of the process with community
groups. However it was not possible to objectively evaluate the use of each tool based only on
recall. One exception was social mapping, which was retained as a record, and used for
monitoring. From an examination of social maps available in communities visited and
discussions with those who kept and updated them, a summary was made (see Table 11). It
indicates the quality of the processes in the ODF and Not ODF communities. The data indicate
that community-empowering social mapping experiences are associated with ODF
achievement, and vice-versa.
TABLE 11: ODF AND NOT ODF COMMUNITIES’ SOCIAL MAPPING HISTORY
Social Mapping Practices Reported
Reported Frequencies
ODF
Communities
N=40
NOT ODF
Communities
N=40
Community empowering practices
Defecation practices mapping done publicly on the ground during
triggering
30 20
Map transferred to paper later by community group 20 8
Map contains information on welfare class of households, ownership of
latrines differentiated as improved/unimproved OR existing/new
25 6

65
construction.
Map used by community for action planning during and after triggering 20 4
Map kept and used in community for monitoring progress 18 3
Map displayed in community and updated periodically by community
members
18 1
Community disempowering practices
Social map not available (never done/lost/damaged) 10 32
Mapping done on ground during triggering but not transferred to
paper/facilitator did not explain its use for monitoring
6 22
Social map made but taken away by
Sanitarian/Bidan/Puskesmas/Promkes
5 4
Map made only on paper/only by community leaders or village cadres 5 12
Leaders/Puskesmas, Staff/Kecamatan team don’t encourage mapping
because they think mapping is too difficult for community OR not
necessary because they monitor progress anyway, using home visits.
10 15
6.3 Progress Monitoring—Internal and External
Less than half of all categories of the communities reported follow-up and monitoring of
progress by local government agencies—usually the Bidan Desa and the Sanitarian, both
Puskesmas staff. The NOT ODF-Low coverage communities were practically left alone after
triggering, as only two out of the 20 had had any progress monitoring by local government
functionaries. All QUICKLY ODF communities monitored their own progress, while only 60-70
percent of the other categories did so. Community monitoring was of markedly higher quality
in the ODF communities
TABLE 12: NOT ODF COMMUNITIES LACK INTERNAL AND EXTERNAL MONITORING
Existing Monitoring Practices QUICKLY
ODF
N=20
LATE
ODF
N=20
NOT ODF
(High cov.)
N=20
NOT ODF
(Low cov.)
N=20
No monitoring since ODF/No monitoring
happening now
5 3 4 9

66
Who monitors ?
Kader/Committee with or without Bidan or
Sanitarian
Natural Leader/Ketua RT/Kepala Dusun with
Sanitation Committee
Jumantik (insecticide sprayer)
9
10
3
8
6
3
4
8
1
5
6
3
Tools/methods used:
Written records/formats
Home visits
Posyandu visits, Cheap rice/fuel (sembako)
collection/RW meetings
Social map/ Photo of new latrines/sticker on
house wall
Morning watch at river bank
8
8
5
8
2
7
7
3
10
1
1
2
1
1
Action if someone caught open defecating
Reminders
Reprimands from leaders
Sanctions: e.g., public shaming/OD spotter given
reward/Deny OD-er cheap rice and official
documents/Fines for OD
5
4
6
6
5
6
5
5
6
1
Community inaction—“Let them carry on OD” 0 0 8 13
Table 12 shows that no monitoring was happening at the time of this study in 40 percent of the
ODF communities since they had become ODF. No monitoring of progress was happening in 65
percent of the NOT ODF communities. Where it was happening, local government monitoring
generally took the form of Puskesmas staff (Sanitarian) periodically collecting new latrine
construction data from Bidan Desas or Desa Siaga (Health program) volunteers resident in the
community, and verifying it with field observations. In the absence of a Sanitarian, the anti-
malarial insecticide sprayer was given the task of collecting monitoring data. All of these
efforts monitored nothing more than new latrines built, and the type of latrine (permanent or
semi-permanent). Data collection was done every one to three months in different districts.
Community monitoring was done more frequently, every week or fortnight before achieving
ODF, and thereafter less often. Neighborhood chiefs (RTs) and Natural Leaders monitored
progress of access to improved sanitation regularly and reported to the Kepala Dusun (hamlet
chief) and the Sanitation Committee, who in turn provided monitoring data regularly to the

67
Kepala Desa (village chief). NOT ODF communities were less monitored in general, both by the
Puskesmas and by the communities themselves.
Seventy-five to 90 percent of QUICKLY and LATE ODF communities used a variety of tools and
methods to keep monitoring records. Frequent home visits by neighborhood and hamlet chiefs
and Sanitation Committee members repeatedly exhorted the latrine-less households until they
were shamed into building and using their own facilities. Data from home visits was recorded
in registers by names and numbers of households by neighborhood chiefs, and transferred to
social maps by sanitation committee members. Photos of newly constructed latrines were put
up in the village offices. Some communities were found to be marking homes having improved
latrines with colored stickers. Every month when poor households collect their sembako
(government subsidized grains, oil and kerosene) they were asked to report their ownership of
sanitation facilities. Posyandus were used to check latrine ownership of mothers bringing
babies for weighing and health services. In contrast, the NOT ODF communities kept no
monitoring records, written or otherwise. And, perhaps most importantly, they monitored only
latrines if at all, never behavior. Focus group discussions in more than half the NOT ODF
communities found an attitude of complete tolerance of open defecation. NOT ODF
communities had not instituted any kinds of sanctions against open defecation, anywhere.
Fifty to 60 percent of QUICKLY ODF communities tracked behavior, rewarded spotters of open
defecation, used reminders and reprimands with anyone found practicing open defecation, and
used sanctions of various kinds against them. Ten percent of QUICKLY ODF communities had
set up early morning watch systems on their riverbanks to detect open defecation by anyone.
People caught at open defecation were made to pay fines in cash or construction materials, or
were required to provide unpaid labor for community service. Their photos were put up over
the television in the village office where everyone came to watch. They were denied their share
of the month’s subsidized rice, or the village chief refused them official documents that they
needed for seeking jobs or registering marriages.
6.4 What Helps ODF Achievement—Community View
Community focus groups explored men and women’s perceptions based on their experience,
about what had helped or hindered their progress towards becoming ODF. Figure 13 shows an
aggregation of the open-ended investigation results of what helped.
Opinions about what helped were not the same in ODF and NOT ODF communities. According
to ODF communities, the most important facilitating factor was the collective and coordinated
push for change by forces both within and external to the communities. In communities that
became ODF, mobilization for change by formal and informal leaders of the communities was
synchronized with and supported by the local community health centers, and sub-district and
district government agencies. The appreciation of their efforts to become ODF by outsiders,
particularly by visitors brought by district Health offices had reportedly been a catalyzer of
rapid change. The visitors included WSP personnel, visitors from other countries and other

68
external aid agencies in addition to the district Regent and national government officials. The
NOT ODF communities reported the same facilitating factor, but far fewer times. The second
most important helping factor reported was the activation of people’s emotional triggers
(shame, disgust, fear) associated with open defecation. ODF communities reported this twice
as often as did the NOT ODF ones. In ODF communities the same triggers were repeatedly
reinforced twice as often through post-triggering mobilization and monitoring activities.
Evidently, NOT ODF communities experienced ignition far less often. Gotong royong to help all
households build latrines was also rarely reported from NOT ODF communities. According to
more than a third NOT ODF communities, subsidies help ODF achievement. However, they
were the ones that had failed to become ODF despite having received subsidies. QUICKLY ODF
communities had not received subsidies, but two out of 20 LATE ODF communities had.
FIGURE 13: WHAT HELPED COLLECTIVE BEHAVIOUR CHANGE—VILLAGERS OPINIONS*
*Conclusions reached at 80 focus groups have been aggregated here. A few themes were recurring in the focus groups in many
communities, and they have been visually highlighted here. The factors mentioned by 10 or more communities in the Figures 13 and 14
are more meaningful, as they represent the views of at least a quarter of each sub-sample group.
0 10 20 30 40 50 60
Collective push for change by village govt., Puskesmas, Kecamatan and Kab LG, and
visitors they brought
Shame/disgust/fear/ generated during triggering ,
Shame/Embarassment /fear generated during monitoring,
Disgust/ discomfort re. OD practice in dry season/among the aged
Subsidies (materials, soft loans )
Social cohesion and cooperation (gotong royong)
Local availability of building materials and masons
Special occasions favoring latrine building
Frequency of mention in 80 communties
40 NOT ODF communities
40 ODF Communities

69
NOT ODF communities reported three factors that could serve as opportunities to improve the
effectiveness of triggering.
Rural households in East Java often renovate their homes and specifically add latrines
just before a family event is to be celebrated. It is a matter of pride and prestige to be
able to offer the convenience of a modern, clean, smell-free household latrine to
houseguests and relatives expected during family events.
The dry season makes latrine building attractive in communities where streams or
canals used for OD dry up and start stinking. However, in such situations the sanitation
options promoted should be able to offer smell-free facilities that can be kept clean
with the extent of water available during the dry period.
The presence of aged and less mobile family members was another reason for
households to invest in building household facilities.
Twelve of the 40 NOT ODF communities cited the availability of subsidized latrine materials or
soft loans as ‘a factor that helps ODF achievement,’ while only 5 of the 40 ODF communities did
so. Interestingly, 14 communities out of 80 also identified ‘hope/expectation for subsidy’ as an
inhibiting factor for progress to ODF, and the 14 were equally distributed in the ODF and NOT
ODF categories. (see Figure 14). Although expectations of subsidies were encountered in all
communities, the ODF communities were able to overcome them through the strength of the
collective desire generated for stopping open defecation. The CLTS process quality was higher
in the communities that became ODF, leading to more effective “ignition of change.” Progress
after triggering was also influenced by the degree of ignition achieved.
However, good CLTS triggering is not a complete guarantee of progress to ODF, for reasons
explained in the next section.
6.5 What Hindered ODF Achievement—Community View
Figure 14 shows that the highest number of focus groups reported that the most important
factor preventing progress towards ODF status is a marked preference for open defecation in
flowing water among rural populations. This preference is far stronger in NOT ODF
communities, where people also largely believe that latrines discharging directly into rivers do
not harm anyone. People in rural East Java do not defecate into rivers, streams or canals
because they do not have latrines. They sometimes do so despite having latrines at home.
The reason is that they prefer open defecation into flowing water bodies, because:

70
“Feces are carried away by the flow or eaten by the fish and the community stays
clean.”
“River/sea washes away feces.”
“It is cleaner than defecating in pits.”
“Shit is not something to be kept in or near home. The river takes it away.”
“ We enjoy defecating in running water. It is also convenient, and free of cost.”
“As long as rivers flow, why spend money/time to build latrine?”
Figure 14 shows that the next most potent hindering factor is a combination of several related
issues. Poor river defecators think the pour-flush system is the only kind of latrine worth
building, but perceptions about its cost range from 2-3 million rupiahs (US$200-300), which
they find unaffordable. They are largely unaware that pour flush systems can be built at lower
costs. While pit latrines are cheaper, they strongly abhor the idea of pit latrines, which they
consider smelly, filthy things which must not be built anywhere near homes. But settlements
are crowded and poor households often lack land to be able to locate their pits sufficiently
away from their dwelling unit. Their conclusion therefore is that they lack the resources to
build hygienic latrines, and while they have access to the river, they already have a clean and
comfortable feces disposal system. Therefore, why bother to change OD behavior?
Less frequently mentioned hindering factors include lack of social cohesion in NOT ODF
communities, which made collective effort or change more difficult, and progress monitoring of
no interest to anyone. Both ODF and NOT ODF communities agreed that the poorest families—
such as the households of widows or the infirm and aged—do face a resource crunch to build
anything. Such families lack able-bodied men and cannot afford to pay laborers. ODF
communities helped these families acquire sanitation facilities through gotong royong twice as
often as did the NOT ODF communities.
FIGURE 14: WHAT HINDERED COLLECTIVE BEHAVIOUR CHANGE—VILLAGERS’ OPINIONS

71
NOT ODF communities also reported more technical problems such as rocky soils making
digging harder and more expensive, swampy areas requiring special and expensive latrine
technologies and having poor access to markets. Ineffective triggering was cited as a hindering
factor by eight out of 40 Not ODF communities. While latrine sharing by non-owner
households is often encouraged by sanitation programs for the sake of collective behavior
change, it goes against local cultural norms. Focus groups in several districts reported that it is
considered a taboo to defecate in a neighbor’s house. Even elsewhere, sharers harbor a deep
sense of embarrassment about sharing on a regular basis. Many sharer focus groups reported
that they prefer to practice OD rather than share, and ask neighbors’ favor to use their latrines
only in an emergency, when sick, at night, or in bad weather.
6.6 External and Internal Subsidies Associated with Different Results
As of September 2008, subsidies for household facilities are no longer provided by the Health
Ministry, in accordance with the new national STBM (Sanitasi Total Berbasis Masyrakat)
strategy. However, the study found subsidies for household latrines and free communal
facilities still being provided in all districts by programs of other Ministries, local governments
and the private sector. Nearly half the sample communities had received some forms of
external subsidies. They were in the NOT ODF or LATE ODF groups.
72
Table 13 below shows that apart from externally provided subsidies, there were subsidies that
were made available by village chiefs impatient to have their communities declared ODF. These
subsidies were funded through creative utilization of village development funds by village
chiefs. The subsidies were targeted accurately to all non-owners of latrines, and their
utilization was followed up by village leaders. Thus they helped achieve collective behavior
change targets, although the behavior changes were sustained only in communities with
continued behavior monitoring and sanctions against open defecation. In comparison,
externally provided subsidies from the government or the private sector reached only a few
selected community households and did more harm than good, because they encouraged the
remaining households to hope and wait for further subsidies and take no self-help action. All
communities that had received external subsidies were found in the NOT ODF category.
Also observed in two NOT ODF communities were some examples of brand new communal
latrines kept locked up and unused by anyone. They were built by the national PNPM program
for community infrastructure development in poor villages. Families living close to them had
locked them up, fearing use or misuse by all and maintenance by none, which could result in a
an undesirable condition next to their homes

73
TABLE 13: SANITATION SUBSIDIES RECEIVED AND BEHAVIOR CHANGE OUTCOMES
Form of
Subsidy
Provided
Type of
Community
that Received
Provided by Result
Wooden lids
for all open
pits
10 percent of
QUICKLY ODF
communities
Village chief, using village
development funds
20 percent of the lids had been lost
or damaged and not replaced, two
years after ODF certification.
Cement closets
made by local
mason for all
non-owners of
latrines
5 percent of
QUICKLY ODF
communities
Village chief, using village
development funds
Cement pans are in use, but user
households planning to upgrade to
ceramic pans as soon as they can
afford.
Ceramic closets
to all
households
without
latrines
20 percent of
LATE ODF
communities
Village chief, using village
development funds and Desa
Siaga (MOH) funds meant for
building birthing clinics
Targeted distribution and
follow up by village chiefs and
village government members
ensured all households
constructing latrines.
OD into rivers continues, in one
fifth of all LATE ODF
communities
Ceramic closets
for a few
households
20 percent of
NOT ODF- High-
coverage
communities
10 percent of
NOT ODF-low-
coverage
communities
Private sector agencies
P.T. Sampoerna and
Bank Mandiri, using
Corporate Social
Responsibility funds
National community
development program
(PNPM)
P2KP (Urban Poverty
Program )
After triggering the remaining
households kept waiting for other
sources to come and offer
subsidized latrines
Free communal
latrines built
20 percent of
NOT ODF-high-
coverage
communities
National community
infrastructure
development program
(PNPM)
Public Works
Department
New facilities from PNPM kept
locked up by families living
close to them, no one uses
them.
Old facilities built by Public
Works damaged and defunct.
Community does not want to
repair them - they discharge
directly into the river.
Soft loans for
building
latrines to
some
households
15 percent of
NOT ODF-high-
coverage
communities
10 percent of
NOT ODF- low-
National community
infrastructure program
(PNPM)/ Poverty
alleviation fund (Gardu
Taskin)
LG Health programs
All credit schemes stopped
revolving funds as receivers did not
repay loans and could not be made
to.

74
coverage
communities
(Gerbang Mas, Poltekes)
National RWSS project
WSSLIC 2)

75
6.7 Behavior Change—Whose Priority Is It?
“If they (outsiders) want to speed up access to latrines in the village, the government has
to provide subsidies, specially for the poorer classes.”
—Ibu Budi Margono, Wife of Kepala Desa, village Tamanan, district BONDOWOSO
“Better to use the money for children’s schooling than for building latrine.”
—Ibu Lilik, Woman from village Seketi, district KEDIRI
Analysis shows that a lack of progress after triggering in NOT ODF communities identifies
multiple reasons other than poor triggering. Table 14 shows that a range of factors worked in
combination to delay or arrest progress. Firstly, demand for change is difficult to ignite in
riverbank communities. Further, poor quality triggering, and particularly facilitators telling
communities to build latrines during triggering hampers the build up of community desire to
change behavior. Due to a history of subsidized sanitation programs, any advice from
outsiders’ to build latrines immediately changes the discussion to one about how to get free or
subsidized latrines. Thereafter no commitment for action can be catalyzed because all start
hoping and waiting for subsidies. In several NOT ODF communities large crowds that had
gathered for triggering dispersed as soon as the facilitator clarified that no latrine packages or
other subsidies were being offered. Many people did not believe that subsidies will not
ultimately be provided and chose temporary solutions like putting lids on open pits, or
expecting to upgrade to pour-flush latrines as and when subsidy packages became available
(see Table 14).
TABLE 14: SUMMARY OF PROGRESS AFTER TRIGGERING IN 40 NOT ODF COMMUNITIES
Progress after
Triggering
NOT ODF
Communities
Reporting
(N=40)
Associated Factors Reported
No progress at all
(Less than 10
households changed
behavior)
16 On riverbank, prefer to go to river,
Waiting for subsidy,
Have fish ponds to feed,
Transportation access poor -
Very slow progress
(10 -15 new
households built
latrines in a year )
13 Facilitator advised them to build latrines during
triggering
Lack land to build latrine away from dwelling unit
and therefore want only pour flush system which
can be built in or near home—but think it costly and
will build only if given subsidy.
On riverbank
Started but soon
stopped
11 Put lids on open pits, then did not upgrade, and
waited for subsidy. (After 1-2 years half the lids
were damaged or lost,and not replaced

76
6.8 Strategies Used to Overcome Obstacles to Progress
ODF and NOT ODF communities were markedly different in their strategies to overcome
obstacles in their way to becoming ODF. Table 15 illustrates ways in which they responded to
hinderances.
While the QUICKLY ODF communities were consistently better at managing the behavior
change process, both QUICKLY and LATE ODF communities focused on identifying and
changing specific behaviors rather than just getting people to construct latrines. The leaders of
QUICKLY ODF communities also instituted various disincentives designed to change behavioral
norms and make open defecation socially unacceptable. At the same time they also devised
ways to bring the preferred kinds of latrines within economic reach of the households. Unlike
in the NOT ODF communities, the leaders and sanitation committees of ODF communities
neither expected nor attempted to obtain external subsidies. These findings emphasize the
importance of finding ways to ensure that village leaders are the ones leading the collective
change movement. Indonesia’s paternalistic community leadership tradition is very effective in
ensuring rapid communitywide change if the formal and informal leaders are convinced about
its need (Table 15).
TABLE 15: STRATEGIES USED TO OVERCOME OBSTACLES TO PROGRESS
Obstacles How ODF Communities Responded How NOT ODF Communities
Responded
Open
defecation
being a normal,
socially
accepted way
of life
Specific behaviour changes promoted and
monitored through multiple channels: village
institutions/ religious leaders/
schools/kaders/bidan desa
o Stop OD – especially in river
o Cover open pits
o Share others’ latrine till own built
o Build own latrine
Focused mainly on getting
people to build latrines –
monitored only construction.
Termite
destroying
latrine pit
covers
Promoting metal or plastic covers instead of
wood; making available covers for affordable
price, with Village chief’s order to cover pits
and sanction for not doing so
No action
People
unwilling to
give up OD in
river/ build
own latrines
Gotong royong to build latrines for all
interested, as well as uninterested, to shame
them into compliance (message “We will build
latrines for those unable to help themselves.”
meant to embarrass them into compliance).
Sanctions/reprimands for people found OD-
ing in river
Not interested in stopping
river OD. Think it is
clean/convenient/free
/enjoyable/does not harm
people or environment, and
feces “ not something to
keep”

77
Public latrine with septic tank built near river
Hanging latrines over river dismantled -
Latrine owners requesting OD-ers to share
their latrines instead of Open Defecating
Village leaders motivating people with
reference to stinking river in dry season
Gotong royong in groups to
build latrines for group
members (cuts labor costs)
No action to overcome –
Committee persuaded
poor OD-ers with
examples of other poor
OD-ers who had
changed behavior and
built latrines
Open pit
latrine users
unwilling to
upgrade
Sanctions -public shaming and reprimands
from community leaders for continuing
Home visits by Bidan and
village volunteers to
persuade them to change –
no effect

78
TABLE 15 (CONT): STRATEGIES USED TO OVERCOME OBSTACLES TO PROGRESS
Obstacles How ODF Communities Responded How NOT ODF Communities
Responded
People’s
perception that
a hygienic
latrine is too
costly
Facilitated supply or financing:
Committee worked out Rp.59000 offset-pit
latrine design with local mason, organized
bulk buying of materials to lower cost
Project-trained masons provided technical
guidance to build hygienic latrines on small
plots / options for cost reduction
Bidan desa, village government and local
mason developed a community contributory
scheme and supply network to make available
materials, skills and affordable financing for
needy people interested in building latrines
People saving up to add to lump sum savings
that will be possible after harvest/in fishing
season, to build latrine
Installment payment terms to
masons/suppliers arranged by village
government on behalf of village residents
Loans made available by village government to
households from PNPM funds given to
community
Subsidies:
Waited for subsidy /did not
believe that there could be a
sanitation program that did
not provide construction
subsidy
Distributed free closets
using village development
funds
Gave credit from WSLIC
funds (it stopped revolving
after the first few
recipients)
Sent proposals to SANIMAS
//Public Works Dept for
building communal latrines-
still waiting
Planned arisans (did not
materialize)
Facilitated supply/financing:
Arranged instalment
payments to mason Rich
hhs. built water reservoir
for their own plus
neighbors’ use for flushing
Supplies bought through
neighbors going to town
(market access low)

79
Figure 15: Sanitation Ladder Derived from 574 Latrines Observed in 80 Communities
Rp.5-12 million

80
Figure 16: Sanitation Ladder of Facilities observed in 80 Communties, Pictorially

81
VII. What People Have Invested in and Why
Key Findings
The principal strategy used in 60 percent of the sample communities to become ODF,
was to build new pour-flush latrines. Twenty percent of communities had chosen to
become ODF mainly by building new improved pit latrines, 17.5 percent communities
had become ODF by adding wooden lids on existing pit latrines, and 2.5 percent had
built new offset pit latrines with lids.
Even poor households had spent around Rp. 300,000 (US$33) to build the cheapest
improved pit latrine. Wherever water for flushing is not scarce, the poor reported a
preference for the smell-free pour-flush water seal latrine, which the market currently
offers at four to five times the price of the improved pit latrine, which the poor find too
expensive.
In nine percent of the sample communities, Sanitarians and project-trained masons
trained were found to be offering starter-level pour-flush systems at Rp 300,000 which
were upgradable over time with additional investment, or basic pour-flush systems
with a single leaching pit at Rp.750,000, with installment payment plans. These service
providers have large backlogs of orders that they are struggling to fill.
The local mason resident in the community is the primary source of information to
consumers about the types of latrine to build, and the primary construction service
provider. He is unaware of, and not providing information on, the low cost sanitation
options being promoted by the project based on market research. Most locally resident
masons missed out on training provided by the project.
People in NOT ODF communities responded with keen interest to low cost options,
particularly for the pour-flush latrines. When shown the TSSM Informed Choice
Catalogue (ICC), consumers initiated action in 11 out of 40 NOT ODF communities to
choose and construct one or more options from the ICC.
7.1 What Consumers Are Building—At What Cost and Why
In each of the 80 communities visited, researchers observed 9 latrines in the homes of rich,
poor and in-between households, in order to understand their preferences and ability to pay.
From the total 720 latrines thus observed, 146 were later found to have been built before
project intervention and information about them was excluded from this analysis as the
construction costs of much older latrines were not comparable with those built during the
project period. The data presented here is from 574 latrines constructed during the project
implementation period and interviews with the 574 owners. Table 16 and Figures 15 and 16
present a sanitation ladder showing what different classes of consumers have chosen to spend
on and build.

82
TABLE 16: SANITATION LADDER DERIVED FROM 574 HOUSEHOLD (HH) LATRINES
OBSERVED IN 80 COMMUNTIES
HH
welfare
category
Total
HH
latrines
obser-
ved
Hang-
ing
latrine
on fish
pond
Direct
or
offset
simple
pit
latrine
w/o
cover
Direct pit with
cover made of
Offset
pit
ceme-
nt slab
latrine
with
cover
Pour-
flush,
water
seal,
cement
pan, 1
leach
pit
Pour-
flush
water
seal,
ceramic
pan, 1
leach
pit
Pour-
flush
water
seal,
ceramic
pan
2pits/s
eptic
tanks
Pour-
flush
water
seal,
ceramic
pan, 2-3
septic
tanks +
bath-
room
Bam-
boo/
wood/
plastic
Cement
slab
Poor 187 2 3 72 7 7 16 25 21 34
In-
between
203 1 3 25 7 3 20 25 19 101
Rich 184 5 1 4 13 6 10 145
Total 574 3 6 147 15 14 49 56 50 280
The sanitation ladder above and in Figure 15 illustrates the observed stepwise progression of
facilities built with increasing cost. Depending on what a household could afford and chooses
to invest in, open defecator household entered the ladder above at any level from 1 to 6.
While observing 574 homes and latrines of the poor, rich, and in-between households, the
researchers asked the owners why they had chosen to invest in those particular types of
latrines. The reasons given by latrine owners are summarized in Table 17.
The first, no-cost change that the poorest had made to stop open defecation was to dig a simple
dry pit latrine (cemplung) and cover it with locally available material like bamboo and wood.
Many bamboo and wooden covers did not remain tight fitting after one rainy season. If there
was construction material leftover from their own or a relative’s home renovation, then they
used it to reinforce the pit and cover it with a cement slab. Alternatively bamboo was used to
reinforce pits. Following CLTS triggering, these pit latrines were quickly fitted with well fitting
lids of wood, metal or plastic. All these changes were estimated to cost up to Rp. 300,000
(US$33)28 but were not usually paid in cash, as the leftover material came free of cost and the
28 Cost calculations were done with latrine owners. All latrines costed and reported here were built during the project
period, i.e., within the last 2.5 years, and recall of costs was fairly accurate. Owner households were able to provide actual
cost figures for latrine parts and building materials when they had bought them, daily wages for skilled and unskilled labor,
and the value of what was available free of cost, including their own labor for digging pits.

83
household members contributed labor. The rich households did not build dry pit latrines
unless they lived in a water-scarce area where water was unavailable for flushing.
TABLE 17: WHY POOR/RICH/IN-BETWEEN HOUSEHOLDS CHOSE TO BUILD DIFFERENT
LATRINE TYPES (Brackets show frequencies of reasons stated by owners*)
HH
Cate
gory
HH
latrines
observed/
owners
inter-
viewed
Direct pit (Cemplung)
with cover made of
Offset pit cement
slab latrine with
cover
WC Pour-flush,
water seal, cement
pan, 1 leach pit/2
pits/septic tank
Pour-flush
water seal,
ceramic pan, 2-
3 septic tanks +
bathroom
Bamboo/
wood/
plastic
Cement
slab
Poor 187 Cheap and
affordable,
though
smelly;
materials
locally
available;
free (42)
Enough
land (14)
No water
for
flushing
Building
materials
leftover
from own
or relative’s
house
building
(29)
Can
upgrade
later to
pour flush,
water seal
(2)
More durable and
cleaner than
cemplung/feces not
visble/no flies (8)
Comfortable/conven-
ient, but not smell-
free (4)
Cheaper than WC (8)
Easy to clean (8)
No flies or
mosquito/no
smell/feces not seen
(6)
Comfortable/conven-
ient/ no fear (6)
Safe/durable/strong
(6)
Practical for small
Got subsidy
package (8)
Septic tanks take
many years to
fill (2)

84
(10) plots (2)
In-
between
203 Affordable
/material
locally
available
(18)
Building
material left
over (17)
Can up-
grade later
to WC (3)
No water
for flushing
(8)
Best compromise
(WC too expensive
but don’t want pit
latrine) (9)
Affordable/cleaner
and more durable
than pit latrine (8)
Aesthetic/easy to
clean/feces not seen
(38)
No smell/no
pollution (24)
Affordable (19)
Fits small plot (18)
Will not collapse/
safe/durable (11)
Comfortable/conven-
ient (15)
Only type possible
for swampy area (1)
All reasons from
previous column
and:
2-3 septic tanks
won’t fill quickly
(9)
Want same as
neighbor’s
facility (2)
Rich 184 No water
for flushing
(8)
Reasonable cost (8)
Clean/comfortable
(6)
Safe/durable (1)
Bargain, group action
and uniform design
lowered costs (1)
The Rich do not build
latrines with cement-
cast pans
Aesthetic/
hygienic/
Easy to
clean/feces not
seen (37)
Strong/lasts
many years w/o
maintenance
(23)
Fits small
plots/can be
outside home
(5)

85
Comfortable/
convenient (33)
Prestigious/mod
ern (26)
Suitable/
affordable (11)
* Numbers may not sum up exactly as many owners cited more than one reason for choice
The cheapest permanent latrine constructed by the poor as well as the middle-income classes
was the offset pit latrine (plengsengan in Indonesia), at Level 3. Usually the pit was partially
reinforced with two concrete rings, covered with a cemented slab with in-built pan and fitted
with a wooden lid. It cost between 300,000–500,000 (US$33-55), of which only the materials
were paid for and the labor contributed by the household. The plengsengan was described as
“the best compromise” between the direct pit latrine, which people do not really like but find
very affordable, and the pour-flush water seal latrine with leaching pit, which is considered
highly desirable but too expensive by the poor households. The rich households built an offset-
pit latrine only if conditions of water scarcity ruled out the use of pour-flush systems.
Level 4 was the basic model that the poor consumers said they really want—a pour-flush
system with a ceramic pan and water seal, and a single leaching pit reinforced with two
concrete rings. Interviews with latrine owners clarified that such a smell-free and easy to keep
clean facility is the latrine that poor consumers aspire to get if they can afford it (see Table 17).
Middle-income consumers building their first permanent facility tend to enter the sanitation
ladder at this level, except in areas where water is scarce and not available for flushing. The
poor also reported wanting this and often put off constructing a latrine until they can afford
this type. The Level 4 latrines observed in the communities had cost their owners Rp. 1-1.5
million (US$110-166) to construct.
In 9 percent of the sample communities the Level 4 latrines were found to cost much less,
around Rp. 750,000 (US$83), where project-trained masons had offered various lower-cost
options for the facility as a result of their training. All the poor customers in those communities
had gone directly for pour-flush systems as their starter models. This indicates that while the
poor are able to spend around Rp. 300,000 for the cheapest improved pit latrine, what they
really want is the pour-flush water seal (smell-free, easy to keep clean) latrine and are willing
to stretch their resources to Rp. 700,000-800,000 for it. The market however, still offers it at a
price 50 percent higher than that, except where project-trained Sanitarians/masons are
offering lower cost solutions and easier payment options
Levels 5 and 6 were built only by the rich villagers. They comprised the same pour-flush
systems but with higher quality ceramic pans and added features like twin pits, septic tanks,
latrine+ bathing facilities and luxury features like tiled floors and walls. Costs went up to Rp. 2-

86
12 million (US$222 – 1333) with the quality of the facility and materials. Motivations like
prestige and competition with neighbors entered the decision-making process in the upper
classes. The rich households invested at one go to get the benefits they want, unlike the middle
and the poor classes, who upgraded progressively at harvest time, before family weddings, or
through deferred and installment payments. The following quotes illustrate the types of
rationale behind investment decisions of the households in the three welfare categories.
“It is good to build an ideal facility the very first time—so that we can enjoy its benefits
for a long time without incurring repair costs and maintenance problems. Such facilities
fit our lifestyle.” —Rich household, owner of Level 6 latrine, Morkolak Timur/
Bangkalan
“We have to consider many things before deciding what to build, such as affordability of
the technology, availability of land to build on, availability of water and building
materials.” —Middle-class household, owner of new Level 4 latrine, Kayoran/Kediri
“Even if loans were available to improve our latrine we don’t want to take on the burden
of debt for that purpose. Loans are more justified for reasons like children’s education or
buying livestock. After harvest if we have some surplus money, we’ll think of upgrading
the latrine.” —Poor user of dry pit latrine, with a wooden plank lid. Banyumas/
Pamekasan
7.2 Sanitation Solutions Chosen for Becoming ODF
Analysis of the types of actions taken in the 40 ODF communities corroborated the pattern of
people’s investment preferences (seen in the 574 latrines observed in all 80 communities). The
communities visited were able to provide monitoring records to researchers about all facilities
built or improved after triggering in order to become ODF. Figure 17 shows the solutions
predominantly chosen by communities that took action to improve their sanitation facilities
following triggering.
Predictably, the most preferred strategy was to build pour-flush water-seal latrines with
ceramic pans. Sixty percent of communities became ODF mainly by building these facilities.
This confirms the findings from the project market research study by Nielsen (2009), which
found that people’s “ideal” latrine is this type, along with the feature of 3-4 years’ usability
before the pit needs emptying. However, households that could afford such facilities had spent
upwards of Rp.1.5 million to acquire them. There were many who could not, and had built dry
pit latrines with lids instead, or simply added close fitting lids on existing pits. The latter two
groups, comprising 38 percent of the total, reported aspiring to the “ideal” system at some
point in the future, if and when they can access that much money. A fifth of the communities

87
became ODF by building new pit latrines with lids. Another 17.5 percent added tight fitting,
durable wooden lids on their open pits. All latrine-less households in one community out of 40
bought a low-cost offset pit design developed locally.
FIGURE 17: SANITATION SOLUTIONS PREDOMINANTLY CHOSEN BY COMMUNITIES TO
BECOME ODF
Some variations were observed in the quality and costs of facilities built in the QUICKLY and
LATE ODF community categories. The improved pit latrines and pour-flush latrines built in
LATE ODF communities were of higher quality and cost about 50 percent more than those built
in QUICKLY ODF communities. To accelerate access for all households, the QUICKLY ODF
communities had used cost reduction strategies like bulk purchase of supplies, uniform
designs, free community labor and the most basic models that all could afford. Gotong royong
over short periods of 1-2 weeks had resulted in whole communities getting their facilities
completed. One village chief boasted their doing “10 latrines a day.” In LATE ODF communities
there was no group effort in construction. Individual households built a greater variety of
facilities, took several weeks or months to build, and built more durable and higher quality
permanent structures (see Table 18). But open defecation continued in a fifth of LATE ODF
communities, even after all households had acquired better quality latrines.
TABLE 18: COSTS OF LATRINE TYPES BUILT AFTER TRIGGERING IN ODF COMMUNITIES
Types of Latrines Built after
Triggering
Range of Costs of Observed Latrines (Average Cost in Brackets)
QUICKLY ODF communities LATE ODF communities
Improved pit latrine with lid Rp.25,000–350,000
(Rp.131,000/US$14.24)
Rp.67,000–500,000
(Rp.290,000/US$31.52)

88
Offset pit latrine with cemented
slab
Rp. 59,000 (US$6.41) + self-
contributed labor
Not found
Pour-flush, single and double pit,
with or w/o bathing facility
Rp.700,00–2,500,000 (Rp.
1,485,000/
US$161.41)
Rp. 1,300,000–4,000,000
(Rp.2,334,000/US$253.70)
7.3 Types of Additional Facilities Built Along with Latrines
Researchers observed 307 and 276 facilities respectively in ODF and NOT ODF communities.
roughly in equal proportions in homes of rich, poor and middle/In-between households. Apart
from the quality of materials and construction, variations were observed among different
categories of households in terms of additional hygiene facilities they had built (see Figure 18).
With increasing economic capacity consumers tend to add additional facilities to basic latrines,
such as washing and bathing facilities and piped water supply. Fifty percent of the total
facilities observed were found to be latrine with bathing and washing facilities, and were
mainly in the homes of the rich and the middle-class. The poor households had built only their
basic latrine, unimproved or improved pits or pour flush pans, often with only grass matting or
fabric sheets for enclosure and no roofs. The in-between class households had more
permanent enclosures and about half had added a bak (water storage facility) for flushing and,
where soap was visible, for handwashing. The baks in middle/in-between class households
were manually filled. The rich invariably had large baks and piped water supply along with
their latrines, as the water storage facility was also used for bathing.
FIGURE 18: ADDITIONAL FACILITIES IN 574 LATRINES OBSERVED IN ODF AND NOT ODF

89
COMMUNITIES
Handwashing facilities were included in latrines twice as often in ODF communities as in NOT
ODF communities, which could be an indicator of behavior change (see Figure 18). As reported
in Chapter 3, schools in ODF communities were also found to be equipped with functioning
handwashing facilities more often than schools in NOT ODF communities.
7.4 Local Market Offerings for Consumers
Latrine owning households were interviewed about their sources of pre-purchase information
and sanitation service providers. Figure 19 shows that the local mason resident in the
community or the neighboring community emerged as the primary source of information and
advice about what kind of latrine to build. People consulted the local mason 38 percent of the
time, and asked their neighbors or relatives who had latrines another 28 percent of the time.
The same mason who was consulted for advice also constructed the latrine 55 percent of the
time. The owners provided the labor in 34 percent cases, and built their own facilities without
the mason’s help in 16 percent cases. Eleven percent latrines were built through gotong
royong. However, very few of these local masons had been included in the mason training
provided by project, because they did not meet the qualifying criteria in terms of formal
education, which had been determined jointly by the training institution (Institute of
Technology, Surabaya) and local governments.

90
FIGURE 19: SOURCES OF INFORMATION, ADVICE, AND SERVICES FOR SANITATION
IMPROVEMENTS
Latrine owners in 80 communities reported that the Sanitarians (trained by the local
government in the pre-project era) and the local masons resident in the communities had both
advised clients about one or two standard “ideal” designs of a pour-flush water seal latrine
with two-stage septic tanks. This costs around Rp. 2-3 million and is beyond the reach of most
poor and even middle-income households. Thus the masons had ended up serving mainly the
upper classes. This has helped popularize the myths that good quality, hygienic latrines are
expensive and affordable only by the rich, and that the only such latrines are the ones with
ceramic pans, water seal closets and two-stage septic tanks. The project mason training had to
be deliberately designed to dispel these myths and spread awareness of lower cost hygienic
latrines. The next section reports some effects of that training.
The Informed Choice Catalogue (ICC) designed for the project offers five progressively higher
design options costing between Rp. 250,000-1,00,000 (US$28-110) with possibilities of further
cost variations with different building materials within each design. The ICC was developed

91
before market research29 was completed in the project, and does not include the options that
most poor consumers are looking for, i.e. pour-flush water seal latrines with ceramic pans
which can work for three to four years without further maintenance costs (see Level 4, Figures
15 and 16, and the gap between T4 and T5 in Figure 20), starting at around Rp. 300,000.
In nine percent of the sample communities the study found Sanitarians and project-trained
masons trained who have identified this gap in the market. In Ngganjuk, Lumajang and several
neighboring districts they have begun to offer starter-level pour-flush systems with ceramic
pans and single ring-lined pits at Rp 250,000, which can be upgraded in 1-2 years’ time with an
additional Rp. 100,000-300,000 investment in better reinforced pits or septic tanks. These
providers are experiencing very high demand for their services and have large backlogs of
orders that they are struggling to fill. Box 7 shows an example of what they are offering.
FIGURE 20: TSSM INFORMED CHOICE CATALOGUE OPTIONS
7.5 Trained Masons, Entrepreneurs, and Informed Choice Catalogue:
Are They Making a Difference?
TSSM–trained masons resident in the community were encountered only in nine percent of the
sample communities. Where they were found, they were:
29 Total Sanitation and Sanitation Marketing Research Report by The Nielsen Company. Prepared for the World Bank
Water and Sanitation Program, March 2009.

92
Offering lower cost versions of the consumers’ first preference i.e., pour-flush systems
with ceramic pans at Rp. 250,000-750,000 (market price is Rp.1.5 million upwards),
and a locally-designed offset pit latrine at Rp. 59,000 + own labor (market price
Rp.400,000).
Providing designs upgradable over the next one to two years (market offers one or two
standard and fixed designs)
Offering installment payment facilities of Rp. 20,000–50,000 monthly. Installment
payments for sanitation is not common market practice yet.
Producing very low cost cement pans using capital credit provided by the village chief,
in response to community demand.
In these communities the consumer response was high and all poor consumers building
their first latrines had opted for the affordable pour-flush water seal systems. In one
community all households without latrines, poor, rich and in-between, had chosen the
offset pit design at US$6.75, made possible through design innovation, economies of scale
in materials and building process, and no labor costs as this was contributed by all
community households. The supply improvement challenge now is how to make all local
masons function in these ways.
Local masons trained by the project were hard to find in the study communities, for
reasons explained in Box 6. Nine percent of communities had local masons oriented by
project-trained Sanitarians who were building service provider networks using local
masons. They themselves were functioning as sanitation entrepreneurs because of the
large volume of orders they have received.

93
Low-cost pit reinforcements of
bamboo made locally.—Dusun
Mantren/Bojonegoro
Project-trained local mason’s production in
response to community demand, using capital
provided by Kepala Desa, Kemamang Balen/Bojonegoro.
Box 7 shows an example of what one such highly successful entrepreneur is offering. Local
masons in Ngganjuk and Kediri districts were found to be using this promotional handout in
their interactions with prospective customers. The handout in Bahasa Indonesia, designed by a
sanitarian-turned entrepreneur, illustrates how choice has expanded for poor consumers in
some districts, filling the gaps between options T4 and T5 of the ICC (Figure 20). This home-
grown ICC showing progressively upgradable options for the kind of latrine the poor
consumers want (ceramic, water seal closet with simple leaching pit), for Rp.180,000 (US$20),
provided the customer contributes labor for digging the pit.
The handout informs that the basic model’s pit will fill in two year’s time, by which time the
owner can upgrade to getting a septic tank and have the existing closet connected to it for
additional cost. Alternatively, the customer may choose to dig bigger pits and buy the Rp.
650,000 or the Rp. 800,000 model with septic tanks of larger capacities. The entrepreneur is
BOX 6: WHY WERE PROJECT-TRAINED MASONS NOT FOUND IN COMMUNITIES?
A review found that the mason training missed most of the local masons living in the
communities. The training was designed and delivered by the ITS Technology Institute,
Surabaya before the Nielsen market research had identified the centrality of the local
mason’s role in the consumers’ decision making process.
ITS specified qualifying criteria for trainees to district Health offices, which selected the
trainees from sub-districts. The criteria were such that most local, uneducated masons
did not qualify. The required number of better-educated and qualified masons were hard
to find and the shortfall was made up by selecting technically able villagers or hamlet
chiefs, and Sanitarians, who are puskesmas staff responsible for environmental
sanitation, and have the required qualifications. Training was delivered, at a level that
catered to the better-educated trainees. which possibly further disempowered the local,
untrained masons included among trainees. After training the better-qualified masons
tended not to remain in villages. They migrated to cities, or even to neighboring
countries. Thus, the only project-trained personnel active in communities after training
were the Sanitarians who were already inclined towards sanitation business activities,
and the small minority of local masons – of the kind that were found in nine percent of
communities in this study.

94
offering product and service guarantees of two, four, and eight years for the three models,
discounts for orders of 10 or more units, and different rates for out-of-district orders. For each
option, he lists the brand and cost of materials that will be used, specifies the size of the pit to
be dug by the household, and provides contact telephone and e-mail information of the
entrepreneur. The single-page handout is a good example of attractively packaged information
on options, which makes it easy for consumers to make their investment decision.
Village leaders had stepped in, in Jetis and Mantren/Bojonegoro, Kare and Gruwul/Madiun,
Jeding/Blitar and Tambak/Nganjuk, with crucially needed financing support to consumers or
to service-providers like these, using village funds from poverty alleviation or other programs.
This has enabled poor consumers to pay for their facilities in installments or make payments
after harvest or fishing seasons.

95
BOX 7: NEW OPTIONS AND PRICES THAT POOR CONSUMERS ARE LOOKING FOR
7.6 Low-Cost Sanitation Options Not Yet Widely Disseminated
The Informed Choice Catalogue (ICC) was designed as a communication aid to be used by
masons in explaining options to customers and for working out cost estimates based on
customer preferences for materials underground, on the ground and over the ground (see
Figure 20). The ICC was meant to be provided to masons trained by the project, but its
production was delayed and it was not available at the time of training. WSP supplied copies to
District Health offices later, with agreements about having them distributed to the trained
masons through the Puskesmas outreach staff.

96
The action researchers found that local masons in the 80 communities had neither received
nor ever seen the ICC. A few Puskesmas staff, Sanitarians, and Bidan desas had received them,
but being unclear about their purpose, had not used them with community members.
Information on low-cost improved sanitation options therefore had not reached the
community, except in the nine percent where trained masons were found.
The researchers showed the ICC to focus groups in NOT ODF communities, demonstrated its
use to local masons and left behind one copy in each NOT ODF community. Of the 40 NOT ODF
communities, no interest was shown in the ICC in 10 percent of communities, (these were on a
riverbank). In general no community showed any interest in the dry pit options in the
catalogue. However, in 21 out of 40 NOT ODF communities, consumers showed keen interest in
the pour-flush options, and in 18 of those communities immediately initiated discussions with
local masons about building one or more pour-flush options from the ICC. At the time of
writing this report, three months later, information has been received of many new
constructions in those communities.

97
III. Institutional Roles for Rural Sanitation Improvement
The Health Ministry is the institution responsible for policies and overall strategic direction
setting for the rural sanitation and hygiene sector in Indonesia. The country being highly
decentralized, the central government ministries do not have direct control of program
implementation in the provinces and districts. District governments have full authority and
responsibility to plan and implement development programs including rural sanitation and
hygiene improvement. This was the rationale underlying the project’s approach of partnering
with district government institutions for implementation, thereby influencing the way local
governments would continue to manage rural sanitation programs beyond the project period.
In a sector accustomed to decades of subsidized latrine package distribution and health
education, the project introduced new approaches like sanitation demand creation, market
supply improvement, and enabling policy and institutional environment building. Indonesia’s
2008 national total sanitation strategy, the Sanitasi Total Berbasis Masyarakat components
reflect the same approaches. There are thus institutional imperatives for local governments to
adopt, internalize, and develop competencies in executing the approaches introduced by the
project. However, existing human resources and skill profiles in provincial and district health
agencies are not geared to manage all the new functions.
The project provided Resource Agency (RA) consultants to work hands-on with district
government personnel to build institutional capacity. Market research and communication
development agencies were contracted to provide district governments with bases for
decision-making regarding supply improvement and mounting behavior change
communication campaigns respectively.
The way in which project technical-assistance-flows have influenced results on the ground was
observed in this study. From the findings inferences have been drawn about institutional
strengths and weaknesses to plan, implement and monitor programs to achieve national rural
sanitation goals (i.e., Indonesia ODF by 2014) and the country’s sanitation MDG targets. The
findings and implications were discussed with district, provincial and national government
stakeholders for the future of rural sanitation programs in Indonesia. The results of those
discussions are reported in this chapter.
8.1 Capacity and Incentives for New Roles and Program Approaches
The action research results indicate that the project has had reasonable success with building
district capacity for community level demand creation through on-the-job CLTS triggering
training. Through eight to nine months of technical assistance to each district, and periodic

98
cross-district learning analysis and strategic planning workshops, district governments have
also gained experience and knowledge about improving their enabling environments (program
policies, institutional practices, planning, monitoring and evaluation methods) and enhance
program financing. There is sufficient evidence in district budgets and strategic plans now to
believe that the improved policies and practices for rural sanitation program will be sustained
beyond the project. However, the market supply improvement component has left the local
government institutions largely untouched.
During the project, WSP contracted market research and communication design agencies to
develop and implement a marketing strategy and Behavior Change Communication (BCC)
campaign. There has been limited acceptance and utilization of the campaign materials by local
governments. The marketing strategy trained masons and Sanitarians in every district, but due
to mis-targeting, locally resident masons in the communities, who are the principal sources of
advice and services to consumers for construction did not benefit from this training. Thereafter
the marketing strategy was modified and WSP is currently helping and mentoring sanitation
entrepreneurs to improve local sanitation supply chains for delivering affordable sanitation
options to consumers.
Post-project in other provinces, WSP will not be managing the sanitation marketing function,
which needs to become an institutional responsibility. However, from the project experience in
East Java, it is unclear how local government Health offices will be able to take on this
management task,30 since the action research found that they still do not consider sanitation
marketing activities as part of their sanitation programs. Nor do they have the budgets, skills
and experience of managing such activities. This presents an anomaly because demand
creation and availability of sanitation improvement options have to mutually reinforce each
other. Creating demand can be futile or even counter-productive if local markets do not offer
affordable and desirable options to all classes of consumers. Rural program managers cannot
afford to neglect either demand creation or supply improvement facilitation.
Table 19 analyzes the current situation in terms of institutional capacity and incentives
currently available for four critical aspects of rural sanitation programs. It shows that except
for the function of demand creation through CLTS triggering, district governments have little
incentive or capacity at present for the rest of the aspects of rural sanitation programs.
30 A similar situation was found in Vietnam, where sanitation marketing interventions piloted by International
Development Enterprise (IDE) did activate rural sanitation markets and three years later service providers continue to
thrive and access to improved sanitation had grown by 15 percent. However, local governments have not scaled it up or
allocated budgets to support long-term sustainability of sanitation marketing. Nor have any of the IDE pilot areas become
Open Defecation free (Sijbesma and Devine, 2010).

99
TABLE 19: CURRENT DISTRICT GOVERNMENT INSTITUTIONAL CAPACITY AND
INCENTIVES FOR ESSENTIAL COMPONENTS OF RURAL SANITATION PROGRAM
Functions
Required for
Total
Sanitation
Outcomes
Is There Institutional Capacity to
Support This Function?
Is There Institutional Incentive to
Support This Function?
Public demand
creation for
improved
sanitation and
hygiene
facilities
Ministry of. Health (MOH)
agencies have the necessary
community outreach capacity and
the official mandate for
improving rural sanitation and
hygiene.
CLTS facilitation skills of
outreach staff still need to be
strengthened for high quality
CLTS processes and outcome
monitoring.
No institutional incentives in the
system for good demand creation
by staff. Institutional CLTS
facilitators given targets for
numbers of communities to
trigger, but no reward for ODF
outcomes.
In districts with Bupatis
supportive of project approaches,
Health agencies have been given
targets for achieving specific
number of ODF villages and sub-
districts. This provides
institutional accountability for
ODF outcomes, but the pressure
of achieving targets can damage
the quality of processes, and
make it government-led rather
than community-led Total
Sanitation.
Managing the
collective
community
behavior
change
process
MOH has the mandate for
managing rural sanitation and
hygiene behavior change,
however.
Professional skills and budgets in
Health institutions for behavior
changing interventions are
limited (e.g. Health Promotion
sections have budgets for
communication products
production and dissemination, but
not for formative and consumer
research, and professional
communication design services
based on research.)
No institutional incentives
available for government
agencies achieving desired
community behavior change
outcomes.
Political leaders (Bupatis,
legislators) often reward
communities that achieve
collective behavior change and
become ODF, but not local
government agencies that
facilitate the change.

100

101
TABLE 19 (CONT): CURRENT DISTRICT GOVERNMENT INSTITUTIONAL CAPACITY/
INCENTIVES FOR ESSENTIAL COMPONENTS OF RURAL SANITATION PROGRAM
Functions
Required for
Total
Sanitation
Outcomes
Is There Institutional Capacity to
Support This Function?
Is There Institutional Incentive
to Support This Function?
Scaling
up/upgrading
access to
facilities and
services
through local
market supply
improvement
As this is not considered a public
sector institutional function,
there are no institutional
incentives for this purpose.
In fact, there are implicit
disincentives, as currently the
national government and
development partner agencies
are hotly debating whether
Sanitarians working on the side
as private sanitation
entrepreneurs constitutes a
“conflict of interest.”
District policymakers need to
recognize that they have a
facilitating role for local
sanitation market development
through local regulations and
directives such as preventing
hardware subsidies, which
distort consumer demand for
sanitation thereby inhibiting
growth of sanitation
entrepreneurs.
Government agencies at all
levels do not see this as an
area where they have any role
to play.
Within government
institutions there is a lack of
professional skills for
marketing management, and
lack of budgets for helping
local market development for
rural sanitation.
Individual capacity for
sanitation entrepreneurship
exists among some Health
outreach staff (Sanitarians).
With project-provided training
and mentoring 10
entrepreneurs have developed
supply networks in 14 districts
of East Java. More than half are
Sanitarians doing this in their
private capacity.
Sustaining
ODF
communities
and behaviors
No institutional functions,
methods and approaches for
evaluation of sustainability of
ODF outcomes have yet been
established.
If a policy decision is made to
monitor ODF sustainability,
Health agencies have the
capacity to fund and implement
periodic sustainability checking
drives.
They will need technical
assistance to develop tools and
mechanisms for the purpose,
No institutional incentives yet.
The national government
needs to decide what kinds of
incentive systems to introduce
in the rural sanitation sector to
sustain behavioral outcomes
aligned with the national goal
of Indonesia ODF by 2014.
The JPIP awards in East Java
are serving as a powerful
institutional incentive to show
desired outcomes. Similar
models need to be explored in

102
which can be provided with
funding from the national
government and/or
development partner agencies.
other provinces.
8.2 Capacity Building and Incentives Needed to Improve Performance
From the action research study and project implementation experience in East Java, a series of
specific recommendations can be made about how to equip district and provincial government
institutions better to take on the rural sanitation challenge. In Table 20, the first column
summarizes how the project was implemented at province, district, sub-district and
community levels in East Java and what results were observed. Column 2 lists recommended
changes or additional actions that could lead to better ODF achievement rates, based on action
research findings.
Steps in Table 20 are presented chronologically, as they need to happen in a province. Other
countries starting rural sanitation programs at scale may be able to use the sequence in Table
20 to identify institutional functions necessary at province, district, sub-district, and
community levels. A recommended program implementation sequence for the use of districts
to scale up a TSSM project-like approach is summarized in Annex 2.
TABLE 20: INSTITUTIONAL ROLES AND IMPLICATIONS–BASED ON ACTION RESEARCH
FINDINGS
Institutional Roles in Project
Implementation in East Java
during 2007-2010
What could be done differently to Improve
Triggering–ODF Conversion Rate
(Modifications/additional actions
suggested are in italics)
PROVINCE LEVEL
To generate institutional demand for
TSSM-type intervention
Promotion of project benefits and
conditions for participation to all District
governments, by GOI and WSP.
Demand-driven approach, with Bupatis
submitting Letters of Interest to
WSP/provincial BAPPEDA/ Health Office
PROVINCE LEVEL
To generate institutional demand for TSSM-type
intervention
Promotion of project benefits and conditions for
participation to all District governments, by central
government and Provincial Health office
Demand-driven approach with Bupatis submitting
Letters of Interest to Provincial BAPPEDA/ Health
Office and commitment to meet operational costs of
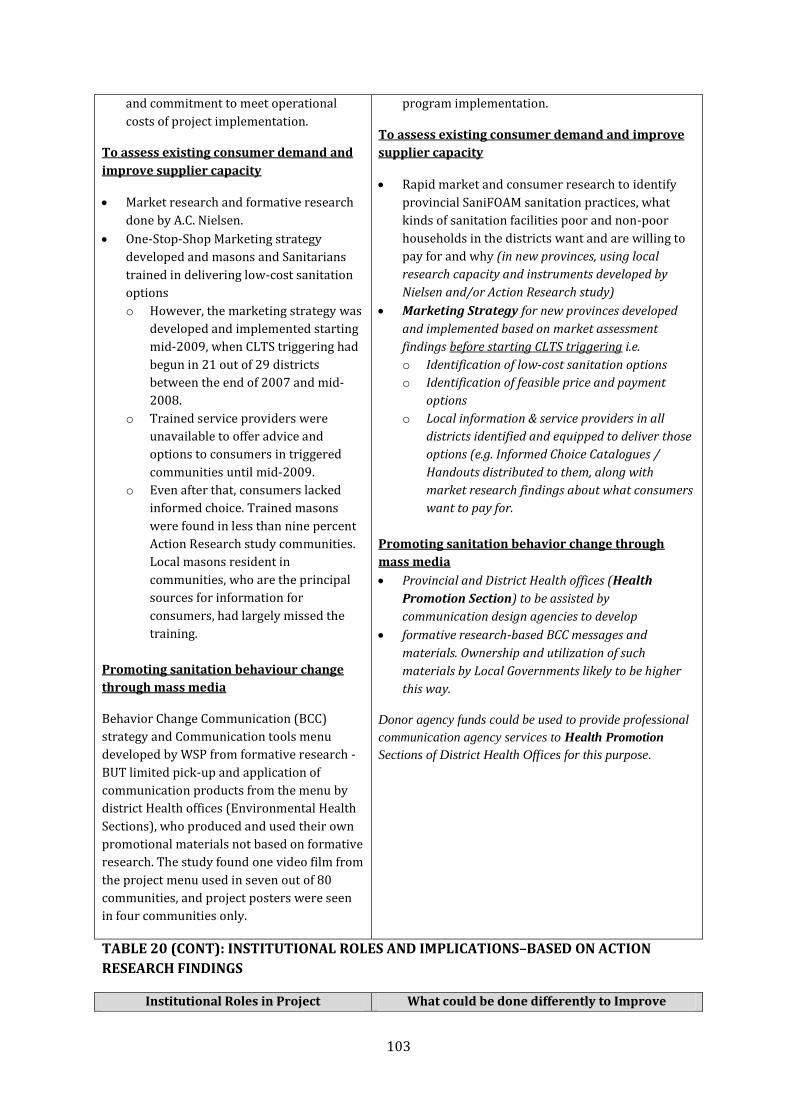
103
and commitment to meet operational
costs of project implementation.
To assess existing consumer demand and
improve supplier capacity
Market research and formative research
done by A.C. Nielsen.
One-Stop-Shop Marketing strategy
developed and masons and Sanitarians
trained in delivering low-cost sanitation
options
o However, the marketing strategy was
developed and implemented starting
mid-2009, when CLTS triggering had
begun in 21 out of 29 districts
between the end of 2007 and mid-
2008.
o Trained service providers were
unavailable to offer advice and
options to consumers in triggered
communities until mid-2009.
o Even after that, consumers lacked
informed choice. Trained masons
were found in less than nine percent
Action Research study communities.
Local masons resident in
communities, who are the principal
sources for information for
consumers, had largely missed the
training.
Promoting sanitation behaviour change
through mass media
Behavior Change Communication (BCC)
strategy and Communication tools menu
developed by WSP from formative research -
BUT limited pick-up and application of
communication products from the menu by
district Health offices (Environmental Health
Sections), who produced and used their own
promotional materials not based on formative
research. The study found one video film from
the project menu used in seven out of 80
communities, and project posters were seen
in four communities only.
program implementation.
To assess existing consumer demand and improve
supplier capacity
Rapid market and consumer research to identify
provincial SaniFOAM sanitation practices, what
kinds of sanitation facilities poor and non-poor
households in the districts want and are willing to
pay for and why (in new provinces, using local
research capacity and instruments developed by
Nielsen and/or Action Research study)
Marketing Strategy for new provinces developed
and implemented based on market assessment
findings before starting CLTS triggering i.e.
o Identification of low-cost sanitation options
o Identification of feasible price and payment
options
o Local information & service providers in all
districts identified and equipped to deliver those
options (e.g. Informed Choice Catalogues /
Handouts distributed to them, along with
market research findings about what consumers
want to pay for.
Promoting sanitation behavior change through
mass media
Provincial and District Health offices (Health
Promotion Section) to be assisted by
communication design agencies to develop
formative research-based BCC messages and
materials. Ownership and utilization of such
materials by Local Governments likely to be higher
this way.
Donor agency funds could be used to provide professional
communication agency services to Health Promotion
Sections of District Health Offices for this purpose.
TABLE 20 (CONT): INSTITUTIONAL ROLES AND IMPLICATIONS–BASED ON ACTION
RESEARCH FINDINGS
Institutional Roles in Project What could be done differently to Improve

104
Implementation in East Java
during 2007-2010
Triggering–ODF Conversion Rate
(Modifications/additional actions
suggested are in italics)
DISTRICT LEVEL: PRE-TRIGGERING
Demand creation for CLTS triggering
intervention :
Road shows by WSP to gather
intersectoral local government (LG)
support for project approaches.
No approaches made to Bupatis
Household latrine subsidies freely
available from non-Health Government
programs (both LG and national), and
private sector (CSR funding) during
project implementation period.
Each district decided its own strategy to
scale up – some clustered and phased
sub-districts, some triggered all sub-
districts simultaneously. BUT strategy
was not based on the need to tailor
triggering and follow-up approaches to
specific community characteristics.
DISTRICT LEVEL: PRE-TRIGGERING
Demand creation for CLTS triggering intervention :
Road shows by Provincial Health office in new
districts (outside East Java) to gather intersectoral
LG support for TSSM approaches.
Divide district into zones/clusters of sub-districts
according to types of CLTS triggering strategies
and follow-up support that will be needed
(geographic /topographic factors/nearness to water
bodies/remote areas with access and transportation
problems /swamps etc.)
Plan schedule of interventions and logistics to cover
all zones/clusters accordingly.
Obtain Bupati’s commitment and support for
district-wide “zero household subsidy” approach,
before starting community level triggering
interventions.
Obtain intersectoral agreement on converting subsidy
funds available in the district to outcome-based
incentives for communities achieving and staying ODF.
SUB-DISTRICT LEVEL: PRE-TRIGGERING :
Demand creation for CLTS triggering
intervention:
Road shows/dissemination of project
benefits and conditions to Village Heads
by Camats or Puskesmas, and Letters of
Interest (LOI) invited from Village Chiefs.
LOIs not consistently sought in all
districts and sub-districts.
CLTS triggering schedules drawn up by
District Health Office/Puskesmas. NOT
necessarily based on LOIs submitted by
Village Chiefs.
Village LOI submission requirement
ignored in Phase 2 and some Phase 3
districts.
SUB-DISTRICT LEVEL: PRE-TRIGGERING
Demand creation for CLTS triggering intervention :
Camats/Puskesmas Heads to use specific local
strategies to elicit demand from Village Chiefs for
CLTS triggering intervention to become ODF, and
their support for organizing the event (e.g. sparking
competition among villages to become ODF,
recognizing Village and Dusun chiefs for ODF
achievement, spreading understanding and
awareness among Village chiefs about why “no
subsidy approach” is essential for achieving and
sustaining ODF communities etc.)
Puskesmas draws up community triggering
schedules based on demand expressed by Village
chiefs, e.g., LOIs received or other tangible evidence
of expressed demand.
If there is no demand from village leadership there
should be no triggering intervention.

105
TABLE 20 (CONT): INSTITUTIONAL ROLES AND IMPLICATIONS–BASED ON ACTION
RESEARCH FINDINGS
Institutional Roles in Project
Implementation in East Java
during 2007-2010
What could be done differently to Improve
Triggering–ODF Conversion Rate
(Modifications/additional actions
suggested are in italics)
COMMUNITY LEVEL: DURING TRIGGERING
Triggering in only one Dusun per village,
in consultation with Keapala Desa.
Village Chiefs took initiative to mobilize
Dusun participation, and invited
representatives from other Dusuns who
will be enthused to repeat the triggering
in their respective communities. BUT
they did not consistently do this, Those
that did, had QUICKLY ODF outcomes.
Triggering done sometimes with only
selected sub-groups or a few households,
rather than with wide community
participation. Result – ODF status not
reached.
Triggering mixed up with advice on
latrine building in some communities. –
These communities tended not to reach
ODF outcomes.
CLTS triggering tools used by facilitators
in 95 percent of study communities. But
10 percent of communities “can’t
remember the process.” Multiple CLTS
tools used in 40 percent of communities
and only one CLTS tool in 14 percent.
CLTS tools were not consistently used in
community empowering ways. This was
found to be true more often in case of
facilitators not trained by the project.
COMMUNITY LEVEL: DURING TRIGGERING
Triggering in only one Dusun per village, in
consultation with Kepala Desa.
Pre-triggering planning with Village and Dusun
Chiefs about how to maximize participation by all
community sub-groups, men/women/children, and
how to spread the change movement from the first
triggering event in one Dusun to other Dusuns.
Triggering only in appropriate season and time of
day when most men, women, children can freely
participate.
Cancelling and re-scheduling triggering if only a few
people or only the leaders present.
NOT triggering if people present only want to discuss
how to get household latrine subsidy.
Facilitators using a sequence of CLTS triggering
tools tailored to community’s location and prevalent
OD practices – in community-empowering ways
(implications for institutional training)
CLTS facilitators never telling people to build
latrines. It must always be their own idea and
decision.
At the end of the triggering process, if asked, CLTS
facilitators may provide contact information of
nearest sanitation services supplier/entrepreneur.
Deferring provision of information on sanitation
improvement options till the first follow-up visit.
COMMUNITY and SUBDISTRICT LEVEL:
POST TRIGGERING
Community monitors changes in
sanitation access, with periodic
monitoring visits by Puskesmas staff.
Both focus mainly on new latrines built
by latrine-less households.
ODF verification by Puskesmas-organized
teams. 100 percent household access to
improved sanitation checked during
verification. No other means of behavior
COMMUNITY and SUBDISTRICT LEVEL: POST
TRIGGERING
Besides new latrine building, LG functionaries need
to monitor:
o Is information on feasible and affordable
sanitation options reaching community
households?
o Are consumer-supplier links working?
o Are local suppliers able to fulfill orders?
o Are poorest households able to find affordable
sanitation solutions?

106
change checking,
Official ODF declaration by Local
Government one to five months after
verification.
LG monitoring ceases after ODF
verification. 20 percent LATE ODF
communities found to have
o Is the village leadership helping households gain
access to improved sanitation?
o Is the community monitoring behavior change?
Have they set up methods to check and prevent
continued OD?
Puskesmas/LG functionaries to:
o Facilitate contact between sanitation suppliers
and consumers.
TABLE 20 (CONT): INSTITUTIONAL ROLES AND IMPLICATIONS–BASED ON ACTION
RESEARCH FINDINGS
Institutional Roles in Project
Implementation in East Java
during 2007-2010
What could be done differently to Improve
Triggering–ODF Conversion Rate
(Modifications/additional actions
suggested are in italics)
ongoing Open defecation, and five
percent slippage found in QUICKLY
ODF communities.
LG functionaries not monitoring any
other aspect such as availability of
affordable product and service
options or sustainability of ODF
behaviors.
Not providing facilitation /liaison/
information support for overcoming obstacles
such as a lack of financing options for
consumers/
lackof capital credit for service providers.
o Advise village leaders/Committees about sources
of funds that can be tapped for sanitation
improvement
o Provide every triggered community’s Sanitation
Committee with an Informed Choice Catalogue
(either project-developed or from a local
sanitation entrepreneur), and contact
information about the nearest trained
mason/sanitation entrepreneur.
ODF verification and declaration.
COMMUNITY/SUB-DISTRICT LEVEL: POST
ODF
No institutional action at present.
Communities left alone after ODF
verification and declaration.
Communities have no external incentive
thereafter to sustain their ODF behavior.
COMMUNITY/SUB-DISTRICT LEVEL: POST ODF
Annual random checks of previously verified ODF
communities by Puskesmas staff
Slippage reporting to District Health Office and
withdrawal of ODF status of communities found to
have slipped. (May need institutional incentives for
slippage spotters and reporters).
Re-verification at community’s cost, if they wish to regain
ODF status.

107
DISTRICT LEVEL: POST ODF
No institutional action at present
DISTRICT LEVEL: POST ODF
Annual updating of ODF communities’ records, based
on ODF verification data and slippage reporting
data.
Annual budget for ODF Sustainability checks.
Establish and fund ongoing sanitation access monitoring
data flow and MIS from community to sub-district to
district to provincial database.
PROVINCE and DISTRICT LEVEL: ONGOING
MANAGEMENT
Periodic training programs for CLTS
facilitators.
Periodic program monitoring meetings
with District Health Officers.
Annual cross-district Stakeholder Learning
Review to share learning, compare progress
and district program performance (designed
and conducted with WSP technical assistance
and TSSM funding).
PROVINCE and DISTRICT LEVEL: ONGOING
MANAGEMENT
Revise content and methods for institutional training
being provided to CLTS facilitators, in the light of
Action Research findings. Emphasis on tailoring
triggering approach to community
characteristics and location.
Establish CLTS process Quality Indicators for
institutional assessment of community level
triggering, follow up, and monitoring processes
Annual budget allocation and organization of
institutional CLTS facilitators’ refresher training,
based on data consolidated from the application of
Process Quality Indicators Checklist (see page 8)
at every triggering event.
Reward facilitators when communities they
trigger/monitor become ODF. Recognize and
publicize best practices and innovations used by
facilitators at cross-district stakeholder learning
workshops.
Annual cross-district stakeholder learning review to
share learning, compare progress and district program
performance with Provincial government funding)
8.3 Follow-up Support: Key to Progress Towards Sustained ODF
The study found evidence of little institutional follow-up support being provided to triggered
communities. Follow-up is not regular and even when it happens, it includes little more than
collecting information on new constructions. There is no structure for follow-up visits, nor
clarity about what should be targeted for follow-up and how such follow-up should be handled.
Although communities recognized that the most important push towards ODF outcomes came
out of coordinated and collaborative follow-up by community institutions working together
with implementing agency personnel, in most cases the triggered communities themselves
were the initiators of such follow-up. CLTS facilitators should receive skill building to identify
follow-up support needs of different types of communities, and be provided with clear
guidance on what to look for and how to follow up during post-triggering visits.

108
Moreover, the study highlighted the risks to sustainability of behaviors and facilities after
communities are declared ODF that arise from the complete lack of institutional monitoring. If
local government budgets cannot cover sustainability monitoring in all ODF communities, at
least a random check of 15-20 percent of previously certified ODF communities needs to be
budgeted for every year. Based on sustainability check results appropriate incentives and
sanctions can be instituted to reinforce community motivation to sustain desired behaviors.
Based on this study’s findings, a structured checklist designed to improve CLTS triggering and
follow-up quality, and sustainability checks, is suggested in Table 21 below.
The checklist:
Can be used by facilitators for self-evaluation.
Should be used by Provincial or District Health Office for collecting information as basis
for annual refresher training of institutional facilitators.
TABLE 21: CLTS PROCESS QUALITY EVALUATION CHECKLIST—RECOMMENDATION
BASED ON STUDY FINDINGS
Step Process Quality Evaluation Indicators
(Answers obtained to questions below can be scored to get
overall quality assessment. The more of the conditions met
at each step, the better is process quality, and therefore the
greater the likelihood of success)
Scores Obtained
and Implications
for Supervision/
Training of CLTS
Facilitators
PRE-TRIGGERING
1 Decision to trigger or not trigger : How many of the following conditions
were met?
1. Village Chief had asked for triggering.
2. Village Chief had agreed to mobilize all community sub-groups for
participation.
3. On the agreed day at least 30 or more men/women/children of all
economic classes were present at start of triggering.
4. They were ready to participate in the process knowing that no
latrines/aid was being provided.
If all conditions are met, triggering is likely to be successful. If conditions 3 and
4 are not met, it may be better to postpone triggering and work with
community leadership to create more favorable conditions first.

109
TABLE 21 (CONT): CLTS PROCESS QUALITY EVALUATION CHECKLIST—
RECOMMENDATION BASED ON STUDY FINDINGS
Step Process Quality Evaluation Indicators
(Answers obtained to questions below can be scored to get
overall quality assessment. The more of the conditions met
at each step, the better is process quality, and therefore the
greater the likelihood of success)
Scores
Obtained and
Implications
for
Supervision/
Training of
CLTS
Facilitators
TRIGGERING
2 CLTS tools used:* How many of the following conditions were met?
1. Defecation practices mapped on the ground (NOT on paper) with active
participation of women, men and children present.
2. Transect walk did cover currently used OD sites in community, to
generate disgust and shame.
3. Simulation of fecal pollution of water, preferably at waterfronts.
(Essential in communities that wash, bath, and defecate in water bodies.)
4. Contamination routes traced, for dry and wet seasons. (Especially
relevant in non-river-defecating communities.)
5. Feces volume calculation done to expose implications of OD by a few or
many for all.
6. Discussion about how to confine feces using simple diagrams and NOT by
promoting latrine types.
* See Kar and Chambers (2008), Handbook on CLTS. PLAN- IDS
3 Triggering effectiveness: How many of the following happened at the end of
triggering?
1. One or more natural leaders emerged.
2. Discussions about stopping OD in their community by a specific date
were started.
3. Action planning to become ODF was begun.
4. Identification of sanitation committee members was begun.
5. Information on sanitation options/service providers was requested.
If these things did not happen, triggering has failed.
Try to find out what is obstructing build up of momentum to ignition.
Use the information to plan re-triggering at a later date, using strategies to
address specific obstacles identified.

110
POST-TRIGGERING
4 Follow-up Visit 1 Week after Triggering. How many of the following are
happening?
1. An Informed Choice Catalogue/handout is available in the community?
2. The Open Defecator households have seen the handout.
If not, show them a copy of the ICC and leave it with the Sanitation
Committee, asking them to spread the information, OR
Inform them about trained sanitation providers who can offer
sanitation improvement options.
3. Contact between community households and trained masons or
sanitation entrepreneurs has been established.
If not, facilitate contact.
4. Community leaders/Sanitation Committee members are aware of
sources of financing that can be tapped, for consumers or sanitation
providers.
TABLE 21 (CONT): CLTS PROCESS QUALITY EVALUATION CHECKLIST—
RECOMMENDATION BASED ON STUDY FINDINGS
Step Process Quality Evaluation Indicators
(Answers obtained to questions below can be scored to get
overall quality assessment. The more of the conditions met
at each step, the better is process quality, and therefore the
greater the likelihood of success)
Scores
Obtained and
Implications
for
Supervision/
Training of
CLTS
Facilitators
4 5. The Community started sanitation access monitoring.
Check evidence of monitoring method/map/records kept.
If not kept, help them start with Welfare Classification of households
and improved/unimproved classification of facilities.
Show good examples of social map/tables from other communities).
6. The community has started behavior monitoring (checking & preventing
OD)?
Find out what methods used and whether any OD-ers have been
caught/prevented yet.
5 Follow up visit 1 month after triggering - and periodically thereafter till
ODF : How many of the following are happening?
1. The monitoring methods/tools introduced are in use. Being updated
regularly.
2. Consumer-supplier-service provider links are working.
3. Methods to detect and prevent Open Defecation are being used.
4. Financing obstacles are being addressed.

111
If not happening, provide information/ideas/examples from other
communities to help resolve bottlenecks.
6 Random check visit - After ODF verified and achieved
1. Observe household surrounds and community environment (riverbanks,
drains and streams, fishponds, irrigation canals, crop fields, ravines) for
evidence of OD.
2. Check latrine ownership records to confirm 100 percent ownership of
improved sanitation.
3. Observe a random 10 percent sample of permanent and semi-permanent
household facilities – how well the are used and maintained and if they
are still safe/improved.
4. Ask how OD is detected and dealt with, if found.
5. Ask who was detected last and what action was taken in response (if no
one was ever caught, suspect lack of behavior monitoring).
6. Discuss with village and hamlet chiefs how they can prevent community
slipping back into OD and losing ODF status.
Note and report new learning gained back to Puskesmas/sub-district/other
facilitators.

112
IX. Conclusions, Implications, and Recommendations
This study was undertaken with the primary objective of improving the “success rate of CLTS
triggering at scale,” where success was defined as the achievement of ODF status by
communities, and being able to sustain that status over months and years beyond ODF
declaration. The focus therefore was on identifying what factors in planning, implementation
and monitoring help ensure that communities achieve and remain ODF over the longer term.
It is not possible to establish the relative importance or ranks of all factors that contribute to
successful triggering in quantitative terms without doing multivariate statistical analysis,
which was beyond the scope of this study. However, content analysis of the information
gathered was sufficient to establish a variety of the most important influencing factors—some
of which could have influenced other factors progressively with snowballing effects.
The range of influencing factors identified in this study emphasizes that success is more than a
matter of getting the CLTS process right with the best-trained facilitators. While high quality
CLTS processes are essential for starting the collective behavior change movement, a variety of
community characteristics and environmental factors were found to be associated with and
likely influenced the way triggered communities responded to the challenge of becoming and
staying ODF.
9.1 Key Findings and Conclusions
1. QUICKLY ODF communities represent the most efficient model for scaling up
sustainably. Communities that achieved ODF status within two months of triggering achieved
markedly faster and higher access gains and a higher percentage of them remained ODF than
communities that took many months to achieve ODF status. The pace of change may indicate
the extent of ‘community ignition’ achieved.
Progress monitoring systems and records in 80 communities showed that QUICKLY ODF
communities also bested all other categories at behavior monitoring, and detecting and
sanctioning violators of community commitment to stop open defecation. The sanitation
facilities built for becoming QUICKLY ODF satisfied the requirements of “improved sanitation”
by JMP definitions, but were of lower cost and quality than in LATE ODF and NOT ODF
communities (as observed in 574 homes in 80 communities).
Ninety-five percent of the QUICKLY ODF communities had sustained their behavior change
four to 28 months after ODF declaration, as evidenced from environmental observation, latrine
ownership records, reported usage and observation of maintenance of facilities.

113
2. ODF outcomes that materialize after many months should be subject to periodic re-
checks. Only 80 percent LATE ODF communities reported remaining ODF. Because sanctions
against open defecation (particularly defecation into rivers) were rarely enforced, the actual
percentage that remains ODF could be even lower. Possibly, 20 percent of the LATE ODF
communities had never really achieved ODF status, although 100 percent households had
gained access to improved sanitation. LATE ODF communities had focused on monitoring
latrine ownership rather than on behavior change to eliminate open defecation.
3. Implementing agencies can effectively influence most factors associated with
achievement and sustainability of ODF outcomes for scaling up rural sanitation. While a
number of factors can be associated with ODF outcome achievement and sustainability, no
single factor out of those listed in the charts in the Executive Summary (page 8) guaranteed
ODF achievement. It is also not possible to rank them in terms of importance, although some
are associated and reinforce each other. QUICKLY ODF communities displayed the
characteristics in column 1. The table groups factors associated with ODF achievement and
sustainability of ODF outcomes in column 1. Factors associated with poor ODF achievement
and low sustainability of ODF outcomes are summarized in column 2.
While local governments have no control over some of these factors, such as high social capital
in a village (factor #1), they can directly influence a number of others—from triggering in
response to demand, to access to information about affordable latrines—and support factors
such as access at easier payment terms and regular community monitoring, to cumulatively
enhance the rate of ODF outcomes.
4. ODF and NOT ODF communities were significantly different in terms of proximity to
water bodies. They were not significantly different in terms of topography (hills, plains,
coastal regions), soil types (sandy, rocky, swampy), or proximity to forests and access to
markets for sanitation supplies. Nor were notable differences found in terms of exposure to
behavior change communication messages, which were reportedly seen or heard in less than
10 percent of all communities. ODF and NOT ODF communities were however significantly
different in terms of proximity to water bodies. In all 20 districts, riverbank, beach, or
lakeshore communities had the lowest sanitation access rates and were significantly less likely
to achieve ODF status. The difference was statistically significant.
This could be due to a strong preference for defecation into water bodies; a practice recalled in
focus group sessions as “clean, hygienic, pleasant, convenient, free of cost” and one that has
been a “socially accepted tradition for many generations without problems.” Even latrine
owners defecate into water bodies from time to time.

114
5. Open defecator households in rural East Java have the ability and opportunities, but
often lack the motivation to acquire and use latrines instead. Open defecator and sharer
households in all 40 NOT ODF communities reported that they had easy access to markets for
sanitation products and services, and that they commonly owned permanent or semi-
permanent homes, color television sets, either bicycles or motorbikes, and more recently cell
phones. Some of these assets, costing much more than basic models of improved latrines, were
acquired through installment credit or deferred payment arrangements matched with seasonal
surpluses in income. In ODF communities, the poorest had invested up to Rp. 300,000 (US$33)
in building their starter-level permanent latrine, and Rp. 750,000 (US$82) for pour-flush
systems offered on installment credit. Thus, improved sanitation facilities do not appear to be
beyond the means of the rural poor in East Java. If sanitation improvement can be made into a
higher household priority and offered on easier payment terms, open defecator and sharer
households have the economic ability to acquire it in the same way.
6. Externally provided subsidies were associated with lack of ODF outcomes but
community-provided subsidies were instrumental in ODF achievement. Subsidies for
household sanitation are still being provided in almost all districts despite the Health
Ministry’s 2008 STBM strategy banning them. Although the Ministry of Health no longer
provides them, subsidies are still available from local government programs and national
projects for community development and poverty alleviation, as well as from the private
sector’s corporate social responsibility funds. In communities where a few households had
received subsidy packages, collective action to become ODF was reportedly hampered by the
expectations raised among the rest of more such packages becoming available, resulting in
their inaction. External subsidies were never available for all households that might have
warranted them, and thus had a socially divisive effect. All communities in the sample that had
received external subsidy packages in any form, during or before the project period, did not
become ODF, and were, in fact, still not ODF at the time of observation.
In contrast, community leaders’ initiatives to enable all households to acquire the means to
stop open defecation directly contributed to ODF outcomes. Examples include providing
durable pit covers or low-cost latrine pans or cement from village development funds to those
lacking latrines, or gotong royong drives to build latrines for all. The internally provided
subsidies were precisely targeted, covered all whose behaviors needed to change, and were
provided as a social solidarity measure to achieve a collective goal. The receivers reported that
they felt accountable to their larger community for making the behavior change desired of
them.
7. When CLTS ignited demand for improved sanitation in study communities, local
markets failed to meet expectations of poor consumers. A smell-free and easy to clean
pour-flush water seal latrine with ceramic pan is what the poor consumers said they really
want, but found unaffordable as it costs upwards of Rp. 1 million (US$108). They were able to
invest up to Rp. 300,000 (US$38) on a starter-level improved latrine, the dry pit cemplung,
which was highly affordable but smelly and not desirable. Dry pit owners saw them as
temporary measures not worth sustaining over long-term. Many non-owners of latrines

115
reported putting off constructing a latrine (and continuing with open defecation presumably)
until they can afford the desired type.
In only nine percent of the sample communities the desired model was found to cost much less,
around Rp. 750,000 (US$82), where project-trained masons had offered several reduced-cost
options of the facility along with installment payment options. All poor customers in those
communities had gone directly for pour-flush systems as their starter models and
entrepreneurs offering such options were overwhelmed with orders. In the remaining 91
percent communities no one had seen the Informed Choice Catalogue of low-cost options
developed by the project. Locally resident masons in the communities, who were the principal
source of information to consumers, had generally missed out on project-provided training on
lower-cost sanitation options and were not promoting them.
These anomalies arose out of the long delay in delivering the sanitation marketing component
of the project implementation. Sanitation market research results were unavailable until two
years into project implementation. The marketing strategy was developed by early 2009 and
local supply capacity improvement interventions began only by mid-2009, whereas demand
creation through CLTS had been ongoing since November 2007. Findings from this study
suggest that reversing the sequence (that is, first understanding consumer preferences and
supply capacity of local markets using market research, secondly developing pro-poor
marketing strategies in response, and then using CLTS and behavior change communication
interventions to generate demand while simultaneously helping local supply capacity to grow)
might better accelerate sustainable behavior change. Doing this would enable both poor and
non-poor consumers to invest in what they really desire, at prices they can afford, and make
better-informed choices for sanitation improvement. All three factors are likely to produce
more sustainable outcomes.
The conclusions above imply a need to revisit and refine the planning premises and
implementation plan formulated for the next phase, when TSSM-introduced approaches
expand to other provinces under a nationwide scaling up effort guided by the Government of
Indonesia’s Sanitasi Total Berbasis Masyarakat strategy.
9.2 Implications for Programming to Scale Up Achievement of
“Sustainably ODF” Communities
Indonesia’s continuing challenge is a persistently large rural sanitation access gap. The WHO-
UNICEF Joint Monitoring Program’s 2010 Update states that over 58 million people currently
practice open defecation, of which nearly 40 million are in rural areas. Another 51 million
people share others’ latrines or use unimproved facilities, of which 31 million live in rural

116
areas. There is as yet no national rural sanitation program as seen in some South Asian
countries.31 Among all stakeholders there is both concern about progress not being on track to
achieve the MDG target, and keen interest in learning about what will accelerate progress
towards ODF communities at scale—which translates into rapid gains in access to sanitation.
Based on the action research findings, the following insights are offered for consideration by
policymakers, implementers and rural sanitation program financiers.
1. To provide the basis for planning effective behavior change interventions at scale, it
is worth investing into market research before starting demand generation. In future
initiatives, it could be more productive to schedule CLTS triggering after provincial32
market research results are used to:
Identify a pro-poor marketing strategy for the province, namely: a) sanitation
improvement options that best match consumer preferences, b) prices and payment
terms that will be affordable by all consumer classes c) the principal provider/s of
sanitation advice and services to poor consumers, who need to be equipped to promote
and deliver the chosen product options to them.
Identify gaps between what poor consumers want and what local markets are
providing. Specific program interventions can then begin to improve local supply
capacity simultaneously with demand creation, for optimal conversion of the generated
demand into sustainable sanitation improvement.
Sharpen the focus of demand generation strategies (CLTS and BCC) with reliable
information about the target population’s motivations underlying existing sanitation
and hygiene behaviors, and their abilities and opportunities to improve those
behaviors.
2. Districts hoping to scale up sanitation access sustainably need a “subsidy funds
management strategy” that prevents subsidies from hampering the growth of both
consumer demand and local supply capacity. The unregulated and practically
untargeted inflows of funds for sanitation subsidies to households from several public and
private sector sources, as observed in many study communities, are a serious threat to the
effectiveness of the new rural sanitation approaches. Political leaders such as Bupatis
(Head of district) and district legislators are of key importance for resolving this problem
as they have the power to regulate the use of all local funds. Strategic, evidence-based
advocacy with leaders in a district before starting initiatives based on project interventions
can lead to a district subsidy funds management strategy supportive of, or at least not
31 For example, Government of Bangladesh’s National Sanitation Campaign (2003-06) or India’s ongoing Total Sanitation
Campaign.
32 Province level market research and strategy in Indonesia; may be applicable for country level in smaller countries.

117
detrimental to, approaches to achieve collective community sanitation and hygiene
behavior outcomes.
3. For cost-efficient scaling up, districts need to plan rural sanitation interventions by
zoning, clustering, and phasing communities in response to specific conditions. The
study found evidence that CLTS triggering, follow-up support, and monitoring strategies
need to be adjusted to both specific locations and conditions that affect open defecation
practices and to the factors that motivate people to continue such practices, such as:
riverbank and beach communities; swamp regions with high water tables, little dry land
and transportation problems; or water scarce regions. Using these criteria to plan
interventions by segmenting, zoning, and phasing sub-districts or clusters of villages,
would make for more cost-efficient logistics for demand creation, follow up, monitoring,
and supply improvement facilitation.
4. To improve community response to triggering, CLTS interventions can be provided
in response to expressed demand from village leadership. The study identified
demand-responsive CLTS triggering as a key to success. Focus groups in ODF villages
emphasized that community leaders who want their villages to become ODF tend to
mobilize all community sub-groups to participate in triggering, reinforce the triggering
effects through community institutions and events thereafter, and monitor progress
effectively. In the post-triggering period, they also ensured that all households changed
their OD practices and did not slip back into them. On the other hand, uninterested and
uninvolved village leaders were found mostly in the NOT ODF communities. It is therefore
recommended that:
Sub-district government functionaries utilize available institutional mechanisms for
generating a competitive spirit among village leaders and raise demand from them for
interventions to help make their villages sustainably ODF.
Triggering interventions be made conditional to formally expressed demand from
village leaders.
Sub-district offices or Puskemas (community health centers) draw up annual plans and
budgets for triggering and follow-up by aggregating the expressed demand.
5. Improve triggering outcomes at scale based on study findings about what helped and
what hindered collective behavior change. This is a task for a national sanitation
strategy guidance authority, e.g., The Health Ministry’s STBM Secretariat in Indonesia. CLTS
facilitators’ training currently being provided can be improved in the following ways:
Review training being provided by various government agencies and NGOs and
establish quality standards for training delivery.
Emphasize in both operation manuals and training guidelines the need to de-link CLTS
triggering from advice/information about latrine construction, and make triggering
fully gender-and -socially inclusive.
Sensitize facilitators to the need to adjust triggering and follow-up strategies to
community characteristics that determine people’s ability and motivations to change
behavior. Market research findings on open defecators’ and sharers’ motivations,

118
abilities, and opportunities to change behavior should be discussed in CLTS facilitators’
training.
Include information on how to encourage reliable progress monitoring by communities
and clarify an adequately structured post-triggering follow-up process within the
training.
Advise local governments to allocate annual budgets for learning exchange events and
refresher training of CLTS facilitators with the goal of continuing to improve triggering,
follow-up, and monitoring processes.
Post-triggering follow-up can be improved in the following ways:
Post-triggering processes should be given a verifiable structure by establishing and
periodically checking for desired progress quality indicators/milestones33 for success
in triggered communities in order to improve institutional accountability for and the
quality of follow-up. Institutional adoption of a structured follow-up process also
makes it more likely to be adequately funded.
District governments should reward facilitators for ODF outcomes in order to
incentivize the quality of triggering and follow-up. This reward could be linked with
independent ODF verification systems.
Periodically check whether ODF status is sustained in already verified ODF
communities through the use of established institution monitoring systems. The results
should lead to sanctions like withdrawal of ODF status when communities fail to keep
up ODF conditions.
6. Open defecators and sharers can be targeted for behavior change more effectively by
segmenting them. Open defecators and sharers in forty East Java villages in twenty
districts reported no major constraints in terms of their ability and opportunities to change
their defecation practices. However, motivations to change behavior were weak, and open
defecators and sharers had different motivations for continuing their existing practice.
Open defecators into water bodies were generally happy with their practice, whereas
sharers were frequently embarrassed and unsatisfied about sharing, but continued sharing
because they lack awareness of affordable options or land to build their own facilities. In
the post-triggering phase, behavior change communications to open defecators and
sharers could be more effective if messages targeted them differently (see Table 23).
33 An example of a Process Quality Indicators Checklist is included in Chapter 8.

119
TABLE 22: EXAMPLE OF SEGMENTING POPULATIONS FOR BEHAVIOR CHANGE
COMMUNICATION
Where Are People Practicing Open Defecation? Frequencies Reported in:
20 NOT ODF
High-
Coverage
Communities
20 NOT ODF
Low-Coverage
Communities
A. In water bodies
(river/sea/canal/mangrove/swamp/fishpond)
19 11
B. At work place (forest/orchard/crop field) 4 3
C. Other places (ditch/ravine/open pits/ bamboo grove) 5 3
D. In others’ latrines, sometimes in rivers or pits (sharers) Sharers—Found in all 40 NOT ODF
communities
Groups A, B, C, and D have different motivations for continuing open defecation or changing
over to using latrines.
Group A: Communities close to water need special strategies for behavioral change, as
the majority are happy with their current practice (defecation in water bodies), and
feel no need to change to using latrines. They believe “feces are washed away/OD causes
no harm to self & others/why build latrine since other villages upstream still OD in river?”
Or they have livelihoods dependent on open defecation, i.e., fish farming in ponds with
hanging latrines.
Groups B and C (not defecating in water) have different motivations. They are
interested in pour-flush latrines with ceramic pans (“smell-free, easy to keep clean,
modern, convenient, prestigious”) but: a) believe it is too costly, starting at Rp. 800,000,
b) say they will build at harvest time/when they get more money/ build jointly with
neighbor, or c) cannot think of getting latrines because transportation difficulties push
up costs to Rp. 3 million (one case in a swamp area)
Group D – Like the convenience a latrine offers, but embarrassed and unhappy about
having to share. Do not build and use their own latrines because of perceived high cost
of construction, or because they lack land on which to build.
Groups B & C can be targeted with:
A pricing and supply improvement strategy: improve market availability of pour-flush
latrine with ceramic plan at reduced costs, within Rp. 250,000-500,000, promote the
same with these consumers.
Group D (Sharer) can be targeted with:

120
Same pricing and supply improvement strategy can be used, in addition to promoting
the idea of a sanitary latrine within existing homes, which does not require extra land.
Group A (defecators into river/fishponds) can be targeted with special strategies addressing
the underlying motivations that are obstructing behavior change, such as:
Try to change social norms so that Open Defecation into rivers becomes socially and
personally unacceptable (such as sinful/dirty/ repugnant/socially irresponsible/
selfish/damaging to others and self/ etc.)
Get formal and informal leaders, and especially religious leaders to lead the normative
change movement and apply public sanctions for those who continue with Open
Defecation.
Explore feasible alternatives for livelihoods-related Open Defecation (e.g., feeding fish).
____________________________________________

121
References
Devine, Jacqueline. 2009. Introducing SaniFOAM: A Framework to Analyze Sanitation Behaviors to
Design Effective Sanitation Programs. Working Paper, Water and Sanitation Program.
Howes, Mick, Enamul Huda, and Abu Naser. 2011. “NGOs and the Implementation of CLTS in
Bangladesh,” in Shit Matters: The Potential of CLTS, Practical Action Publishing.
Hanchettte, Suzanne, Laurie Krieger, Craig Kullmann, and Rokeya Ahmed. 2011. Case Study on the
Sustainability of Improved Sanitation in Rural Bangladesh. Research Brief, Water and Sanitation Program.
Kar, Kamal with Robert Chambers. 2008. Handbook on Community-Led Total Sanitation. Institute of
Development Studies and PLAN International
Mukherjee, Nilanjana, Djoko Wartono and Amin Robiarto. 2011. Managing the Flow of Monitoring
Information to Improve Rural Sanitation in East Java. Working Paper, Water and Sanitation Program.
Sijbesma, Chritine and Jacqueline Devine. 2010. Research on the Sustainability of Rural Sanitation
Marketing in Vietnam. Learning Note, Water and Sanitation Program.
Water and Sanitation Program. 2009. Total Sanitation and Sanitation Marketing Research Report.
Prepared for the World Bank Water and Sanitation Program.
Water Aid. 2009. Sustainability and Equity Aspects of Total Sanitation Programmes: A Global
Synthesis Report.
Water and Sanitation Program. 2007. Economic Impact of Sanitation in Southeast Asia Summary:
A Four-Country Study. Water and Sanitation Program.
Water and Sanitation Program and the Ministry of Rural Development, Government of India.
2011. A Decade of the Total Sanitation Campaign: Rapid Assessment of Processes and Outcomes. Water and
Sanitation Program.

122
Annex 1: Basic Concepts and Definitions
CLTS : Community- Led Total Sanitation:
“This is an integrated approach to achieving and sustaining open defecation free
(ODF) status. CLTS entails the facilitation of the community’s analysis of their
sanitation profile, their practices of defecation, and the consequences, leading to
collective action to become ODF. Approaches in which outsiders “teach”
community members are not CLTS. CLTS processes can precede and lead on to, or
occur simultaneously with improvement of latrine design; the adoption and
improvement of hygiene practices; solid waste management; waste water
disposal; care, protection and maintenance of drinking water sources and other
environmental measure.”—Handbook on CLTS by Kamal Kar with Robert
Chambers (IDS – PLAN, 2008).
Behavioral goals targeted by the project in Indonesia: The Global Scaling Up Rural
Sanitation project (inititally called TSSM) in Indonesia focused on helping rural communities to
move up the sanitation ladder in steps . The behavioral goals pursued were: first to eliminate
open defecation and second, to help whole communities gain access to improved sanitation, in
order that the ODF status becomes more sustainable. Handwashing with soap was promoted as
integral to achieving ODF status, not as a separate behavioral goal.
BEHAVIORAL GOALS TARGETED BY TSSM
Community
defecates in
the open
All community hhs.
dispose off feces only
into latrines
Towards
Total
Sanitation
All community
households dispose off
feces only into
improved latrines (ODF)
ODF= Open defecation free

123
Open Defecation (OD) means defecating in the open and leaving the feces exposed so as to
spread environmental contamination further. The feces may be left exposed to the air or into
water bodies. By this definition the project systems classify open pit latrines and any latrine
discharging directly into water bodies as equivalent to open defecation.
ODF: In Indonesia, the project adopted a definition for Open Defecation Free (ODF) whereby a
community is considered ODF when:
1. All community households defecate and dispose of infant feces only into improved
latrines (including at schools).
2. No human feces are visible in the environment.
3. The community uses sanctions, rules, or other means to check and prevent OD by
anyone.
4. The community is using a monitoring mechanism to measure gains in household access
to improved sanitation.
ODF Verification refers to a system of physical inspection of a community by outsiders to
assess whether the community is ODF in accordance with the criteria above. A community that
fulfills the criteria is said to be ODF certified.
Improved and Unimproved Sanitation as defined for MDG monitoring, is an improved
sanitation facility that hygienically separates human excreta from human contact.
Shared and public facilities of any type are classified as unimproved sanitation (WHO/UNICEF
Joint Monitoring Program, 2010). In Indonesia, the project adopts the same definitions, but in
order to facilitate communication of the concept “hygienic separation of human excreta from
human contact” words it as follows.
An Improved Sanitation Facility is one that:
1. Does not contaminate water bodies.
2. Prevents contact between human beings and excreta.
3. Prevents access to feces by flies and other insect vectors, wild and domestic
animals.
4. Prevents foul odor.
The project considers a community to have achieved Total Sanitation when:
1. All households have stopped Open Defecation.

124
2. All households own and use improved (safe/hygienic) latrines for all excreta disposal,
and maintain their facilities hygienically.
3. All households regularly wash their hands with soap after defecation and cleaning up
infant feces, and before eating, feeding and handling food.
4. All households handle and store food and drinking water safely.
5. All households use safe practices for managing domestic solid and liquid waste.
These five conditions embody the five pillars of the Government of Indonesia’s Community
Based Total Sanitation strategy or the STBM (Sanitasi Total Berbasis Masyarakat, 2008). The
Global Scaling Up Rural Sanitation project, which had a four-year time frame, chose to focus on
only the first and second behavioral goals of the five stated above, in Indonesia. The underlying
assumption was that people move up the sanitation and hygiene ladder in steps, and Goals 3, 4,
and 5 should be pursued only after the first two have been reached.
Sanitation Marketing is defined as the use of marketing principles to generate demand and
facilitate supply of improved sanitation, thereby increasing uptake. It includes understanding
the target market using formative research and supply capacity assessment, developing
behavior change communication strategies, and getting the marketing mix right, i.e., Product,
Price, Place and Promotion.

Annex 2: Recommended Implementation Sequence in New Province or Small Country


![Defecation Reflex [Compatibility Mode]](https://img.pdfslide.net/doc/110x75/5451cb86af795908308b4af3/defecation-reflex-compatibility-mode.jpg)