Embed Size (px)
Citation preview
Industrial Ecology master’s programme 2008 Stage de fin d’étude ingénieur 2008
Achieving Carbon-Neutral Car Manufacturing Plants
A Strategic Approach for Toyota Motor Europe
By Mélanie Despeisse, student at
Chalmers University of Technology, Sweden Department of Energy and Environment
and
École Supérieure des Sciences et Technologies de l’Ingénieur de Nancy, France Département GEMMES, Industrie et Environnement
Zaventem (Belgium), 2009-03-23
CHALMERS Jan-Olof Dalenbäck
Professor in Building Services Engineering Chalmers University of Technology - Department of Energy
and Environment
François Humbert Chef d’Option IE
École Supérieure des Sciences et Technologies de l’Ingénieur de Nancy - Département GEMMES
TOYOTA Steve Hope
General Manager of Plant Engineering Division and Senior Manager of Environmental Department Toyota Motor Europe – Production Engineering

2
3
Achieving Carbon-Neutral Car Manufacturing Plants A Strategic Approach for Toyota Motor Europe
Mélanie Despeisse a,b
Chalmers University of Technology, Department of Energy and Environment, Göteborg, Sweden b École Supérieure des Sciences et Technologies de l’Ingénieur de Nancy, Industrie et Environnement, Nancy, France
ABSTRACT
On Toyota Motor Europe request, a study on renewable energy investment opportunities has been conducted in order to assess the potential of alternative energy sources to contribute to the ultimate target of carbon-neutral car manufacturing plant. The project work was developed in a step-by-step approach. The first step started with an evaluation of the current performance of seven production plants. A selection of 12 indicators covering 5 areas of concern have been used to quantify and compare the relative performance of their production activities in terms of energy use, energy-related CO2 emissions, energy cost, energy security and European target for renewable energy sources in final energy use. The next step of the project was the creation of an energy model (mathematical model) to estimate the potential environmental and economical benefits from renewable energy technology implementation on-site. This second step resulted in a global roadmap (ranking of options) for Toyota Motor Europe as a whole and in EMC-specific roadmaps for each production plant, in order to achieve CO2 emission reduction in the most cost-efficient way. As a final step for the project, a concrete example of the roadmap application is given to estimate the environmental performance improvements in production activities. This project concludes that renewable energy sources have the potential to be a major contributor in carbon-neutral plant activities. Therefore renewable energy sources combined with other energy and CO2 reduction activities makes the ultimate target of carbon-neutral plants a reasonable target to be reached.
Keywords: Carbon-neutral; Sustainability; Renewable energy; Car manufacturing; Production plant; Automotive industry; Europe

4

ACKNOWLEDGEMENT
5
ACKNOWLEDGEMENT
• To Steve Hope, general manager, and to Mitsuo Kikuma, executive
coordinator of the Plant Engineering & Safety Division at Toyota Motor
Europe, for allowing me to work on this subject and having welcomed me
in the company;
• To Christopher Wadsworth, manager of the environmental team, for his
supervision and his support;
• To Carine Christophe, environmental engineer, for answering my
innumerable questions and her enthusiasm;
• To Timothy Waltniel, facility senior engineer, for his assistance in all steps
of the project and his patience;
• To Jan-Olof Dalenbäck, professor in Building Services Engineering at
Chalmers University of Technology, for his supervision and his help;
• To François Humbert, head of the Industrie et Environnement Option at
ESSTIN, for his occasional assistance;
• To Kim, Machteld and Rosanna for sharing their office space and their
kindness;
• To Regine and Alain for helping me when I had administrative or technical
problems;
• To all PLE&S members for their kindness and the cakes;
• To all the employees of Toyota Motor Europe’s Production Engineering
and R&D for their sympathy and their welcome.

6
TABLE OF CONTENTS
7
TABLE OF CONTENTS ABSTRACT 3
ACKNOWLEDGEMENT 5
TABLE OF CONTENTS 7
LIST OF FIGURES 9
LIST OF TABLES 10
LIST OF ACRONYMS 11
1 INTRODUCTION 13
1.1 Company information [1] 13 1.2 Context of the study 13 1.3 Current situation 14 1.4 Objectives of the project 15 1.5 Methodology 15
2 EMC ASSESSMENT 17
2.1 Production activities 17 2.1.1 Toyota Motor Manufacturing UK, TMUK-B and TMUK-D 18 2.1.2 Toyota Motor Manufacturing France, TMMF 18 2.1.3 Toyota Motor Manufacturing Turkey, TMMT 19 2.1.4 Toyota Motor Manufacturing Poland, TMMP 19 2.1.5 Toyota Motor Industries Poland, TMIP 20 2.1.6 Toyota Peugeot Citroën Automobile, TPCA 20
2.2 EMCs data analysis 21 2.2.1 Energy use 21 2.2.2 CO2 emissions 21 2.2.3 Energy cost 22 2.2.4 Security of supply 22 2.2.5 Renewable energy sources 23
2.3 Summary 26
3 TECHNOLOGY ASSESSMENT 29
3.1 Available energy sources and technologies 29 3.1.1 Market share 30 3.1.2 Energy generation cost 31 3.1.3 Carbon footprint 32
3.2 Technology selection for the assessment 33 3.3 Assumptions 34
3.3.1 Energy generation technology 34 3.3.2 Investment and O&M costs 34
TABLE OF CONTENTS
8
3.3.3 COP and energy efficiency 34 3.3.4 Availability and load factors 35
3.4 Calculation methodology 37 3.5 Results 39
3.5.1 Small hydro 40 3.5.2 Wind power 42 3.5.3 Ground-source heat pump 44 3.5.4 Solar heating 45 3.5.5 Wood biomass heating 47 3.5.6 Wood biomass CHP 47 3.5.7 Waste-to-energy heating 48 3.5.8 Waste-to-energy CHP 49
3.6 Summary 50
4 ROADMAPS 53
4.1 Example of application, European level 54 4.2 Example of application, TMUK-D 57 4.3 Other possible models 58
5 DISCUSSION 59
6 NEXT STEP 61
6.1 Global and seasonal energy trends 61 6.2 Energy demand variation at production level 62
REFERENCES 63
APPENDIX I I
APPENDIX II V
LIST OF FIGURES
9
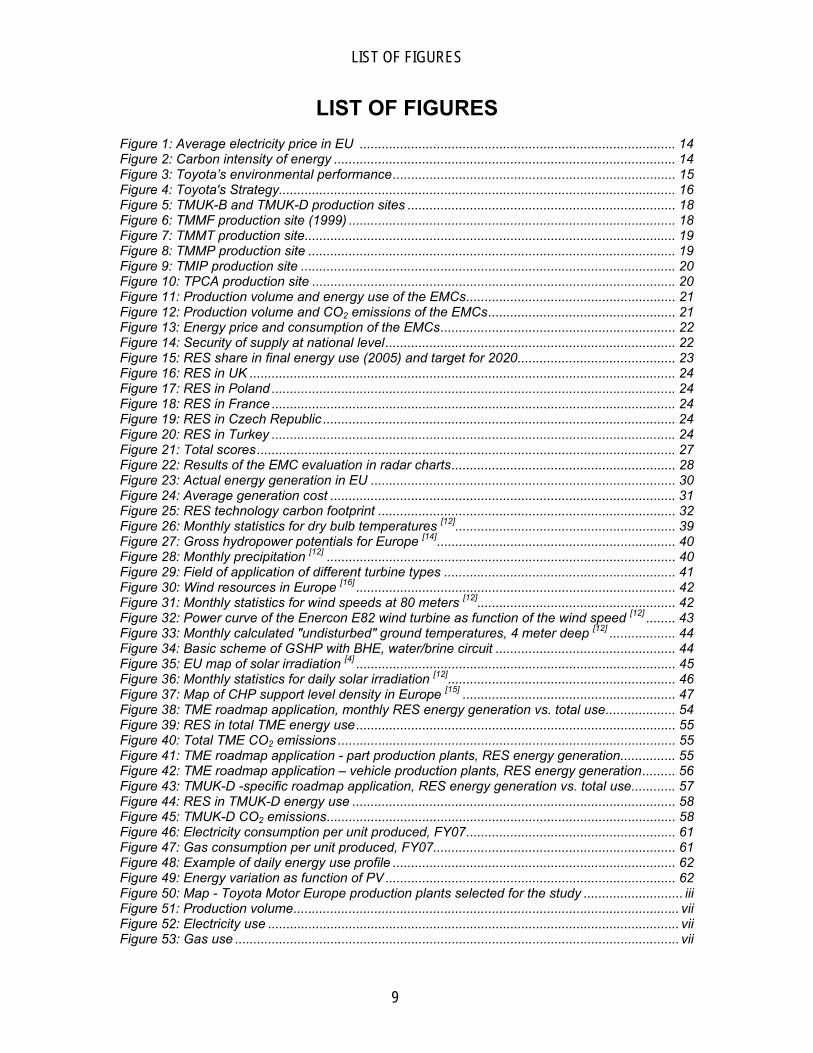
LIST OF FIGURES Figure 1: Average electricity price in EU ...................................................................................... 14 Figure 2: Carbon intensity of energy ............................................................................................. 14 Figure 3: Toyota’s environmental performance............................................................................. 15 Figure 4: Toyota's Strategy............................................................................................................ 16 Figure 5: TMUK-B and TMUK-D production sites ......................................................................... 18 Figure 6: TMMF production site (1999) ......................................................................................... 18 Figure 7: TMMT production site..................................................................................................... 19 Figure 8: TMMP production site .................................................................................................... 19 Figure 9: TMIP production site ...................................................................................................... 20 Figure 10: TPCA production site ................................................................................................... 20 Figure 11: Production volume and energy use of the EMCs......................................................... 21 Figure 12: Production volume and CO2 emissions of the EMCs................................................... 21 Figure 13: Energy price and consumption of the EMCs................................................................ 22 Figure 14: Security of supply at national level............................................................................... 22 Figure 15: RES share in final energy use (2005) and target for 2020........................................... 23 Figure 16: RES in UK .................................................................................................................... 24 Figure 17: RES in Poland .............................................................................................................. 24 Figure 18: RES in France .............................................................................................................. 24 Figure 19: RES in Czech Republic ................................................................................................ 24 Figure 20: RES in Turkey .............................................................................................................. 24 Figure 21: Total scores.................................................................................................................. 27 Figure 22: Results of the EMC evaluation in radar charts............................................................. 28 Figure 23: Actual energy generation in EU ................................................................................... 30 Figure 24: Average generation cost .............................................................................................. 31 Figure 25: RES technology carbon footprint ................................................................................. 32 Figure 26: Monthly statistics for dry bulb temperatures [12]............................................................ 39 Figure 27: Gross hydropower potentials for Europe [14]................................................................. 40 Figure 28: Monthly precipitation [12] ............................................................................................... 40 Figure 29: Field of application of different turbine types ............................................................... 41 Figure 30: Wind resources in Europe [16] ....................................................................................... 42 Figure 31: Monthly statistics for wind speeds at 80 meters [12]...................................................... 42 Figure 32: Power curve of the Enercon E82 wind turbine as function of the wind speed [12] ........ 43 Figure 33: Monthly calculated "undisturbed" ground temperatures, 4 meter deep [12] .................. 44 Figure 34: Basic scheme of GSHP with BHE, water/brine circuit ................................................. 44 Figure 35: EU map of solar irradiation [4] ....................................................................................... 45 Figure 36: Monthly statistics for daily solar irradiation [12].............................................................. 46 Figure 37: Map of CHP support level density in Europe [15] .......................................................... 47 Figure 38: TME roadmap application, monthly RES energy generation vs. total use................... 54 Figure 39: RES in total TME energy use....................................................................................... 55 Figure 40: Total TME CO2 emissions ............................................................................................ 55 Figure 41: TME roadmap application - part production plants, RES energy generation............... 55 Figure 42: TME roadmap application – vehicle production plants, RES energy generation......... 56 Figure 43: TMUK-D -specific roadmap application, RES energy generation vs. total use............ 57 Figure 44: RES in TMUK-D energy use ........................................................................................ 58 Figure 45: TMUK-D CO2 emissions............................................................................................... 58 Figure 46: Electricity consumption per unit produced, FY07......................................................... 61 Figure 47: Gas consumption per unit produced, FY07.................................................................. 61 Figure 48: Example of daily energy use profile ............................................................................. 62 Figure 49: Energy variation as function of PV ............................................................................... 62 Figure 50: Map - Toyota Motor Europe production plants selected for the study ........................... iii Figure 51: Production volume......................................................................................................... vii Figure 52: Electricity use ................................................................................................................ vii Figure 53: Gas use ......................................................................................................................... vii
LIST OF TABLES
10
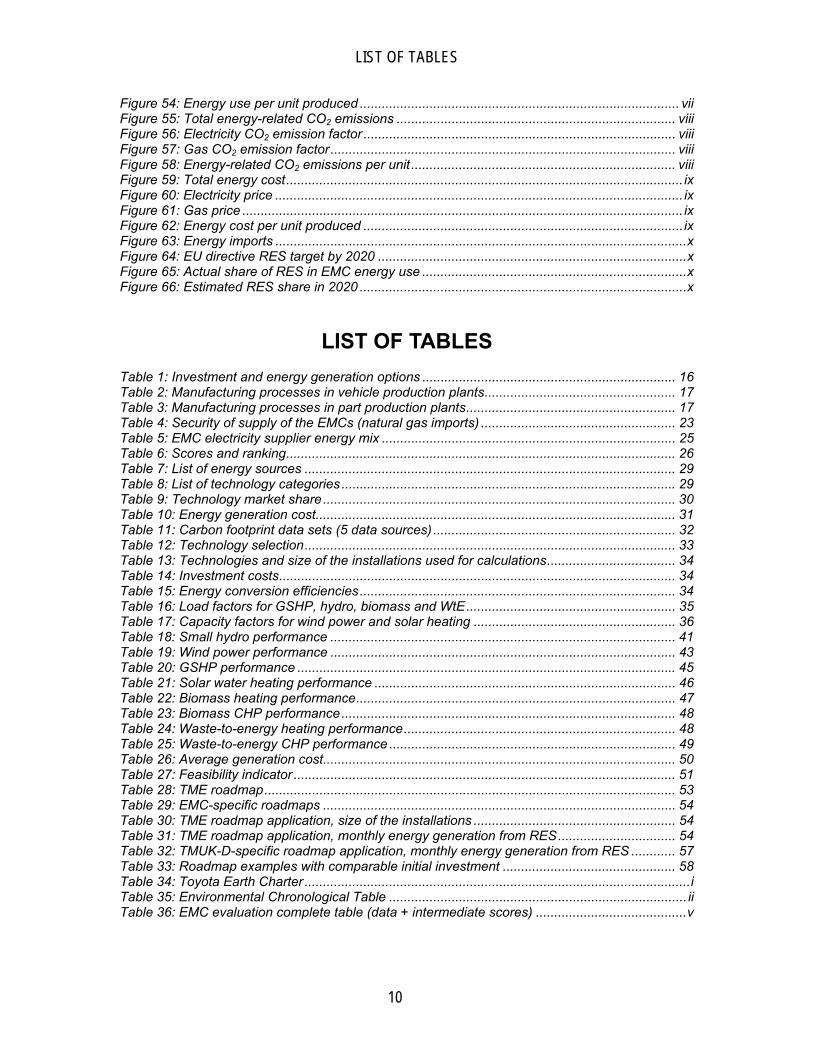
Figure 54: Energy use per unit produced ....................................................................................... vii Figure 55: Total energy-related CO2 emissions ............................................................................ viii Figure 56: Electricity CO2 emission factor ..................................................................................... viii Figure 57: Gas CO2 emission factor.............................................................................................. viii Figure 58: Energy-related CO2 emissions per unit........................................................................ viii Figure 59: Total energy cost............................................................................................................ ix Figure 60: Electricity price ............................................................................................................... ix Figure 61: Gas price ........................................................................................................................ ix Figure 62: Energy cost per unit produced .......................................................................................ix Figure 63: Energy imports ................................................................................................................x Figure 64: EU directive RES target by 2020 ....................................................................................x Figure 65: Actual share of RES in EMC energy use ........................................................................x Figure 66: Estimated RES share in 2020 .........................................................................................x
LIST OF TABLES Table 1: Investment and energy generation options ..................................................................... 16 Table 2: Manufacturing processes in vehicle production plants.................................................... 17 Table 3: Manufacturing processes in part production plants......................................................... 17 Table 4: Security of supply of the EMCs (natural gas imports) ..................................................... 23 Table 5: EMC electricity supplier energy mix ................................................................................ 25 Table 6: Scores and ranking.......................................................................................................... 26 Table 7: List of energy sources ..................................................................................................... 29 Table 8: List of technology categories........................................................................................... 29 Table 9: Technology market share................................................................................................ 30 Table 10: Energy generation cost.................................................................................................. 31 Table 11: Carbon footprint data sets (5 data sources).................................................................. 32 Table 12: Technology selection..................................................................................................... 33 Table 13: Technologies and size of the installations used for calculations................................... 34 Table 14: Investment costs............................................................................................................ 34 Table 15: Energy conversion efficiencies...................................................................................... 34 Table 16: Load factors for GSHP, hydro, biomass and WtE......................................................... 35 Table 17: Capacity factors for wind power and solar heating ....................................................... 36 Table 18: Small hydro performance .............................................................................................. 41 Table 19: Wind power performance .............................................................................................. 43 Table 20: GSHP performance ....................................................................................................... 45 Table 21: Solar water heating performance .................................................................................. 46 Table 22: Biomass heating performance....................................................................................... 47 Table 23: Biomass CHP performance........................................................................................... 48 Table 24: Waste-to-energy heating performance.......................................................................... 48 Table 25: Waste-to-energy CHP performance .............................................................................. 49 Table 26: Average generation cost................................................................................................ 50 Table 27: Feasibility indicator ........................................................................................................ 51 Table 28: TME roadmap................................................................................................................ 53 Table 29: EMC-specific roadmaps ................................................................................................ 54 Table 30: TME roadmap application, size of the installations ....................................................... 54 Table 31: TME roadmap application, monthly energy generation from RES................................ 54 Table 32: TMUK-D-specific roadmap application, monthly energy generation from RES ............ 57 Table 33: Roadmap examples with comparable initial investment ............................................... 58 Table 34: Toyota Earth Charter .........................................................................................................i Table 35: Environmental Chronological Table ................................................................................. ii Table 36: EMC evaluation complete table (data + intermediate scores) .........................................v
LIST OF ACRONYMS
11
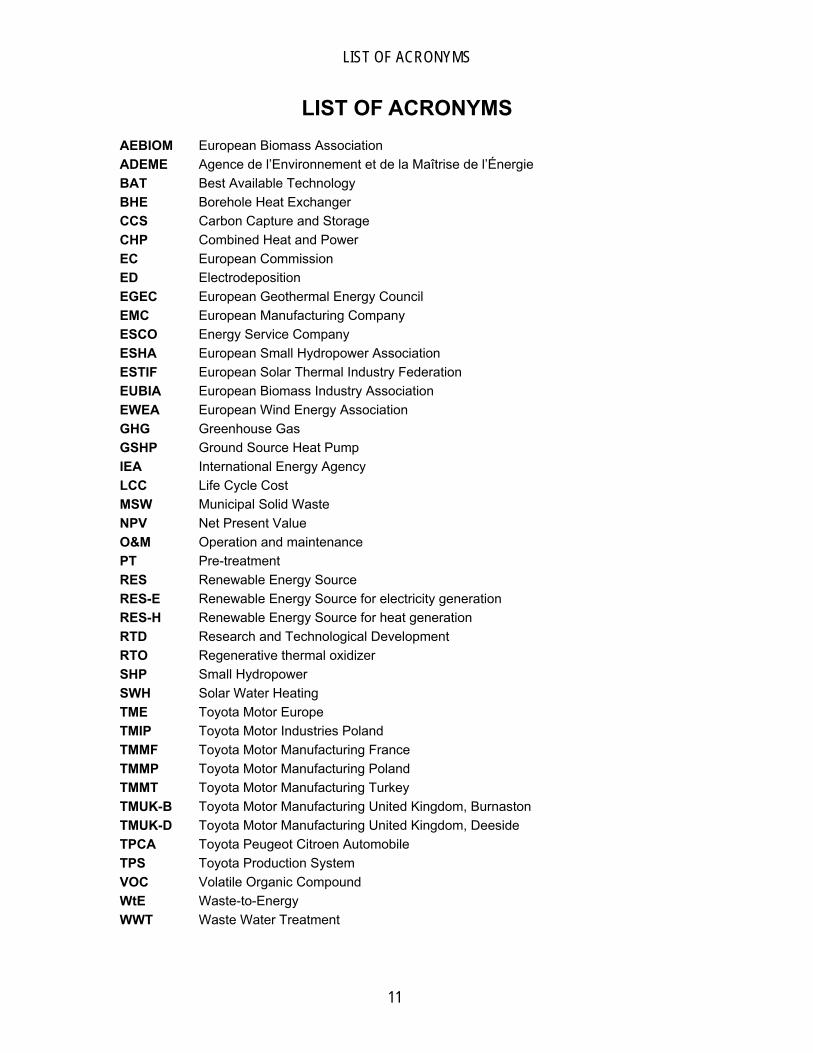
LIST OF ACRONYMS AEBIOM European Biomass Association ADEME Agence de l’Environnement et de la Maîtrise de l’Énergie BAT Best Available Technology BHE Borehole Heat Exchanger CCS Carbon Capture and Storage CHP Combined Heat and Power EC European Commission ED Electrodeposition EGEC European Geothermal Energy Council EMC European Manufacturing Company ESCO Energy Service Company ESHA European Small Hydropower Association ESTIF European Solar Thermal Industry Federation EUBIA European Biomass Industry Association EWEA European Wind Energy Association GHG Greenhouse Gas GSHP Ground Source Heat Pump IEA International Energy Agency LCC Life Cycle Cost MSW Municipal Solid Waste NPV Net Present Value O&M Operation and maintenance PT Pre-treatment RES Renewable Energy Source RES-E Renewable Energy Source for electricity generation RES-H Renewable Energy Source for heat generation RTD Research and Technological Development RTO Regenerative thermal oxidizer SHP Small Hydropower SWH Solar Water Heating TME Toyota Motor Europe TMIP Toyota Motor Industries Poland TMMF Toyota Motor Manufacturing France TMMP Toyota Motor Manufacturing Poland TMMT Toyota Motor Manufacturing Turkey TMUK-B Toyota Motor Manufacturing United Kingdom, Burnaston TMUK-D Toyota Motor Manufacturing United Kingdom, Deeside TPCA Toyota Peugeot Citroen Automobile TPS Toyota Production System VOC Volatile Organic Compound WtE Waste-to-Energy WWT Waste Water Treatment

12
1 - Introduction
13
1 INTRODUCTION In the context of an international master programme in Industrial Ecology for
Chalmers University of Technology and an engineer formation in Industrie et Environnement for ESSTIN, I carried out a thesis internship from the 1st of September 2008 to the 28th of February 2009 at Toyota Motor Europe Technical Centre in Zaventem (Belgium) which is the head office responsible for the European production sites. I have been assigned to the Environmental Department of the Plant Engineering & Safety Division within Production Engineering Division.
In this thesis work I was asked to answer a “simple” question: How to become carbon-neutral in Toyota Motor Europe production activities? This question opens the study on many different domains, not only environmental, but also legal, institutional, economic, social, technical… Thus we had to narrow down the study to a more reasonable subject by defining the scope and boundaries of the study.
1.1 Company information [1] Toyota first began selling cars in Europe under an official distributor agreement in
Europe in 1963. Since then, the company has matured into the leading Japanese car manufacturer in this highly competitive market. Toyota has invested almost €7 billion throughout Europe since 1990, and currently employs approximately 80,000 people, both directly and through dealership channels. Toyota’s operations in Europe are supported by a network of 29 National Marketing and Sales Companies in 48 countries, a total of 3,300 sales outlets, and 9 manufacturing plants.
1.2 Context of the study With growing environmental concern in all human activities, one has no choice but
to reduce his energy use and pollution. One way to accomplish pollution reduction is to develop new energy systems based on carbon-free energy sources. Renewable energy sources, however, are usually not economically preferable compared to traditional carriers (i.e. fossil fuel). In order to achieve the major changes needed to decrease the environmental impacts of the industry, it is necessary to change, develop and build a favourable framework to overcome the present economic, technical, regulatory and institutional barriers.
To be successful over the long-term, companies have to be able to balance the expectations of various stakeholders (society, employees, customers, business partners and shareholders) through dialogue, transparency and working together. Socially responsible [2] companies integrate social, environmental and economic concerns in their business operations and in their interaction with their stakeholders on a voluntary basis (beyond legal requirements).
Toyota has in place a system for the coordination and promotion of initiatives important in contributing towards the sustainable development of society and the world. As part of this system, the Toyota Earth Charter* (adopted in 1992, revised in 2000) is based on the Guiding Principles at Toyota adopted in 1992 (revised in 1997), and embodies the comprehensive approach to global environmental issues. Toyota has been
* Appendix I - Table 34: Toyota Earth Charter
1 - Introduction
14
involved in environmental activities since 1963* and is now implementing its Fourth Toyota Environmental Action Plan [2] which seeks to achieve a balance between Toyota’s growth and harmony with society, and to contribute to the development of a sustainable society. The first subject of this action plan (CO2 emissions management) applied to TME is aiming at tackling energy and global warming issues by reducing CO2 emissions in all Toyota’s European operations (production and non-production areas). In response to this direction, Sustainable Plant activities† have been started at production level in two EMCs: TMMF and TMUK.
Reaction to this direction, the Sustainable Plant project includes the following areas of activity:
- Increase energy use efficiency; - Reduce CO2 emissions; - Reduce water use and increase wastewater recycling; - Reduce waste generation and increase waste valorisation; - Minimise of VOC emissions and increase VOC recovery; - Preserve and enhance biodiversity.
In this thesis work, we focused on the second area of activity: reduce CO2 emissions. It is important to note that the scope of this study is limited by the production sites’ boundaries and consequently, non-production and logistics activities outside the EMCs are excluded. And finally all CO2 emissions associated with the production activities are the energy-related emissions.
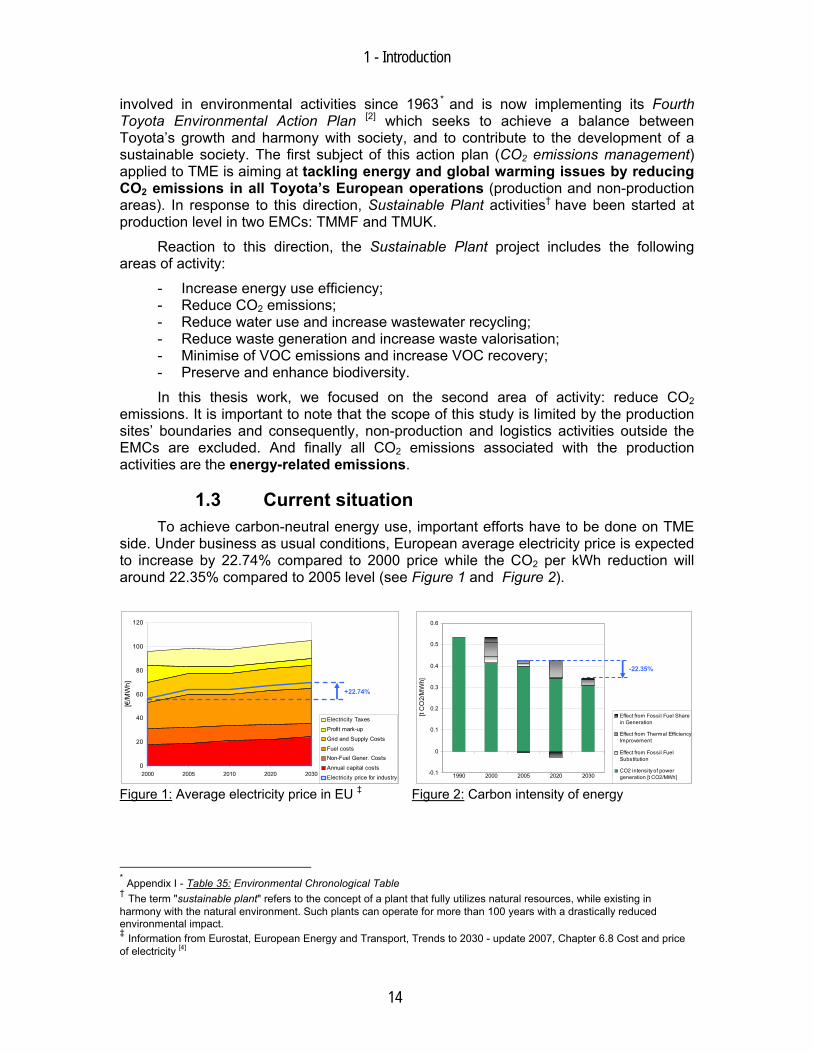
1.3 Current situation To achieve carbon-neutral energy use, important efforts have to be done on TME
side. Under business as usual conditions, European average electricity price is expected to increase by 22.74% compared to 2000 price while the CO2 per kWh reduction will around 22.35% compared to 2005 level (see Figure 1 and Figure 2).
0
20
40
60
80
100
120
2000 2005 2010 2020 2030
[€/M
Wh]
Electricity Taxes
Profit mark-up
Grid and Supply Costs
Fuel costsNon-Fuel Gener. Costs
Annual capital costs
Electricity price for industry
+22.74%
Figure 1: Average electricity price in EU ‡
-0.1
0
0.1
0.2
0.3
0.4
0.5
0.6
1990 2000 2005 2020 2030
[t C
O2/
MW
h]
Effect from Fossil Fuel Sharein Generation
Effect from Thermal EfficiencyImprovement
Effect from Fossil FuelSubstitution
CO2 intensity of powergeneration [t CO2/MWh]
-22.35%
Figure 2: Carbon intensity of energy
* Appendix I - Table 35: Environmental Chronological Table † The term "sustainable plant" refers to the concept of a plant that fully utilizes natural resources, while existing in harmony with the natural environment. Such plants can operate for more than 100 years with a drastically reduced environmental impact. ‡ Information from Eurostat, European Energy and Transport, Trends to 2030 - update 2007, Chapter 6.8 Cost and price of electricity [4]
1 - Introduction
15
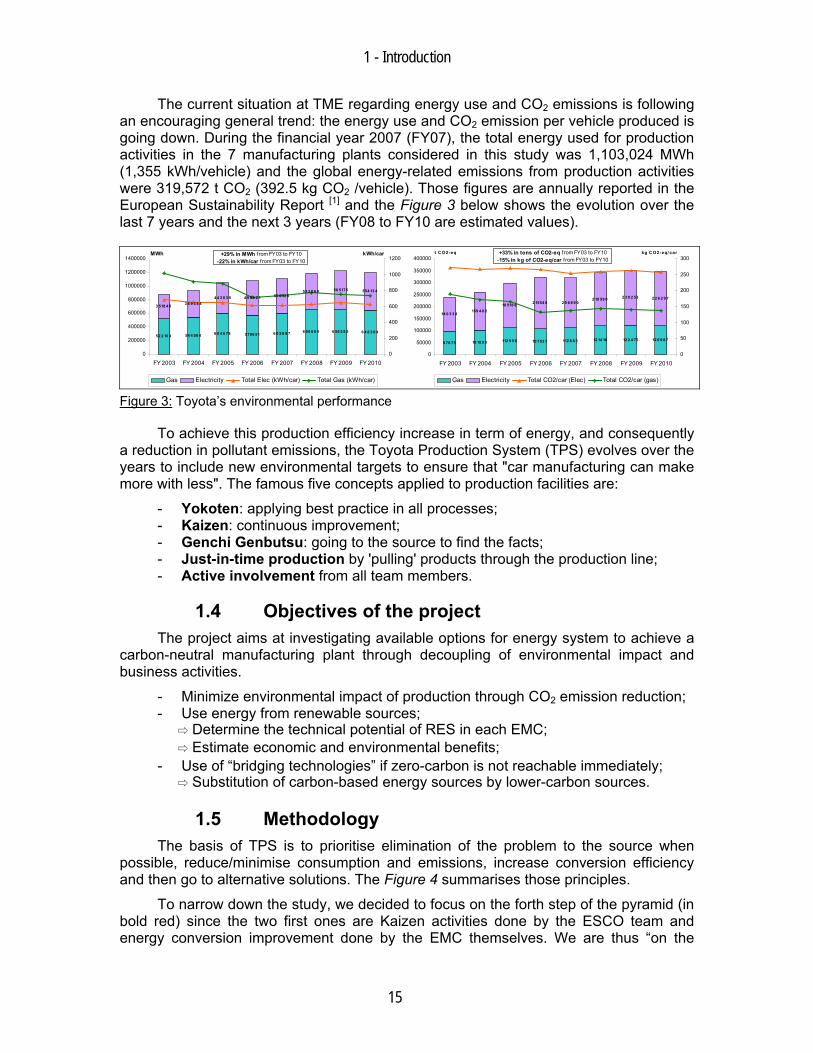
The current situation at TME regarding energy use and CO2 emissions is following an encouraging general trend: the energy use and CO2 emission per vehicle produced is going down. During the financial year 2007 (FY07), the total energy used for production activities in the 7 manufacturing plants considered in this study was 1,103,024 MWh (1,355 kWh/vehicle) and the global energy-related emissions from production activities were 319,572 t CO2 (392.5 kg CO2 /vehicle). Those figures are annually reported in the European Sustainability Report [1] and the Figure 3 below shows the evolution over the last 7 years and the next 3 years (FY08 to FY10 are estimated values).
52 2 16 4 54 4 50 4 6 0 4 6 79 5756 51 6 0 2 8 9 7 6 50 6 0 9 6 56 3 8 3 6 4 8 3 9 4
3 518 4 8 3 8 9 3 8 44 4 3 8 3 5 50 0 12 6
53 2 0 6 0 56 5175 554 13 44 9 9 0 2 1
0
200000
400000
600000
800000
1000000
1200000
1400000
FY 2003 FY 2004 FY 2005 FY 2006 FY 2007 FY 2008 FY 2009 FY 2010
MWh
0
200
400
600
800
1000
1200kWh/car
Gas Electricity Total Elec (kWh/car) Total Gas (kWh/car)
+29% in MWh f rom FY03 to FY10-22% in kWh/car f rom FY03 to FY10
9 78 79 10 18 9 9 112 9 9 8 10 753 7 112 6 8 3 12 14 18 12 2 4 75 12 0 9 8 7
14 0 3 3 4159 4 8 2
18 518 8 2 0 6 8 9 02 18 59 0 2 3 0 2 53 2 2 6 2 9 7
2 1554 8
0
50000
100000
150000
200000
250000
300000
350000
400000
FY 2003 FY 2004 FY 2005 FY 2006 FY 2007 FY 2008 FY 2009 FY 2010
t C O2-eq
0
50
100
150
200
250
300kg C O2-eq/ car
Gas Electricity Total CO2/car (Elec) Total CO2/car (gas)
+33% in tons of CO2-eq from FY03 to FY10-15% in kg of CO2-eq/car f rom FY03 to FY10
Figure 3: Toyota’s environmental performance
To achieve this production efficiency increase in term of energy, and consequently a reduction in pollutant emissions, the Toyota Production System (TPS) evolves over the years to include new environmental targets to ensure that "car manufacturing can make more with less". The famous five concepts applied to production facilities are:
- Yokoten: applying best practice in all processes; - Kaizen: continuous improvement; - Genchi Genbutsu: going to the source to find the facts; - Just-in-time production by 'pulling' products through the production line; - Active involvement from all team members.
1.4 Objectives of the project The project aims at investigating available options for energy system to achieve a
carbon-neutral manufacturing plant through decoupling of environmental impact and business activities.
- Minimize environmental impact of production through CO2 emission reduction; - Use energy from renewable sources;
⇨ Determine the technical potential of RES in each EMC; ⇨ Estimate economic and environmental benefits;
- Use of “bridging technologies” if zero-carbon is not reachable immediately; ⇨ Substitution of carbon-based energy sources by lower-carbon sources.
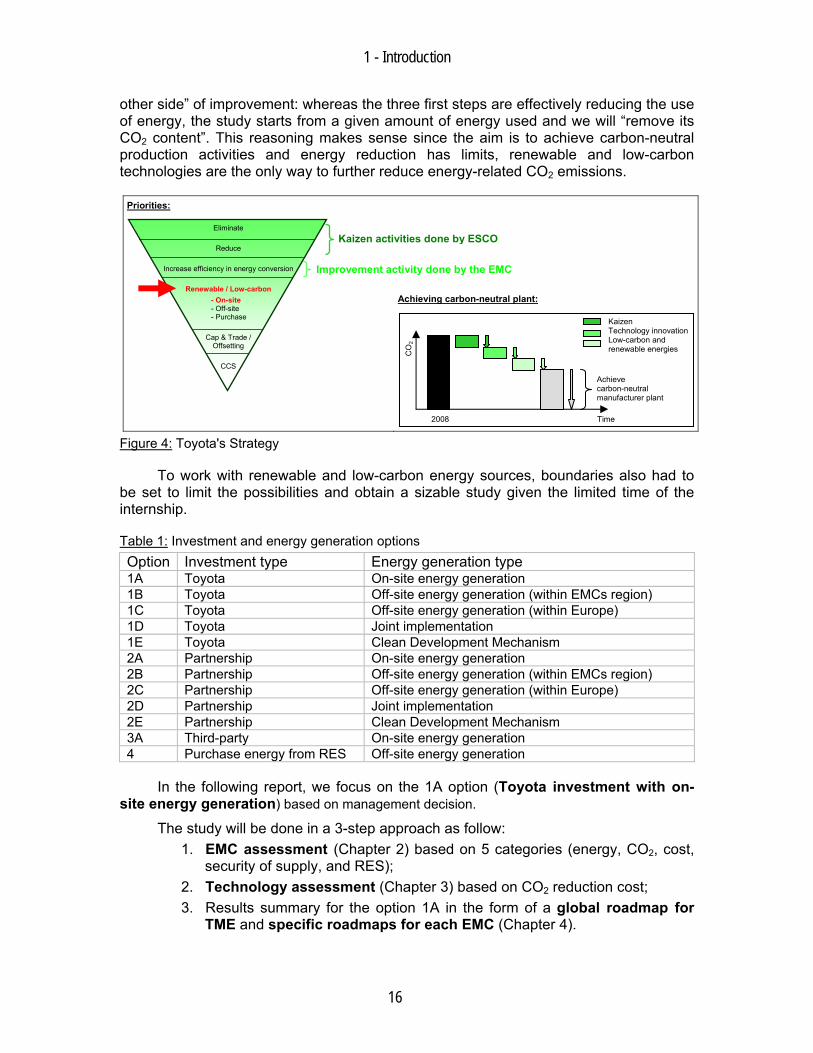
1.5 Methodology The basis of TPS is to prioritise elimination of the problem to the source when
possible, reduce/minimise consumption and emissions, increase conversion efficiency and then go to alternative solutions. The Figure 4 summarises those principles.
To narrow down the study, we decided to focus on the forth step of the pyramid (in bold red) since the two first ones are Kaizen activities done by the ESCO team and energy conversion improvement done by the EMC themselves. We are thus “on the
1 - Introduction
16
other side” of improvement: whereas the three first steps are effectively reducing the use of energy, the study starts from a given amount of energy used and we will “remove its CO2 content”. This reasoning makes sense since the aim is to achieve carbon-neutral production activities and energy reduction has limits, renewable and low-carbon technologies are the only way to further reduce energy-related CO2 emissions.
Priorities:
Achieving carbon-neutral plant:
Figure 4: Toyota's Strategy
To work with renewable and low-carbon energy sources, boundaries also had to be set to limit the possibilities and obtain a sizable study given the limited time of the internship.
Table 1: Investment and energy generation options Option Investment type Energy generation type 1A Toyota On-site energy generation 1B Toyota Off-site energy generation (within EMCs region) 1C Toyota Off-site energy generation (within Europe) 1D Toyota Joint implementation 1E Toyota Clean Development Mechanism 2A Partnership On-site energy generation 2B Partnership Off-site energy generation (within EMCs region) 2C Partnership Off-site energy generation (within Europe) 2D Partnership Joint implementation 2E Partnership Clean Development Mechanism 3A Third-party On-site energy generation 4 Purchase energy from RES Off-site energy generation
In the following report, we focus on the 1A option (Toyota investment with on-site energy generation) based on management decision.
The study will be done in a 3-step approach as follow: 1. EMC assessment (Chapter 2) based on 5 categories (energy, CO2, cost,
security of supply, and RES); 2. Technology assessment (Chapter 3) based on CO2 reduction cost; 3. Results summary for the option 1A in the form of a global roadmap for
TME and specific roadmaps for each EMC (Chapter 4).
Kaizen Technology innovation Low-carbon and renewable energies C
O2
2008 Time
Achieve carbon-neutral manufacturer plant
Kaizen activities done by ESCO
Improvement activity done by the EMC
Eliminate
Reduce
Increase efficiency in energy conversion
Renewable / Low-carbon - On-site - Off-site - Purchase
Cap & Trade / Offsetting
CCS
2 - EMC assessment
17
2 EMC ASSESSMENT
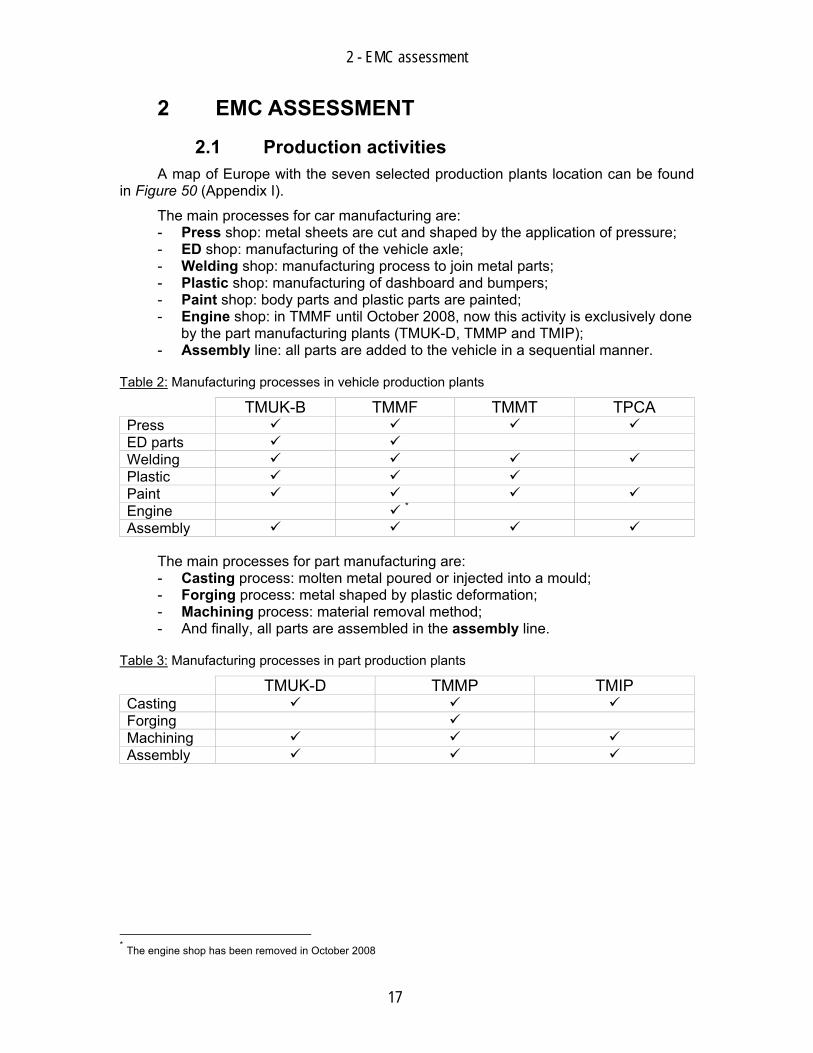
2.1 Production activities A map of Europe with the seven selected production plants location can be found
in Figure 50 (Appendix I).
The main processes for car manufacturing are: - Press shop: metal sheets are cut and shaped by the application of pressure; - ED shop: manufacturing of the vehicle axle; - Welding shop: manufacturing process to join metal parts; - Plastic shop: manufacturing of dashboard and bumpers; - Paint shop: body parts and plastic parts are painted; - Engine shop: in TMMF until October 2008, now this activity is exclusively done
by the part manufacturing plants (TMUK-D, TMMP and TMIP); - Assembly line: all parts are added to the vehicle in a sequential manner.
Table 2: Manufacturing processes in vehicle production plants
TMUK-B TMMF TMMT TPCA Press ED parts Welding Plastic Paint Engine * Assembly
The main processes for part manufacturing are: - Casting process: molten metal poured or injected into a mould; - Forging process: metal shaped by plastic deformation; - Machining process: material removal method; - And finally, all parts are assembled in the assembly line.
Table 3: Manufacturing processes in part production plants
TMUK-D TMMP TMIP Casting Forging Machining Assembly
* The engine shop has been removed in October 2008
2 - EMC assessment
18
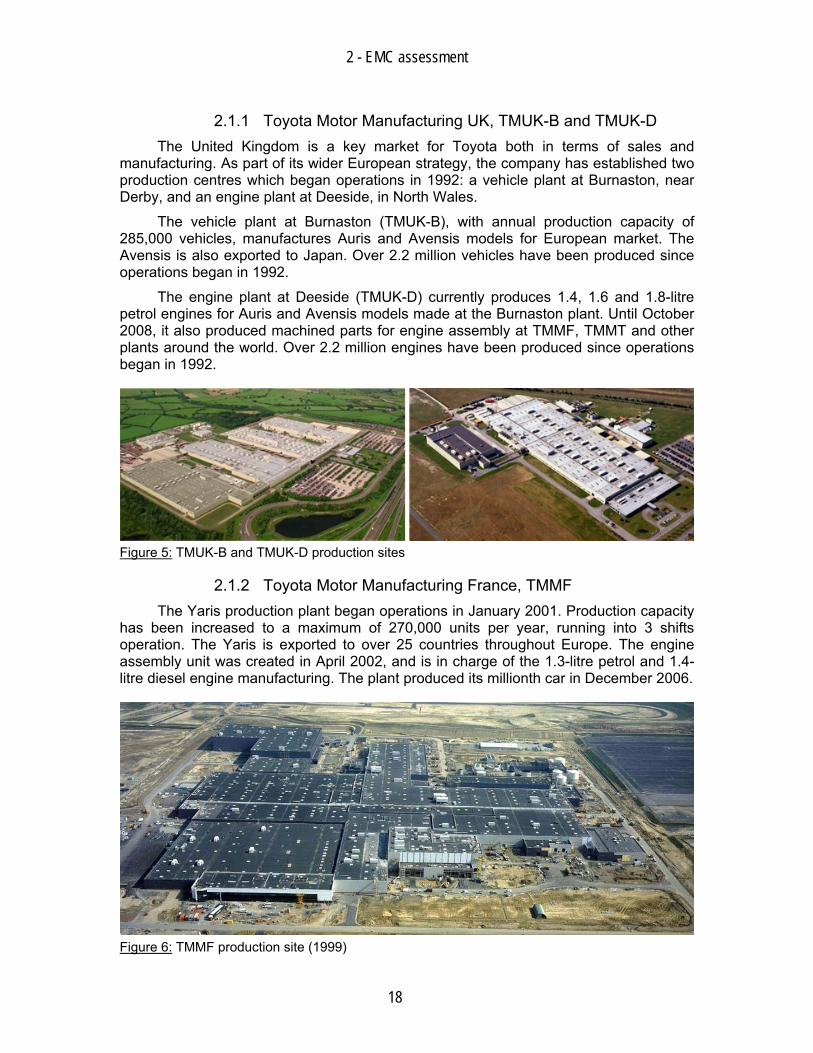
2.1.1 Toyota Motor Manufacturing UK, TMUK-B and TMUK-D The United Kingdom is a key market for Toyota both in terms of sales and
manufacturing. As part of its wider European strategy, the company has established two production centres which began operations in 1992: a vehicle plant at Burnaston, near Derby, and an engine plant at Deeside, in North Wales.
The vehicle plant at Burnaston (TMUK-B), with annual production capacity of 285,000 vehicles, manufactures Auris and Avensis models for European market. The Avensis is also exported to Japan. Over 2.2 million vehicles have been produced since operations began in 1992.
The engine plant at Deeside (TMUK-D) currently produces 1.4, 1.6 and 1.8-litre petrol engines for Auris and Avensis models made at the Burnaston plant. Until October 2008, it also produced machined parts for engine assembly at TMMF, TMMT and other plants around the world. Over 2.2 million engines have been produced since operations began in 1992.
Figure 5: TMUK-B and TMUK-D production sites
2.1.2 Toyota Motor Manufacturing France, TMMF The Yaris production plant began operations in January 2001. Production capacity
has been increased to a maximum of 270,000 units per year, running into 3 shifts operation. The Yaris is exported to over 25 countries throughout Europe. The engine assembly unit was created in April 2002, and is in charge of the 1.3-litre petrol and 1.4-litre diesel engine manufacturing. The plant produced its millionth car in December 2006.
Figure 6: TMMF production site (1999)
2 - EMC assessment
19
The Valenciennes-Onnaing production unit has been entirely designed with the aim of the Toyota Production System (TPS). The plant is made of one single building with the shape of a star, in order to optimise in all stages of the manufacturing process the flow of parts, vehicles and information. Buffer stocks areas are also kept to a minimum.
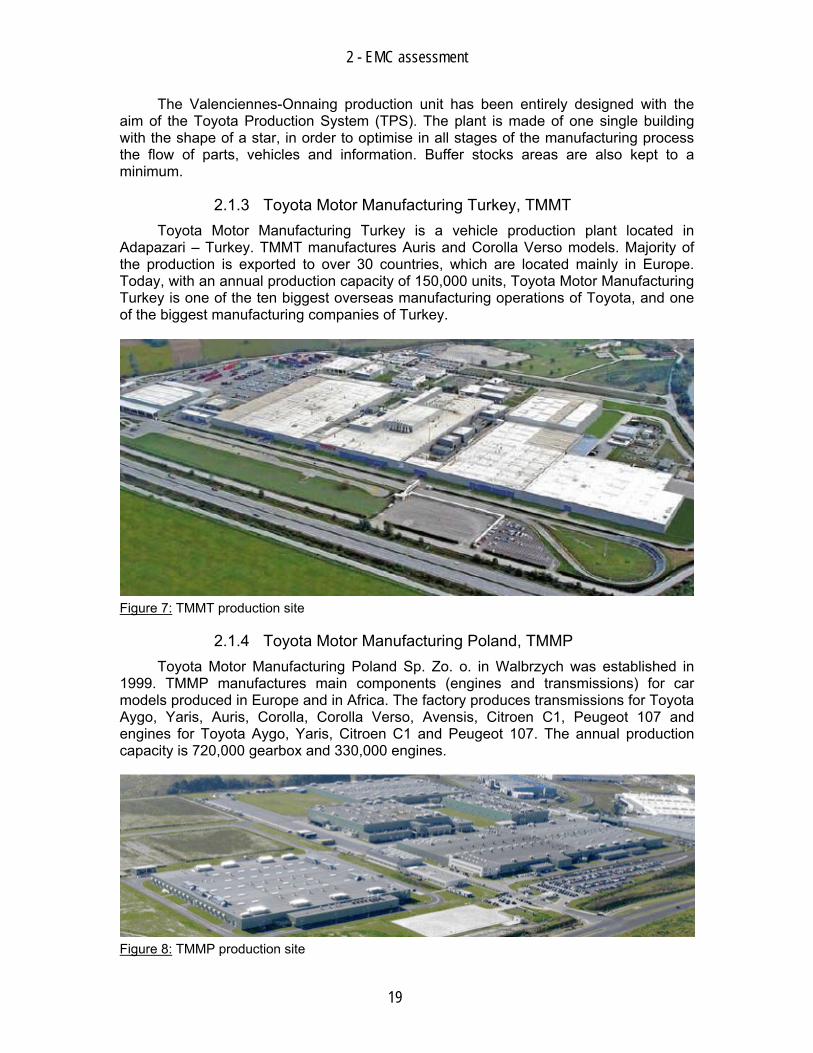
2.1.3 Toyota Motor Manufacturing Turkey, TMMT Toyota Motor Manufacturing Turkey is a vehicle production plant located in
Adapazari – Turkey. TMMT manufactures Auris and Corolla Verso models. Majority of the production is exported to over 30 countries, which are located mainly in Europe. Today, with an annual production capacity of 150,000 units, Toyota Motor Manufacturing Turkey is one of the ten biggest overseas manufacturing operations of Toyota, and one of the biggest manufacturing companies of Turkey.
Figure 7: TMMT production site
2.1.4 Toyota Motor Manufacturing Poland, TMMP Toyota Motor Manufacturing Poland Sp. Zo. o. in Walbrzych was established in
1999. TMMP manufactures main components (engines and transmissions) for car models produced in Europe and in Africa. The factory produces transmissions for Toyota Aygo, Yaris, Auris, Corolla, Corolla Verso, Avensis, Citroen C1, Peugeot 107 and engines for Toyota Aygo, Yaris, Citroen C1 and Peugeot 107. The annual production capacity is 720,000 gearbox and 330,000 engines.
Figure 8: TMMP production site
2 - EMC assessment
20
The factory in Walbrzych in terms of production volume is one of Toyota’s largest component production based outside Japan.
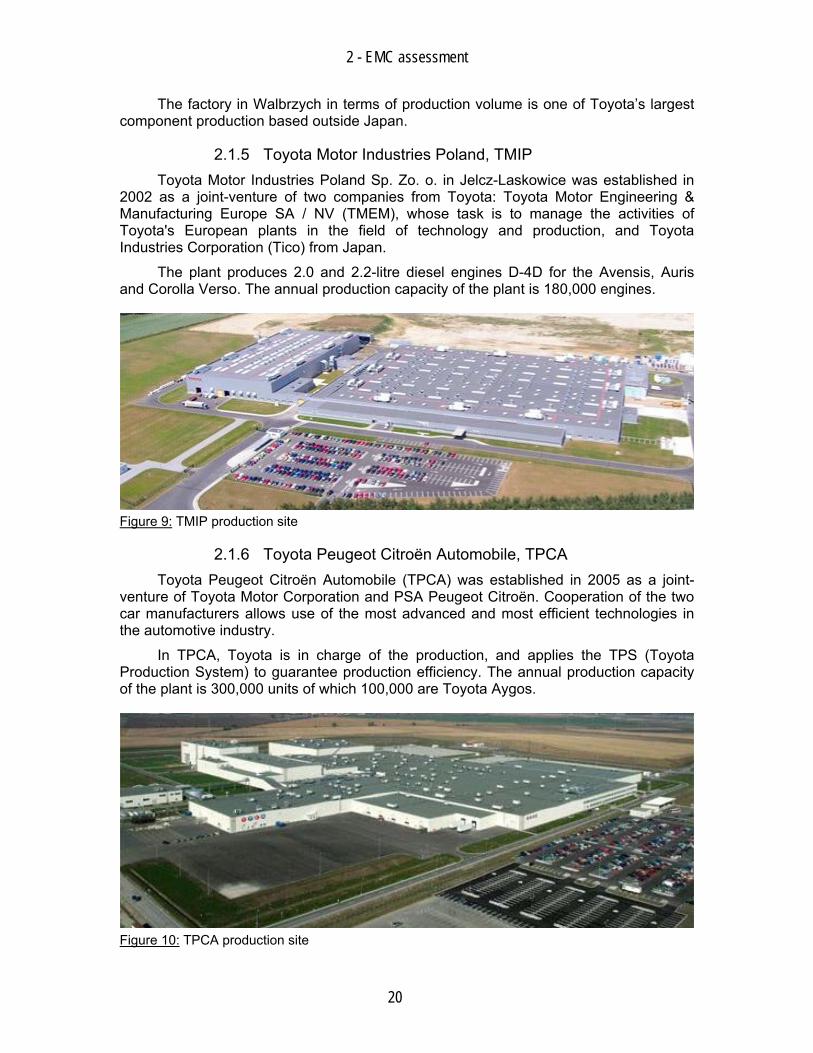
2.1.5 Toyota Motor Industries Poland, TMIP Toyota Motor Industries Poland Sp. Zo. o. in Jelcz-Laskowice was established in
2002 as a joint-venture of two companies from Toyota: Toyota Motor Engineering & Manufacturing Europe SA / NV (TMEM), whose task is to manage the activities of Toyota's European plants in the field of technology and production, and Toyota Industries Corporation (Tico) from Japan.
The plant produces 2.0 and 2.2-litre diesel engines D-4D for the Avensis, Auris and Corolla Verso. The annual production capacity of the plant is 180,000 engines.
Figure 9: TMIP production site
2.1.6 Toyota Peugeot Citroën Automobile, TPCA Toyota Peugeot Citroën Automobile (TPCA) was established in 2005 as a joint-
venture of Toyota Motor Corporation and PSA Peugeot Citroën. Cooperation of the two car manufacturers allows use of the most advanced and most efficient technologies in the automotive industry.
In TPCA, Toyota is in charge of the production, and applies the TPS (Toyota Production System) to guarantee production efficiency. The annual production capacity of the plant is 300,000 units of which 100,000 are Toyota Aygos.
Figure 10: TPCA production site
2 - EMC assessment
21
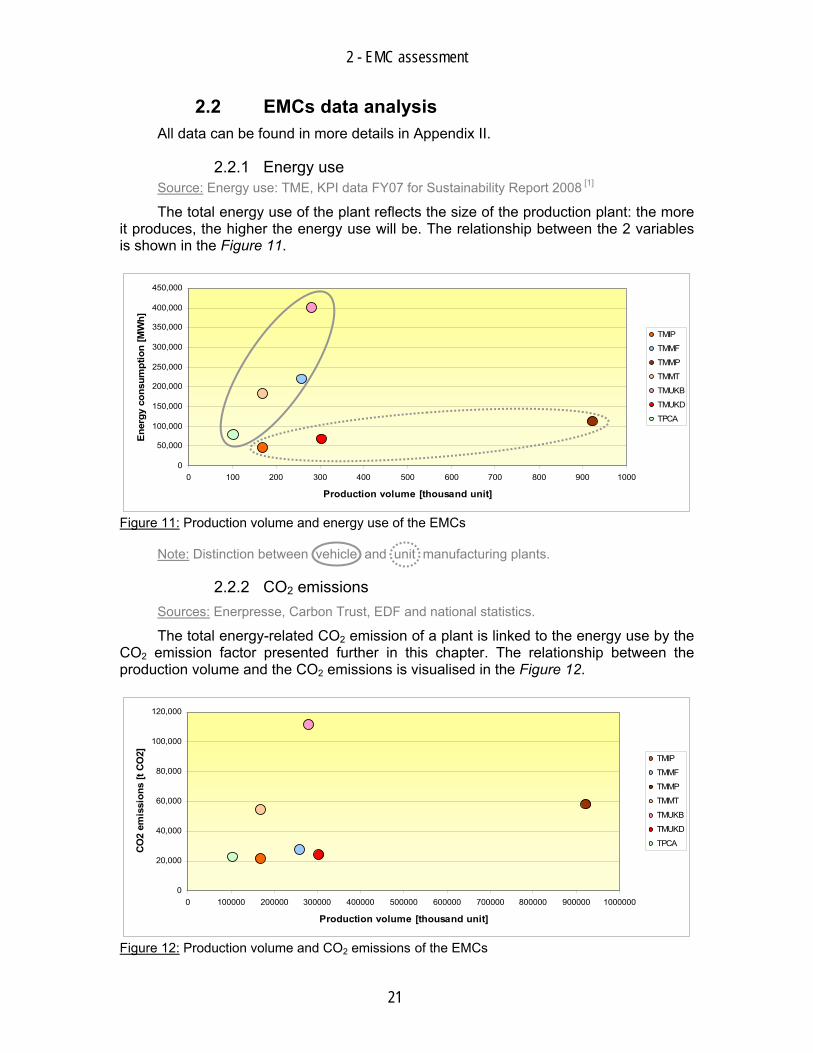
2.2 EMCs data analysis All data can be found in more details in Appendix II.
2.2.1 Energy use Source: Energy use: TME, KPI data FY07 for Sustainability Report 2008 [1]
The total energy use of the plant reflects the size of the production plant: the more it produces, the higher the energy use will be. The relationship between the 2 variables is shown in the Figure 11.
0
50,000
100,000
150,000
200,000
250,000
300,000
350,000
400,000
450,000
0 100 200 300 400 500 600 700 800 900 1000
Production volume [thousand unit]
Ener
gy c
onsu
mpt
ion
[MW
h]
TMIP
TMMF
TMMP
TMMT
TMUKB
TMUKD
TPCA
Figure 11: Production volume and energy use of the EMCs
Note: Distinction between vehicle and unit manufacturing plants.
2.2.2 CO2 emissions Sources: Enerpresse, Carbon Trust, EDF and national statistics.
The total energy-related CO2 emission of a plant is linked to the energy use by the CO2 emission factor presented further in this chapter. The relationship between the production volume and the CO2 emissions is visualised in the Figure 12.
0
20,000
40,000
60,000
80,000
100,000
120,000
0 100000 200000 300000 400000 500000 600000 700000 800000 900000 1000000
Production volume [thousand unit]
CO2
emis
sion
s [t
CO2] TMIP
TMMF
TMMP
TMMT
TMUKB
TMUKD
TPCA
Figure 12: Production volume and CO2 emissions of the EMCs
2 - EMC assessment
22
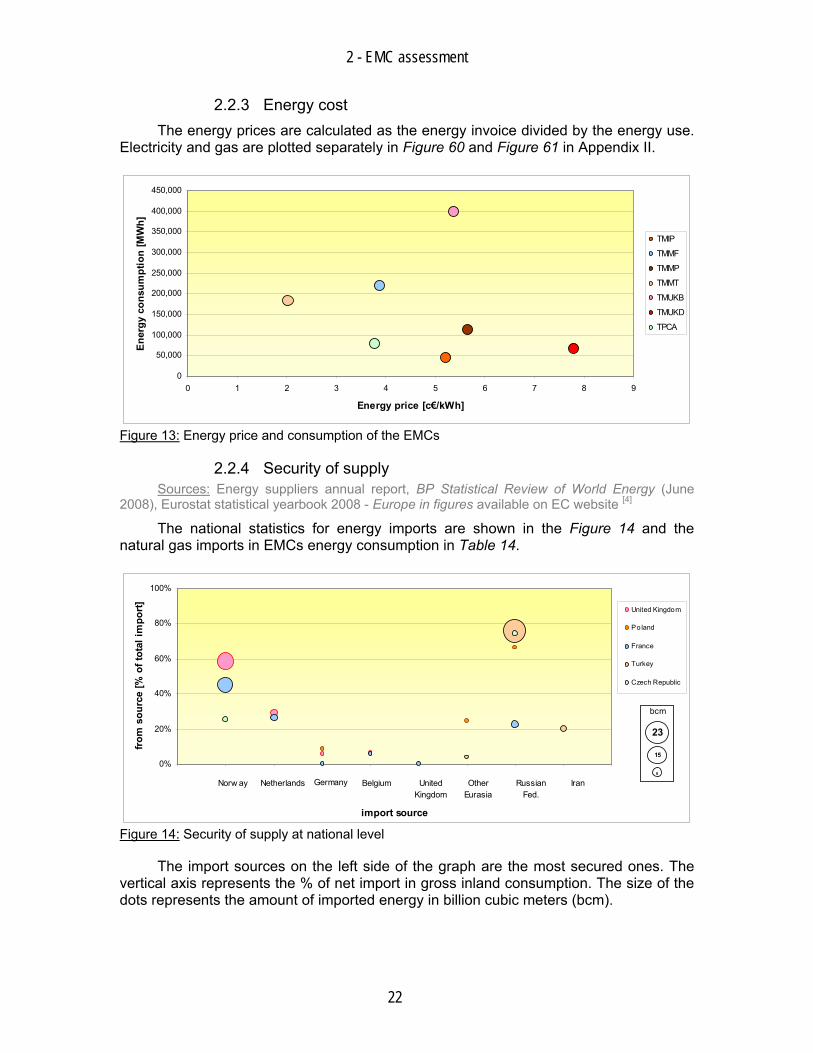
2.2.3 Energy cost The energy prices are calculated as the energy invoice divided by the energy use.
Electricity and gas are plotted separately in Figure 60 and Figure 61 in Appendix II.
0
50,000
100,000
150,000
200,000
250,000
300,000
350,000
400,000
450,000
0 1 2 3 4 5 6 7 8 9
Energy price [c€/kWh]
Ener
gy c
onsu
mpt
ion
[MW
h]
TMIP
TMMF
TMMP
TMMT
TMUKB
TMUKD
TPCA
Figure 13: Energy price and consumption of the EMCs
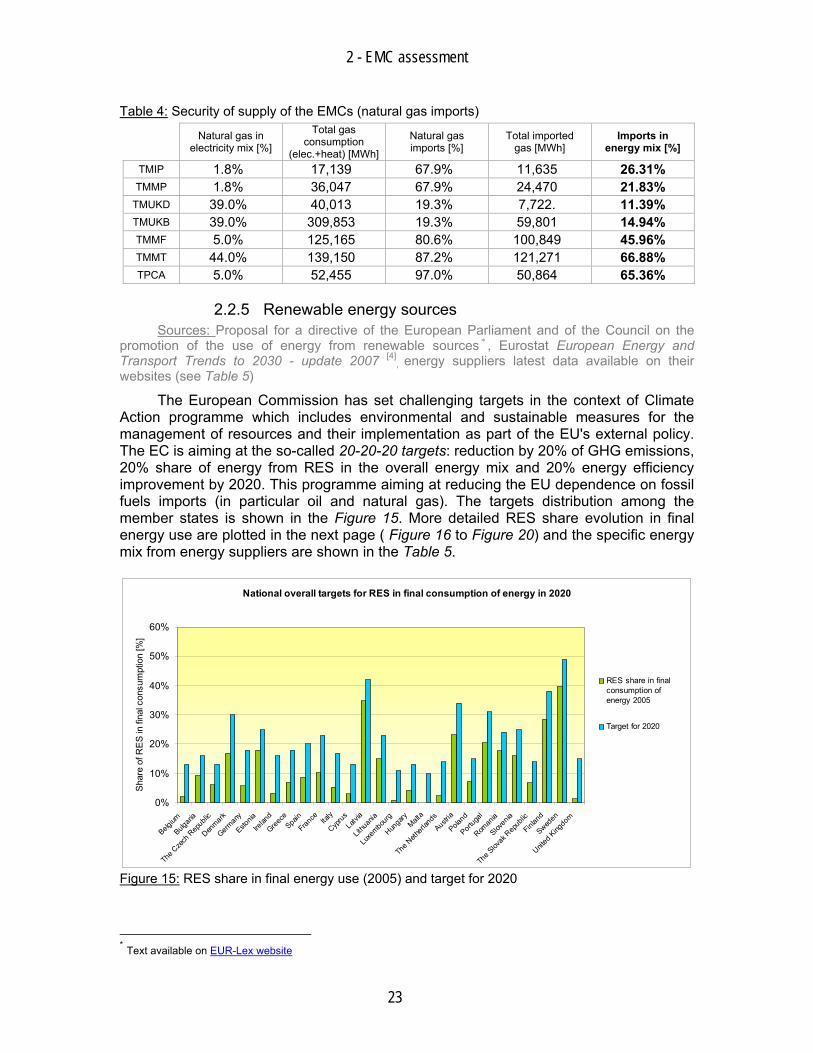
2.2.4 Security of supply Sources: Energy suppliers annual report, BP Statistical Review of World Energy (June
2008), Eurostat statistical yearbook 2008 - Europe in figures available on EC website [4]
The national statistics for energy imports are shown in the Figure 14 and the natural gas imports in EMCs energy consumption in Table 14.
0%
20%
40%
60%
80%
100%
0 1 2 3 4 5 6 7 8 9
import source
from
sou
rce
[% o
f tot
al im
port] United Kingdom
Poland
France
Turkey
Czech Republic
Norw ay Netherlands Germany Belgium UnitedKingdom
OtherEurasia
RussianFed.
Iran
bcm
23
15
8
Figure 14: Security of supply at national level
The import sources on the left side of the graph are the most secured ones. The vertical axis represents the % of net import in gross inland consumption. The size of the dots represents the amount of imported energy in billion cubic meters (bcm).
2 - EMC assessment
23
Table 4: Security of supply of the EMCs (natural gas imports)
Natural gas in electricity mix [%]
Total gas consumption
(elec.+heat) [MWh]
Natural gas imports [%]
Total imported gas [MWh]
Imports in energy mix [%]
TMIP 1.8% 17,139 67.9% 11,635 26.31% TMMP 1.8% 36,047 67.9% 24,470 21.83%
TMUKD 39.0% 40,013 19.3% 7,722. 11.39% TMUKB 39.0% 309,853 19.3% 59,801 14.94% TMMF 5.0% 125,165 80.6% 100,849 45.96% TMMT 44.0% 139,150 87.2% 121,271 66.88% TPCA 5.0% 52,455 97.0% 50,864 65.36%
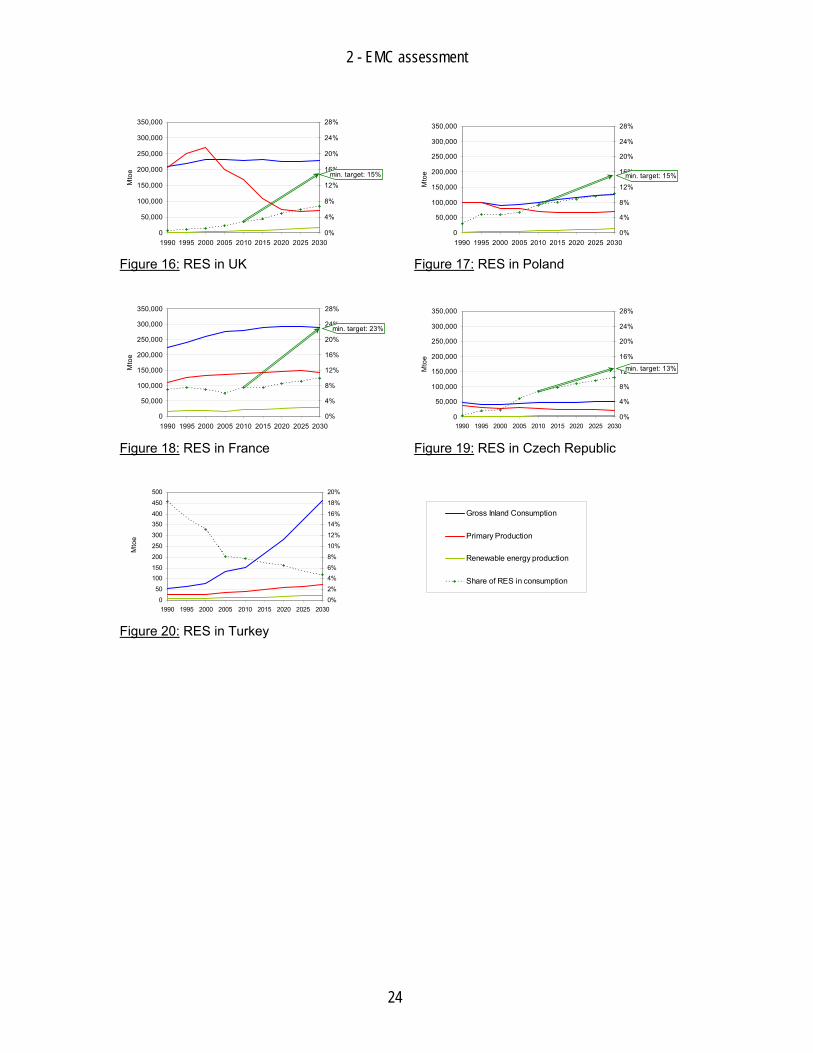
2.2.5 Renewable energy sources Sources: Proposal for a directive of the European Parliament and of the Council on the
promotion of the use of energy from renewable sources * , Eurostat European Energy and Transport Trends to 2030 - update 2007 [4]
, energy suppliers latest data available on their websites (see Table 5)
The European Commission has set challenging targets in the context of Climate Action programme which includes environmental and sustainable measures for the management of resources and their implementation as part of the EU's external policy. The EC is aiming at the so-called 20-20-20 targets: reduction by 20% of GHG emissions, 20% share of energy from RES in the overall energy mix and 20% energy efficiency improvement by 2020. This programme aiming at reducing the EU dependence on fossil fuels imports (in particular oil and natural gas). The targets distribution among the member states is shown in the Figure 15. More detailed RES share evolution in final energy use are plotted in the next page ( Figure 16 to Figure 20) and the specific energy mix from energy suppliers are shown in the Table 5.
National overall targets for RES in final consumption of energy in 2020
0%
10%
20%
30%
40%
50%
60%
Belgium
Bulgari
a
The C
zech
Rep
ublic
Denmark
German
y
Estonia
Irelan
d
Greece
Spain
France Ita
ly
Cyprus
Latvia
Lithua
nia
Luxe
mbourg
Hungary
Malta
The N
etherl
ands
Austria
Poland
Portug
al
Roman
ia
Sloven
ia
The Slov
ak R
epub
lic
Finland
Sweden
United
Kingdom
Shar
e of
RE
S in
fina
l con
sum
ptio
n [%
]
RES share in finalconsumption ofenergy 2005
Target for 2020
Figure 15: RES share in final energy use (2005) and target for 2020
* Text available on EUR-Lex website
2 - EMC assessment
24
0
50,000
100,000
150,000
200,000
250,000
300,000
350,000
1990 1995 2000 2005 2010 2015 2020 2025 2030
Mto
e
0%
4%
8%
12%
16%
20%
24%
28%
min. target: 15%
Figure 16: RES in UK
0
50,000
100,000
150,000
200,000
250,000
300,000
350,000
1990 1995 2000 2005 2010 2015 2020 2025 2030
Mto
e
0%
4%
8%
12%
16%
20%
24%
28%
min. target: 15%
Figure 17: RES in Poland
0
50,000
100,000
150,000
200,000
250,000
300,000
350,000
1990 1995 2000 2005 2010 2015 2020 2025 2030
Mto
e
0%
4%
8%
12%
16%
20%
24%
28%
min. target: 23%
Figure 18: RES in France
0
50,000
100,000
150,000
200,000
250,000
300,000
350,000
1990 1995 2000 2005 2010 2015 2020 2025 2030M
toe
0%
4%
8%
12%
16%
20%
24%
28%
min. target: 13%
Figure 19: RES in Czech Republic
0
50
100150
200
250
300
350400
450
500
1990 1995 2000 2005 2010 2015 2020 2025 2030
Mto
e
0%
2%
4%6%
8%
10%
12%
14%16%
18%
20%
Gross Inland Consumption
Primary Production
Renewable energy production
Share of RES in consumption
Figure 20: RES in Turkey
2 - EMC assessment
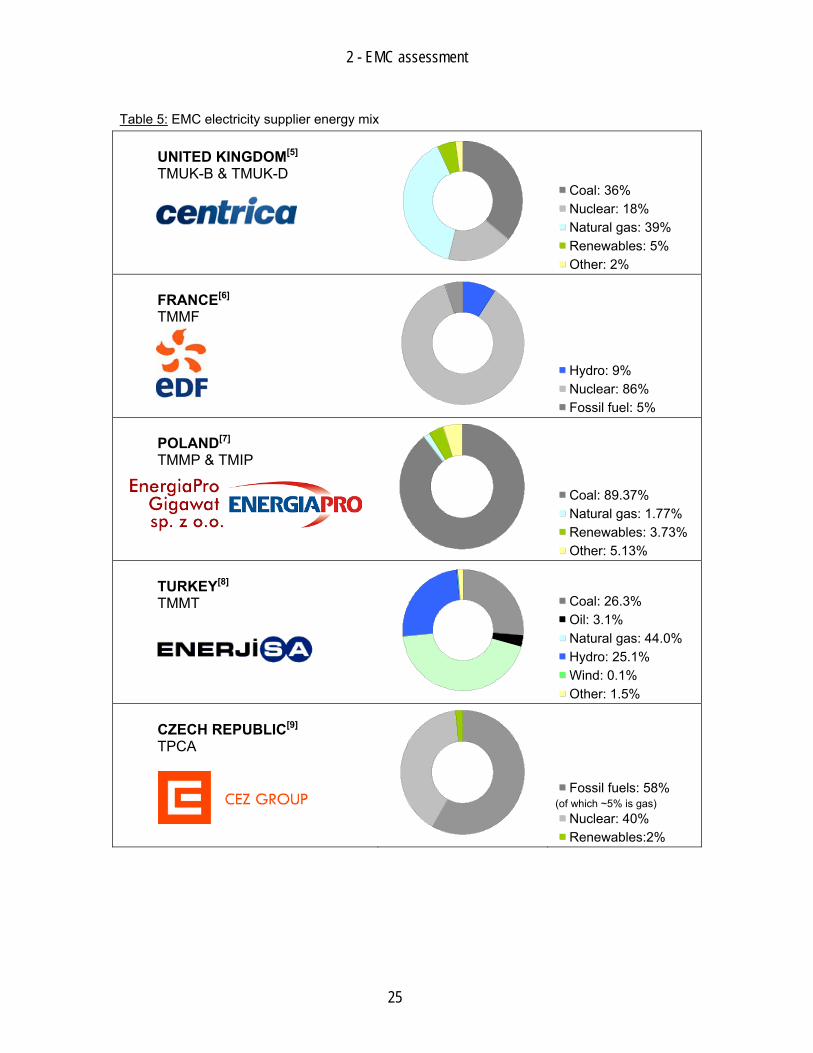
25
Table 5: EMC electricity supplier energy mix UNITED KINGDOM[5] TMUK-B & TMUK-D
■■ Coal: 36% ■■ Nuclear: 18% ■■ Natural gas: 39% ■■ Renewables: 5% ■■ Other: 2%
FRANCE[6] TMMF
■■ Hydro: 9% ■■ Nuclear: 86% ■■ Fossil fuel: 5%
POLAND[7] TMMP & TMIP
■■ Coal: 89.37% ■■ Natural gas: 1.77% ■■ Renewables: 3.73% ■■ Other: 5.13%
TURKEY[8] TMMT ■■ Coal: 26.3%
■■ Oil: 3.1% ■■ Natural gas: 44.0% ■■ Hydro: 25.1% ■■ Wind: 0.1% ■■ Other: 1.5%
CZECH REPUBLIC[9] TPCA
■■ Fossil fuels: 58% (of which ~5% is gas) ■■ Nuclear: 40% ■■ Renewables:2%
2 - EMC assessment
26
2.3 Summary
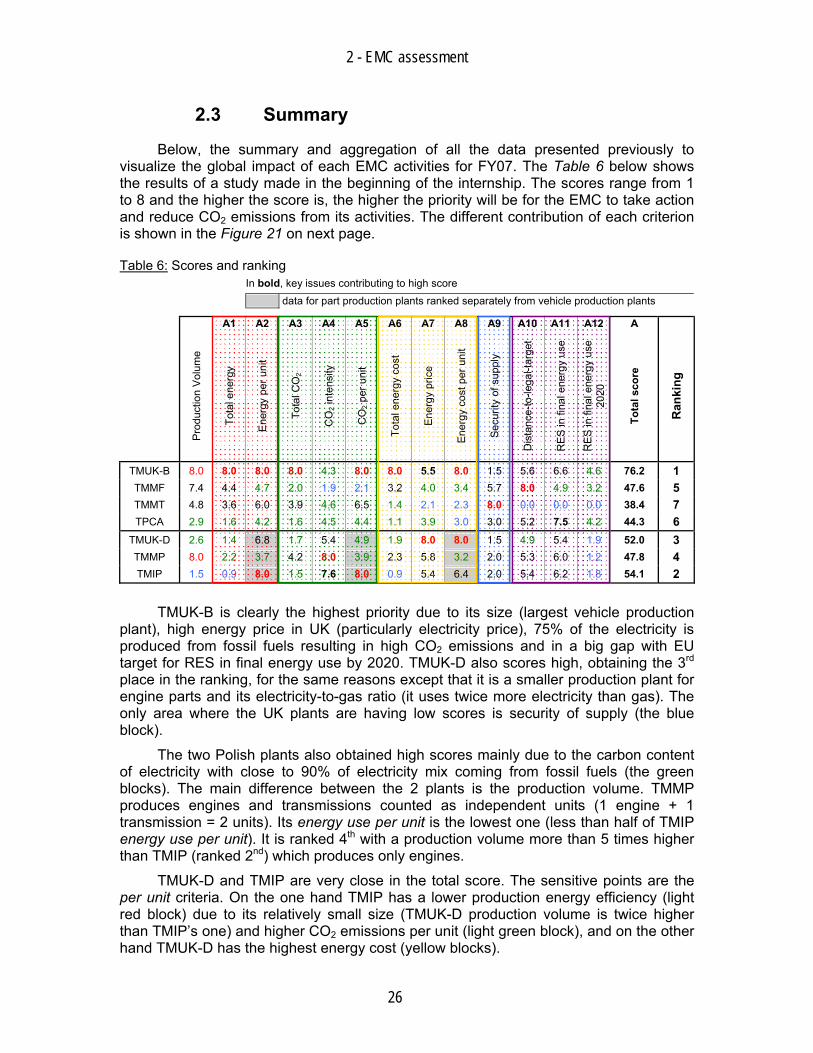
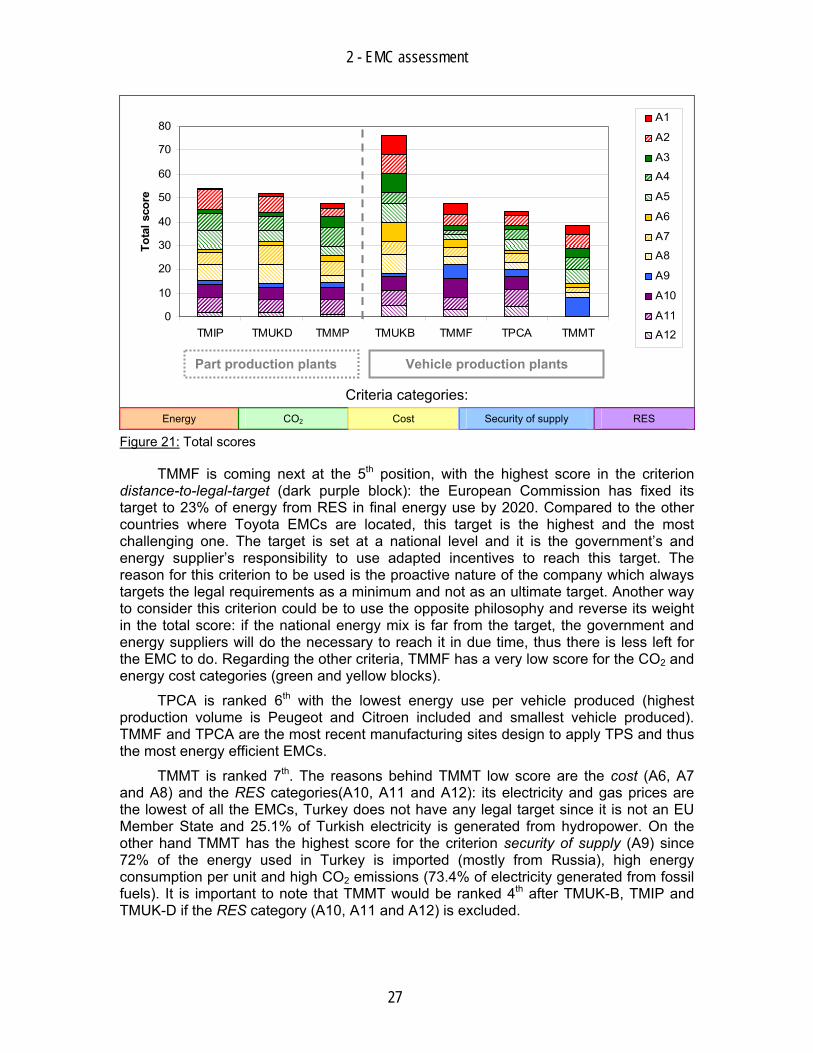
Below, the summary and aggregation of all the data presented previously to visualize the global impact of each EMC activities for FY07. The Table 6 below shows the results of a study made in the beginning of the internship. The scores range from 1 to 8 and the higher the score is, the higher the priority will be for the EMC to take action and reduce CO2 emissions from its activities. The different contribution of each criterion is shown in the Figure 21 on next page.
Table 6: Scores and ranking In bold, key issues contributing to high score
data for part production plants ranked separately from vehicle production plants
A1 A2 A3 A4 A5 A6 A7 A8 A9 A10 A11 A12 A
Pro
duct
ion
Vol
ume
Tota
l ene
rgy
Ene
rgy
per u
nit
Tota
l CO
2
CO
2 int
ensi
ty
CO
2 per
uni
t
Tota
l ene
rgy
cost
Ene
rgy
pric
e
Ene
rgy
cost
per
uni
t
Sec
urity
of s
uppl
y
Dis
tanc
e-to
-lega
l-tar
get
RE
S in
fina
l ene
rgy
use
RE
S in
fina
l ene
rgy
use
2020
Tota
l sco
re
Ran
king
TMUK-B 8.0 8.0 8.0 8.0 4.3 8.0 8.0 5.5 8.0 1.5 5.6 6.6 4.6 76.2 1 TMMF 7.4 4.4 4.7 2.0 1.9 2.1 3.2 4.0 3.4 5.7 8.0 4.9 3.2 47.6 5 TMMT 4.8 3.6 6.0 3.9 4.6 6.5 1.4 2.1 2.3 8.0 0.0 0.0 0.0 38.4 7 TPCA 2.9 1.6 4.2 1.6 4.5 4.4 1.1 3.9 3.0 3.0 5.2 7.5 4.2 44.3 6
TMUK-D 2.6 1.4 6.8 1.7 5.4 4.9 1.9 8.0 8.0 1.5 4.9 5.4 1.9 52.0 3 TMMP 8.0 2.2 3.7 4.2 8.0 3.9 2.3 5.8 3.2 2.0 5.3 6.0 1.2 47.8 4 TMIP 1.5 0.9 8.0 1.5 7.6 8.0 0.9 5.4 6.4 2.0 5.4 6.2 1.8 54.1 2
TMUK-B is clearly the highest priority due to its size (largest vehicle production plant), high energy price in UK (particularly electricity price), 75% of the electricity is produced from fossil fuels resulting in high CO2 emissions and in a big gap with EU target for RES in final energy use by 2020. TMUK-D also scores high, obtaining the 3rd place in the ranking, for the same reasons except that it is a smaller production plant for engine parts and its electricity-to-gas ratio (it uses twice more electricity than gas). The only area where the UK plants are having low scores is security of supply (the blue block).
The two Polish plants also obtained high scores mainly due to the carbon content of electricity with close to 90% of electricity mix coming from fossil fuels (the green blocks). The main difference between the 2 plants is the production volume. TMMP produces engines and transmissions counted as independent units (1 engine + 1 transmission = 2 units). Its energy use per unit is the lowest one (less than half of TMIP energy use per unit). It is ranked 4th with a production volume more than 5 times higher than TMIP (ranked 2nd) which produces only engines.
TMUK-D and TMIP are very close in the total score. The sensitive points are the per unit criteria. On the one hand TMIP has a lower production energy efficiency (light red block) due to its relatively small size (TMUK-D production volume is twice higher than TMIP’s one) and higher CO2 emissions per unit (light green block), and on the other hand TMUK-D has the highest energy cost (yellow blocks).
2 - EMC assessment
27
0
10
20
30
40
50
60
70
80
TMIP TMUKD TMMP TMUKB TMMF TPCA TMMT
Tota
l sco
re
A1
A2
A3
A4
A5
A6
A7
A8
A9
A10
A11
A12
Criteria categories:
Energy CO2 Cost Security of supply RES
Figure 21: Total scores
TMMF is coming next at the 5th position, with the highest score in the criterion distance-to-legal-target (dark purple block): the European Commission has fixed its target to 23% of energy from RES in final energy use by 2020. Compared to the other countries where Toyota EMCs are located, this target is the highest and the most challenging one. The target is set at a national level and it is the government’s and energy supplier’s responsibility to use adapted incentives to reach this target. The reason for this criterion to be used is the proactive nature of the company which always targets the legal requirements as a minimum and not as an ultimate target. Another way to consider this criterion could be to use the opposite philosophy and reverse its weight in the total score: if the national energy mix is far from the target, the government and energy suppliers will do the necessary to reach it in due time, thus there is less left for the EMC to do. Regarding the other criteria, TMMF has a very low score for the CO2 and energy cost categories (green and yellow blocks).
TPCA is ranked 6th with the lowest energy use per vehicle produced (highest production volume is Peugeot and Citroen included and smallest vehicle produced). TMMF and TPCA are the most recent manufacturing sites design to apply TPS and thus the most energy efficient EMCs.
TMMT is ranked 7th. The reasons behind TMMT low score are the cost (A6, A7 and A8) and the RES categories(A10, A11 and A12): its electricity and gas prices are the lowest of all the EMCs, Turkey does not have any legal target since it is not an EU Member State and 25.1% of Turkish electricity is generated from hydropower. On the other hand TMMT has the highest score for the criterion security of supply (A9) since 72% of the energy used in Turkey is imported (mostly from Russia), high energy consumption per unit and high CO2 emissions (73.4% of electricity generated from fossil fuels). It is important to note that TMMT would be ranked 4th after TMUK-B, TMIP and TMUK-D if the RES category (A10, A11 and A12) is excluded.
Part production plants Vehicle production plants
2 - EMC assessment
28
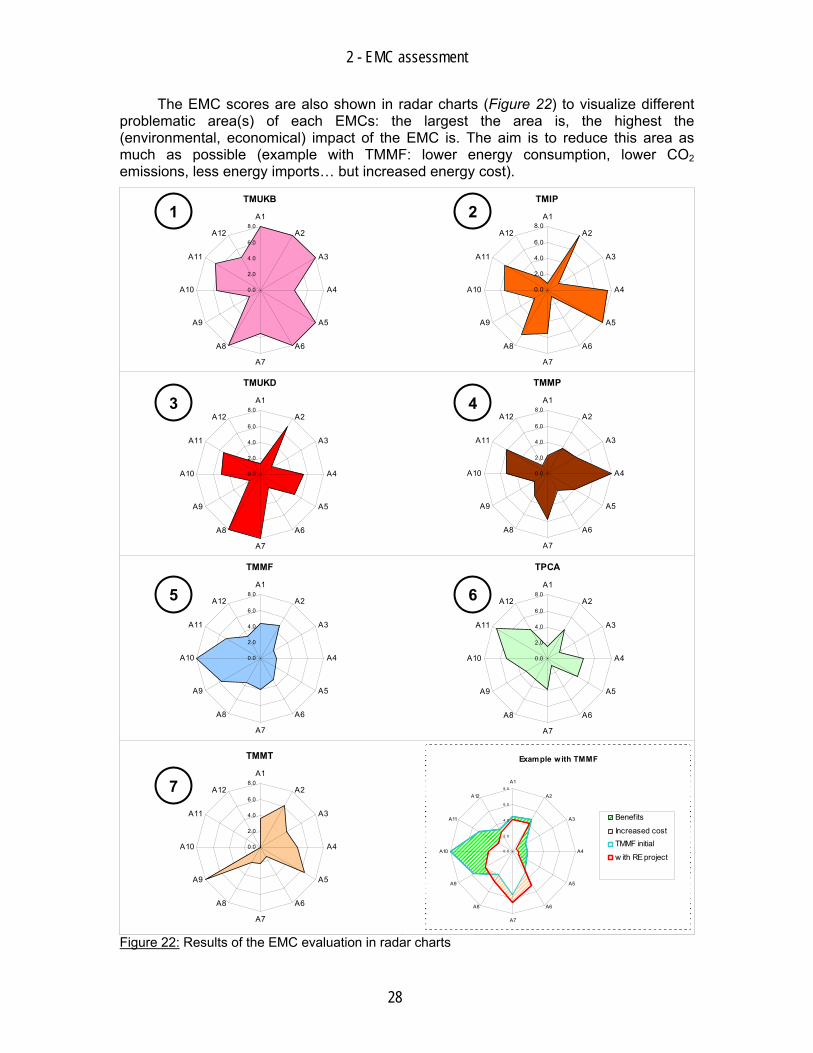
The EMC scores are also shown in radar charts (Figure 22) to visualize different problematic area(s) of each EMCs: the largest the area is, the highest the (environmental, economical) impact of the EMC is. The aim is to reduce this area as much as possible (example with TMMF: lower energy consumption, lower CO2 emissions, less energy imports… but increased energy cost).
TMUKB
0.0
2.0
4.0
6.0
8.0A1
A2
A3
A4
A5
A6
A7
A8
A9
A10
A11
A12
TMIP
0.0
2.0
4.0
6.0
8.0A1
A2
A3
A4
A5
A6
A7
A8
A9
A10
A11
A12
TMUKD
0.0
2.0
4.0
6.0
8.0A1
A2
A3
A4
A5
A6
A7
A8
A9
A10
A11
A12
TMMP
0.0
2.0
4.0
6.0
8.0A1
A2
A3
A4
A5
A6
A7
A8
A9
A10
A11
A12
TMMF
0.0
2.0
4.0
6.0
8.0A1
A2
A3
A4
A5
A6
A7
A8
A9
A10
A11
A12
TPCA
0.0
2.0
4.0
6.0
8.0A1
A2
A3
A4
A5
A6
A7
A8
A9
A10
A11
A12
TMMT
0.0
2.0
4.0
6.0
8.0A1
A2
A3
A4
A5
A6
A7
A8
A9
A10
A11
A12
Example with TMMF
0.0
2.0
4.0
6.0
8.0
A1
A2
A3
A4
A5
A6
A7
A8
A9
A10
A11
A12
Benefits
Increased costTMMF initial
w ith RE project
Figure 22: Results of the EMC evaluation in radar charts
1 2
43
7
65
3 - Technology assessment
29
3 TECHNOLOGY ASSESSMENT
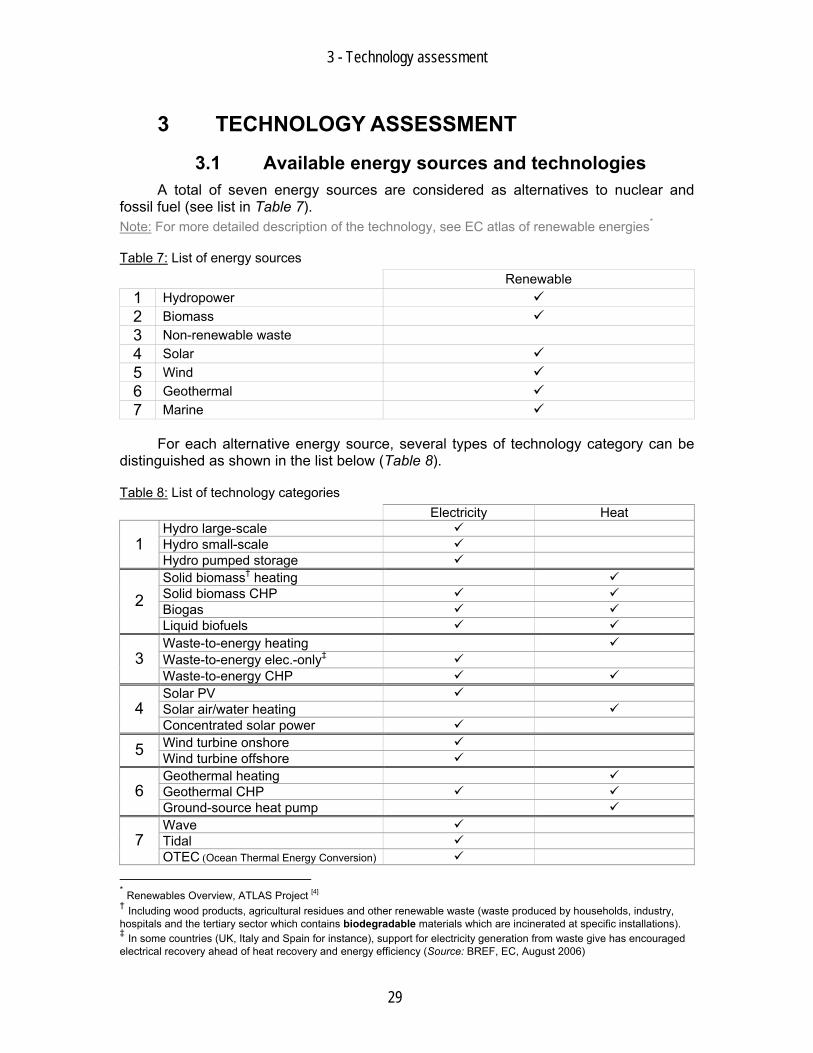
3.1 Available energy sources and technologies A total of seven energy sources are considered as alternatives to nuclear and
fossil fuel (see list in Table 7). Note: For more detailed description of the technology, see EC atlas of renewable energies*
Table 7: List of energy sources Renewable
1 Hydropower 2 Biomass 3 Non-renewable waste 4 Solar 5 Wind 6 Geothermal 7 Marine
For each alternative energy source, several types of technology category can be distinguished as shown in the list below (Table 8).
Table 8: List of technology categories Electricity Heat
Hydro large-scale Hydro small-scale 1 Hydro pumped storage Solid biomass† heating Solid biomass CHP Biogas 2 Liquid biofuels Waste-to-energy heating Waste-to-energy elec.-only‡ 3 Waste-to-energy CHP Solar PV Solar air/water heating 4 Concentrated solar power Wind turbine onshore 5 Wind turbine offshore Geothermal heating Geothermal CHP 6 Ground-source heat pump Wave Tidal 7 OTEC (Ocean Thermal Energy Conversion)
* Renewables Overview, ATLAS Project [4] † Including wood products, agricultural residues and other renewable waste (waste produced by households, industry, hospitals and the tertiary sector which contains biodegradable materials which are incinerated at specific installations). ‡ In some countries (UK, Italy and Spain for instance), support for electricity generation from waste give has encouraged electrical recovery ahead of heat recovery and energy efficiency (Source: BREF, EC, August 2006)
3 - Technology assessment
30
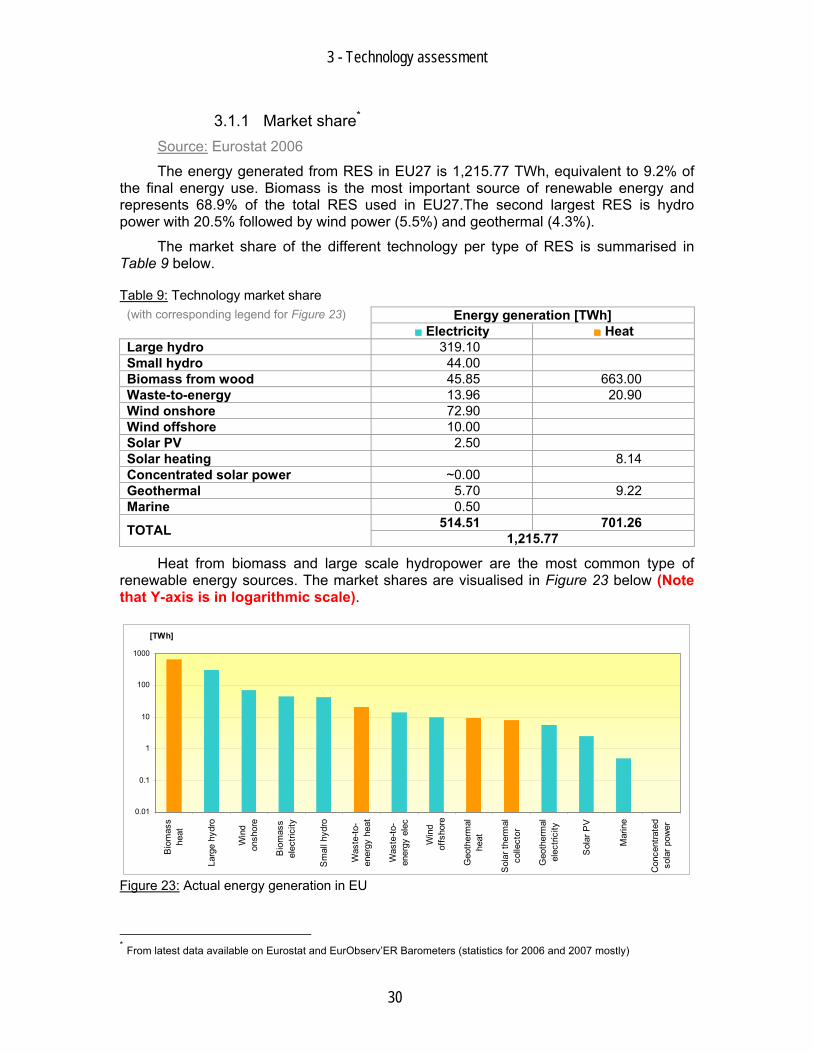
3.1.1 Market share* Source: Eurostat 2006
The energy generated from RES in EU27 is 1,215.77 TWh, equivalent to 9.2% of the final energy use. Biomass is the most important source of renewable energy and represents 68.9% of the total RES used in EU27.The second largest RES is hydro power with 20.5% followed by wind power (5.5%) and geothermal (4.3%).
The market share of the different technology per type of RES is summarised in Table 9 below.
Table 9: Technology market share Energy generation [TWh] (with corresponding legend for Figure 23)
■■ Electricity ■■ Heat Large hydro 319.10 Small hydro 44.00 Biomass from wood 45.85 663.00 Waste-to-energy 13.96 20.90 Wind onshore 72.90 Wind offshore 10.00 Solar PV 2.50 Solar heating 8.14 Concentrated solar power ~0.00 Geothermal 5.70 9.22 Marine 0.50
514.51 701.26 TOTAL 1,215.77
Heat from biomass and large scale hydropower are the most common type of renewable energy sources. The market shares are visualised in Figure 23 below (Note that Y-axis is in logarithmic scale).
0.01
0.1
1
10
100
1000
Bio
mas
she
at
Larg
e hy
dro
Win
don
shor
e
Bio
mas
sel
ectri
city
Sm
all h
ydro
Was
te-to
-en
ergy
hea
t
Was
te-to
-en
ergy
ele
c
Win
dof
fsho
re
Geo
ther
mal
heat
Sol
ar th
erm
alco
llect
or
Geo
ther
mal
elec
trici
ty
Sol
ar P
V
Mar
ine
Con
cent
rate
dso
lar p
ower
[TWh]
Figure 23: Actual energy generation in EU
* From latest data available on Eurostat and EurObserv’ER Barometers (statistics for 2006 and 2007 mostly)
3 - Technology assessment
31
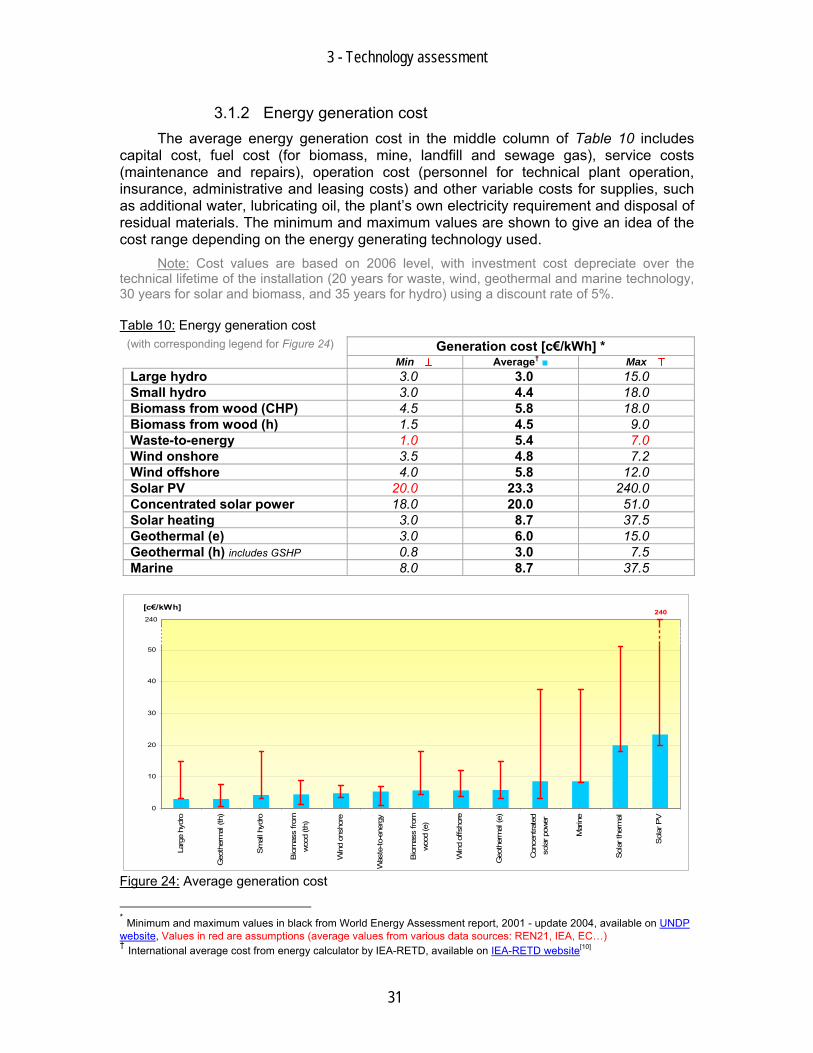
3.1.2 Energy generation cost The average energy generation cost in the middle column of Table 10 includes
capital cost, fuel cost (for biomass, mine, landfill and sewage gas), service costs (maintenance and repairs), operation cost (personnel for technical plant operation, insurance, administrative and leasing costs) and other variable costs for supplies, such as additional water, lubricating oil, the plant’s own electricity requirement and disposal of residual materials. The minimum and maximum values are shown to give an idea of the cost range depending on the energy generating technology used.
Note: Cost values are based on 2006 level, with investment cost depreciate over the technical lifetime of the installation (20 years for waste, wind, geothermal and marine technology, 30 years for solar and biomass, and 35 years for hydro) using a discount rate of 5%.
Table 10: Energy generation cost Generation cost [c€/kWh] * (with corresponding legend for Figure 24)
Min Average† ■ Max Large hydro 3.0 3.0 15.0 Small hydro 3.0 4.4 18.0 Biomass from wood (CHP) 4.5 5.8 18.0 Biomass from wood (h) 1.5 4.5 9.0 Waste-to-energy 1.0 5.4 7.0 Wind onshore 3.5 4.8 7.2 Wind offshore 4.0 5.8 12.0 Solar PV 20.0 23.3 240.0 Concentrated solar power 18.0 20.0 51.0 Solar heating 3.0 8.7 37.5 Geothermal (e) 3.0 6.0 15.0 Geothermal (h) includes GSHP 0.8 3.0 7.5 Marine 8.0 8.7 37.5
0
10
20
30
40
50
Larg
e hy
dro
Geo
ther
mal
(th)
Sm
all h
ydro
Bio
mas
s fro
mw
ood
(th)
Win
d on
shor
e
Was
te-to
-ene
rgy
Bio
mas
s fro
mw
ood
(e)
Win
d of
fsho
re
Geo
ther
mal
(e)
Con
cent
rate
dso
lar p
ower
Mar
ine
Sol
ar th
erm
al
Sol
ar P
V
[c€/kWh]240
240
Figure 24: Average generation cost
* Minimum and maximum values in black from World Energy Assessment report, 2001 - update 2004, available on UNDP website, Values in red are assumptions (average values from various data sources: REN21, IEA, EC…) † International average cost from energy calculator by IEA-RETD, available on IEA-RETD website[10]
3 - Technology assessment
32
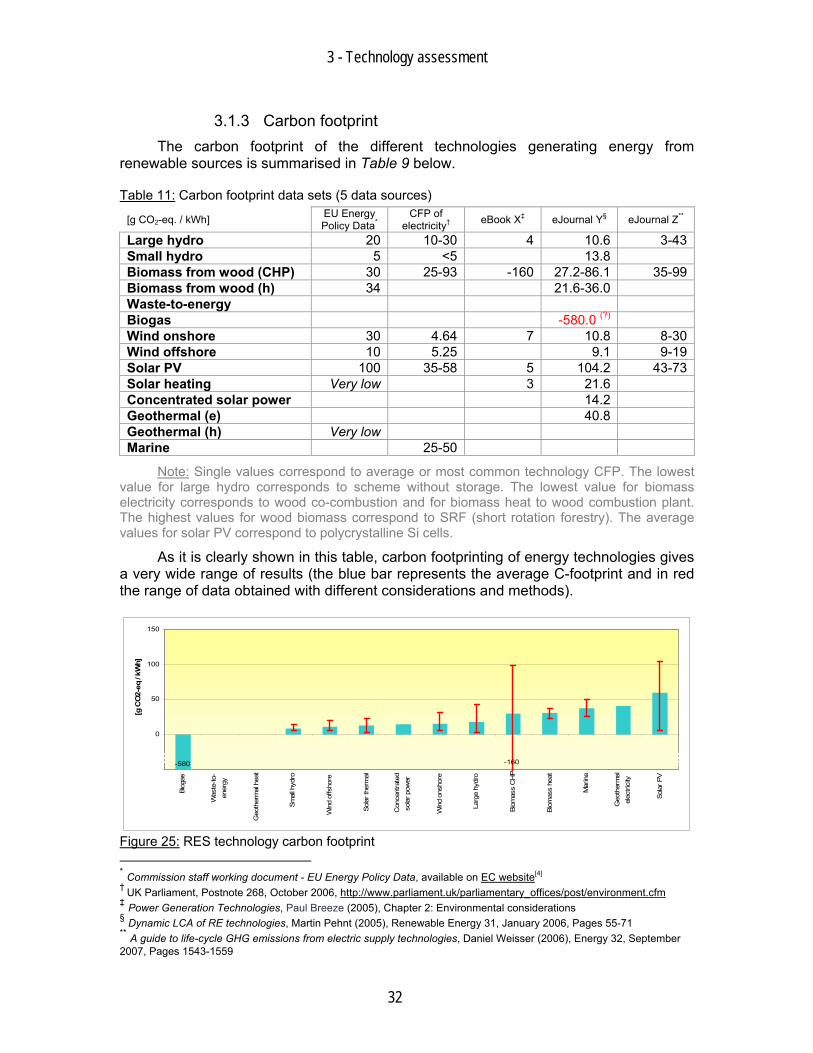
3.1.3 Carbon footprint The carbon footprint of the different technologies generating energy from
renewable sources is summarised in Table 9 below.
Table 11: Carbon footprint data sets (5 data sources)
[g CO2-eq. / kWh] EU Energy Policy Data*
CFP of electricity† eBook X‡ eJournal Y§ eJournal Z**
Large hydro 20 10-30 4 10.6 3-43Small hydro 5 <5 13.8 Biomass from wood (CHP) 30 25-93 -160 27.2-86.1 35-99Biomass from wood (h) 34 21.6-36.0 Waste-to-energy Biogas -580.0 (?) Wind onshore 30 4.64 7 10.8 8-30Wind offshore 10 5.25 9.1 9-19Solar PV 100 35-58 5 104.2 43-73Solar heating Very low 3 21.6 Concentrated solar power 14.2 Geothermal (e) 40.8 Geothermal (h) Very low Marine 25-50
Note: Single values correspond to average or most common technology CFP. The lowest value for large hydro corresponds to scheme without storage. The lowest value for biomass electricity corresponds to wood co-combustion and for biomass heat to wood combustion plant. The highest values for wood biomass correspond to SRF (short rotation forestry). The average values for solar PV correspond to polycrystalline Si cells.
As it is clearly shown in this table, carbon footprinting of energy technologies gives a very wide range of results (the blue bar represents the average C-footprint and in red the range of data obtained with different considerations and methods).
-50
0
50
100
150
Biog
as
Was
te-to
-en
ergy
Geo
ther
mal
hea
t
Smal
l hyd
ro
Win
d of
fsho
re
Sola
r the
rmal
Con
cent
rate
dso
lar p
ower
Win
d on
shor
e
Larg
e hy
dro
Biom
ass
CH
P
Biom
ass
heat
Mar
ine
Geo
ther
mal
elec
trici
ty
Sola
r PV
[g C
O2-
eq /
kWh]
-580 -160
Figure 25: RES technology carbon footprint * Commission staff working document - EU Energy Policy Data, available on EC website[4] † UK Parliament, Postnote 268, October 2006, http://www.parliament.uk/parliamentary_offices/post/environment.cfm ‡ Power Generation Technologies, Paul Breeze (2005), Chapter 2: Environmental considerations § Dynamic LCA of RE technologies, Martin Pehnt (2005), Renewable Energy 31, January 2006, Pages 55-71 ** A guide to life-cycle GHG emissions from electric supply technologies, Daniel Weisser (2006), Energy 32, September 2007, Pages 1543-1559
3 - Technology assessment
33
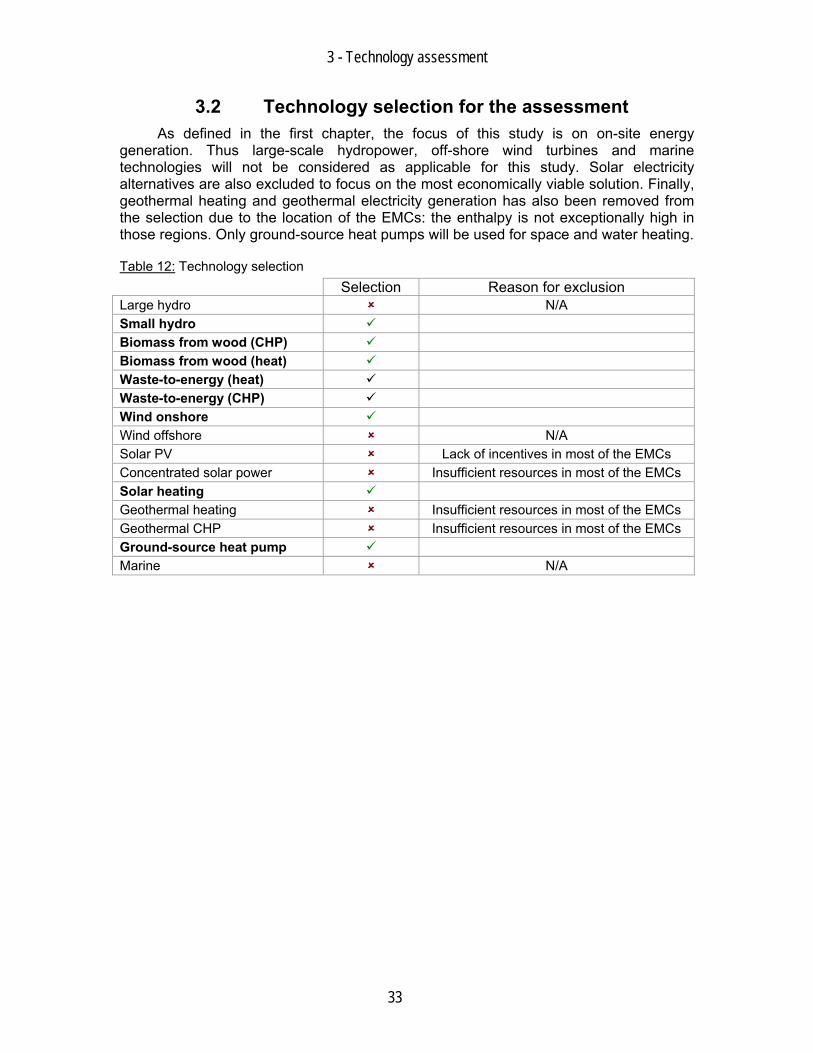
3.2 Technology selection for the assessment As defined in the first chapter, the focus of this study is on on-site energy
generation. Thus large-scale hydropower, off-shore wind turbines and marine technologies will not be considered as applicable for this study. Solar electricity alternatives are also excluded to focus on the most economically viable solution. Finally, geothermal heating and geothermal electricity generation has also been removed from the selection due to the location of the EMCs: the enthalpy is not exceptionally high in those regions. Only ground-source heat pumps will be used for space and water heating.
Table 12: Technology selection Selection Reason for exclusion Large hydro N/A Small hydro Biomass from wood (CHP) Biomass from wood (heat) Waste-to-energy (heat) Waste-to-energy (CHP) Wind onshore Wind offshore N/A Solar PV Lack of incentives in most of the EMCs Concentrated solar power Insufficient resources in most of the EMCs Solar heating Geothermal heating Insufficient resources in most of the EMCs Geothermal CHP Insufficient resources in most of the EMCs Ground-source heat pump Marine N/A
3 - Technology assessment
34
3.3 Assumptions
3.3.1 Energy generation technology The first major assumption in this chapter will be the choice of specific energy
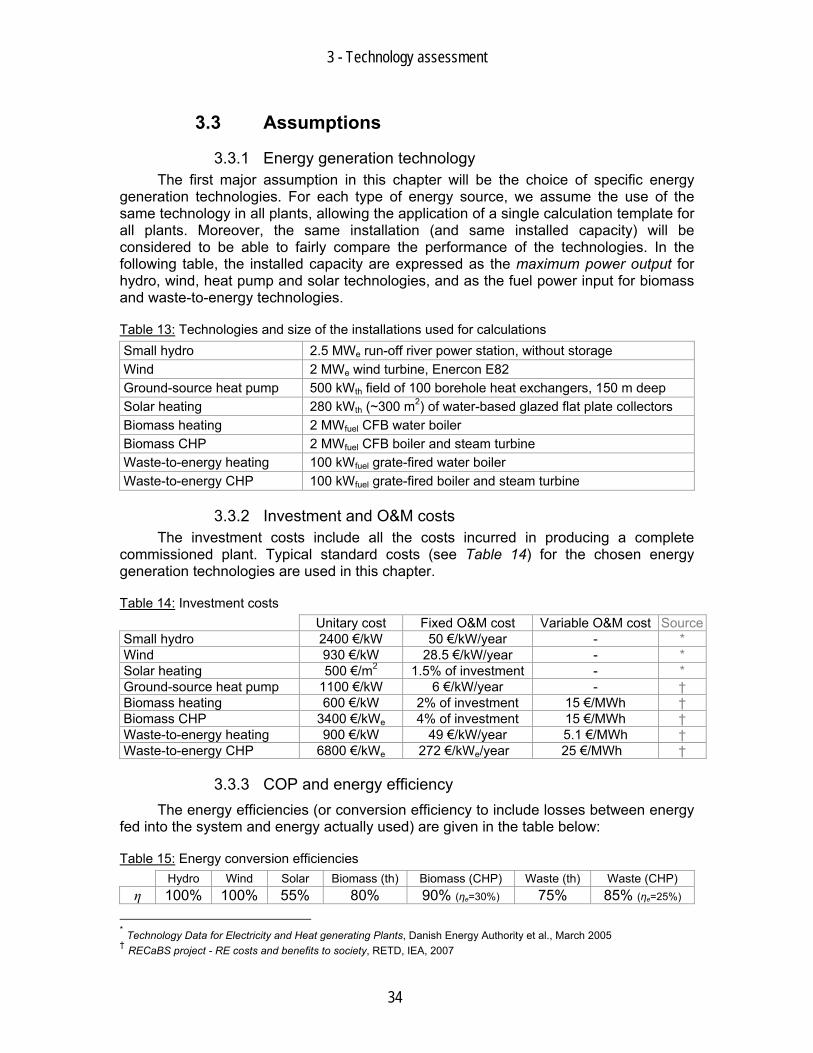
generation technologies. For each type of energy source, we assume the use of the same technology in all plants, allowing the application of a single calculation template for all plants. Moreover, the same installation (and same installed capacity) will be considered to be able to fairly compare the performance of the technologies. In the following table, the installed capacity are expressed as the maximum power output for hydro, wind, heat pump and solar technologies, and as the fuel power input for biomass and waste-to-energy technologies.
Table 13: Technologies and size of the installations used for calculations Small hydro 2.5 MWe run-off river power station, without storage Wind 2 MWe wind turbine, Enercon E82 Ground-source heat pump 500 kWth field of 100 borehole heat exchangers, 150 m deep Solar heating 280 kWth (~300 m2) of water-based glazed flat plate collectors Biomass heating 2 MWfuel CFB water boiler Biomass CHP 2 MWfuel CFB boiler and steam turbine Waste-to-energy heating 100 kWfuel grate-fired water boiler Waste-to-energy CHP 100 kWfuel grate-fired boiler and steam turbine
3.3.2 Investment and O&M costs The investment costs include all the costs incurred in producing a complete
commissioned plant. Typical standard costs (see Table 14) for the chosen energy generation technologies are used in this chapter.
Table 14: Investment costs Unitary cost Fixed O&M cost Variable O&M cost SourceSmall hydro 2400 €/kW 50 €/kW/year - * Wind 930 €/kW 28.5 €/kW/year - * Solar heating 500 €/m2 1.5% of investment - * Ground-source heat pump 1100 €/kW 6 €/kW/year - † Biomass heating 600 €/kW 2% of investment 15 €/MWh † Biomass CHP 3400 €/kWe 4% of investment 15 €/MWh † Waste-to-energy heating 900 €/kW 49 €/kW/year 5.1 €/MWh † Waste-to-energy CHP 6800 €/kWe 272 €/kWe/year? 25 €/MWh? †
3.3.3 COP and energy efficiency The energy efficiencies (or conversion efficiency to include losses between energy
fed into the system and energy actually used) are given in the table below:
Table 15: Energy conversion efficiencies Hydro Wind Solar Biomass (th) Biomass (CHP) Waste (th) Waste (CHP) η 100% 100% 55% 80% 90% (ηe=30%) 75% 85% (ηe=25%)
* Technology Data for Electricity and Heat generating Plants, Danish Energy Authority et al., March 2005 † RECaBS project - RE costs and benefits to society, RETD, IEA, 2007
3 - Technology assessment
35
For ground-source heat pump, the coefficient of performance is defined as the heat energy transferred divided by the electricity supplied to the heat pump. In the calculations, the COP is assumed to be 3.3 on average.
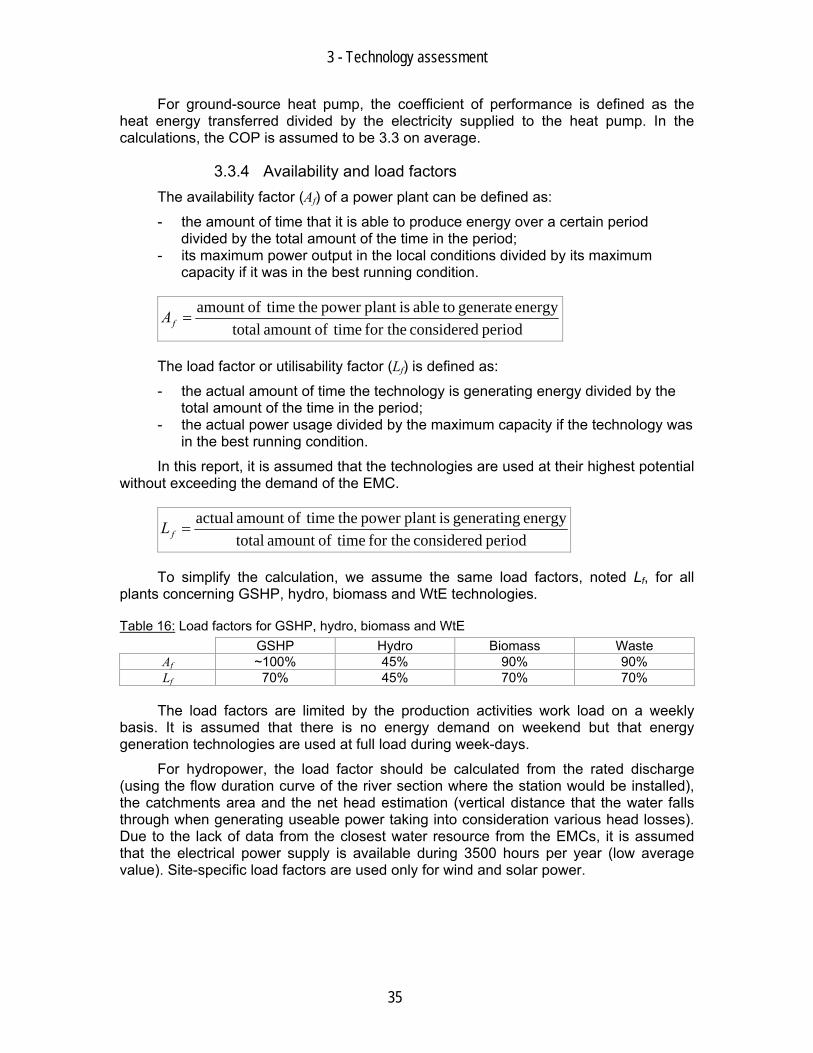
3.3.4 Availability and load factors The availability factor (Af) of a power plant can be defined as:
- the amount of time that it is able to produce energy over a certain period divided by the total amount of the time in the period;
- its maximum power output in the local conditions divided by its maximum capacity if it was in the best running condition.
period considered for the timeofamount totalenergy generate toable isplant power the timeofamount
=fA
The load factor or utilisability factor (Lf) is defined as:
- the actual amount of time the technology is generating energy divided by the total amount of the time in the period;
- the actual power usage divided by the maximum capacity if the technology was in the best running condition.
In this report, it is assumed that the technologies are used at their highest potential without exceeding the demand of the EMC.
period considered for the timeofamount totalenergy generating isplant power the timeofamount actual
=fL
To simplify the calculation, we assume the same load factors, noted Lf, for all plants concerning GSHP, hydro, biomass and WtE technologies.
Table 16: Load factors for GSHP, hydro, biomass and WtE GSHP Hydro Biomass Waste Af ~100% 45% 90% 90% Lf 70% 45% 70% 70%
The load factors are limited by the production activities work load on a weekly basis. It is assumed that there is no energy demand on weekend but that energy generation technologies are used at full load during week-days.
For hydropower, the load factor should be calculated from the rated discharge (using the flow duration curve of the river section where the station would be installed), the catchments area and the net head estimation (vertical distance that the water falls through when generating useable power taking into consideration various head losses). Due to the lack of data from the closest water resource from the EMCs, it is assumed that the electrical power supply is available during 3500 hours per year (low average value). Site-specific load factors are used only for wind and solar power.
3 - Technology assessment
36
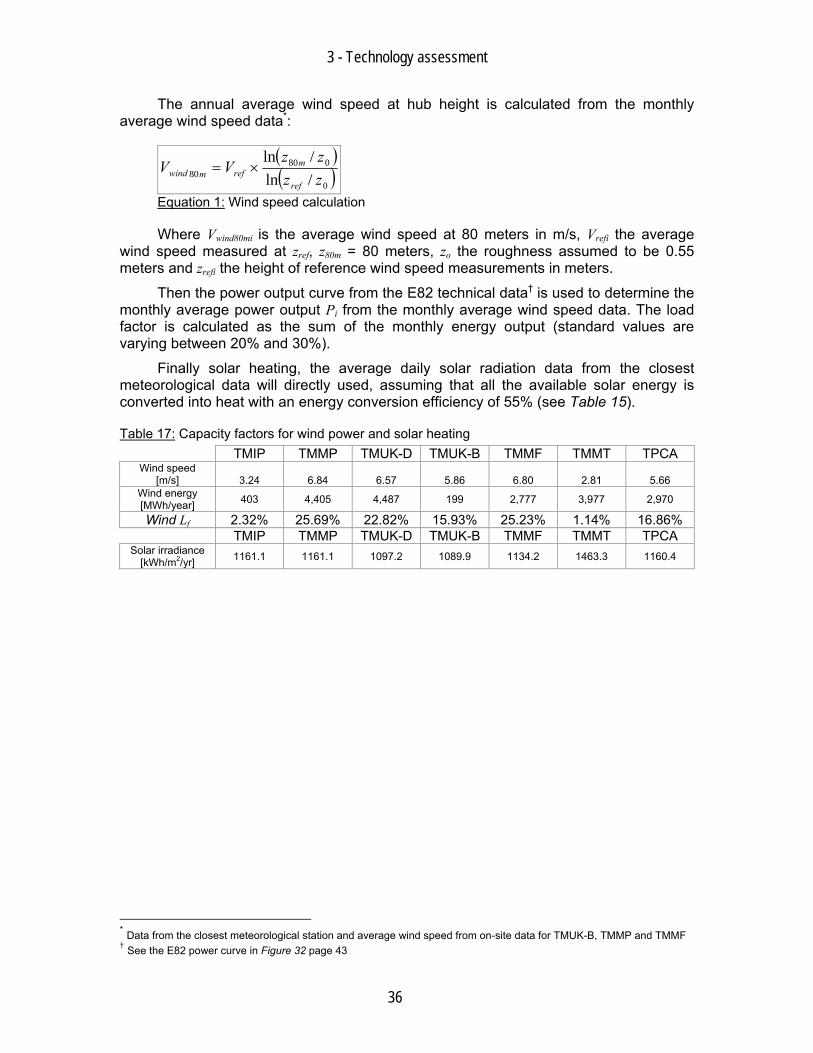
The annual average wind speed at hub height is calculated from the monthly average wind speed data*:
( )( )0
08080 /ln
/lnzzzz
VVref
mrefmwind ×=
Equation 1: Wind speed calculation
Where Vwind80mi is the average wind speed at 80 meters in m/s, Vrefi the average wind speed measured at zref, z80m = 80 meters, zo the roughness assumed to be 0.55 meters and zrefi the height of reference wind speed measurements in meters.
Then the power output curve from the E82 technical data† is used to determine the monthly average power output Pi from the monthly average wind speed data. The load factor is calculated as the sum of the monthly energy output (standard values are varying between 20% and 30%).
Finally solar heating, the average daily solar radiation data from the closest meteorological data will directly used, assuming that all the available solar energy is converted into heat with an energy conversion efficiency of 55% (see Table 15).
Table 17: Capacity factors for wind power and solar heating TMIP TMMP TMUK-D TMUK-B TMMF TMMT TPCA
Wind speed [m/s] 3.24 6.84 6.57 5.86 6.80 2.81 5.66
Wind energy [MWh/year] 403 4,405 4,487 199 2,777 3,977 2,970
Wind Lf 2.32% 25.69% 22.82% 15.93% 25.23% 1.14% 16.86% TMIP TMMP TMUK-D TMUK-B TMMF TMMT TPCA
Solar irradiance [kWh/m2/yr] 1161.1 1161.1 1097.2 1089.9 1134.2 1463.3 1160.4
* Data from the closest meteorological station and average wind speed from on-site data for TMUK-B, TMMP and TMMF † See the E82 power curve in Figure 32 page 43
3 - Technology assessment
37
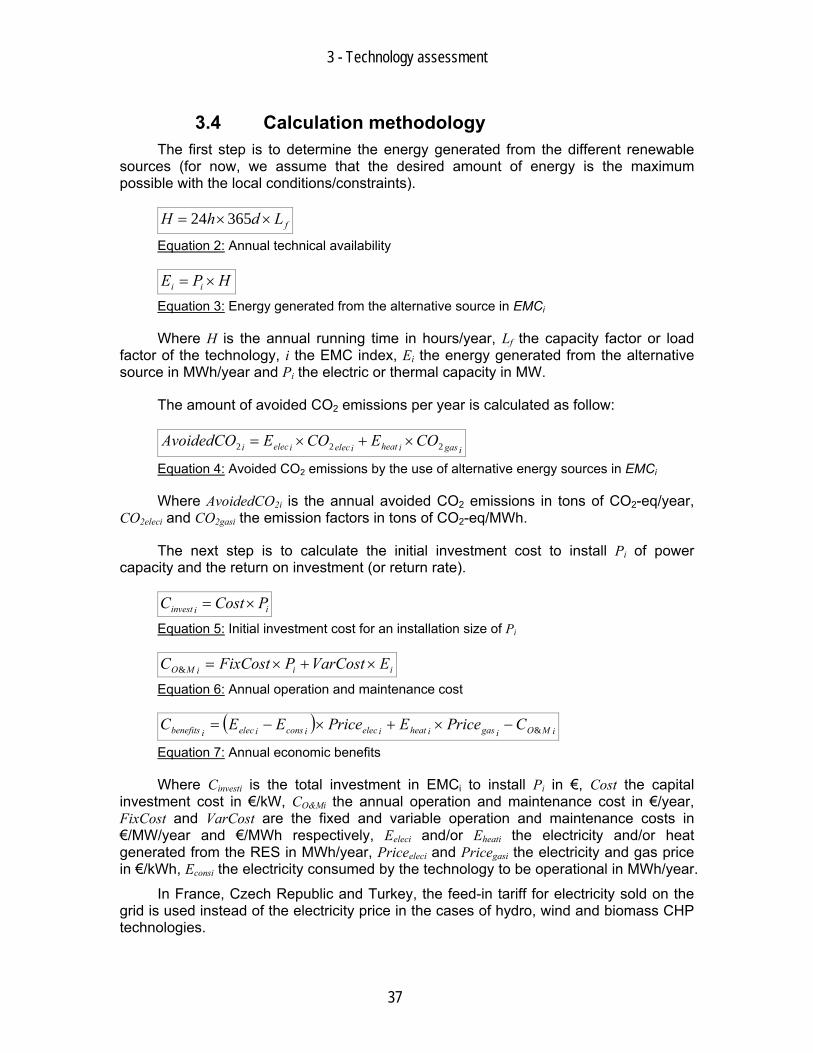
3.4 Calculation methodology The first step is to determine the energy generated from the different renewable
sources (for now, we assume that the desired amount of energy is the maximum possible with the local conditions/constraints).
fLdhH ××= 36524
Equation 2: Annual technical availability
HPE ii ×= Equation 3: Energy generated from the alternative source in EMCi
Where H is the annual running time in hours/year, Lf the capacity factor or load factor of the technology, i the EMC index, Ei the energy generated from the alternative source in MWh/year and Pi the electric or thermal capacity in MW.
The amount of avoided CO2 emissions per year is calculated as follow:
igasiheatielecieleci COECOEAvoidedCO 222 ×+×=
Equation 4: Avoided CO2 emissions by the use of alternative energy sources in EMCi
Where AvoidedCO2i is the annual avoided CO2 emissions in tons of CO2-eq/year, CO2eleci and CO2gasi the emission factors in tons of CO2-eq/MWh.
The next step is to calculate the initial investment cost to install Pi of power capacity and the return on investment (or return rate).
iiinvest PCostC ×=
Equation 5: Initial investment cost for an installation size of Pi
iiiMO EVarCostPFixCostC ×+×=&
Equation 6: Annual operation and maintenance cost
( ) iMOigasiheatieleciconsielecibenefits CricePEricePEEC &−×+×−=
Equation 7: Annual economic benefits
Where Cinvesti is the total investment in EMCi to install Pi in €, Cost the capital investment cost in €/kW, CO&Mi the annual operation and maintenance cost in €/year, FixCost and VarCost are the fixed and variable operation and maintenance costs in €/MW/year and €/MWh respectively, Eeleci and/or Eheati the electricity and/or heat generated from the RES in MWh/year, Priceeleci and Pricegasi the electricity and gas price in €/kWh, Econsi the electricity consumed by the technology to be operational in MWh/year.
In France, Czech Republic and Turkey, the feed-in tariff for electricity sold on the grid is used instead of the electricity price in the cases of hydro, wind and biomass CHP technologies.

3 - Technology assessment
38
The life cycle cost is used as a basis for the performance indicators:
rrrrrNPVfactorT
T )1(1)1(...)1()1(1 12 −−=−++−+−+= −
Equation 8: Net present value factor for life cycle cost calculation
NPVfactorCCC iMOiinvestiLifeCyle ×+= &
Equation 9: Life cycle cost
TEC
EnergyCosti
LifeCycle
×=
Equation 10: Energy generation cost
TAvoidedCOC
CostCOi
LifeCycle
×=
22
Equation 11: CO2 abatement cost
The life cycle cost is used as a basis for the performance indicator calculations.
3 - Technology assessment
39
3.5 Results In the following subchapter, the energy generating technologies and the conditions
in which they are applied will be shortly described. The economic and environmental performances are calculated on a life cycle basis.
For all the options, it will be assumed that the technology is used at its maximum potential with the given conditions and that the supply never exceeds the demand: all the energy produced is used (or sold on the grid when there is a FIT). Consequently each MWh generated gives some economic benefits. The sizes of the installation (see Table 13 in chapter 3.3.1) are chosen to “fit” in the energy use of the plant and avoid losses (non-used energy).
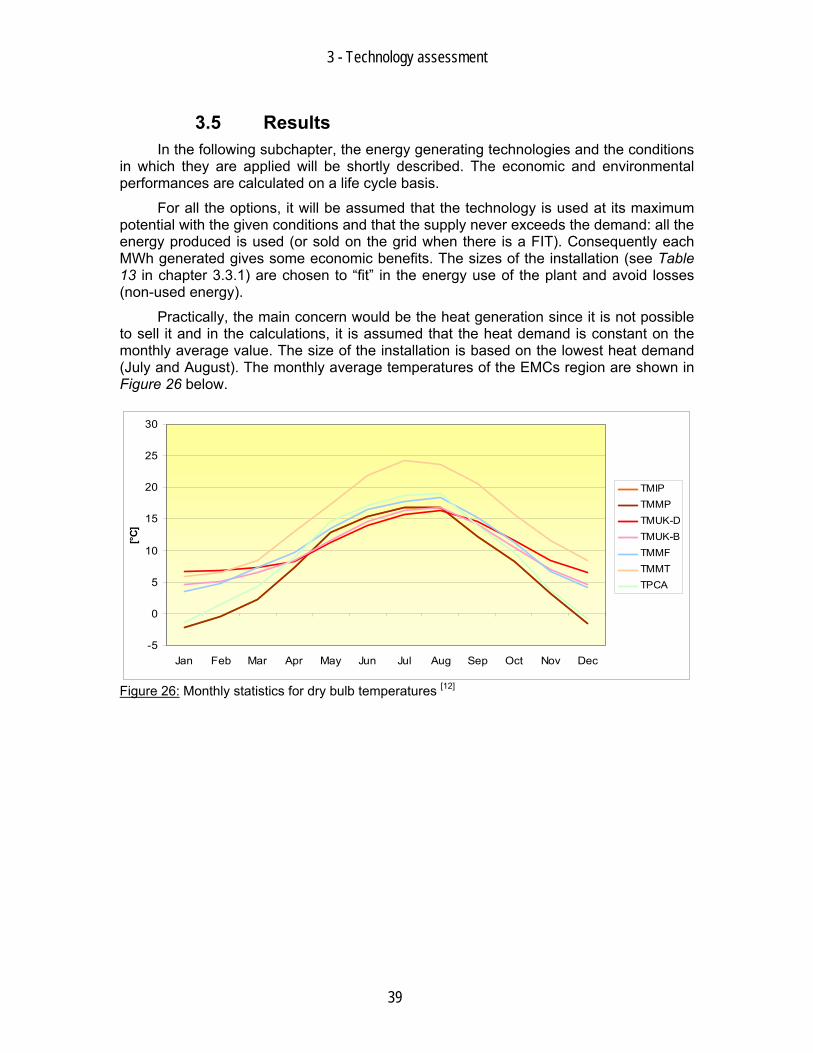
Practically, the main concern would be the heat generation since it is not possible to sell it and in the calculations, it is assumed that the heat demand is constant on the monthly average value. The size of the installation is based on the lowest heat demand (July and August). The monthly average temperatures of the EMCs region are shown in Figure 26 below.
-5
0
5
10
15
20
25
30
Jan Feb Mar Apr May Jun Jul Aug Sep Oct Nov Dec
[°C]
TMIPTMMPTMUK-DTMUK-BTMMFTMMTTPCA
Figure 26: Monthly statistics for dry bulb temperatures [12]
3 - Technology assessment
40
3.5.1 Small hydro Small hydropower is a more concentrated energy resource, more predictable than
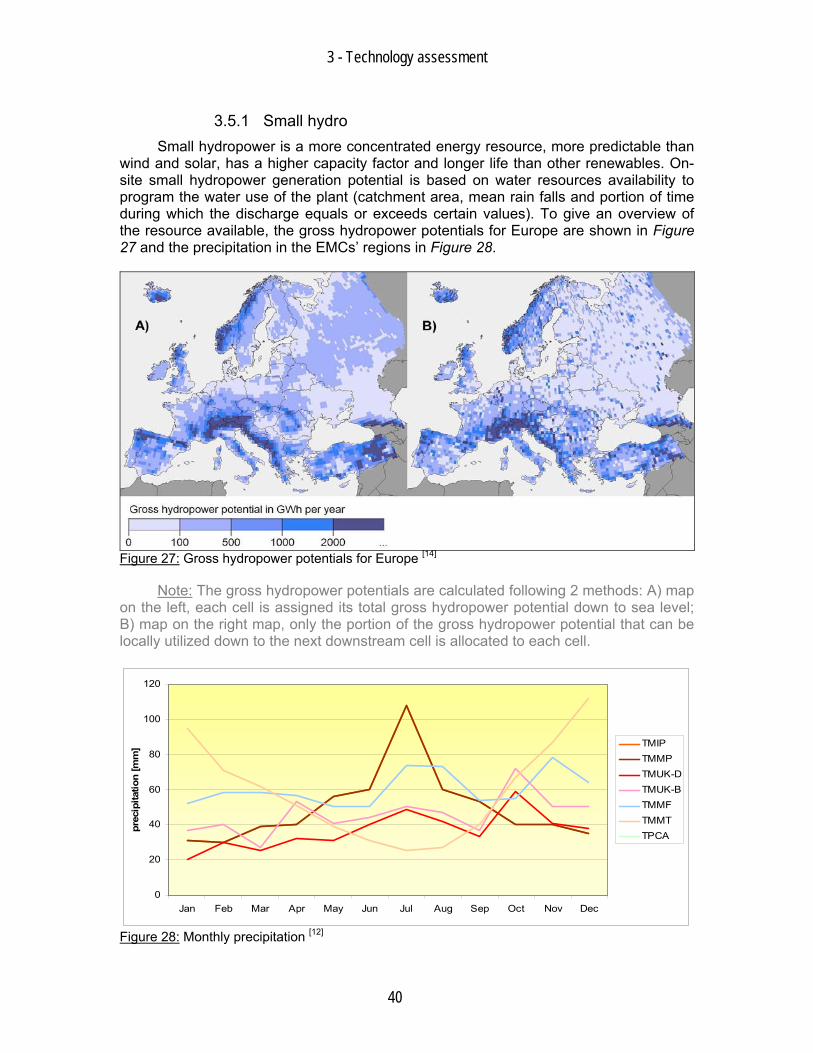
wind and solar, has a higher capacity factor and longer life than other renewables. On-site small hydropower generation potential is based on water resources availability to program the water use of the plant (catchment area, mean rain falls and portion of time during which the discharge equals or exceeds certain values). To give an overview of the resource available, the gross hydropower potentials for Europe are shown in Figure 27 and the precipitation in the EMCs’ regions in Figure 28.
Figure 27: Gross hydropower potentials for Europe [14]
Note: The gross hydropower potentials are calculated following 2 methods: A) map on the left, each cell is assigned its total gross hydropower potential down to sea level; B) map on the right map, only the portion of the gross hydropower potential that can be locally utilized down to the next downstream cell is allocated to each cell.
0
20
40
60
80
100
120
Jan Feb Mar Apr May Jun Jul Aug Sep Oct Nov Dec
prec
ipita
tion
[mm
] TMIPTMMPTMUK-DTMUK-BTMMFTMMTTPCA
Figure 28: Monthly precipitation [12]
3 - Technology assessment
41
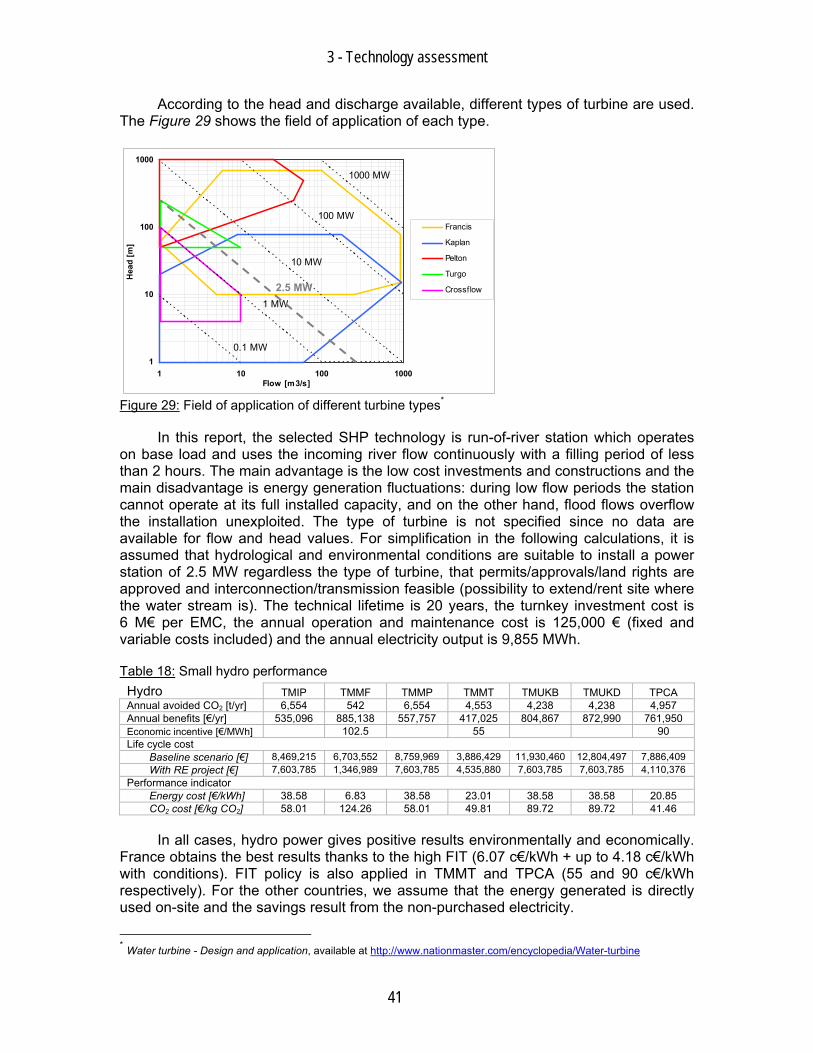
According to the head and discharge available, different types of turbine are used. The Figure 29 shows the field of application of each type.
Figure 29: Field of application of different turbine types*
In this report, the selected SHP technology is run-of-river station which operates on base load and uses the incoming river flow continuously with a filling period of less than 2 hours. The main advantage is the low cost investments and constructions and the main disadvantage is energy generation fluctuations: during low flow periods the station cannot operate at its full installed capacity, and on the other hand, flood flows overflow the installation unexploited. The type of turbine is not specified since no data are available for flow and head values. For simplification in the following calculations, it is assumed that hydrological and environmental conditions are suitable to install a power station of 2.5 MW regardless the type of turbine, that permits/approvals/land rights are approved and interconnection/transmission feasible (possibility to extend/rent site where the water stream is). The technical lifetime is 20 years, the turnkey investment cost is 6 M€ per EMC, the annual operation and maintenance cost is 125,000 € (fixed and variable costs included) and the annual electricity output is 9,855 MWh.
Table 18: Small hydro performance Hydro TMIP TMMF TMMP TMMT TMUKB TMUKD TPCA Annual avoided CO2 [t/yr] 6,554 542 6,554 4,553 4,238 4,238 4,957 Annual benefits [€/yr] 535,096 885,138 557,757 417,025 804,867 872,990 761,950 Economic incentive [€/MWh] 102.5 55 90 Life cycle cost
Baseline scenario [€] 8,469,215 6,703,552 8,759,969 3,886,429 11,930,460 12,804,497 7,886,409 With RE project [€] 7,603,785 1,346,989 7,603,785 4,535,880 7,603,785 7,603,785 4,110,376
Performance indicator Energy cost [€/kWh] 38.58 6.83 38.58 23.01 38.58 38.58 20.85 CO2 cost [€/kg CO2] 58.01 124.26 58.01 49.81 89.72 89.72 41.46
In all cases, hydro power gives positive results environmentally and economically. France obtains the best results thanks to the high FIT (6.07 c€/kWh + up to 4.18 c€/kWh with conditions). FIT policy is also applied in TMMT and TPCA (55 and 90 c€/kWh respectively). For the other countries, we assume that the energy generated is directly used on-site and the savings result from the non-purchased electricity.
* Water turbine - Design and application, available at http://www.nationmaster.com/encyclopedia/Water-turbine
1
10
100
1000
1 10 100 1000
Francis
Kaplan
Pelton
Turgo
Crossflow
Flow [m3/s]
Hea
d [m
]
0.1 MW
1 MW
10 MW
100 MW
1000 MW
2.5 MW
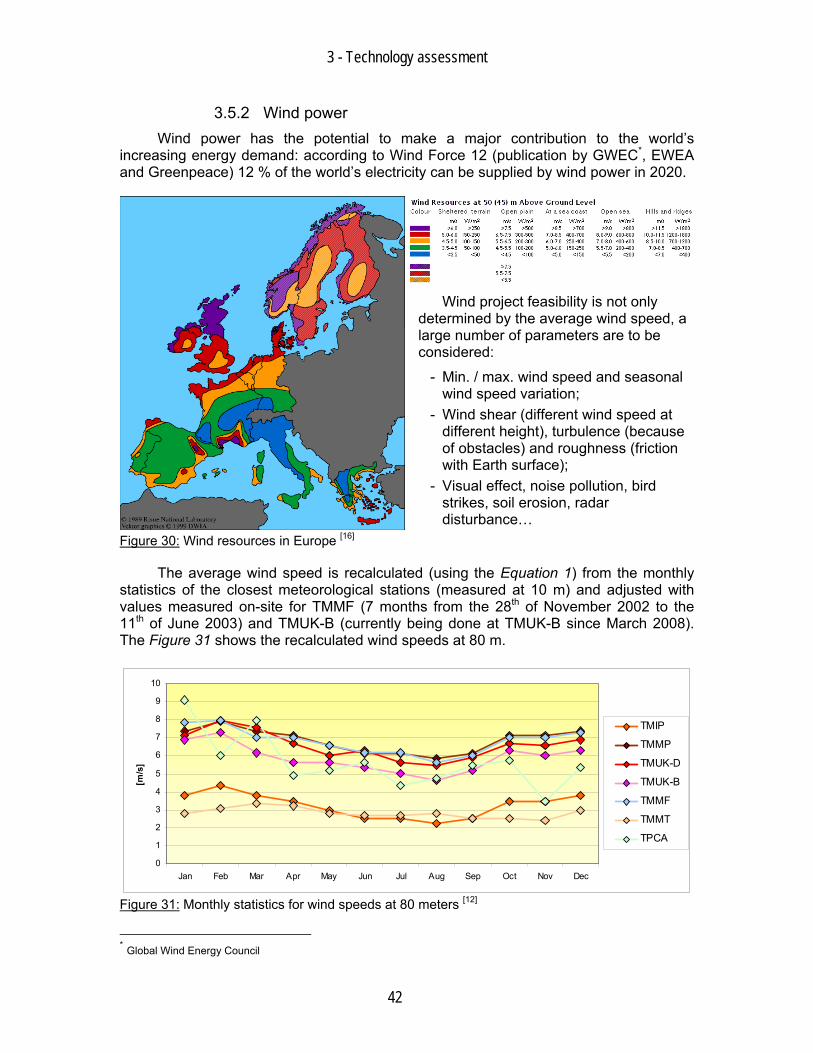
3 - Technology assessment
42
3.5.2 Wind power Wind power has the potential to make a major contribution to the world’s
increasing energy demand: according to Wind Force 12 (publication by GWEC*, EWEA and Greenpeace) 12 % of the world’s electricity can be supplied by wind power in 2020.
Figure 30: Wind resources in Europe [16]
The average wind speed is recalculated (using the Equation 1) from the monthly statistics of the closest meteorological stations (measured at 10 m) and adjusted with values measured on-site for TMMF (7 months from the 28th of November 2002 to the 11th of June 2003) and TMUK-B (currently being done at TMUK-B since March 2008). The Figure 31 shows the recalculated wind speeds at 80 m.
0
1
2
3
4
5
6
7
8
9
10
Jan Feb Mar Apr May Jun Jul Aug Sep Oct Nov Dec
[m/s
]
TMIP
TMMP
TMUK-D
TMUK-B
TMMF
TMMT
TPCA
Figure 31: Monthly statistics for wind speeds at 80 meters [12]
* Global Wind Energy Council
Wind project feasibility is not only determined by the average wind speed, a large number of parameters are to be considered:
- Min. / max. wind speed and seasonal wind speed variation;
- Wind shear (different wind speed at different height), turbulence (because of obstacles) and roughness (friction with Earth surface);
- Visual effect, noise pollution, bird strikes, soil erosion, radar disturbance…
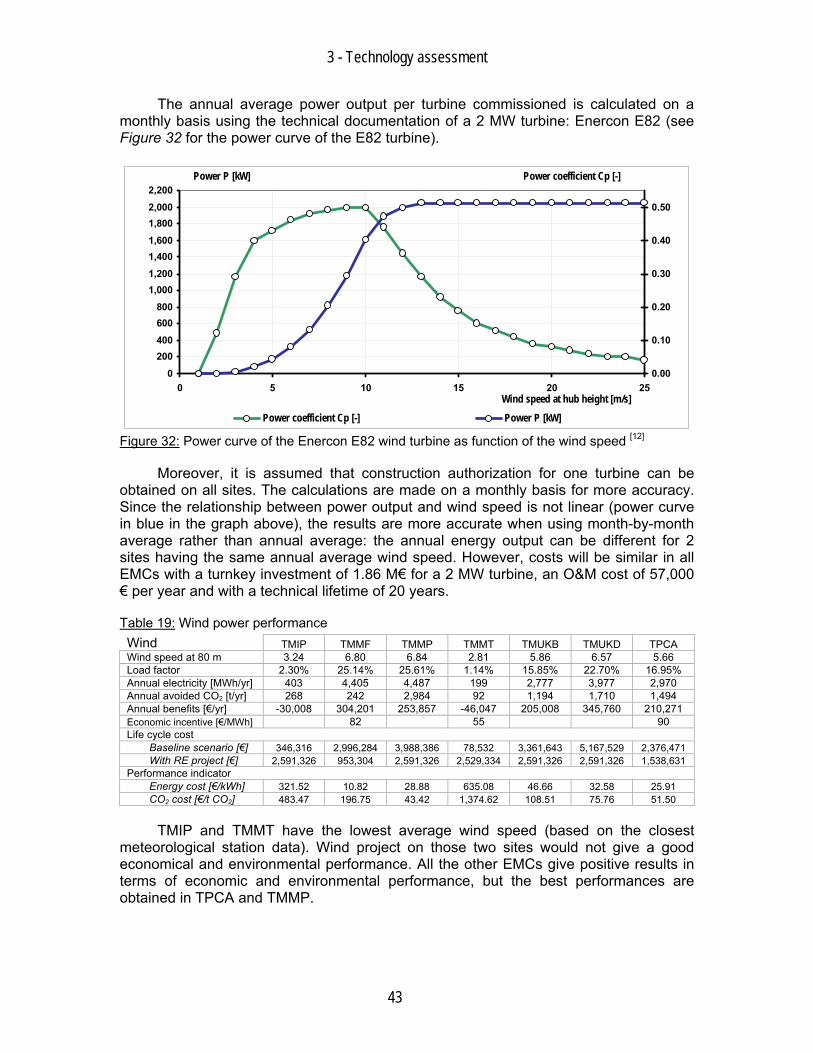
3 - Technology assessment
43
The annual average power output per turbine commissioned is calculated on a monthly basis using the technical documentation of a 2 MW turbine: Enercon E82 (see Figure 32 for the power curve of the E82 turbine).
0200400600800
1,0001,2001,4001,6001,8002,0002,200
0 5 10 15 20 25Wind speed at hub height [m/s]
Power P [kW]
0.00
0.10
0.20
0.30
0.40
0.50
Power coefficient Cp [-]
Power coefficient Cp [-] Power P [kW]
Figure 32: Power curve of the Enercon E82 wind turbine as function of the wind speed [12]
Moreover, it is assumed that construction authorization for one turbine can be obtained on all sites. The calculations are made on a monthly basis for more accuracy. Since the relationship between power output and wind speed is not linear (power curve in blue in the graph above), the results are more accurate when using month-by-month average rather than annual average: the annual energy output can be different for 2 sites having the same annual average wind speed. However, costs will be similar in all EMCs with a turnkey investment of 1.86 M€ for a 2 MW turbine, an O&M cost of 57,000 € per year and with a technical lifetime of 20 years.
Table 19: Wind power performance Wind TMIP TMMF TMMP TMMT TMUKB TMUKD TPCA Wind speed at 80 m 3.24 6.80 6.84 2.81 5.86 6.57 5.66 Load factor 2.30% 25.14% 25.61% 1.14% 15.85% 22.70% 16.95% Annual electricity [MWh/yr] 403 4,405 4,487 199 2,777 3,977 2,970 Annual avoided CO2 [t/yr] 268 242 2,984 92 1,194 1,710 1,494 Annual benefits [€/yr] -30,008 304,201 253,857 -46,047 205,008 345,760 210,271 Economic incentive [€/MWh] 82 55 90 Life cycle cost
Baseline scenario [€] 346,316 2,996,284 3,988,386 78,532 3,361,643 5,167,529 2,376,471 With RE project [€] 2,591,326 953,304 2,591,326 2,529,334 2,591,326 2,591,326 1,538,631
Performance indicator Energy cost [€/kWh] 321.52 10.82 28.88 635.08 46.66 32.58 25.91 CO2 cost [€/t CO2] 483.47 196.75 43.42 1,374.62 108.51 75.76 51.50
TMIP and TMMT have the lowest average wind speed (based on the closest meteorological station data). Wind project on those two sites would not give a good economical and environmental performance. All the other EMCs give positive results in terms of economic and environmental performance, but the best performances are obtained in TPCA and TMMP.
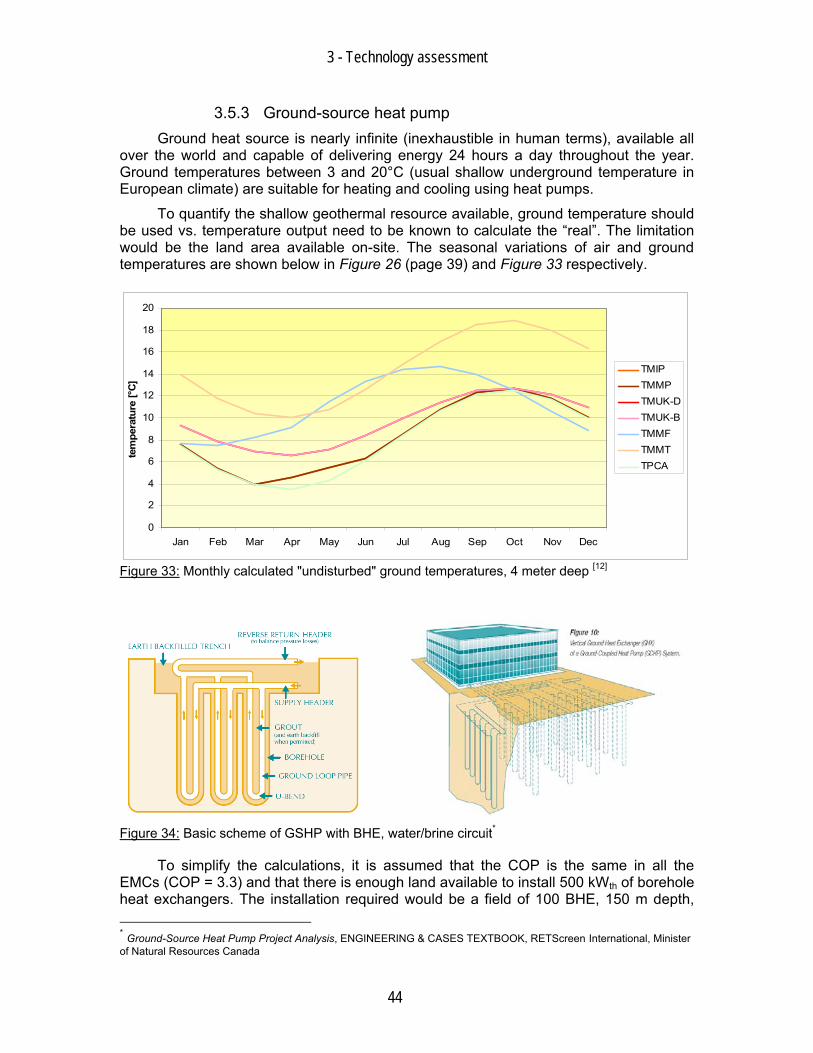
3 - Technology assessment
44
3.5.3 Ground-source heat pump Ground heat source is nearly infinite (inexhaustible in human terms), available all
over the world and capable of delivering energy 24 hours a day throughout the year. Ground temperatures between 3 and 20°C (usual shallow underground temperature in European climate) are suitable for heating and cooling using heat pumps.
To quantify the shallow geothermal resource available, ground temperature should be used vs. temperature output need to be known to calculate the “real”. The limitation would be the land area available on-site. The seasonal variations of air and ground temperatures are shown below in Figure 26 (page 39) and Figure 33 respectively.
0
2
4
6
8
10
12
14
16
18
20
Jan Feb Mar Apr May Jun Jul Aug Sep Oct Nov Dec
tem
pera
ture
[°C
]
TMIPTMMPTMUK-DTMUK-BTMMFTMMTTPCA
Figure 33: Monthly calculated "undisturbed" ground temperatures, 4 meter deep [12]
Figure 34: Basic scheme of GSHP with BHE, water/brine circuit*
To simplify the calculations, it is assumed that the COP is the same in all the EMCs (COP = 3.3) and that there is enough land available to install 500 kWth of borehole heat exchangers. The installation required would be a field of 100 BHE, 150 m depth, * Ground-Source Heat Pump Project Analysis, ENGINEERING & CASES TEXTBOOK, RETScreen International, Minister of Natural Resources Canada
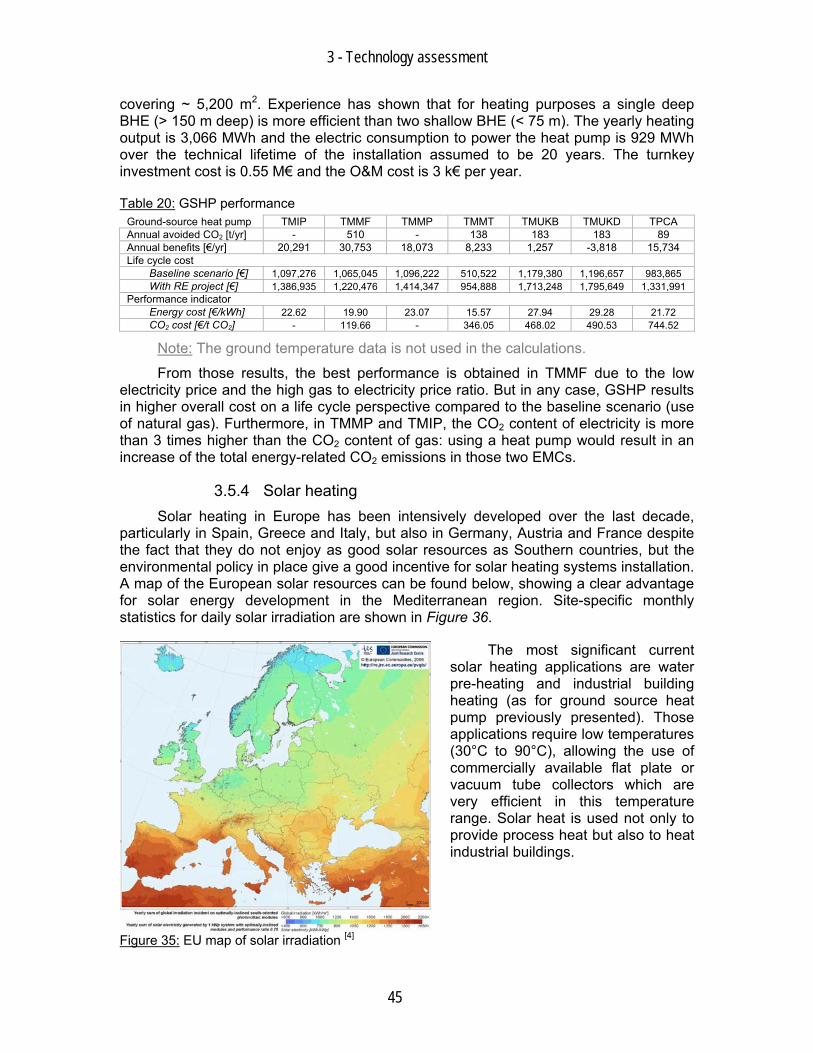
3 - Technology assessment
45
covering ~ 5,200 m2. Experience has shown that for heating purposes a single deep BHE (> 150 m deep) is more efficient than two shallow BHE (< 75 m). The yearly heating output is 3,066 MWh and the electric consumption to power the heat pump is 929 MWh over the technical lifetime of the installation assumed to be 20 years. The turnkey investment cost is 0.55 M€ and the O&M cost is 3 k€ per year.
Table 20: GSHP performance Ground-source heat pump TMIP TMMF TMMP TMMT TMUKB TMUKD TPCA Annual avoided CO2 [t/yr] - 510 - 138 183 183 89 Annual benefits [€/yr] 20,291 30,753 18,073 8,233 1,257 -3,818 15,734 Life cycle cost
Baseline scenario [€] 1,097,276 1,065,045 1,096,222 510,522 1,179,380 1,196,657 983,865 With RE project [€] 1,386,935 1,220,476 1,414,347 954,888 1,713,248 1,795,649 1,331,991
Performance indicator Energy cost [€/kWh] 22.62 19.90 23.07 15.57 27.94 29.28 21.72 CO2 cost [€/t CO2] - 119.66 - 346.05 468.02 490.53 744.52
Note: The ground temperature data is not used in the calculations.
From those results, the best performance is obtained in TMMF due to the low electricity price and the high gas to electricity price ratio. But in any case, GSHP results in higher overall cost on a life cycle perspective compared to the baseline scenario (use of natural gas). Furthermore, in TMMP and TMIP, the CO2 content of electricity is more than 3 times higher than the CO2 content of gas: using a heat pump would result in an increase of the total energy-related CO2 emissions in those two EMCs.
3.5.4 Solar heating Solar heating in Europe has been intensively developed over the last decade,
particularly in Spain, Greece and Italy, but also in Germany, Austria and France despite the fact that they do not enjoy as good solar resources as Southern countries, but the environmental policy in place give a good incentive for solar heating systems installation. A map of the European solar resources can be found below, showing a clear advantage for solar energy development in the Mediterranean region. Site-specific monthly statistics for daily solar irradiation are shown in Figure 36.
Figure 35: EU map of solar irradiation [4]
The most significant current solar heating applications are water pre-heating and industrial building heating (as for ground source heat pump previously presented). Those applications require low temperatures (30°C to 90°C), allowing the use of commercially available flat plate or vacuum tube collectors which are very efficient in this temperature range. Solar heat is used not only to provide process heat but also to heat industrial buildings.
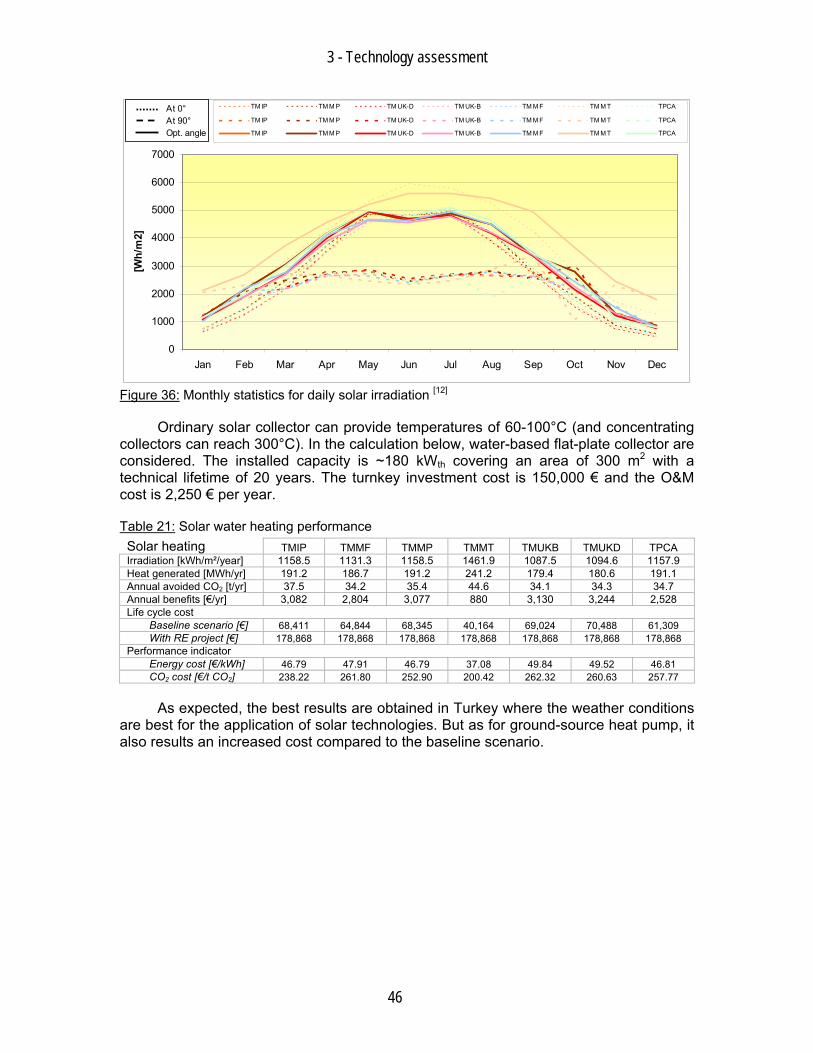
3 - Technology assessment
46
0
1000
2000
3000
4000
5000
6000
7000
Jan Feb Mar Apr May Jun Jul Aug Sep Oct Nov Dec
[Wh/
m2]
TM IP TM M P TM UK-D TM UK-B TM M F TM M T TPCA
TM IP TM M P TM UK-D TM UK-B TM M F TM M T TPCA
TM IP TM M P TM UK-D TM UK-B TM M F TM M T TPCA
At 0°At 90°Opt. angle
Figure 36: Monthly statistics for daily solar irradiation [12]
Ordinary solar collector can provide temperatures of 60-100°C (and concentrating collectors can reach 300°C). In the calculation below, water-based flat-plate collector are considered. The installed capacity is ~180 kWth covering an area of 300 m2 with a technical lifetime of 20 years. The turnkey investment cost is 150,000 € and the O&M cost is 2,250 € per year.
Table 21: Solar water heating performance Solar heating TMIP TMMF TMMP TMMT TMUKB TMUKD TPCA Irradiation [kWh/m²/year] 1158.5 1131.3 1158.5 1461.9 1087.5 1094.6 1157.9 Heat generated [MWh/yr] 191.2 186.7 191.2 241.2 179.4 180.6 191.1 Annual avoided CO2 [t/yr] 37.5 34.2 35.4 44.6 34.1 34.3 34.7 Annual benefits [€/yr] 3,082 2,804 3,077 880 3,130 3,244 2,528 Life cycle cost
Baseline scenario [€] 68,411 64,844 68,345 40,164 69,024 70,488 61,309 With RE project [€] 178,868 178,868 178,868 178,868 178,868 178,868 178,868
Performance indicator Energy cost [€/kWh] 46.79 47.91 46.79 37.08 49.84 49.52 46.81 CO2 cost [€/t CO2] 238.22 261.80 252.90 200.42 262.32 260.63 257.77
As expected, the best results are obtained in Turkey where the weather conditions are best for the application of solar technologies. But as for ground-source heat pump, it also results an increased cost compared to the baseline scenario.
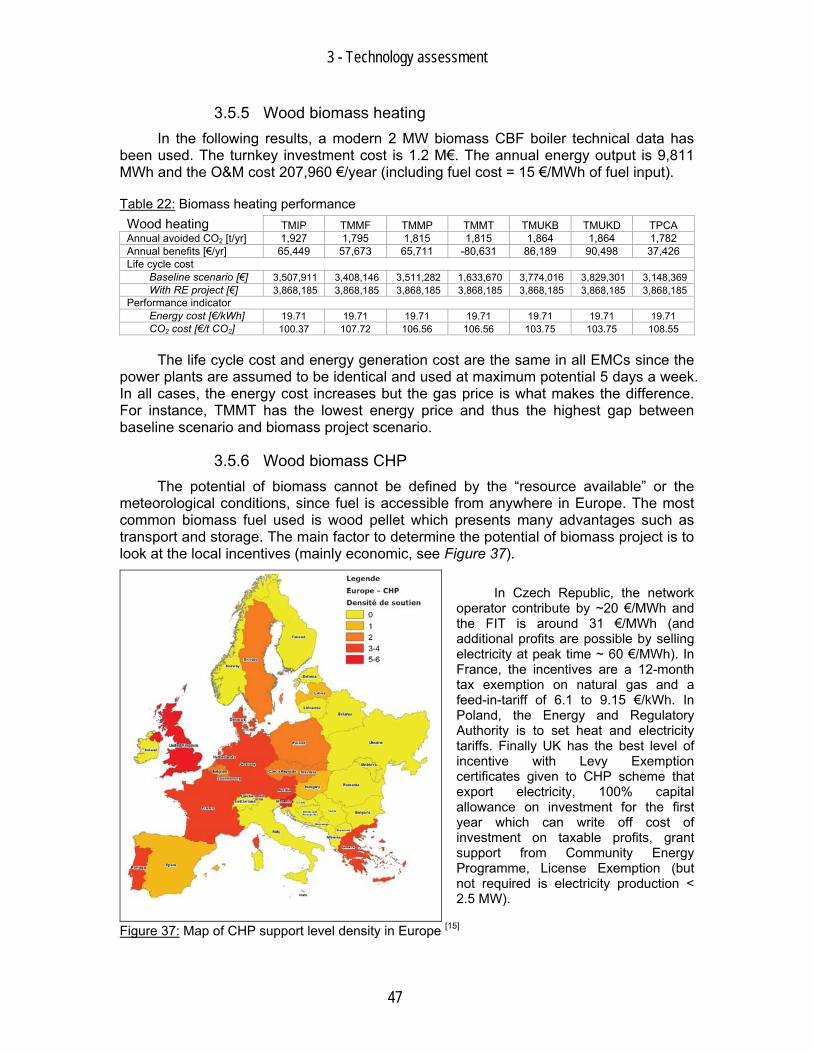
3 - Technology assessment
47
3.5.5 Wood biomass heating In the following results, a modern 2 MW biomass CBF boiler technical data has
been used. The turnkey investment cost is 1.2 M€. The annual energy output is 9,811 MWh and the O&M cost 207,960 €/year (including fuel cost = 15 €/MWh of fuel input).
Table 22: Biomass heating performance Wood heating TMIP TMMF TMMP TMMT TMUKB TMUKD TPCA Annual avoided CO2 [t/yr] 1,927 1,795 1,815 1,815 1,864 1,864 1,782 Annual benefits [€/yr] 65,449 57,673 65,711 -80,631 86,189 90,498 37,426 Life cycle cost
Baseline scenario [€] 3,507,911 3,408,146 3,511,282 1,633,670 3,774,016 3,829,301 3,148,369 With RE project [€] 3,868,185 3,868,185 3,868,185 3,868,185 3,868,185 3,868,185 3,868,185
Performance indicator Energy cost [€/kWh] 19.71 19.71 19.71 19.71 19.71 19.71 19.71 CO2 cost [€/t CO2] 100.37 107.72 106.56 106.56 103.75 103.75 108.55
The life cycle cost and energy generation cost are the same in all EMCs since the power plants are assumed to be identical and used at maximum potential 5 days a week. In all cases, the energy cost increases but the gas price is what makes the difference. For instance, TMMT has the lowest energy price and thus the highest gap between baseline scenario and biomass project scenario.
3.5.6 Wood biomass CHP The potential of biomass cannot be defined by the “resource available” or the
meteorological conditions, since fuel is accessible from anywhere in Europe. The most common biomass fuel used is wood pellet which presents many advantages such as transport and storage. The main factor to determine the potential of biomass project is to look at the local incentives (mainly economic, see Figure 37).
In Czech Republic, the network
operator contribute by ~20 €/MWh and the FIT is around 31 €/MWh (and additional profits are possible by selling electricity at peak time ~ 60 €/MWh). In France, the incentives are a 12-month tax exemption on natural gas and a feed-in-tariff of 6.1 to 9.15 €/kWh. In Poland, the Energy and Regulatory Authority is to set heat and electricity tariffs. Finally UK has the best level of incentive with Levy Exemption certificates given to CHP scheme that export electricity, 100% capital allowance on investment for the first year which can write off cost of investment on taxable profits, grant support from Community Energy Programme, License Exemption (but not required is electricity production < 2.5 MW).
Figure 37: Map of CHP support level density in Europe [15]
3 - Technology assessment
48
In the following results, 2 MW biomass CBF boiler technical data has been used. Here it is assumed that a wood biomass gasification CHP system is used. The wood fuel price is assumed to be 15 €/MWh. The annual heat output is 7,358 MWh and the annual electricity output is 3,679 MWh. The turnkey investment cost is 2.04 M€ and O&M costs 265,560 €/year.
Table 23: Biomass CHP performance Wood CHP TMIP TMMF TMMP TMMT TMUKB TMUKD TPCA Annual avoided CO2 [t/yr] 3,892 1,549 3,808 3,061 2,980 2,980 3,187 Annual benefits [€/yr] 185,932 158,096 194,590 32,293 302,202 330,867 396,775 Economic incentive [€/MWh] 61 55 130 Life cycle cost
Baseline scenario [€] 5,792,773 5,058,769 5,903,850 2,676,186 7,284,551 7,652,321 5,305,536 With RE project [€] 5,447,210 5,070,354 5,447,210 4,301,858 5,447,210 5,447,210 2,254,797
Performance indicator Energy cost [€/kWh] 24.68 22.97 24.68 19.49 24.68 24.68 10.21 CO2 cost [€/t CO2] 69.98 163.67 71.52 70.26 91.39 91.39 35.37
As for biomass heating, the conditions are identical in all EMCs and the difference is made with energy prices and the FIT police in France, Czech Republic and Turkey which obtains the best performances. But the life cycle cost of biomass CHP project would still be higher than in the baseline scenario. In TMMF, biomass CHP results in a very high abatement cost due to the low CO2 benefit from electricity generated (86% of nuclear in electricity mix). UK has the highest energy prices and thus in the least increase in energy cost.
3.5.7 Waste-to-energy heating In this part it is assumed that on-site generated wastes which are not recycled
(those sent to incineration) are used as fuel for heat generation. On-site generated wastes are not considered as renewable energy sources. However, if a waste product from a process can be recovered and used as an alternative feedstock or recyclable input while retaining its value, this would certainly be considered renewable from a sustainability point of view.
In the following results, a modern 100 kW biomass boiler technical data has been used. It is assumed that only on-site generated wastes are used. The waste management unit cost is calculated from the sum of transport, treatment and incineration total costs divided by the corresponding amount of usable waste. Due to a lack of data from TMMT, the waste management cost is assumed to be ~18 c€/kg (180 €/ton) for this EMC. The annual heat generated is 460 MWh, the turnkey investment cost 100,000 € and O&M cost 7,245 €/year.
Table 24: Waste-to-energy heating performance WtE heating TMIP TMMF TMMP TMMT TMUKB TMUKD TPCA Waste mgt cost [€/t] 268.67 208.15 234.22 180.00 198.84 147.51 152.49 Waste mgt savings [€/year] 74,135 57,436 64,630 49,669 54,869 40,704 42,079 Annual avoided CO2 [t/yr] - - - - - - - Annual benefits [€/yr] 79,718 62,642 70,200 48,392 61,412 47,449 46,336 Life cycle cost
Baseline scenario [€] 164,591 159,757 164,433 76,578 176,907 179,498 147,580 With RE project [€] -758,217 -543,956 -636,258 -444,308 -511,021 -329,283 -346,918
Performance indicator Energy cost [€/kWh] -82.43 -59.14 -69.17 -48.30 -55.56 -35.80 -37.72 CO2 cost [€/t CO2] - - - - - - -
3 - Technology assessment
49
On-site generated wastes are not a carbon-neutral source of energy and data about the carbon content are not available, therefore the calculations about avoided CO2 emissions are not applied. Furthermore, the economical analysis does not include the treatment cost of flue gas from the waste combustion. The major part of the benefits comes from the avoided waste management cost. As a consequence, the economic benefits are especially high and not comparable with the results of the RES options. The economic performance of WtE heating is hardly influenced by the gas price but is highly dependent on the waste management cost of the baseline scenario.
3.5.8 Waste-to-energy CHP In the following results, a modern 100 kW biomass boiler technical data has been
used. It is assumed that only on-site generated wastes are used. The waste management unit cost is the same as previously in waste-to-energy heating (chapter 3.5.7). The annual heat generated is 337 MWh and the annual electricity generated is 184 MWh, the turnkey investment cost 204,000 € and O&M cost 12,575 €/year.
Table 25: Waste-to-energy CHP performance WtE CHP TMIP TMMF TMMP TMMT TMUKB TMUKD TPCA Waste mgt cost [€/t] 268.67 208.15 234.22 180.00 198.84 147.51 152.49 Waste mgt savings [€/year] 74,135 57,436 64,630 49,669 54,869 40,704 42,079 Annual avoided CO2 [t/yr] - - - - - - - Annual benefits [€/yr] 83,281 63,745 74,207 47,125 69,763 57,018 49,413 Life cycle cost
Baseline scenario [€] -37,082 1,203,680 -119,579 325,601 432,000 432,000 211,066 With RE project [€] -585,837 -371,577 -463,879 -271,929 -338,642 -156,903 -174,538
Performance indicator Energy cost [€/kWh] -56.20 -35.64 -44.50 -26.09 -32.49 -15.05 -16.74 CO2 cost [€/t CO2] - - - - - - -
For the same reasons as for WtE heating, environmental performance is not calculated for WtE CHP. Although the turnkey investment cost and O&M costs are higher than for WtE heating, the life cycle cost is lower due to higher energy conversion efficiency and to high electricity prices. But one must keep in mind that the flue gas from WtE energy generation plant must be treated and this additional cost is not included in those results.
3 - Technology assessment
50
3.6 Summary The energy generation cost and the ranking for the selected technologies is
summarised below in the Table 26.
Table 26: Average generation cost TMIP TMMF TMMP TMMT TMUKB TMUKD TPCA Hydropower Energy generation cost [€/kWh] 38.58 6.83 38.58 23.01 38.58 38.58 20.85 CO2 cost [€/t CO2] 58.01 124.26 58.01 49.81 89.72 89.72 41.46 Wind power Energy generation cost [€/kWh] 321.52 10.82 28.88 635.08 46.66 32.58 25.91 CO2 cost [€/t CO2] 483.47 196.75 43.42 1,374.56 108.51 75.76 51.50 Ground-source heat pump Energy generation cost [€/kWh] 22.62 19.90 23.07 15.57 27.94 29.28 21.72 CO2 cost [€/t CO2] - 119.66 - 346.10 468.02 490.53 744.75 Solar water heating Energy generation cost [€/kWh] 46.79 47.91 46.79 37.08 49.84 49.52 46.81 CO2 cost [€/t CO2] 238.22 261.80 252.90 200.42 262.32 260.63 257.77 Bio heating Energy generation cost [€/kWh] 19.71 19.71 19.71 19.71 19.71 19.71 19.71 CO2 cost [€/t CO2] 100.37 107.72 106.56 106.56 103.75 103.75 108.55 Bio CHP Energy generation cost [€/kWh] 24.68 22.97 24.68 19.49 24.68 24.68 10.21 CO2 cost [€/t CO2] 69.98 163.67 71.52 70.26 91.39 91.39 35.37 WtE heating Energy generation cost [€/kWh] -82.43 -59.14 -69.17 -48.30 -55.56 -35.80 -37.72 CO2 cost [€/t CO2] - - - - - - - WtE CHP Energy generation cost [€/kWh] -56.20 -35.64 -44.50 -26.09 -32.49 -15.05 -16.74 CO2 cost [€/t CO2] - - - - - - -
The energy generation cost has been chosen as a criterion for the EMC roadmaps towards carbon-neutral manufacturing plant as the economic efficiency of the project is highly desirable. Legal aspects and security of supply are indirectly linked to this indicator: the more energy is produced with one € invested, the closer the EMC move towards the legal target of 20% of RES in final energy use, and the higher the energy security will be. Moreover, the energy price is assumed to be constant in the previous chapter. It is expected that the life cycle cost of the baseline scenarios will increase. Conversely the RE project scenarios’ life cycle cost is will decrease in time.
But this criterion is not directly connected to the global aim of this study. Therefore the environmental performance is represented with a second criterion: the CO2 abatement cost. Each of those 2 criteria used alone would not give a good overview of the energy option performance: for instance, GSHP option results in higher abatement cost than solar heating due to the additional consumption of electricity by the heat pump, but also in a lower energy generation cost due to very low O&M cost.
Important note: The economical performance of WtE options has be calculated only partially (only the cost for installing the boiler/steam turbine but not the pre-treatment of waste to increase dryness or combustion emissions treatment). And the environmental performance could not be evaluated at all. But the use of waste flow as a resource is an essential solution for the Sustainable Plant project. Further studies on WtE options are necessary to determine the environmental benefits and the requirements for their application, therefore WtE heating and WtE CHP will not be included in the roadmaps of this report.
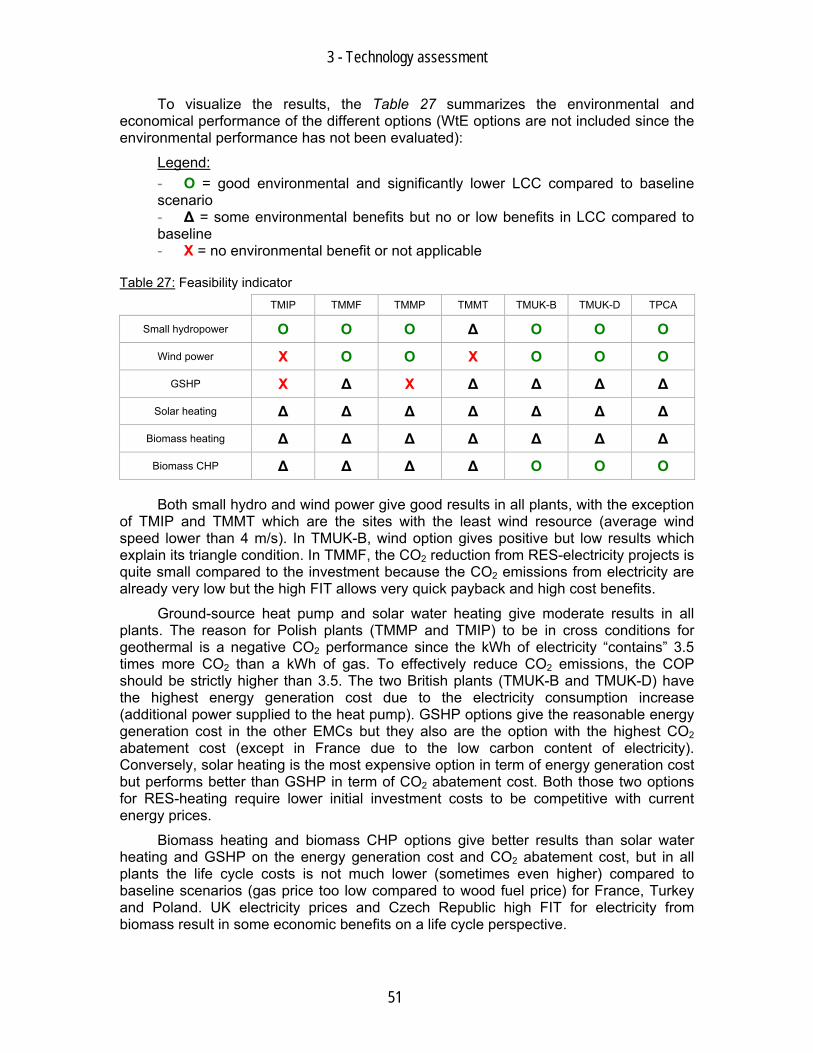
3 - Technology assessment
51
To visualize the results, the Table 27 summarizes the environmental and economical performance of the different options (WtE options are not included since the environmental performance has not been evaluated):
Legend: - O = good environmental and significantly lower LCC compared to baseline scenario - Δ = some environmental benefits but no or low benefits in LCC compared to baseline - X = no environmental benefit or not applicable
Table 27: Feasibility indicator TMIP TMMF TMMP TMMT TMUK-B TMUK-D TPCA
Small hydropower Ο Ο Ο Δ Ο Ο Ο
Wind power X Ο Ο X Ο Ο Ο
GSHP X Δ X Δ Δ Δ Δ
Solar heating Δ Δ Δ Δ Δ Δ Δ
Biomass heating Δ Δ Δ Δ Δ Δ Δ
Biomass CHP Δ Δ Δ Δ Ο Ο Ο
Both small hydro and wind power give good results in all plants, with the exception of TMIP and TMMT which are the sites with the least wind resource (average wind speed lower than 4 m/s). In TMUK-B, wind option gives positive but low results which explain its triangle condition. In TMMF, the CO2 reduction from RES-electricity projects is quite small compared to the investment because the CO2 emissions from electricity are already very low but the high FIT allows very quick payback and high cost benefits.
Ground-source heat pump and solar water heating give moderate results in all plants. The reason for Polish plants (TMMP and TMIP) to be in cross conditions for geothermal is a negative CO2 performance since the kWh of electricity “contains” 3.5 times more CO2 than a kWh of gas. To effectively reduce CO2 emissions, the COP should be strictly higher than 3.5. The two British plants (TMUK-B and TMUK-D) have the highest energy generation cost due to the electricity consumption increase (additional power supplied to the heat pump). GSHP options give the reasonable energy generation cost in the other EMCs but they also are the option with the highest CO2 abatement cost (except in France due to the low carbon content of electricity). Conversely, solar heating is the most expensive option in term of energy generation cost but performs better than GSHP in term of CO2 abatement cost. Both those two options for RES-heating require lower initial investment costs to be competitive with current energy prices.
Biomass heating and biomass CHP options give better results than solar water heating and GSHP on the energy generation cost and CO2 abatement cost, but in all plants the life cycle costs is not much lower (sometimes even higher) compared to baseline scenarios (gas price too low compared to wood fuel price) for France, Turkey and Poland. UK electricity prices and Czech Republic high FIT for electricity from biomass result in some economic benefits on a life cycle perspective.

3 - Technology assessment
52
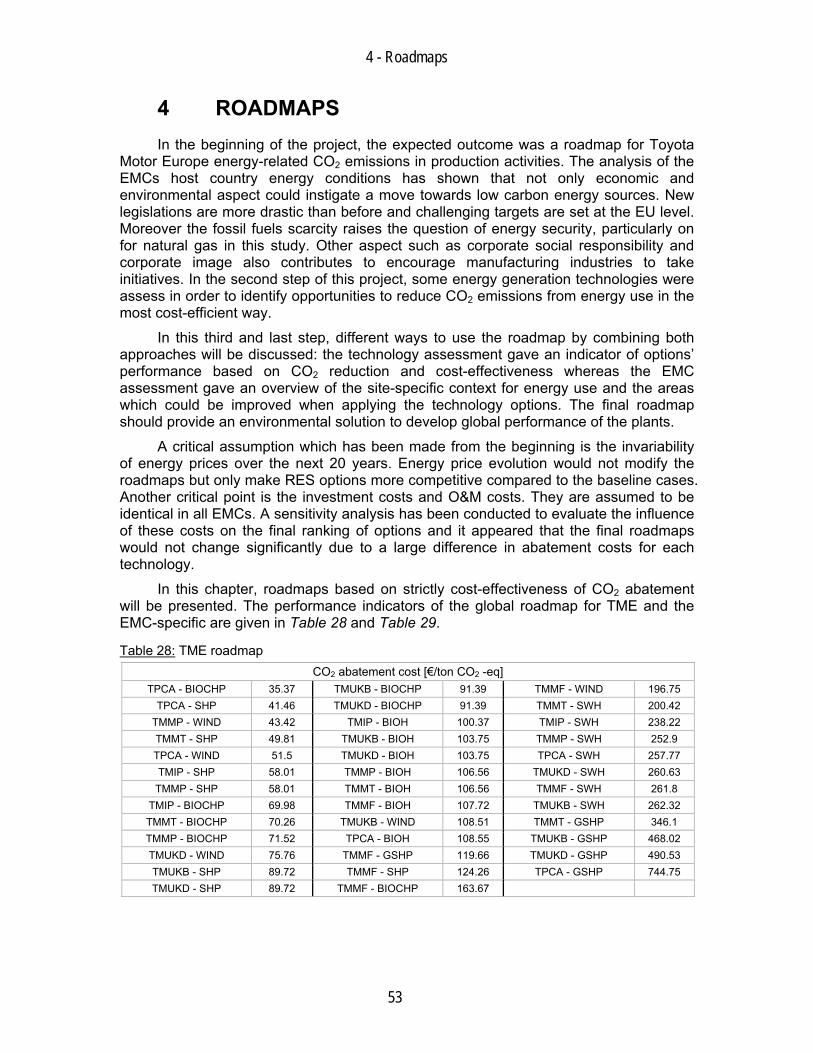
4 - Roadmaps
53
4 ROADMAPS In the beginning of the project, the expected outcome was a roadmap for Toyota
Motor Europe energy-related CO2 emissions in production activities. The analysis of the EMCs host country energy conditions has shown that not only economic and environmental aspect could instigate a move towards low carbon energy sources. New legislations are more drastic than before and challenging targets are set at the EU level. Moreover the fossil fuels scarcity raises the question of energy security, particularly on for natural gas in this study. Other aspect such as corporate social responsibility and corporate image also contributes to encourage manufacturing industries to take initiatives. In the second step of this project, some energy generation technologies were assess in order to identify opportunities to reduce CO2 emissions from energy use in the most cost-efficient way.
In this third and last step, different ways to use the roadmap by combining both approaches will be discussed: the technology assessment gave an indicator of options’ performance based on CO2 reduction and cost-effectiveness whereas the EMC assessment gave an overview of the site-specific context for energy use and the areas which could be improved when applying the technology options. The final roadmap should provide an environmental solution to develop global performance of the plants.
A critical assumption which has been made from the beginning is the invariability of energy prices over the next 20 years. Energy price evolution would not modify the roadmaps but only make RES options more competitive compared to the baseline cases. Another critical point is the investment costs and O&M costs. They are assumed to be identical in all EMCs. A sensitivity analysis has been conducted to evaluate the influence of these costs on the final ranking of options and it appeared that the final roadmaps would not change significantly due to a large difference in abatement costs for each technology.
In this chapter, roadmaps based on strictly cost-effectiveness of CO2 abatement will be presented. The performance indicators of the global roadmap for TME and the EMC-specific are given in Table 28 and Table 29.
Table 28: TME roadmap CO2 abatement cost [€/ton CO2 -eq]
TPCA - BIOCHP 35.37 TMUKB - BIOCHP 91.39 TMMF - WIND 196.75 TPCA - SHP 41.46 TMUKD - BIOCHP 91.39 TMMT - SWH 200.42
TMMP - WIND 43.42 TMIP - BIOH 100.37 TMIP - SWH 238.22 TMMT - SHP 49.81 TMUKB - BIOH 103.75 TMMP - SWH 252.9 TPCA - WIND 51.5 TMUKD - BIOH 103.75 TPCA - SWH 257.77 TMIP - SHP 58.01 TMMP - BIOH 106.56 TMUKD - SWH 260.63
TMMP - SHP 58.01 TMMT - BIOH 106.56 TMMF - SWH 261.8 TMIP - BIOCHP 69.98 TMMF - BIOH 107.72 TMUKB - SWH 262.32 TMMT - BIOCHP 70.26 TMUKB - WIND 108.51 TMMT - GSHP 346.1 TMMP - BIOCHP 71.52 TPCA - BIOH 108.55 TMUKB - GSHP 468.02 TMUKD - WIND 75.76 TMMF - GSHP 119.66 TMUKD - GSHP 490.53 TMUKB - SHP 89.72 TMMF - SHP 124.26 TPCA - GSHP 744.75 TMUKD - SHP 89.72 TMMF - BIOCHP 163.67
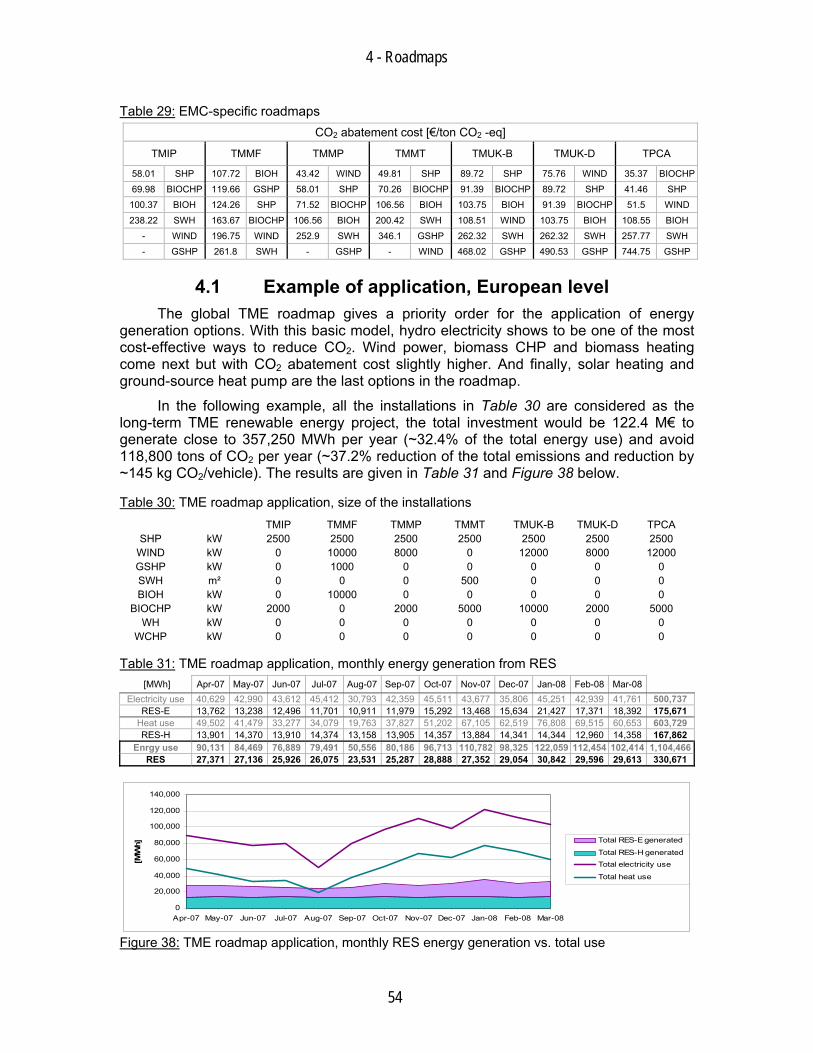
4 - Roadmaps
54
Table 29: EMC-specific roadmaps CO2 abatement cost [€/ton CO2 -eq]
TMIP TMMF TMMP TMMT TMUK-B TMUK-D TPCA
58.01 SHP 107.72 BIOH 43.42 WIND 49.81 SHP 89.72 SHP 75.76 WIND 35.37 BIOCHP
69.98 BIOCHP 119.66 GSHP 58.01 SHP 70.26 BIOCHP 91.39 BIOCHP 89.72 SHP 41.46 SHP
100.37 BIOH 124.26 SHP 71.52 BIOCHP 106.56 BIOH 103.75 BIOH 91.39 BIOCHP 51.5 WIND
238.22 SWH 163.67 BIOCHP 106.56 BIOH 200.42 SWH 108.51 WIND 103.75 BIOH 108.55 BIOH
- WIND 196.75 WIND 252.9 SWH 346.1 GSHP 262.32 SWH 262.32 SWH 257.77 SWH
- GSHP 261.8 SWH - GSHP - WIND 468.02 GSHP 490.53 GSHP 744.75 GSHP
4.1 Example of application, European level The global TME roadmap gives a priority order for the application of energy
generation options. With this basic model, hydro electricity shows to be one of the most cost-effective ways to reduce CO2. Wind power, biomass CHP and biomass heating come next but with CO2 abatement cost slightly higher. And finally, solar heating and ground-source heat pump are the last options in the roadmap.
In the following example, all the installations in Table 30 are considered as the long-term TME renewable energy project, the total investment would be 122.4 M€ to generate close to 357,250 MWh per year (~32.4% of the total energy use) and avoid 118,800 tons of CO2 per year (~37.2% reduction of the total emissions and reduction by ~145 kg CO2/vehicle). The results are given in Table 31 and Figure 38 below.
Table 30: TME roadmap application, size of the installations TMIP TMMF TMMP TMMT TMUK-B TMUK-D TPCA
SHP kW 2500 2500 2500 2500 2500 2500 2500 WIND kW 0 10000 8000 0 12000 8000 12000 GSHP kW 0 1000 0 0 0 0 0 SWH m² 0 0 0 500 0 0 0 BIOH kW 0 10000 0 0 0 0 0
BIOCHP kW 2000 0 2000 5000 10000 2000 5000 WH kW 0 0 0 0 0 0 0
WCHP kW 0 0 0 0 0 0 0
Table 31: TME roadmap application, monthly energy generation from RES [MWh] Apr-07 May-07 Jun-07 Jul-07 Aug-07 Sep-07 Oct-07 Nov-07 Dec-07 Jan-08 Feb-08 Mar-08
Electricity use 40,629 42,990 43,612 45,412 30,793 42,359 45,511 43,677 35,806 45,251 42,939 41,761 500,737 RES-E 13,762 13,238 12,496 11,701 10,911 11,979 15,292 13,468 15,634 21,427 17,371 18,392 175,671
Heat use 49,502 41,479 33,277 34,079 19,763 37,827 51,202 67,105 62,519 76,808 69,515 60,653 603,729 RES-H 13,901 14,370 13,910 14,374 13,158 13,905 14,357 13,884 14,341 14,344 12,960 14,358 167,862
Enrgy use 90,131 84,469 76,889 79,491 50,556 80,186 96,713 110,782 98,325 122,059 112,454 102,414 1,104,466RES 27,371 27,136 25,926 26,075 23,531 25,287 28,888 27,352 29,054 30,842 29,596 29,613 330,671
0
20,000
40,000
60,000
80,000
100,000
120,000
140,000
Apr-07 May-07 Jun-07 Jul-07 Aug-07 Sep-07 Oct-07 Nov-07 Dec-07 Jan-08 Feb-08 Mar-08
[MW
h] Total RES-E generated
Total RES-H generatedTotal electricity use
Total heat use
Figure 38: TME roadmap application, monthly RES energy generation vs. total use
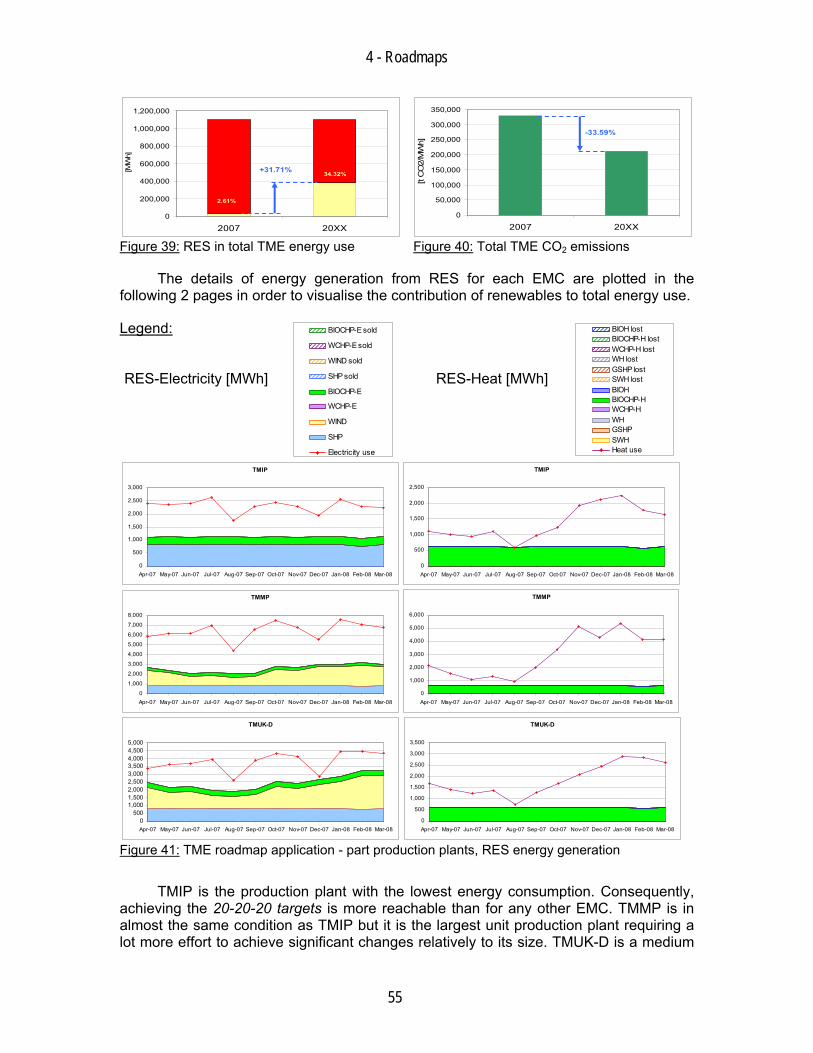
4 - Roadmaps
55
0
200,000
400,000
600,000
800,000
1,000,000
1,200,000
2007 20XX
[MW
h]
+31.71%
2.61%
34.32%
Figure 39: RES in total TME energy use
0
50,000
100,000
150,000
200,000
250,000
300,000
350,000
2007 20XX
[t C
O2/
MW
h]
-33.59%
Figure 40: Total TME CO2 emissions
The details of energy generation from RES for each EMC are plotted in the following 2 pages in order to visualise the contribution of renewables to total energy use.
Legend: RES-Electricity [MWh]
BIOCHP-E sold
WCHP-E sold
WIND sold
SHP sold
BIOCHP-E
WCHP-E
WIND
SHP
Electricity use
RES-Heat [MWh]
BIOH lostBIOCHP-H lostWCHP-H lostWH lostGSHP lostSWH lostBIOHBIOCHP-HWCHP-HWHGSHPSWHHeat use
TMIP
0
500
1,000
1,500
2,000
2,500
3,000
Apr-07 May-07 Jun-07 Jul-07 Aug-07 Sep-07 Oct-07 Nov-07 Dec-07 Jan-08 Feb-08 Mar-08
TMIP
0
500
1,000
1,500
2,000
2,500
Apr-07 May-07 Jun-07 Jul-07 Aug-07 Sep-07 Oct-07 Nov-07 Dec-07 Jan-08 Feb-08 Mar-08
TMMP
0
1,000
2,000
3,000
4,000
5,000
6,000
7,000
8,000
Apr-07 May-07 Jun-07 Jul-07 Aug-07 Sep-07 Oct-07 Nov-07 Dec-07 Jan-08 Feb-08 Mar-08
TMMP
0
1,000
2,000
3,000
4,000
5,000
6,000
Apr-07 May-07 Jun-07 Jul-07 Aug-07 Sep-07 Oct-07 Nov-07 Dec-07 Jan-08 Feb-08 Mar-08
TMUK-D
0500
1,0001,5002,0002,5003,0003,5004,0004,5005,000
Apr-07 May-07 Jun-07 Jul-07 Aug-07 Sep-07 Oct-07 Nov-07 Dec-07 Jan-08 Feb-08 Mar-08
TMUK-D
0
500
1,000
1,500
2,000
2,500
3,000
3,500
Apr-07 May-07 Jun-07 Jul-07 Aug-07 Sep-07 Oct-07 Nov-07 Dec-07 Jan-08 Feb-08 Mar-08
Figure 41: TME roadmap application - part production plants, RES energy generation
TMIP is the production plant with the lowest energy consumption. Consequently, achieving the 20-20-20 targets is more reachable than for any other EMC. TMMP is in almost the same condition as TMIP but it is the largest unit production plant requiring a lot more effort to achieve significant changes relatively to its size. TMUK-D is a medium
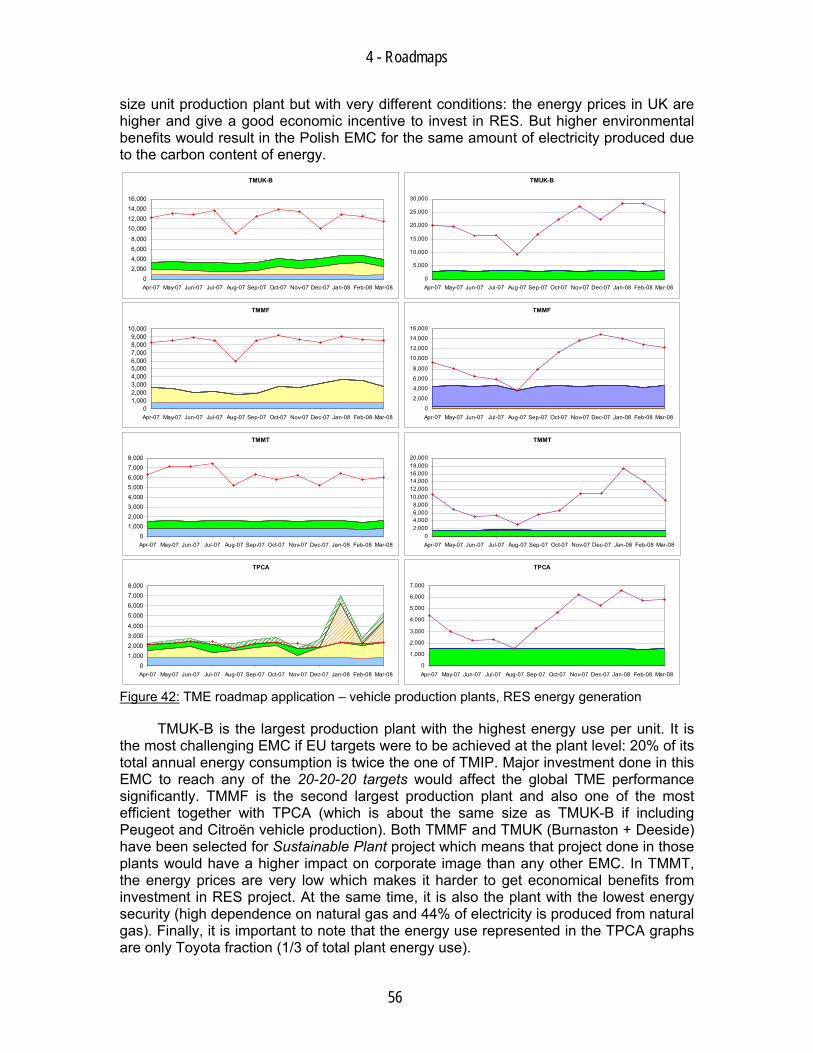
4 - Roadmaps
56
size unit production plant but with very different conditions: the energy prices in UK are higher and give a good economic incentive to invest in RES. But higher environmental benefits would result in the Polish EMC for the same amount of electricity produced due to the carbon content of energy.
TMUK-B
02,0004,0006,0008,000
10,00012,00014,00016,000
Apr-07 May-07 Jun-07 Jul-07 Aug-07 Sep-07 Oct-07 Nov-07 Dec-07 Jan-08 Feb-08 Mar-08
TMUK-B
0
5,000
10,000
15,000
20,000
25,000
30,000
Apr-07 May-07 Jun-07 Jul-07 Aug-07 Sep-07 Oct-07 Nov-07 Dec-07 Jan-08 Feb-08 Mar-08
TMMF
01,0002,0003,0004,0005,0006,0007,0008,0009,000
10,000
Apr-07 May-07 Jun-07 Jul-07 Aug-07 Sep-07 Oct-07 Nov-07 Dec-07 Jan-08 Feb-08 Mar-08
TMMF
0
2,000
4,000
6,000
8,000
10,000
12,000
14,000
16,000
Apr-07 May-07 Jun-07 Jul-07 Aug-07 Sep-07 Oct-07 Nov-07 Dec-07 Jan-08 Feb-08 Mar-08
TMMT
01,0002,0003,0004,0005,0006,0007,0008,000
Apr-07 May-07 Jun-07 Jul-07 Aug-07 Sep-07 Oct-07 Nov-07 Dec-07 Jan-08 Feb-08 Mar-08
TMMT
02,0004,0006,0008,000
10,00012,00014,00016,00018,00020,000
Apr-07 May-07 Jun-07 Jul-07 Aug-07 Sep-07 Oct-07 Nov-07 Dec-07 Jan-08 Feb-08 Mar-08
TPCA
01,0002,0003,0004,000
5,0006,0007,0008,000
Apr-07 May-07 Jun-07 Jul-07 Aug-07 Sep-07 Oct-07 Nov-07 Dec-07 Jan-08 Feb-08 Mar-08
TPCA
0
1,000
2,000
3,000
4,000
5,000
6,000
7,000
Apr-07 May-07 Jun-07 Jul-07 Aug-07 Sep-07 Oct-07 Nov-07 Dec-07 Jan-08 Feb-08 Mar-08
Figure 42: TME roadmap application – vehicle production plants, RES energy generation
TMUK-B is the largest production plant with the highest energy use per unit. It is the most challenging EMC if EU targets were to be achieved at the plant level: 20% of its total annual energy consumption is twice the one of TMIP. Major investment done in this EMC to reach any of the 20-20-20 targets would affect the global TME performance significantly. TMMF is the second largest production plant and also one of the most efficient together with TPCA (which is about the same size as TMUK-B if including Peugeot and Citroën vehicle production). Both TMMF and TMUK (Burnaston + Deeside) have been selected for Sustainable Plant project which means that project done in those plants would have a higher impact on corporate image than any other EMC. In TMMT, the energy prices are very low which makes it harder to get economical benefits from investment in RES project. At the same time, it is also the plant with the lowest energy security (high dependence on natural gas and 44% of electricity is produced from natural gas). Finally, it is important to note that the energy use represented in the TPCA graphs are only Toyota fraction (1/3 of total plant energy use).

4 - Roadmaps
57
4.2 Example of application, TMUK-D The EMC-specific roadmap can be used independently from the global TME
roadmap. For instance, TMMF and TMUK are the European production plants selected for the Sustainable Plant project and therefore, implementing renewable energy project in those plants can considered as a higher priority than other more cost-effective options in other plants.
To demonstrate the application of EMC-specific roadmap, one of the selected EMC for Sustainable Plant project will be used as an example: TMUK-D is a part production plant with a total annual energy consumption of 67,823 MWh, annual CO2 emissions of 23,827 tons of CO2-eq and produces ~300,000 engines per year.
Given the abatement costs: - WIND: 75.76 €/ton CO2 - SHP: 89.72 €/ton CO2 - BIOCHP: 91.39 €/ton CO2 - BIOH: 103.75 €/ton CO2
and assuming the following installations: - WIND: 8.0 MWe - SHP: 2.5 MWe - BIOCHP: 5.0 MWth - BIOH: 2.0 MWth
the total investment would be 19.74 M€, and result in a total energy generation of 63.7 GWh from RES (~93% of total energy use) and in a CO2 emissions reduction of 19,346 tons (~86% of total CO2). The remaining ~14% CO2 reduction required to achieve carbon neutral manufacturing plant is mostly electricity and can be purchase from green supplier (100% of RES in electricity mix).
Table 32: TMUK-D-specific roadmap application, monthly energy generation from RES [MWh] Apr-07 May-07 Jun-07 Jul-07 Aug-07 Sep-07 Oct-07 Nov-07 Dec-07 Jan-08 Feb-08 Mar-08
Electricity use 3,366 3,640 3,663 3,929 2,612 3,885 4,302 4,106 2,833 4,447 4,457 4,349 45,589 RES-E 2,927 2,499 2,545 2,298 1,915 2,323 3,024 2,842 2,833 3,317 3,635 3,671 33,834
Heat use 1,666 1,392 1,259 1,363 720 1,280 1,687 2,091 2,467 2,875 2,826 2,607 22,233 RES-H 1,666 1,392 1,259 1,363 720 1,280 1,687 2,091 2,467 2,790 2,520 2,607 21,842
Energy use 5,032 5,032 4,922 5,292 3,332 5,165 5,989 6,197 5,300 7,322 7,283 6,956 67,822 RES 4,593 3,892 3,804 3,661 2,635 3,603 4,712 4,933 5,229 5,714 5,799 6,067 54,643
TMUK-D
0
500
1,000
1,500
2,000
2,500
3,000
3,500
4,000
4,500
5,000
Apr-07 May-07 Jun-07 Jul-07 Aug-07 Sep-07 Oct-07 Nov-07 Dec-07 Jan-08 Feb-08 Mar-08
BIOCHP-E sold
WCHP-E sold
WIND sold
SHP sold
BIOCHP-E
WCHP-E
WIND
SHP
Electricity use
TMUK-D
0
500
1,000
1,500
2,000
2,500
3,000
3,500
Apr-07 May-07 Jun-07 Jul-07 Aug-07 Sep-07 Oct-07 Nov-07 Dec-07 Jan-08 Feb-08 Mar-08
BIOH lost
BIOCHP-H lost
WCHP-H lost
WH lostGSHP lost
SWH lost
BIOH
BIOCHP-H
WCHP-H
WHGSHP
SWH
Heat use
0
1,000
2,000
3,000
4,000
5,000
6,000
7,000
8,000
Apr-07 May-07 Jun-07 Jul-07 Aug-07 Sep-07 Oct-07 Nov-07 Dec-07 Jan-08 Feb-08 Mar-08
[MW
h] RES-E generated
RES-H generatedElectricity use
Heat use
Figure 43: TMUK-D -specific roadmap application, RES energy generation vs. total use
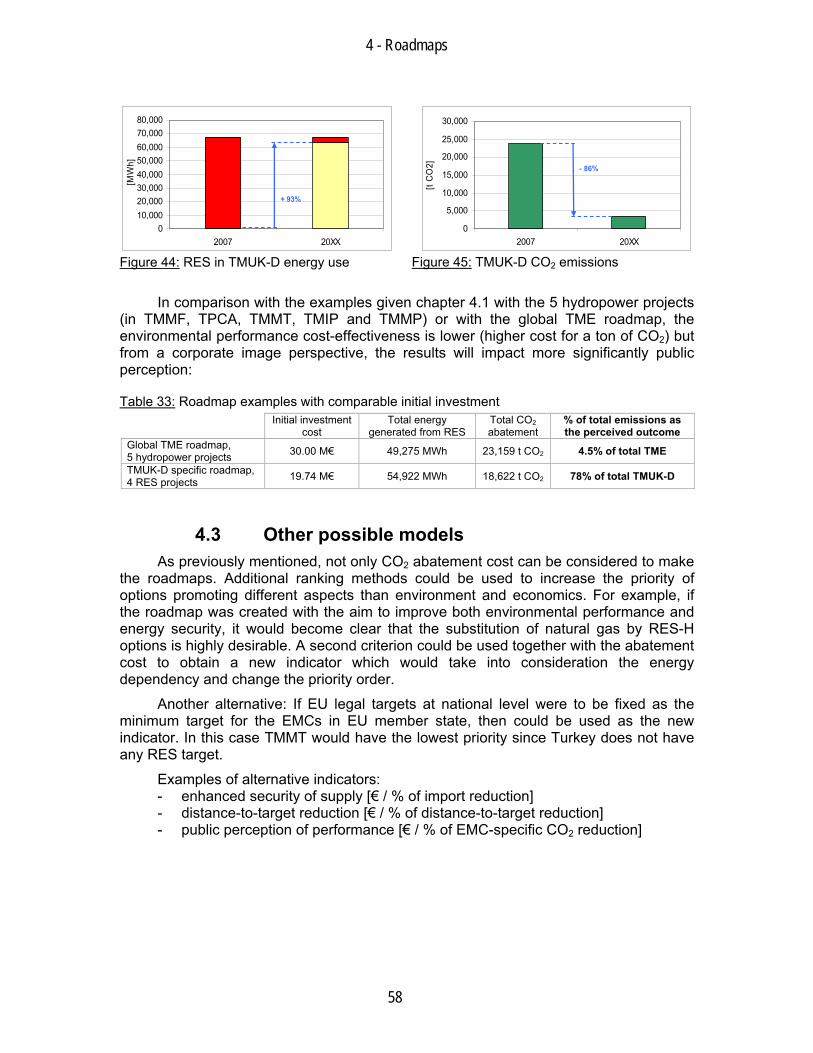
4 - Roadmaps
58
010,00020,00030,00040,00050,00060,00070,00080,000
2007 20XX
[MW
h]
+ 93%
Figure 44: RES in TMUK-D energy use
0
5,000
10,000
15,000
20,000
25,000
30,000
2007 20XX
[t C
O2] - 86%
Figure 45: TMUK-D CO2 emissions
In comparison with the examples given chapter 4.1 with the 5 hydropower projects (in TMMF, TPCA, TMMT, TMIP and TMMP) or with the global TME roadmap, the environmental performance cost-effectiveness is lower (higher cost for a ton of CO2) but from a corporate image perspective, the results will impact more significantly public perception:
Table 33: Roadmap examples with comparable initial investment
Initial investment cost
Total energy generated from RES
Total CO2 abatement
% of total emissions as the perceived outcome
Global TME roadmap, 5 hydropower projects 30.00 M€ 49,275 MWh 23,159 t CO2 4.5% of total TME
TMUK-D specific roadmap, 4 RES projects 19.74 M€ 54,922 MWh 18,622 t CO2 78% of total TMUK-D
4.3 Other possible models As previously mentioned, not only CO2 abatement cost can be considered to make
the roadmaps. Additional ranking methods could be used to increase the priority of options promoting different aspects than environment and economics. For example, if the roadmap was created with the aim to improve both environmental performance and energy security, it would become clear that the substitution of natural gas by RES-H options is highly desirable. A second criterion could be used together with the abatement cost to obtain a new indicator which would take into consideration the energy dependency and change the priority order.
Another alternative: If EU legal targets at national level were to be fixed as the minimum target for the EMCs in EU member state, then could be used as the new indicator. In this case TMMT would have the lowest priority since Turkey does not have any RES target.
Examples of alternative indicators: - enhanced security of supply [€ / % of import reduction] - distance-to-target reduction [€ / % of distance-to-target reduction] - public perception of performance [€ / % of EMC-specific CO2 reduction]
5 - Discussion
59
5 DISCUSSION The highest priority is a quantitative optimisation: increase the output/input ratio by
eliminating the material and energy which are not vital for the activities, then reducing these flows by increasing reuse/recovery/recycling rate and conversion efficiency. Toyota’s strategy presented in introduction of this report clearly shows this hierarchy in environmental activities. The next priority is to improve the qualitative aspects: it is important to manage the inputs and the processes through which they will go before becoming the output (products, by-products, waste/emissions...). Therefore, using high quality input such as recyclable materials or renewable energy sources will result in better outputs such as less armful / hazardous waste and lower air emissions.
Design of processes and systems must include integration and interconnectivity with available energy and material flows. System components should be output-pulled rather than input-pushed through the use of energy and materials (Le Châtelier principle*): wherever there is a system in equilibrium, a design choice is available to take advantage of this principle to minimize the resource inputs necessary to generate the desired outcome. In this project, the energy flows are optimized through appropriate technologies in the context of site-specific flows.
A critical aspect of the study was the geographical location of Toyota’s EMCs. The legal and natural environment varies greatly country to country and the roadmaps resulting from the same study in other European countries or other regions of the world would result in very different ranking of options to lessen the costs and environmental impacts of energy use, or even to increase the overall system efficiency. The resource inputs should be used at their highest economical and environmental value with BAT and local conditions (based on readily available inputs such as locally abundant renewable resources or waste generated on-site, and also considering the national economical incentives).
This thesis work has shown that renewable energy sources can be a major contributor to achieve the ultimate target of carbon-neutral manufacturing plant. Utilizing local resources in the production also increases the security of supply, helps to achieve national targets for RES share in final energy use and CO2 emissions reduction, and may provide an opportunity for local economic growth.
* Henry Louis Le Châtelier (1850-1936), French chemist who worked on the principle to predict the effect of a change in thermodynamic conditions on a chemical equilibrium: Lorsque des modifications extérieures sont apportées à un système en équilibre, l'évolution se fait de manière à s'opposer, en partie, aux perturbations qui l'ont engendrée et en modère l'effet afin d'atteindre un nouvel état d'équilibre. [If a system in equilibrium is subjected to a stress, the equilibrium will partly shift in the opposite direction of the imposed change and minimize its effect.]

60
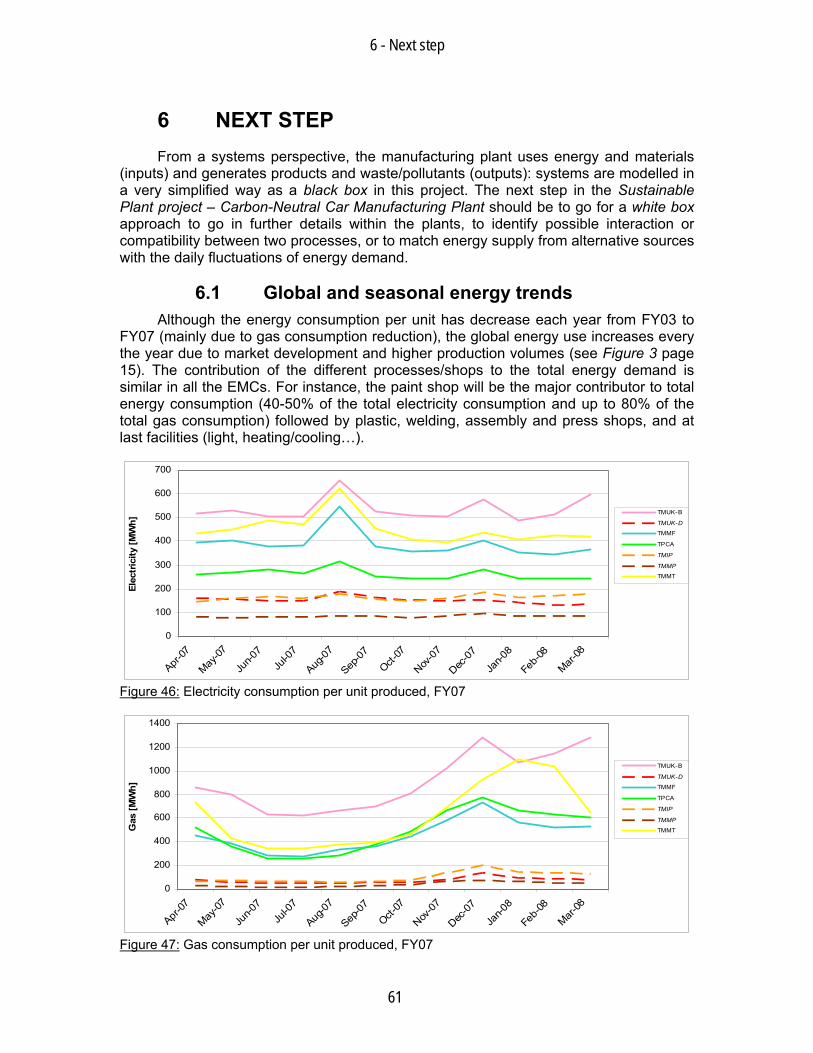
6 - Next step
61
6 NEXT STEP From a systems perspective, the manufacturing plant uses energy and materials
(inputs) and generates products and waste/pollutants (outputs): systems are modelled in a very simplified way as a black box in this project. The next step in the Sustainable Plant project – Carbon-Neutral Car Manufacturing Plant should be to go for a white box approach to go in further details within the plants, to identify possible interaction or compatibility between two processes, or to match energy supply from alternative sources with the daily fluctuations of energy demand.
6.1 Global and seasonal energy trends Although the energy consumption per unit has decrease each year from FY03 to
FY07 (mainly due to gas consumption reduction), the global energy use increases every the year due to market development and higher production volumes (see Figure 3 page 15). The contribution of the different processes/shops to the total energy demand is similar in all the EMCs. For instance, the paint shop will be the major contributor to total energy consumption (40-50% of the total electricity consumption and up to 80% of the total gas consumption) followed by plastic, welding, assembly and press shops, and at last facilities (light, heating/cooling…).
0
100
200
300
400
500
600
700
Apr-07
May-07
Jun-0
7Ju
l-07
Aug-0
7
Sep-0
7
Oct-07
Nov-0
7
Dec-0
7
Jan-0
8
Feb-
08
Mar-08
Elec
tric
ity [M
Wh]
TMUK-B
TMUK-D
TMMF
TPCA
TMIP
TMMP
TMMT
Figure 46: Electricity consumption per unit produced, FY07
0
200
400
600
800
1000
1200
1400
Apr-07
May-07
Jun-0
7Ju
l-07
Aug-0
7
Sep-0
7
Oct-07
Nov-0
7
Dec-0
7
Jan-0
8
Feb-
08
Mar-08
Gas
[MW
h]
TMUK-B
TMUK-D
TMMF
TPCA
TMIP
TMMP
TMMT
Figure 47: Gas consumption per unit produced, FY07

6 - Next step
62
The general seasonal influence is observable with higher gas consumption (increased heat demand) in winter and stable electricity consumption all over the year. Those trends can be seen in Figure 46 and Figure 47.
The peaks of electricity use in August and December are due to plant shut down or slow down in production: whether production is low or at its maximum capacity, there is a minimum amount of energy required to keep the plant in function; or when no vehicle or part is produced at all, there is still some energy consumed for maintaining the plant environment and security. This will be explained further in the next subchapter. The heat demand increases in winter as expected and the peak in December can be explained the same way as for electricity peaks (plant shut down for a week).
6.2 Energy demand variation at production level To find the most adapted type of energy source and the most appropriate
technology to match the consumption profile, one need to look at the energy consumption fluctuations at the process/machine level.
To match energy supply with the energy demand, one must consider the energy use sequences (continuous vs. batch production) and potential complementarities (use waste heat from a very high temperature process in another process requiring lower temperatures).
Energy generation technologies must be able to follow fluctuations (fast start-up and shutdown times) and fulfil 100% of the demand (supply all the power required when there is a peak demand). For instance, ground-source heat pump can provide a constant base load for heating and cooling or process water pre-heating, whereas wind power can only supply electricity intermittently, thus requiring a back-up system when wind is not blowing or when wind speed is not high enough.
In the graphs below is shown an example of energy use profile at plant scale*.
Energy use per hour
6 7 8 9 10 11 12 13 14 15 16 17 18 19 20
hours
ener
gy u
se
A
D
C CCBB
D
Figure 48: Example of daily energy use profile
Variables and constant in use
0 500nb of cars produced per
day
ener
gy u
se
D: variable energy inproportion to the number ofvehicule produced
C: constant energy neededto start up and/or shut downproduction
B: constant energy demandto maintain operatingconditions of equipement
A: constant energy tomaintain plant environmentand security
A
B
C
D
Figure 49: Energy variation as function of PV
* Energy Minimization Activities Manual for Automotive Manufacturing Plants, Toyota Energy Minimization Working Group
REFERENCES
63
REFERENCES Please note that the references used only once in the report are integrated in the footnotes report, only the most important and recurrent references are listed below.
[1] Toyota Europe Corporate Website: http://www.toyota.eu/
Presentation of Toyota in Europe: http://www.toyota.eu/02_About_Us/04_toyota_europe/index.aspx
European Sustainability Report: http://www.toyota.eu/04_environment/08_sustainability_report/index.aspx
[2] Corporation Global Site: http://www.toyota.co.jp/en/index.html
CSR concepts: http://www.toyota.co.jp/en/index_responsibility.html
The Fourth Toyota Environmental Action Plan: http://www.toyota.co.jp/en/environment/vision/plan/fourth_plan.html
Sustainability report: http://www.toyota.co.jp/en/environment/report/index.html
[3] Carbon Trust: http://www.carbontrust.co.uk/default.ct
[4] European Commission (EC): http://ec.europa.eu/index_en.htm
Climate Action: http://ec.europa.eu/climateaction/index_en.htm
SET Plan: http://ec.europa.eu/energy/technology/set_plan/set_plan_en.htm
ATLAS Project: http://ec.europa.eu/energy/atlas/home.html
Eurostat: http://ec.europa.eu/eurostat/
Joint Research Centre (JRC), Institute for Energy: http://ie.jrc.ec.europa.eu/
[5] Centrica, UK: http://www.centrica.co.uk/
REFERENCES
64
[6] EDF, France: http://www.edf.fr/
[7] EnergiaPro Gigawat, Poland (in Polish): http://www.gigawat.pl/
[8] Enerjisa, Turkey: http://www.enerjisa.com.tr/
[9] ČEZ Group, Czech Republic: http://www.cez.cz/en/home.html
[10] UNDP: http://www.undp.org/
[11] IEA: http://www.iea.org/
[12] Source of meteorological data for all production sites:
• IWEC Data - "Climate Design Data 2005 Ashrae Handbook" • European Commission - Joint Research Centre • Meteonorm
[13] EGEC (European Geothermal Energy Council): http://www.egec.org/
[14] Center for Environmental Systems Research, Kassel university: http://www.usf.uni-kassel.de/
[15] EUBIA (European Biomass Industry Association): http://www.eubia.org/
[16] DWIA (Danish Wind Industry Association): http://www.windpower.org/
[17] RETScreen, Engineering e-Textbook, Clean Energy Project Analysis: http://www.retscreen.net/ang/12.php

Appendix I
i
APPENDIX I Table 34: Toyota Earth Charter
II. Action Guidelines 1. Always be concerned about the environment Take on the challenge of achieving zero emissions at all stages, i.e., production, utilization, and disposal (1) Develop and provide products with top-level environmental performance (2) Pursue production activities that do not generate waste (3)Implement thorough preventive measures (4) Promote businesses that contribute toward environmental improvement
2. Business partners are partners in creating a better environment Cooperate with associated companies3. As a member of society Actively participate in social actions (1) Participate in the creation of a recycling-based society (2) Support government environmental policies (3) Contribute also to non-profit activities
4. Toward better understanding Actively disclose information and promote environmental awareness
I. Basic Policy 1. Contribution toward a prosperous 21st century society Contribute toward a prosperous 21st century society. Aim for growth that is in harmony with the environment, and set as a challenge the achievement of zero emissions throughout all areas of business activities. 2. Pursuit of environmental technologies Pursue all possible environmental technologies, developing and establishing new technologies to enable the environment and economy to coexist harmoniously. 3. Voluntary actions Develop a voluntary improvement plan, based on thorough preventive measures and compliance with laws that addresses environmental issues on the global, national, and regional scales, and promotes continuous implementation. 4. Working in cooperation with society Build close and cooperative relationships with a wide spectrum of individuals and organizations involved in environmental preservation including governments, local municipalities, related companies and industries.
III. Organization in Charge Promotion by the Toyota Environment Committee which consists of top management (chaired by the president)
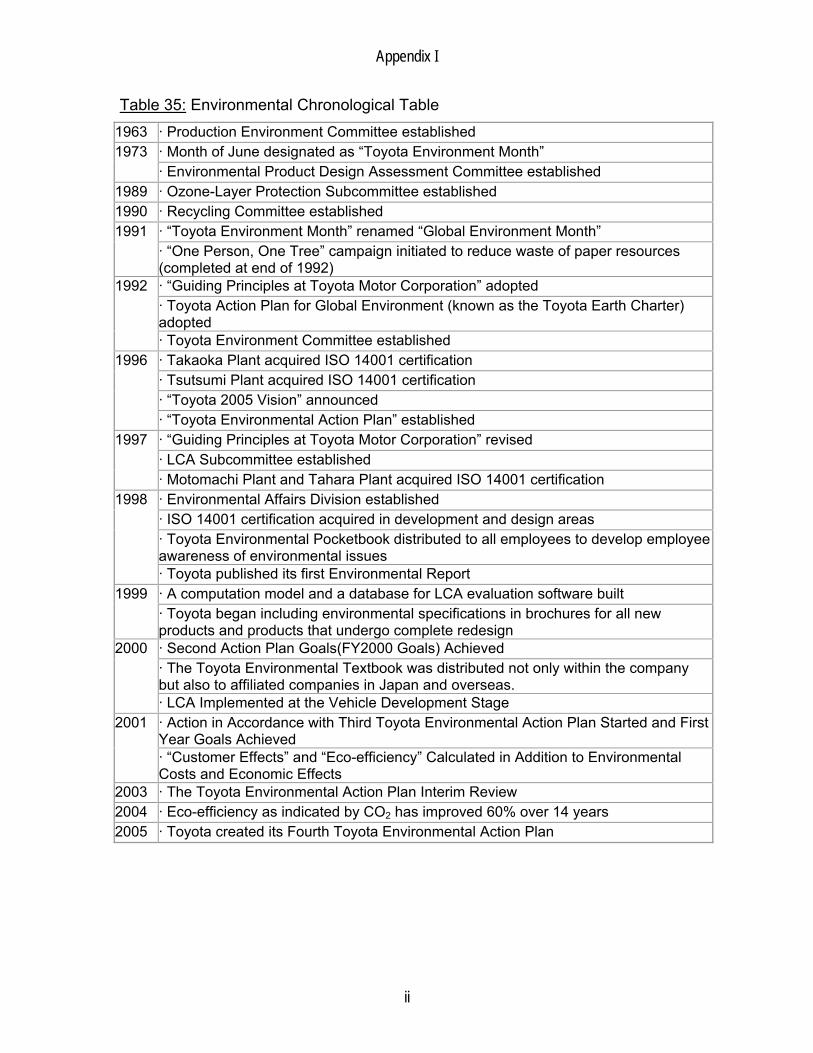
Appendix I
ii
Table 35: Environmental Chronological Table 1963 · Production Environment Committee established
· Month of June designated as “Toyota Environment Month” 1973 · Environmental Product Design Assessment Committee established
1989 · Ozone-Layer Protection Subcommittee established 1990 · Recycling Committee established
· “Toyota Environment Month” renamed “Global Environment Month” 1991 · “One Person, One Tree” campaign initiated to reduce waste of paper resources (completed at end of 1992) · “Guiding Principles at Toyota Motor Corporation” adopted · Toyota Action Plan for Global Environment (known as the Toyota Earth Charter) adopted
1992
· Toyota Environment Committee established · Takaoka Plant acquired ISO 14001 certification · Tsutsumi Plant acquired ISO 14001 certification · “Toyota 2005 Vision” announced
1996
· “Toyota Environmental Action Plan” established · “Guiding Principles at Toyota Motor Corporation” revised · LCA Subcommittee established
1997
· Motomachi Plant and Tahara Plant acquired ISO 14001 certification · Environmental Affairs Division established · ISO 14001 certification acquired in development and design areas · Toyota Environmental Pocketbook distributed to all employees to develop employee awareness of environmental issues
1998
· Toyota published its first Environmental Report · A computation model and a database for LCA evaluation software built 1999 · Toyota began including environmental specifications in brochures for all new products and products that undergo complete redesign · Second Action Plan Goals(FY2000 Goals) Achieved · The Toyota Environmental Textbook was distributed not only within the company but also to affiliated companies in Japan and overseas.
2000
· LCA Implemented at the Vehicle Development Stage · Action in Accordance with Third Toyota Environmental Action Plan Started and First Year Goals Achieved
2001
· “Customer Effects” and “Eco-efficiency” Calculated in Addition to Environmental Costs and Economic Effects
2003 · The Toyota Environmental Action Plan Interim Review 2004 · Eco-efficiency as indicated by CO2 has improved 60% over 14 years 2005 · Toyota created its Fourth Toyota Environmental Action Plan
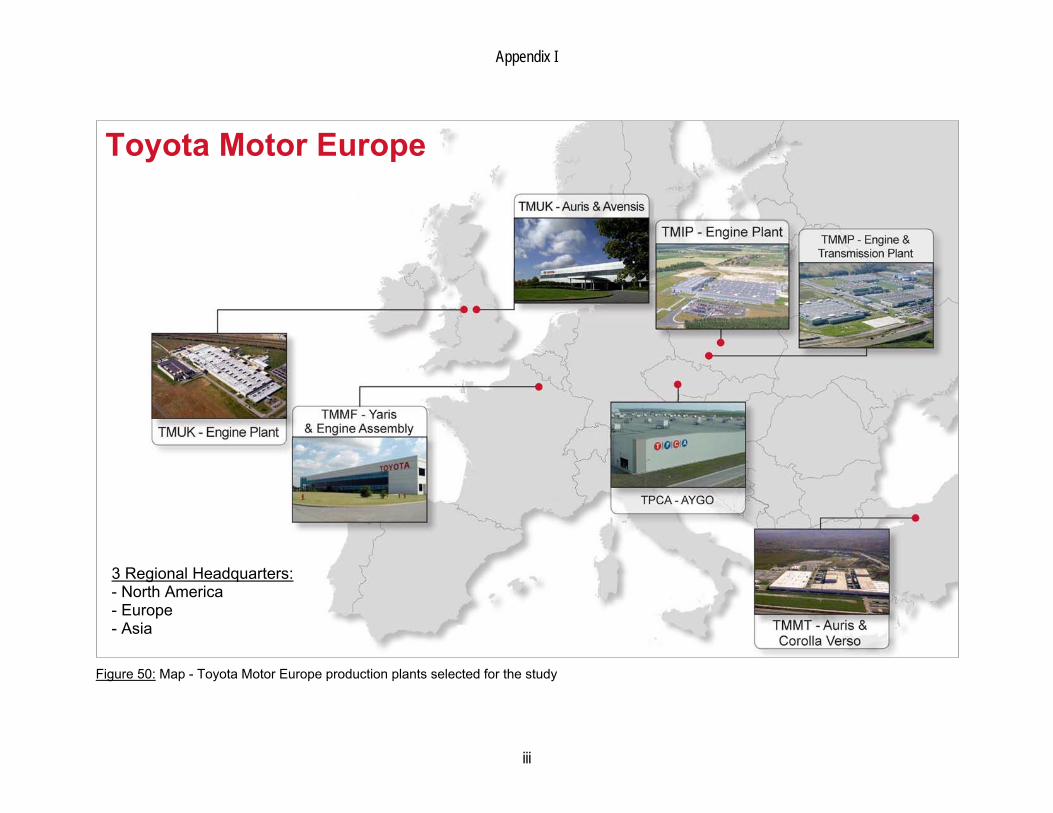
Appendix I
iii
Figure 50: Map - Toyota Motor Europe production plants selected for the study
Toyota Motor Europe
3 Regional Headquarters: - North America - Europe - Asia

Appendix I
iv
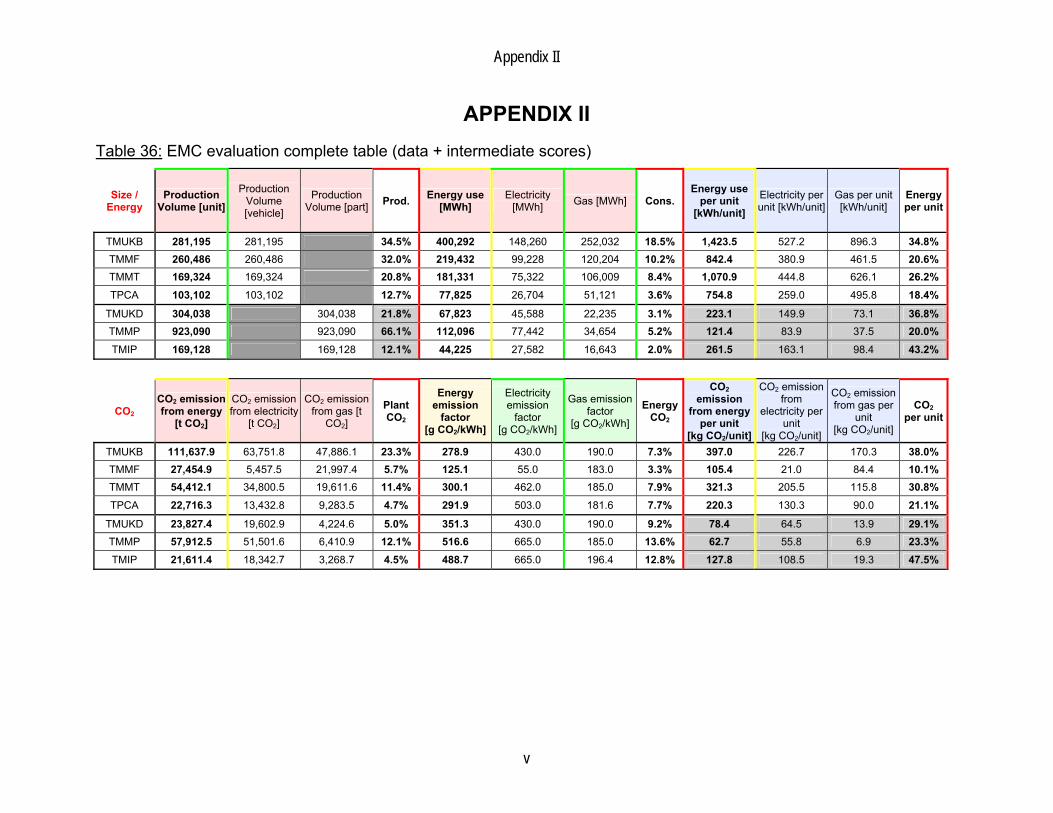
Appendix II
v
APPENDIX II Table 36: EMC evaluation complete table (data + intermediate scores)
Size / Energy
Production Volume [unit]
Production Volume [vehicle]
Production Volume [part] Prod. Energy use
[MWh] Electricity
[MWh] Gas [MWh] Cons. Energy use
per unit [kWh/unit]
Electricity per unit [kWh/unit]
Gas per unit [kWh/unit]
Energy per unit
TMUKB 281,195 281,195 34.5% 400,292 148,260 252,032 18.5% 1,423.5 527.2 896.3 34.8% TMMF 260,486 260,486 32.0% 219,432 99,228 120,204 10.2% 842.4 380.9 461.5 20.6% TMMT 169,324 169,324 20.8% 181,331 75,322 106,009 8.4% 1,070.9 444.8 626.1 26.2% TPCA 103,102 103,102 12.7% 77,825 26,704 51,121 3.6% 754.8 259.0 495.8 18.4%
TMUKD 304,038 304,038 21.8% 67,823 45,588 22,235 3.1% 223.1 149.9 73.1 36.8% TMMP 923,090 923,090 66.1% 112,096 77,442 34,654 5.2% 121.4 83.9 37.5 20.0% TMIP 169,128 169,128 12.1% 44,225 27,582 16,643 2.0% 261.5 163.1 98.4 43.2%
CO2 CO2 emission from energy
[t CO2]
CO2 emission from electricity
[t CO2]
CO2 emission from gas [t
CO2]
Plant CO2
Energy emission
factor [g CO2/kWh]
Electricity emission
factor [g CO2/kWh]
Gas emission factor
[g CO2/kWh]
Energy CO2
CO2 emission
from energy per unit
[kg CO2/unit]
CO2 emission from
electricity per unit
[kg CO2/unit]
CO2 emission from gas per
unit [kg CO2/unit]
CO2 per unit
TMUKB 111,637.9 63,751.8 47,886.1 23.3% 278.9 430.0 190.0 7.3% 397.0 226.7 170.3 38.0% TMMF 27,454.9 5,457.5 21,997.4 5.7% 125.1 55.0 183.0 3.3% 105.4 21.0 84.4 10.1% TMMT 54,412.1 34,800.5 19,611.6 11.4% 300.1 462.0 185.0 7.9% 321.3 205.5 115.8 30.8% TPCA 22,716.3 13,432.8 9,283.5 4.7% 291.9 503.0 181.6 7.7% 220.3 130.3 90.0 21.1%
TMUKD 23,827.4 19,602.9 4,224.6 5.0% 351.3 430.0 190.0 9.2% 78.4 64.5 13.9 29.1% TMMP 57,912.5 51,501.6 6,410.9 12.1% 516.6 665.0 185.0 13.6% 62.7 55.8 6.9 23.3% TMIP 21,611.4 18,342.7 3,268.7 4.5% 488.7 665.0 196.4 12.8% 127.8 108.5 19.3 47.5%
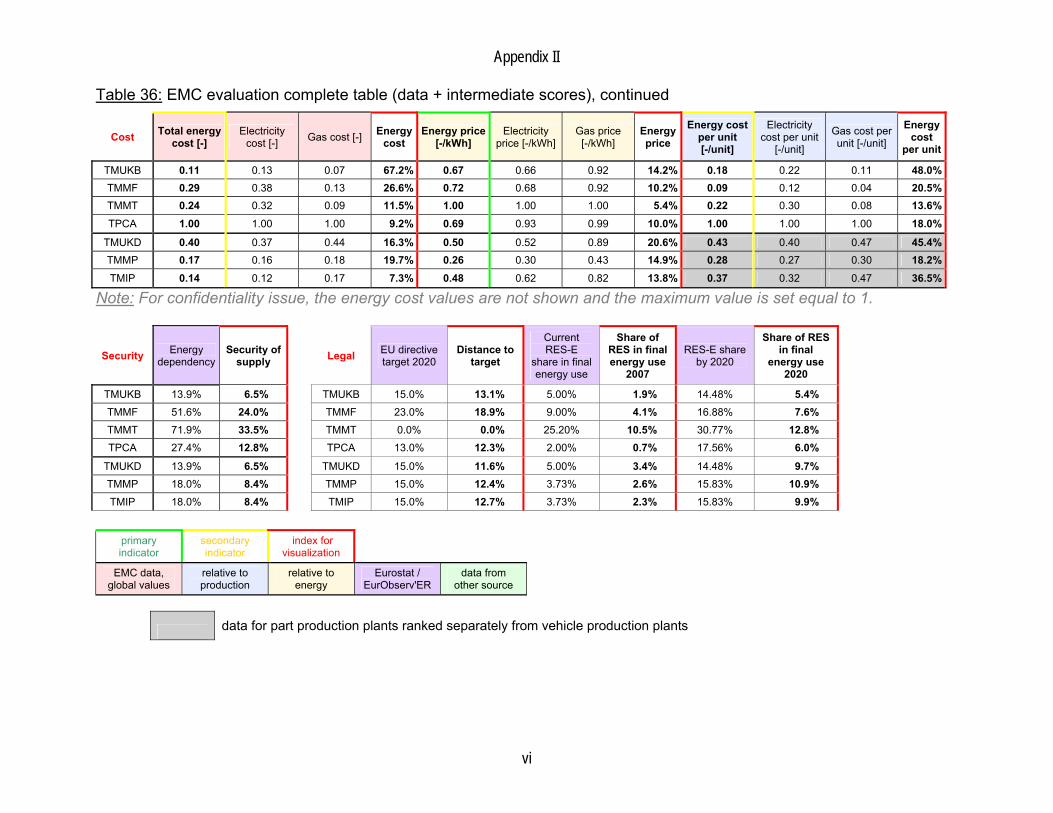
Appendix II
vi
Table 36: EMC evaluation complete table (data + intermediate scores), continued
Cost Total energy cost [-]
Electricity cost [-] Gas cost [-] Energy
cost Energy price
[-/kWh] Electricity
price [-/kWh] Gas price
[-/kWh] Energy price
Energy cost per unit [-/unit]
Electricity cost per unit
[-/unit]
Gas cost per unit [-/unit]
Energy cost
per unit
TMUKB 0.11 0.13 0.07 67.2% 0.67 0.66 0.92 14.2% 0.18 0.22 0.11 48.0%TMMF 0.29 0.38 0.13 26.6% 0.72 0.68 0.92 10.2% 0.09 0.12 0.04 20.5%TMMT 0.24 0.32 0.09 11.5% 1.00 1.00 1.00 5.4% 0.22 0.30 0.08 13.6%TPCA 1.00 1.00 1.00 9.2% 0.69 0.93 0.99 10.0% 1.00 1.00 1.00 18.0%
TMUKD 0.40 0.37 0.44 16.3% 0.50 0.52 0.89 20.6% 0.43 0.40 0.47 45.4%TMMP 0.17 0.16 0.18 19.7% 0.26 0.30 0.43 14.9% 0.28 0.27 0.30 18.2%TMIP 0.14 0.12 0.17 7.3% 0.48 0.62 0.82 13.8% 0.37 0.32 0.47 36.5%
Note: For confidentiality issue, the energy cost values are not shown and the maximum value is set equal to 1.
Security Energy dependency
Security of supply
Legal EU directive target 2020
Distance to target
Current RES-E
share in final energy use
Share of RES in final energy use
2007
RES-E share by 2020
Share of RES in final
energy use 2020
TMUKB 13.9% 6.5% TMUKB 15.0% 13.1% 5.00% 1.9% 14.48% 5.4% TMMF 51.6% 24.0% TMMF 23.0% 18.9% 9.00% 4.1% 16.88% 7.6% TMMT 71.9% 33.5% TMMT 0.0% 0.0% 25.20% 10.5% 30.77% 12.8% TPCA 27.4% 12.8% TPCA 13.0% 12.3% 2.00% 0.7% 17.56% 6.0%
TMUKD 13.9% 6.5% TMUKD 15.0% 11.6% 5.00% 3.4% 14.48% 9.7% TMMP 18.0% 8.4% TMMP 15.0% 12.4% 3.73% 2.6% 15.83% 10.9% TMIP 18.0% 8.4% TMIP 15.0% 12.7% 3.73% 2.3% 15.83% 9.9%
primary indicator
secondary indicator
index for visualization
EMC data, global values
relative to production
relative to energy
Eurostat / EurObserv'ER
data from other source
data for part production plants ranked separately from vehicle production plants
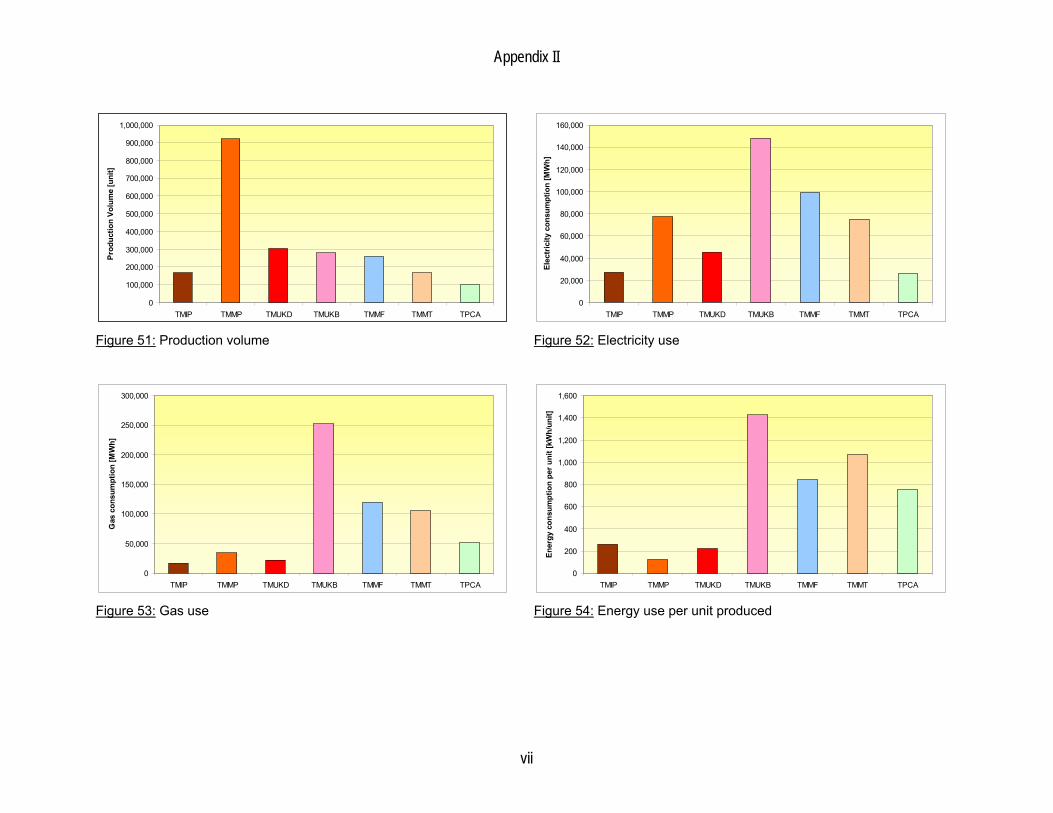
Appendix II
vii
0
100,000
200,000
300,000
400,000
500,000
600,000
700,000
800,000
900,000
1,000,000
TMIP TMMP TMUKD TMUKB TMMF TMMT TPCA
Prod
uctio
n Vo
lum
e [u
nit]
Figure 51: Production volume
0
20,000
40,000
60,000
80,000
100,000
120,000
140,000
160,000
TMIP TMMP TMUKD TMUKB TMMF TMMT TPCA
Elec
tric
ity c
onsu
mpt
ion
[MW
h]
Figure 52: Electricity use
0
50,000
100,000
150,000
200,000
250,000
300,000
TMIP TMMP TMUKD TMUKB TMMF TMMT TPCA
Gas
con
sum
ptio
n [M
Wh]
Figure 53: Gas use
0
200
400
600
800
1,000
1,200
1,400
1,600
TMIP TMMP TMUKD TMUKB TMMF TMMT TPCA
Ener
gy c
onsu
mpt
ion
per u
nit [
kWh/
unit]
Figure 54: Energy use per unit produced
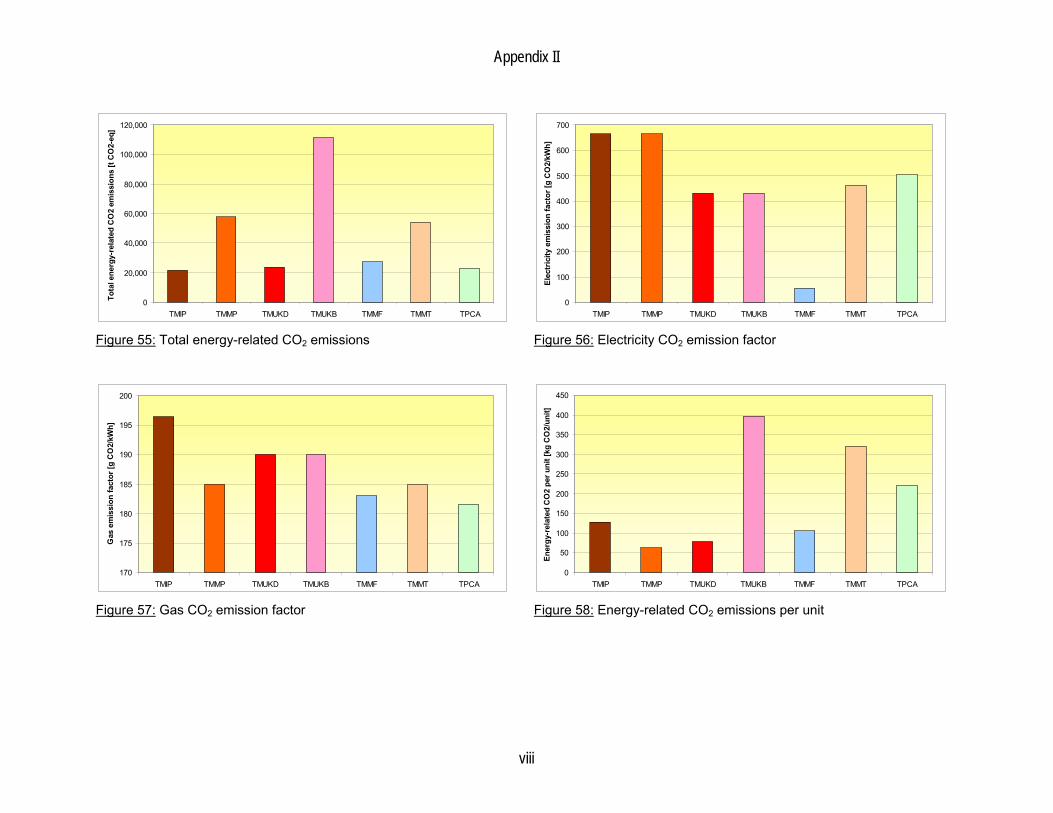
Appendix II
viii
0
20,000
40,000
60,000
80,000
100,000
120,000
TMIP TMMP TMUKD TMUKB TMMF TMMT TPCA
Tota
l ene
rgy-
rela
ted
CO
2 em
issi
ons
[t C
O2-
eq]
Figure 55: Total energy-related CO2 emissions
0
100
200
300
400
500
600
700
TMIP TMMP TMUKD TMUKB TMMF TMMT TPCA
Elec
tric
ity e
mis
sion
fact
or [g
CO
2/kW
h]
Figure 56: Electricity CO2 emission factor
170
175
180
185
190
195
200
TMIP TMMP TMUKD TMUKB TMMF TMMT TPCA
Gas
em
issi
on fa
ctor
[g C
O2/
kWh]
Figure 57: Gas CO2 emission factor
0
50
100
150
200
250
300
350
400
450
TMIP TMMP TMUKD TMUKB TMMF TMMT TPCA
Ener
gy-r
elat
ed C
O2
per u
nit [
kg C
O2/
unit]
Figure 58: Energy-related CO2 emissions per unit
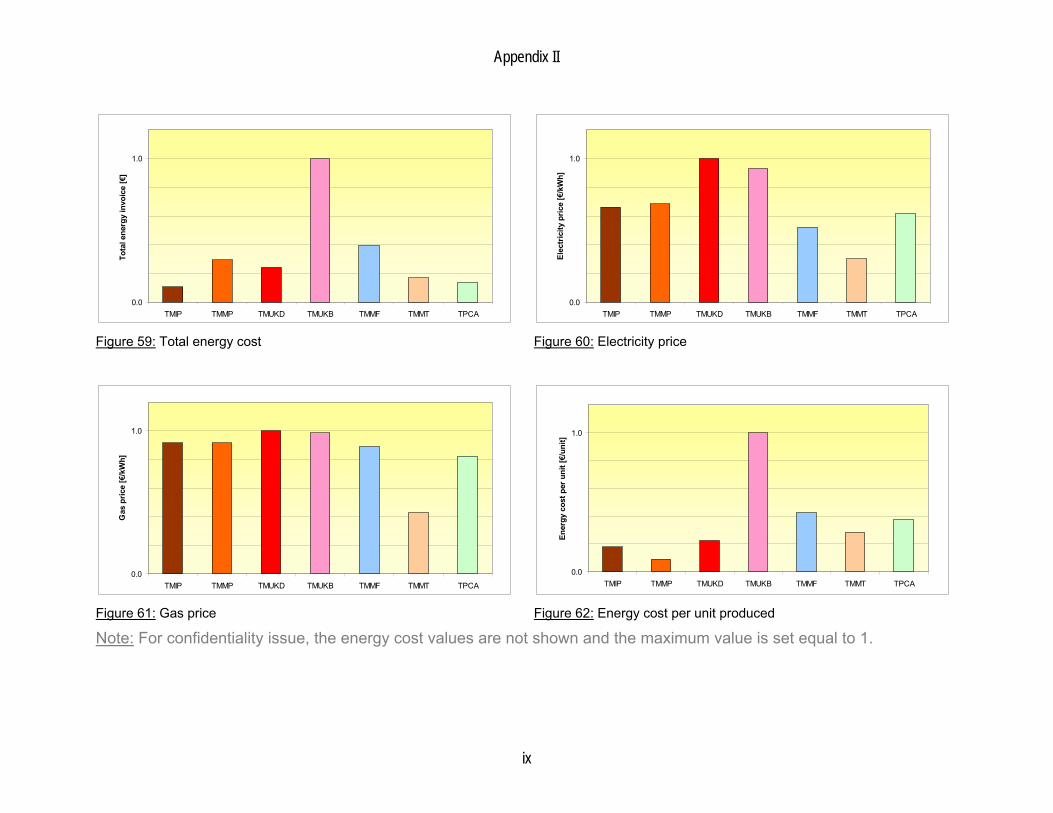
Appendix II
ix
0.0
1.0
TMIP TMMP TMUKD TMUKB TMMF TMMT TPCA
Tota
l ene
rgy
invo
ice
[€]
Figure 59: Total energy cost
0.0
1.0
TMIP TMMP TMUKD TMUKB TMMF TMMT TPCA
Elec
tric
ity p
rice
[€/k
Wh]
Figure 60: Electricity price
0.0
1.0
TMIP TMMP TMUKD TMUKB TMMF TMMT TPCA
Gas
pric
e [€
/kW
h]
Figure 61: Gas price
0.0
1.0
TMIP TMMP TMUKD TMUKB TMMF TMMT TPCA
Ener
gy c
ost p
er u
nit [
€/un
it]
Figure 62: Energy cost per unit produced
Note: For confidentiality issue, the energy cost values are not shown and the maximum value is set equal to 1.
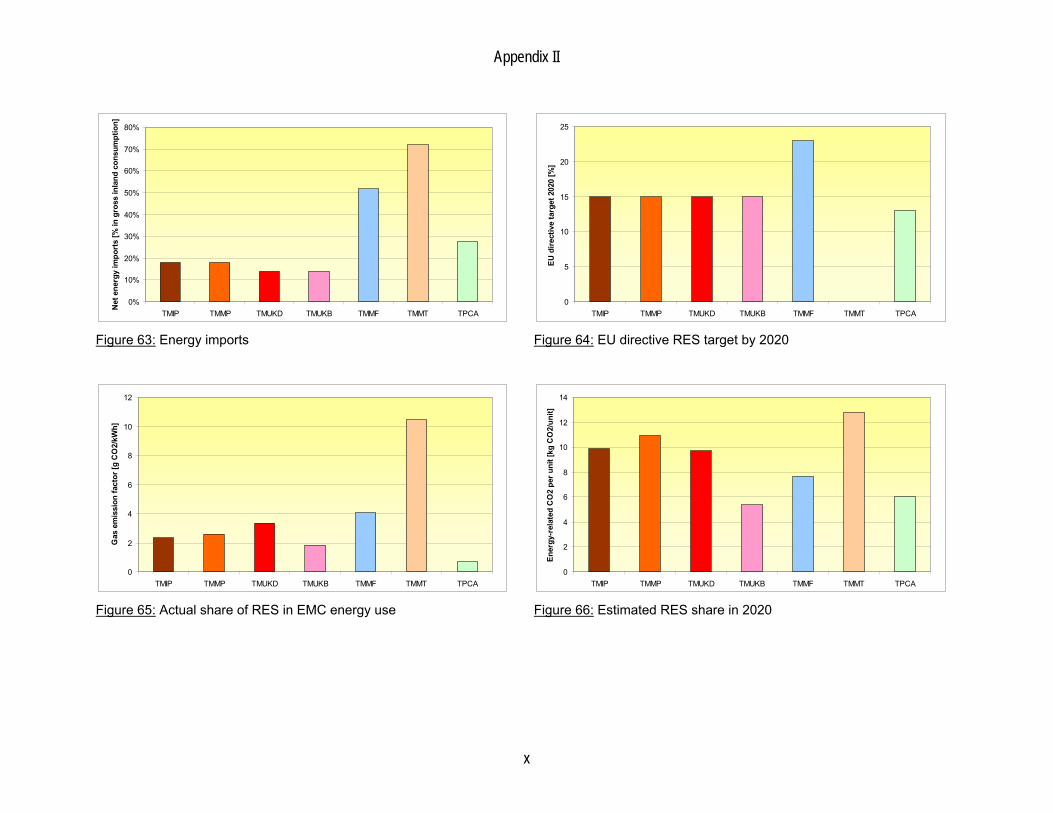
Appendix II
x
0%
10%
20%
30%
40%
50%
60%
70%
80%
TMIP TMMP TMUKD TMUKB TMMF TMMT TPCA
Net
ene
rgy
impo
rts
[% in
gro
ss in
land
con
sum
ptio
n]
Figure 63: Energy imports
0
5
10
15
20
25
TMIP TMMP TMUKD TMUKB TMMF TMMT TPCA
EU d
irect
ive
targ
et 2
020
[%]
Figure 64: EU directive RES target by 2020
0
2
4
6
8
10
12
TMIP TMMP TMUKD TMUKB TMMF TMMT TPCA
Gas
em
issi
on fa
ctor
[g C
O2/
kWh]
Figure 65: Actual share of RES in EMC energy use
0
2
4
6
8
10
12
14
TMIP TMMP TMUKD TMUKB TMMF TMMT TPCA
Ener
gy-r
elat
ed C
O2
per u
nit [
kg C
O2/
unit]
Figure 66: Estimated RES share in 2020