Embed Size (px)
Citation preview
Achieving
Food & Nutrient Security
to Fight Against Double Burden of
Malnutrition in Indonesia
Elviyanti , MSc.
World Food Programme, Indonesia
Indonesia 237 million population
• Emerging low middle
income country
• G20 member
• The largest ASEAN
economy
• One of the Asia’s most
vibrant and
decentralized
democracies
• Largest Muslim
population
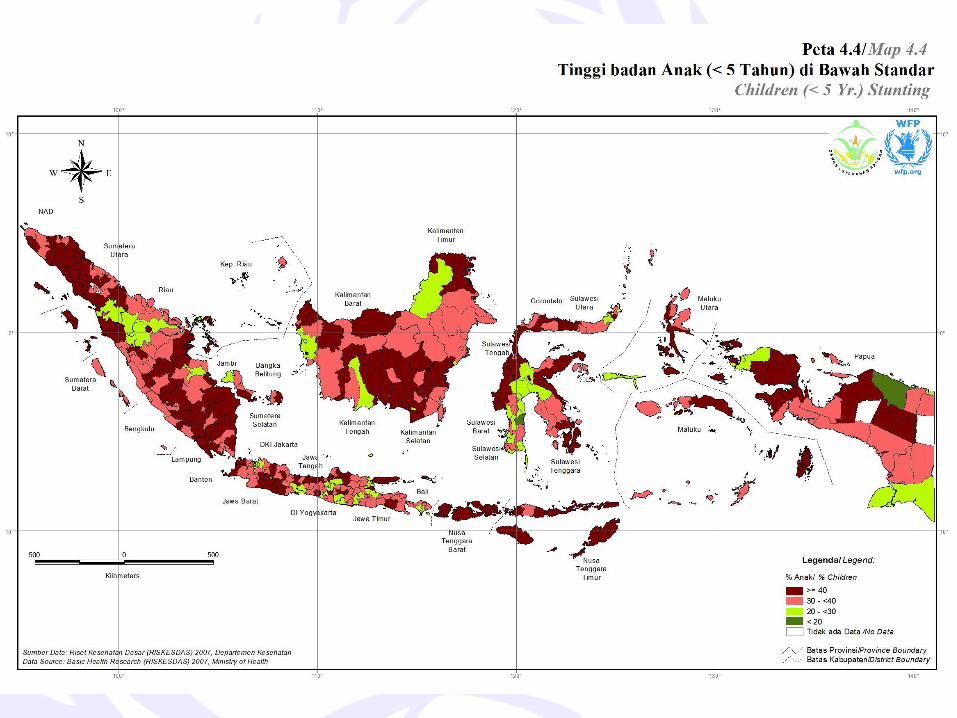
• Large nutritional
disparities prevail,
particularly in the eastern
part of the country
– Underweight 18%
– Stunting 35.6%
– Wasting 14.3%
• 25 millions Indonesian
are food insecure
• Prone to recurrent natural
disaster and increasingly
impacted by climate
change
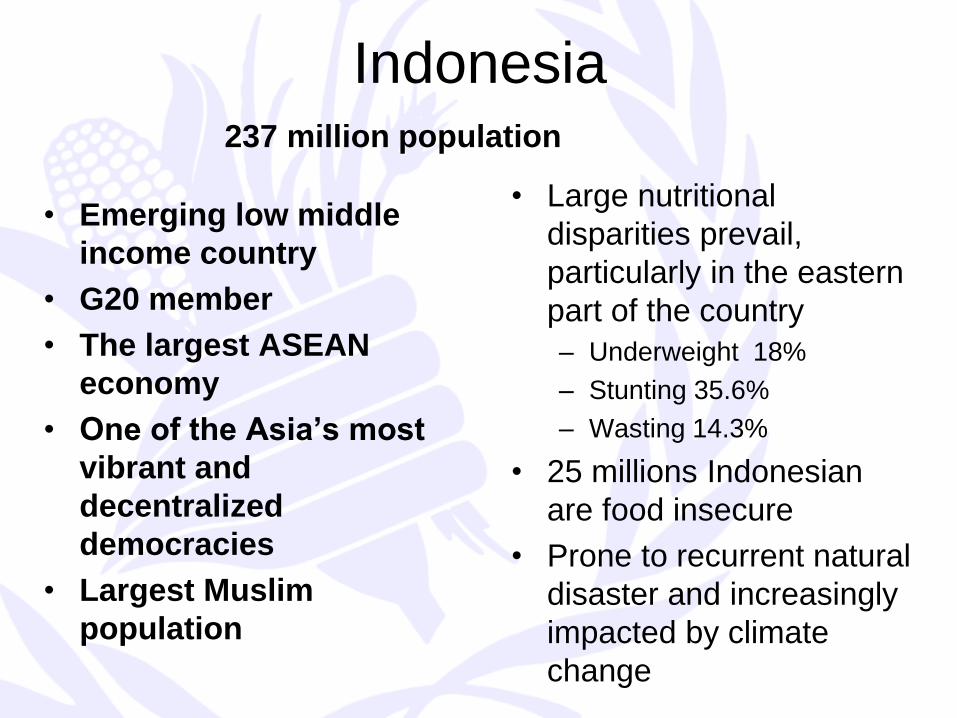
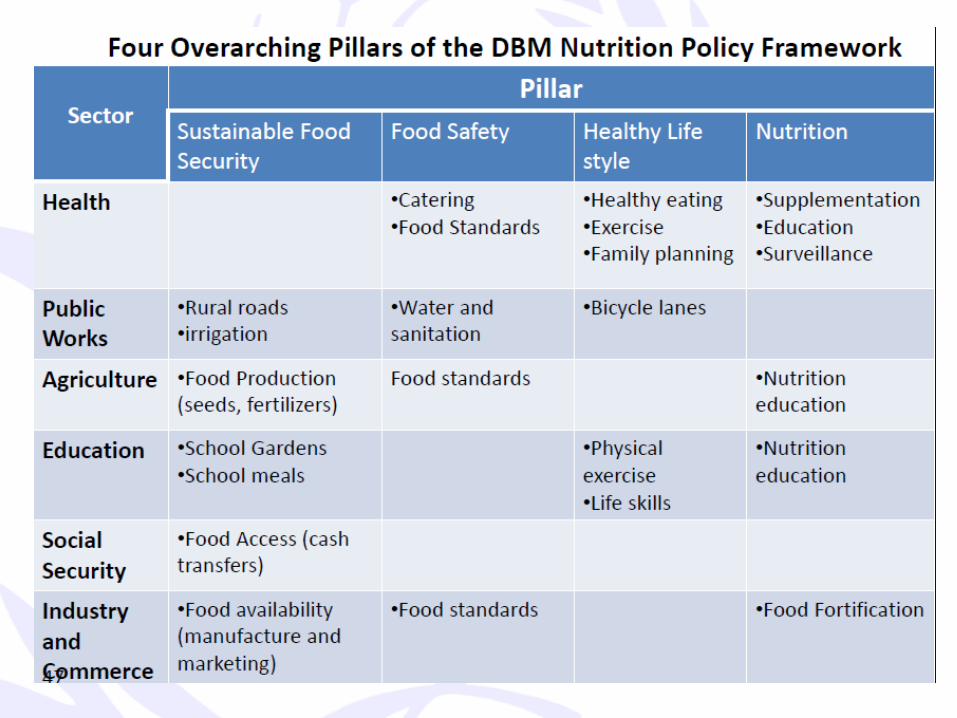
Food and Nutrition Security
Conceptual Framework
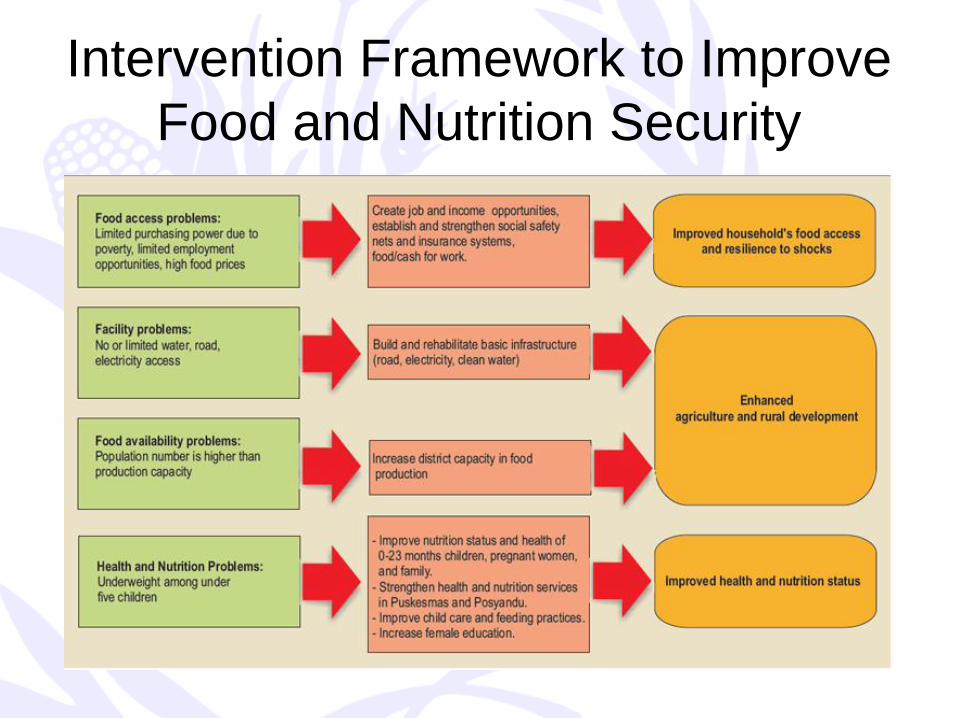
Intervention Framework to Improve
Food and Nutrition Security
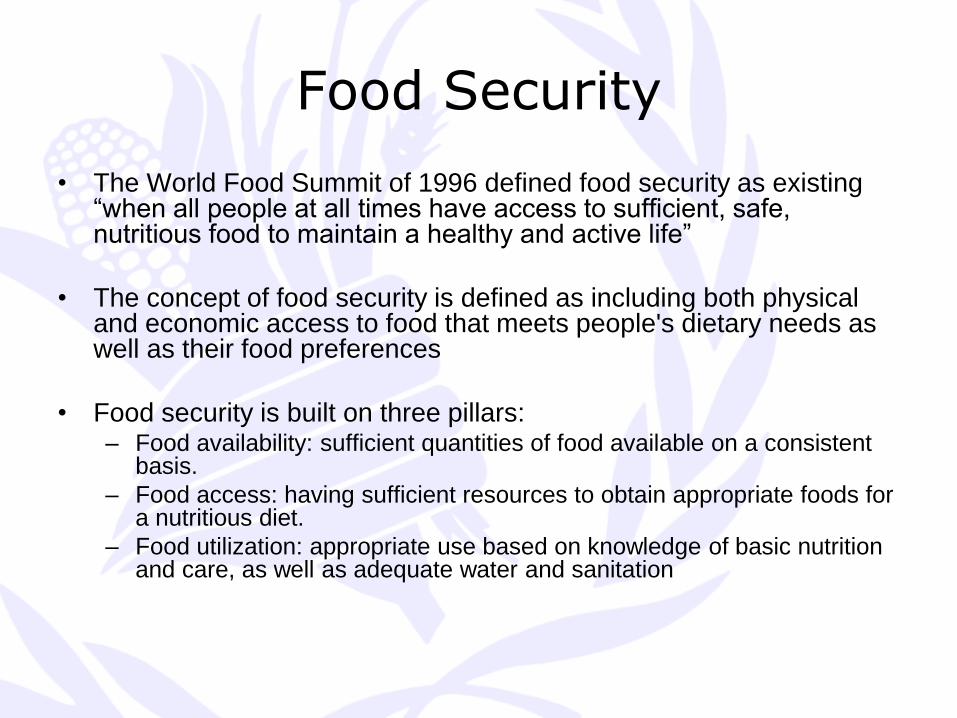
Food Security
• The World Food Summit of 1996 defined food security as existing “when all people at all times have access to sufficient, safe, nutritious food to maintain a healthy and active life”
• The concept of food security is defined as including both physical and economic access to food that meets people's dietary needs as well as their food preferences
• Food security is built on three pillars: – Food availability: sufficient quantities of food available on a consistent
basis.
– Food access: having sufficient resources to obtain appropriate foods for a nutritious diet.
– Food utilization: appropriate use based on knowledge of basic nutrition and care, as well as adequate water and sanitation
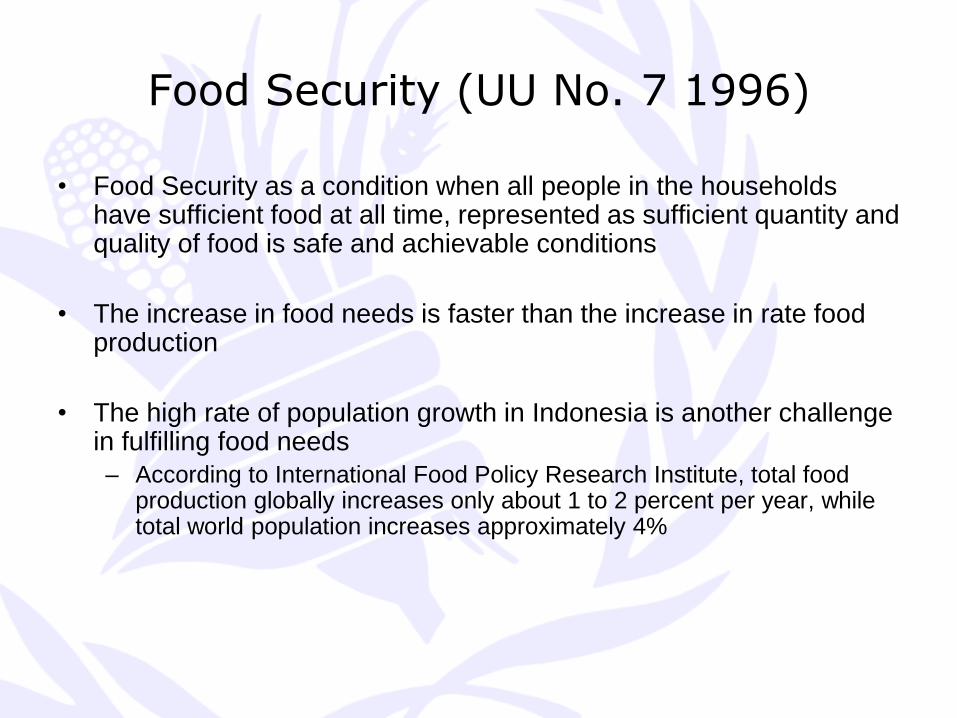
Food Security (UU No. 7 1996)
• Food Security as a condition when all people in the households have sufficient food at all time, represented as sufficient quantity and quality of food is safe and achievable conditions
• The increase in food needs is faster than the increase in rate food production
• The high rate of population growth in Indonesia is another challenge in fulfilling food needs
– According to International Food Policy Research Institute, total food production globally increases only about 1 to 2 percent per year, while total world population increases approximately 4%
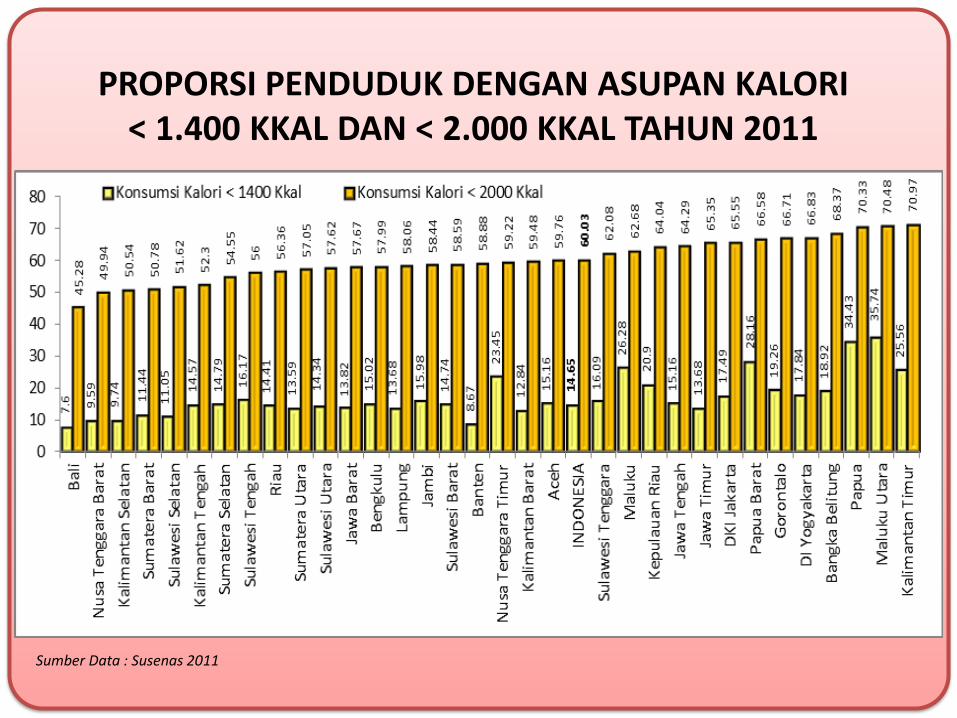
PROPORSI PENDUDUK DENGAN ASUPAN KALORI < 1.400 KKAL DAN < 2.000 KKAL TAHUN 2011
Sumber Data : Susenas 2011
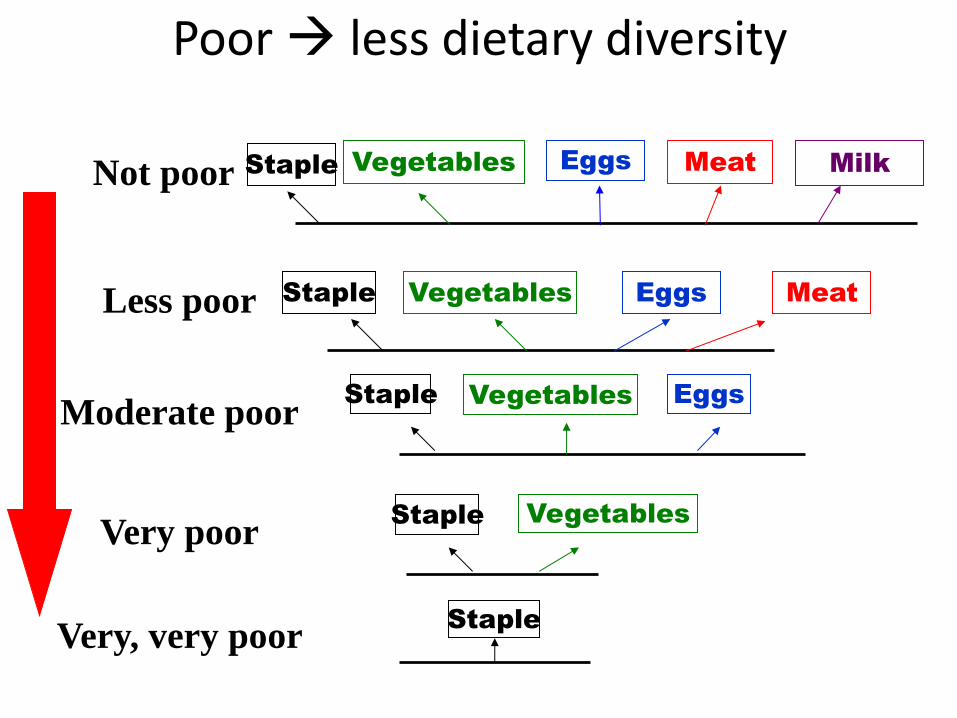
Poor less dietary diversity
Very, very poor
Less poor
Not poor
Moderate poor
Very poor
Staple
Staple Vegetables
Staple
Staple
Vegetables Eggs
Vegetables Eggs Meat
Staple Vegetables Eggs Meat Milk
41
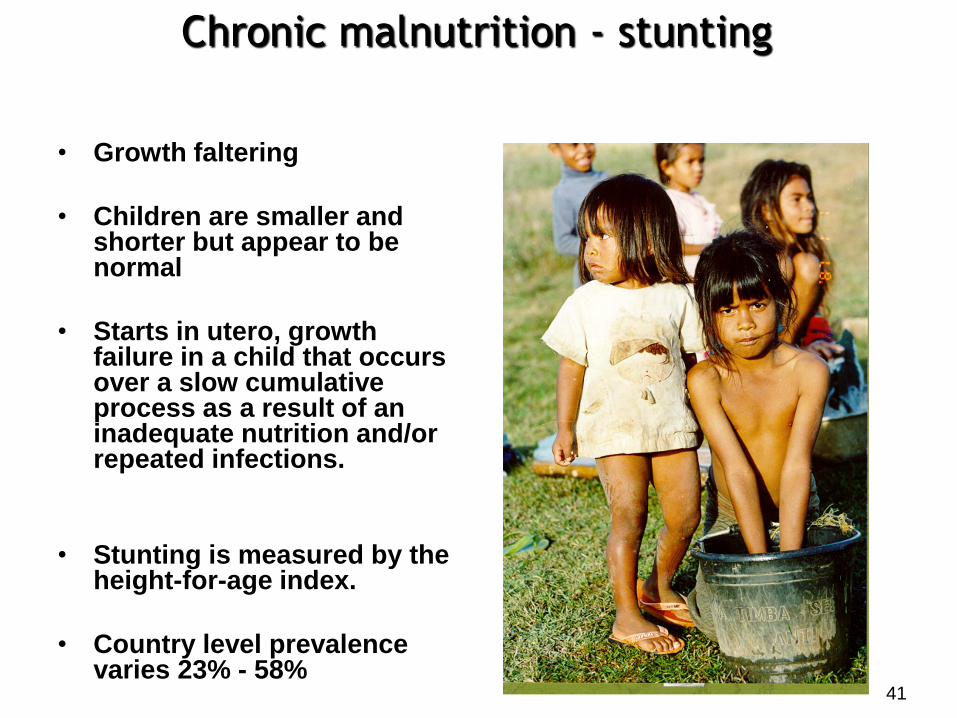
Chronic malnutrition - stunting
• Growth faltering
• Children are smaller and shorter but appear to be normal
• Starts in utero, growth failure in a child that occurs over a slow cumulative process as a result of an inadequate nutrition and/or repeated infections.
• Stunting is measured by the height-for-age index.
• Country level prevalence varies 23% - 58%
41
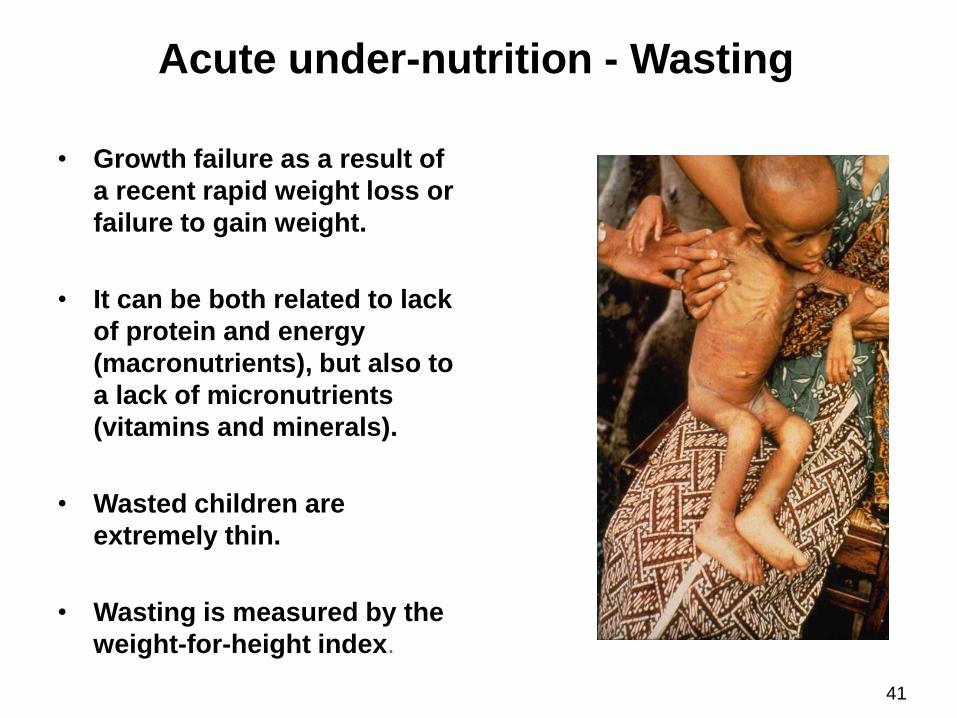
Acute under-nutrition - Wasting
• Growth failure as a result of
a recent rapid weight loss or
failure to gain weight.
• It can be both related to lack
of protein and energy
(macronutrients), but also to
a lack of micronutrients
(vitamins and minerals).
• Wasted children are
extremely thin.
• Wasting is measured by the
weight-for-height index.
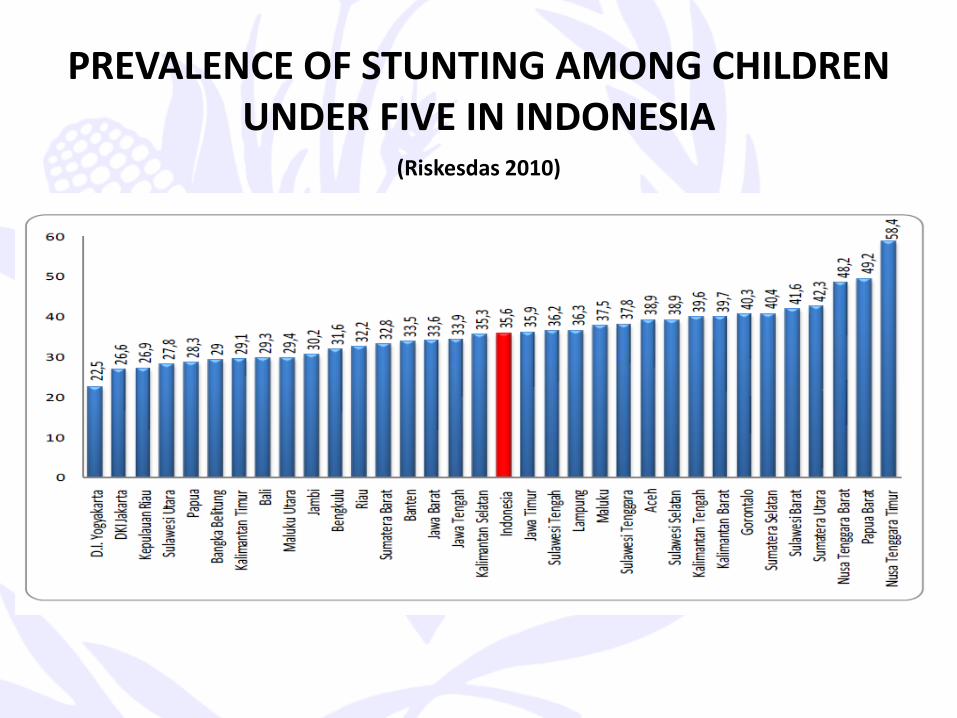
PREVALENCE OF STUNTING AMONG CHILDREN UNDER FIVE IN INDONESIA
(Riskesdas 2010)
Sumber : UNICEF 2009
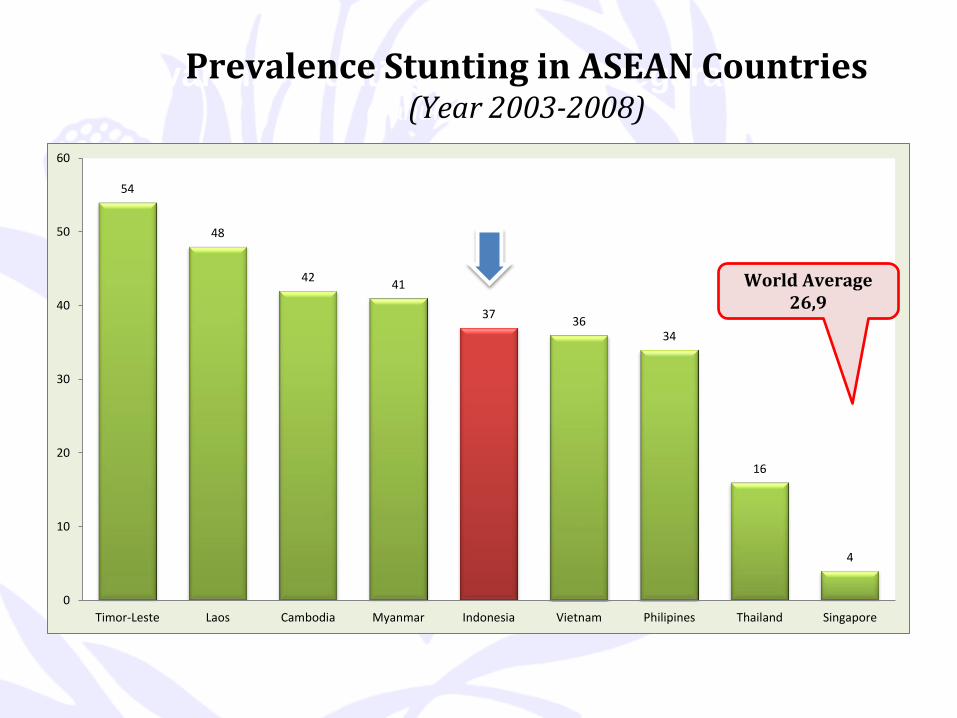
Prevalensi Stunting di Negara-negara ASEAN (Tahun 2003-2008)
Prevalence Stunting in ASEAN Countries (Year 2003-2008)
54
48
42 41
37 36
34
16
4
0
10
20
30
40
50
60
Timor-Leste Laos Cambodia Myanmar Indonesia Vietnam Philipines Thailand Singapore
World Average 26,9
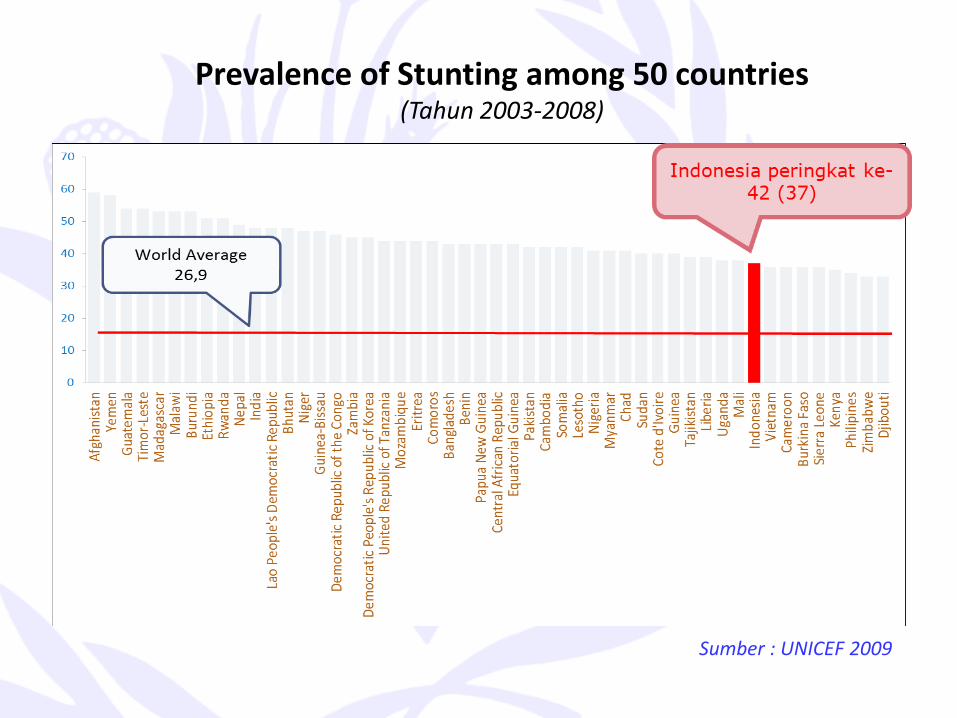
Sumber : UNICEF 2009
Prevalence of Stunting among 50 countries (Tahun 2003-2008)
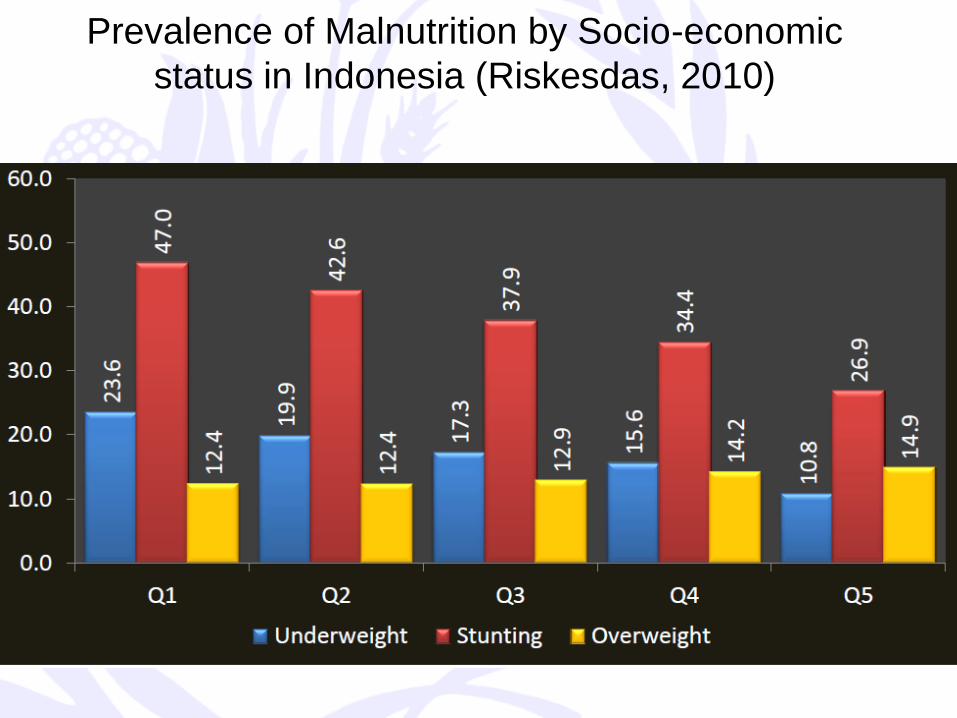
Prevalence of Malnutrition by Socio-economic
status in Indonesia (Riskesdas, 2010)
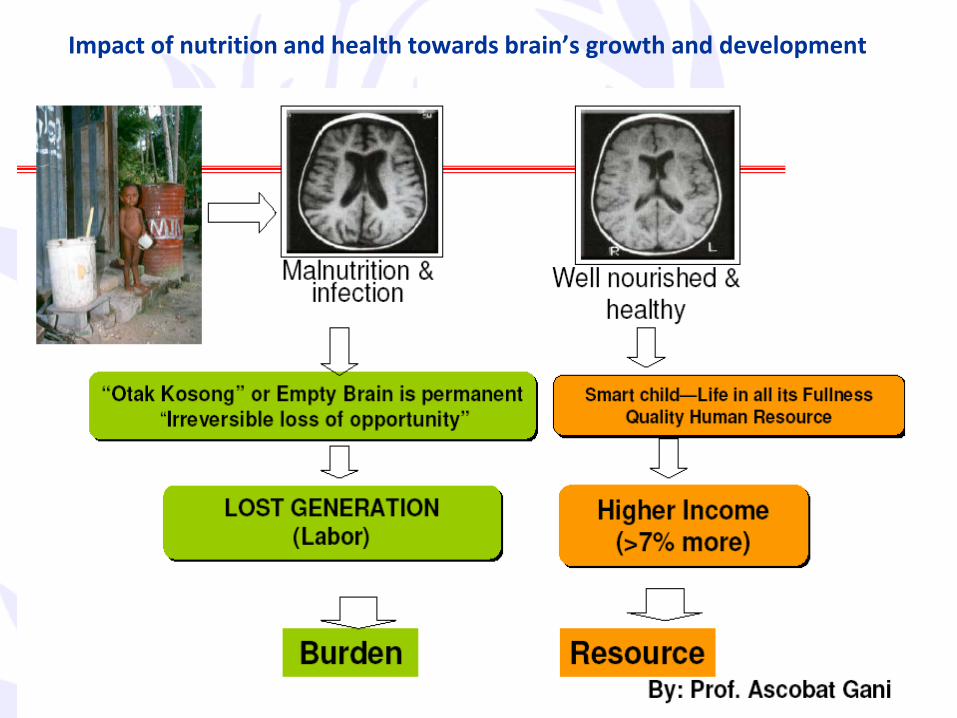
Impact of nutrition and health towards brain’s growth and development
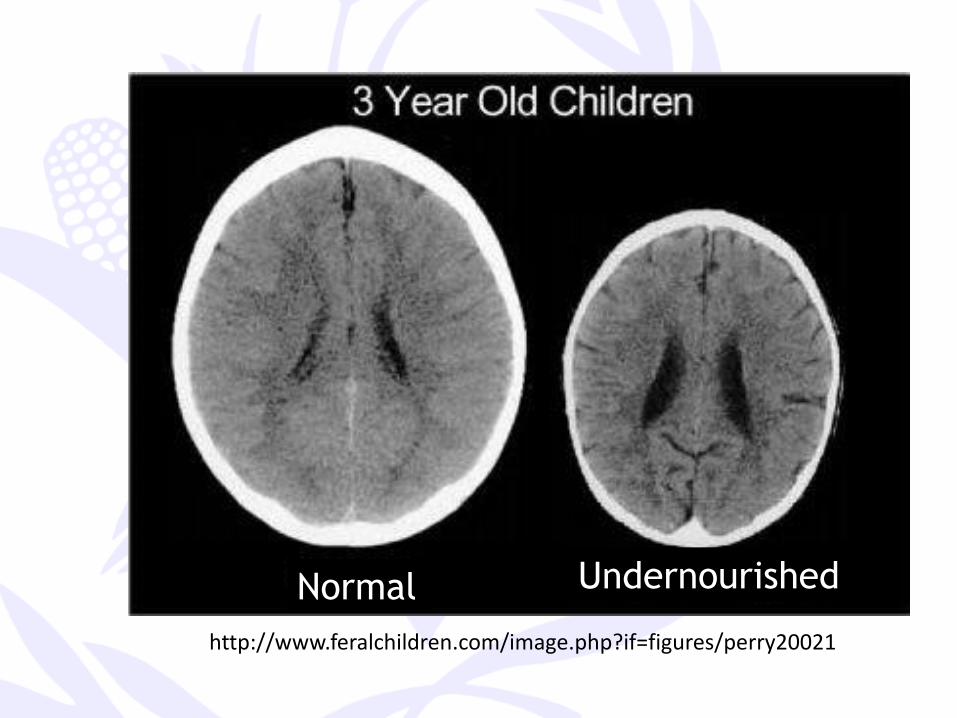
http://www.feralchildren.com/image.php?if=figures/perry20021
Normal Undernourished
19
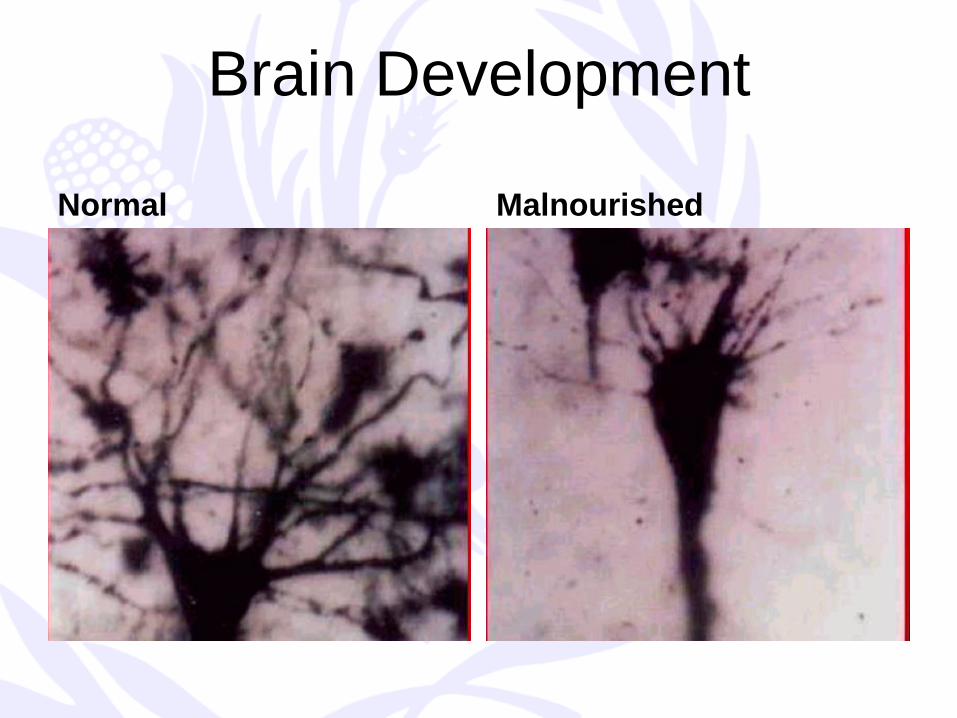
Brain Development
Normal Malnourished
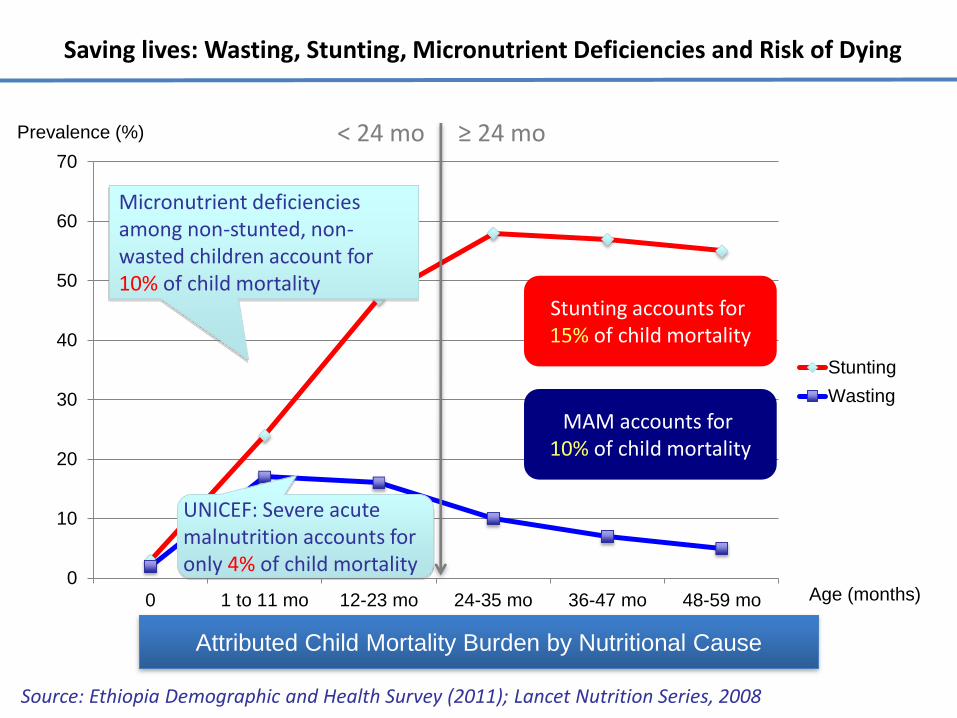
Saving lives: Wasting, Stunting, Micronutrient Deficiencies and Risk of Dying
0
10
20
30
40
50
60
70
0 1 to 11 mo 12-23 mo 24-35 mo 36-47 mo 48-59 mo
Stunting
Wasting
Source: Ethiopia Demographic and Health Survey (2011); Lancet Nutrition Series, 2008
Age (months)
Stunting accounts for 15% of child mortality
MAM accounts for 10% of child mortality
Micronutrient deficiencies among non-stunted, non-wasted children account for 10% of child mortality
UNICEF: Severe acute malnutrition accounts for only 4% of child mortality
≥ 24 mo < 24 mo Prevalence (%)
Attributed Child Mortality Burden by Nutritional Cause
22
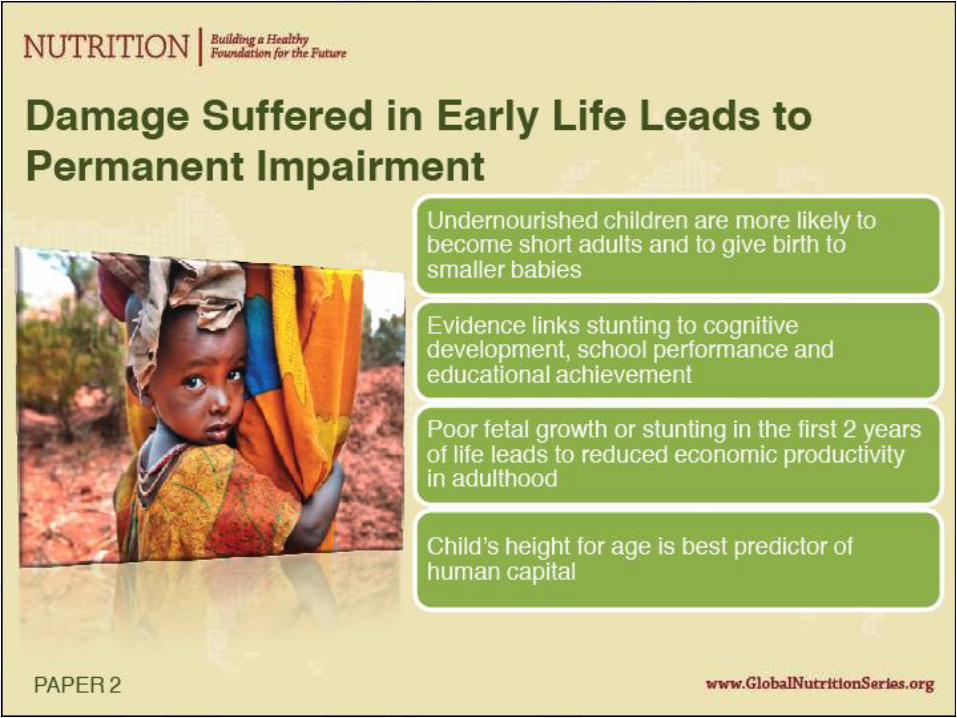
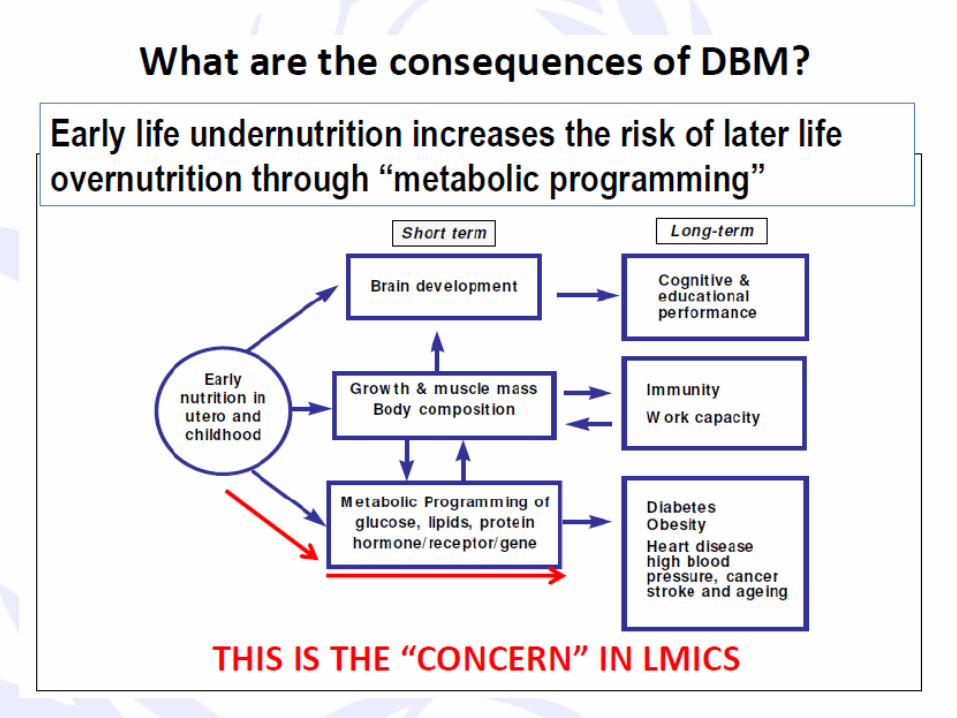
The Consequences of Stunting (Lancet 2008)
- 22 -
• Chronic Diseases: Children who are undernourished in the first 2 years of life and who put on weight rapidly later in childhood and in adolescence are at high risk of chronic diseases related to nutrition
• The window of prevention = the first 1000 days = from conception to 24 months
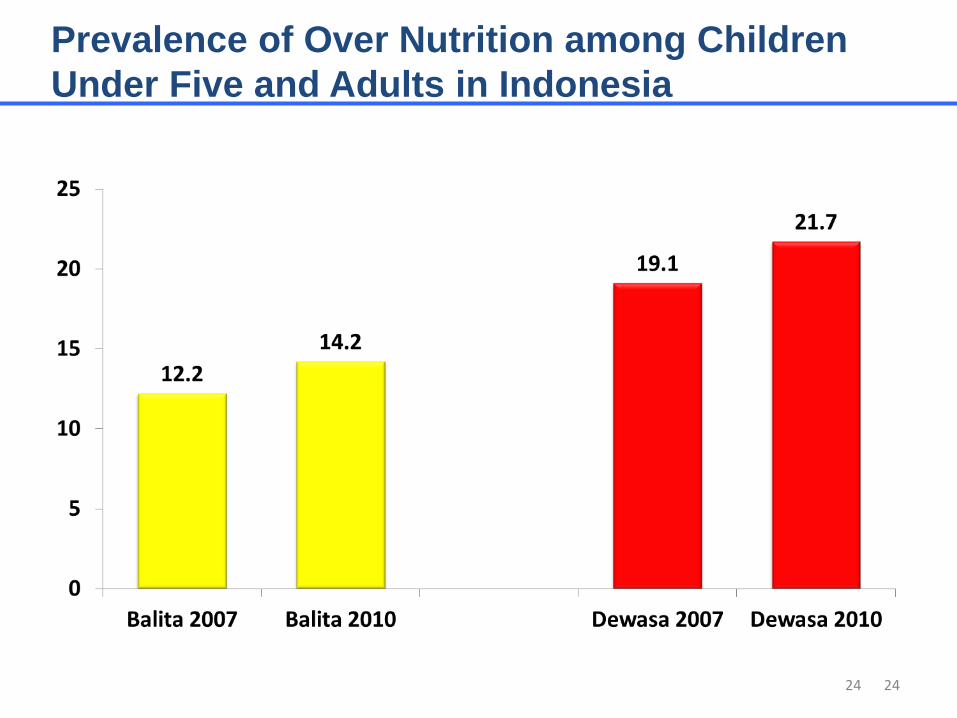
24
Prevalence of Over Nutrition among Children
Under Five and Adults in Indonesia
24
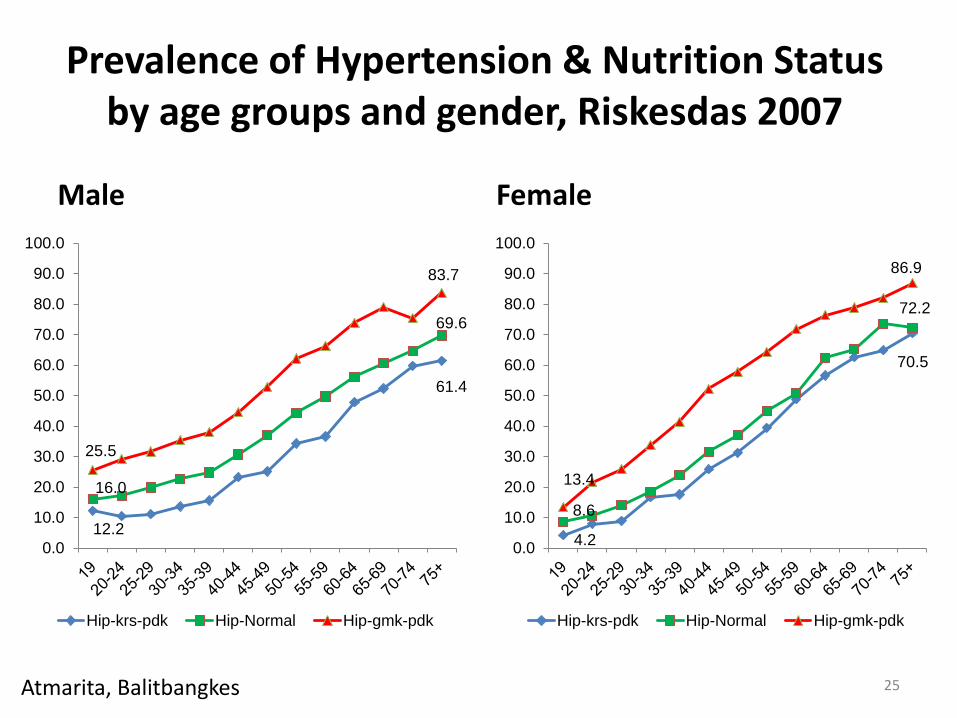
Prevalence of Hypertension & Nutrition Status by age groups and gender, Riskesdas 2007
Male
12.2
61.4
16.0
69.6
25.5
83.7
0.0
10.0
20.0
30.0
40.0
50.0
60.0
70.0
80.0
90.0
100.0
Hip-krs-pdk Hip-Normal Hip-gmk-pdk
Female
4.2
70.5
8.6
72.2
13.4
86.9
0.0
10.0
20.0
30.0
40.0
50.0
60.0
70.0
80.0
90.0
100.0
Hip-krs-pdk Hip-Normal Hip-gmk-pdk
Atmarita, Balitbangkes 25
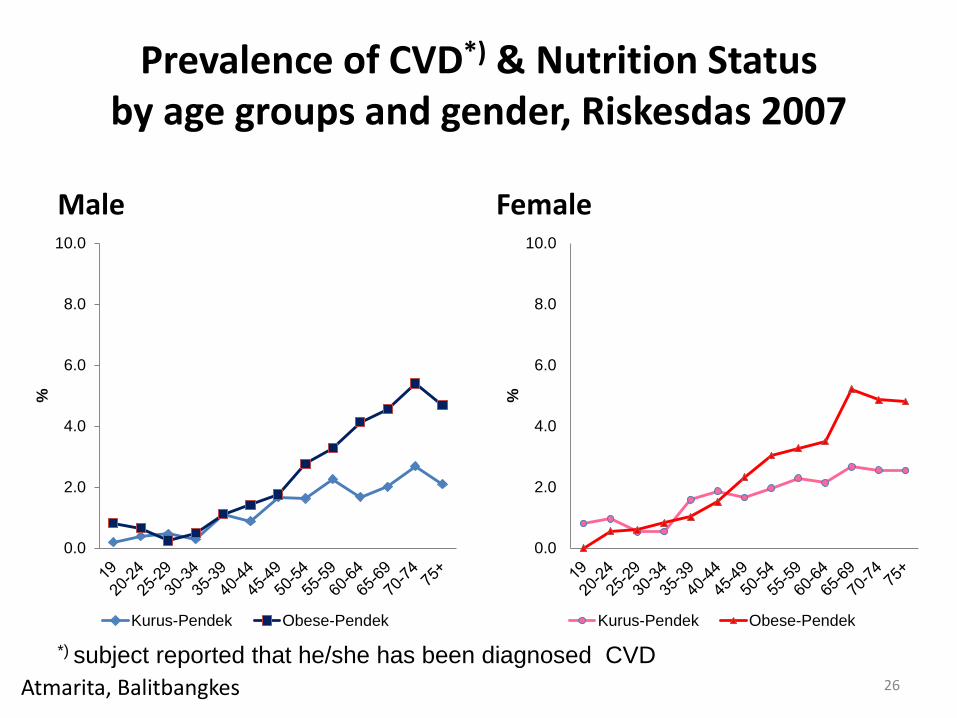
Prevalence of CVD*) & Nutrition Status by age groups and gender, Riskesdas 2007
Male
0.0
2.0
4.0
6.0
8.0
10.0
%
Kurus-Pendek Obese-Pendek
Female
0.0
2.0
4.0
6.0
8.0
10.0
%
Kurus-Pendek Obese-Pendek
Atmarita, Balitbangkes 26
*) subject reported that he/she has been diagnosed CVD
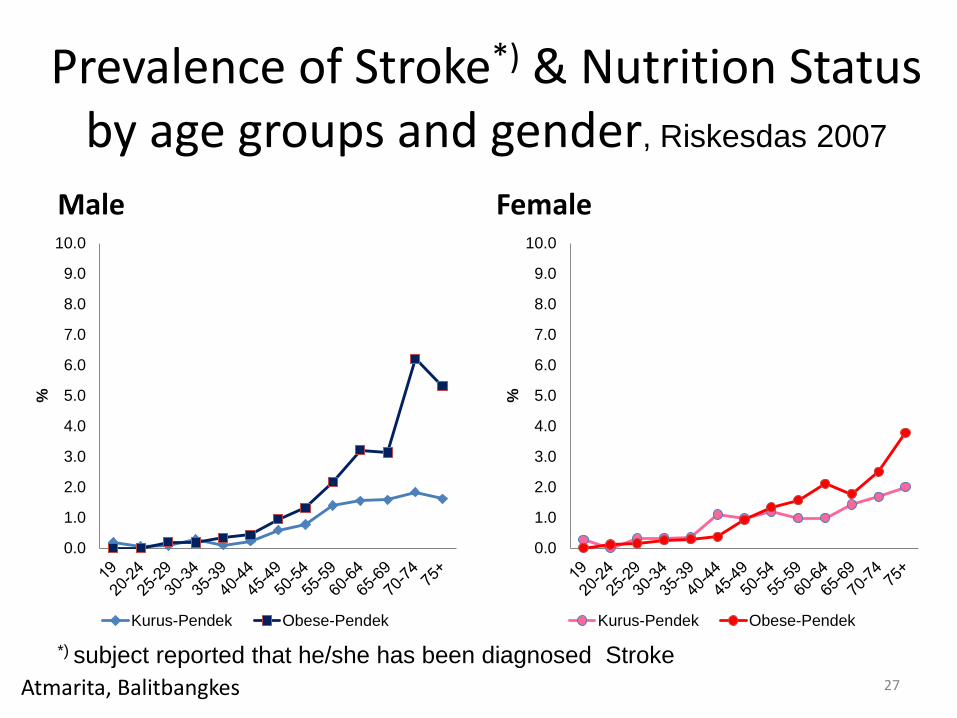
Prevalence of Stroke*) & Nutrition Status by age groups and gender, Riskesdas 2007
Male
0.0
1.0
2.0
3.0
4.0
5.0
6.0
7.0
8.0
9.0
10.0
%
Kurus-Pendek Obese-Pendek
Female
0.0
1.0
2.0
3.0
4.0
5.0
6.0
7.0
8.0
9.0
10.0
%
Kurus-Pendek Obese-Pendek
Atmarita, Balitbangkes 27
*) subject reported that he/she has been diagnosed Stroke
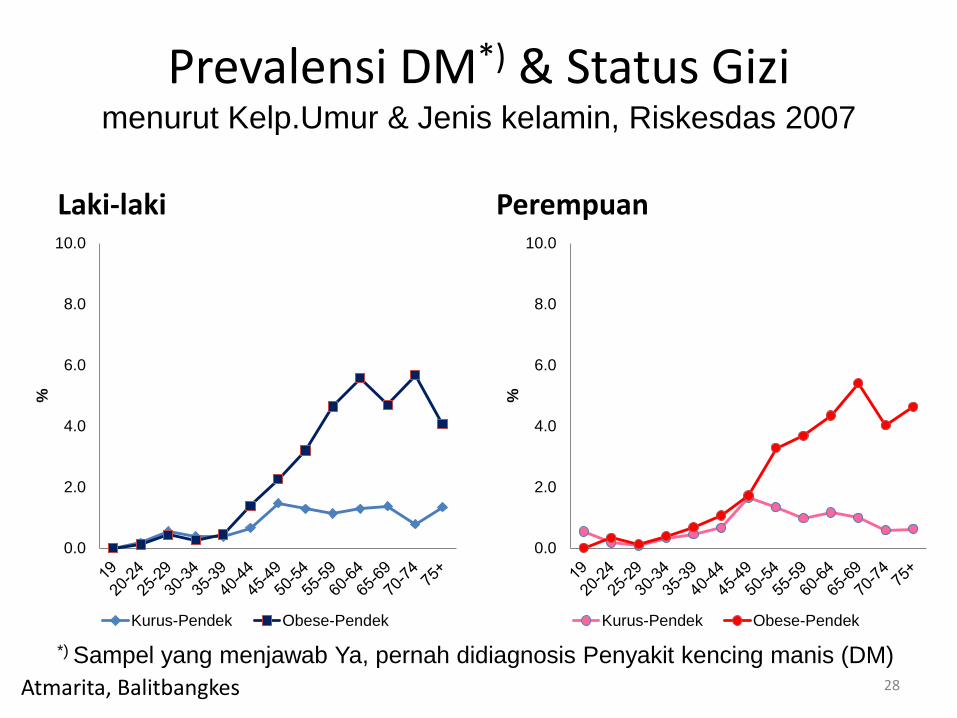
Prevalensi DM*) & Status Gizi menurut Kelp.Umur & Jenis kelamin, Riskesdas 2007
Laki-laki
0.0
2.0
4.0
6.0
8.0
10.0
%
Kurus-Pendek Obese-Pendek
Perempuan
0.0
2.0
4.0
6.0
8.0
10.0
%
Kurus-Pendek Obese-Pendek
Atmarita, Balitbangkes 28
*) Sampel yang menjawab Ya, pernah didiagnosis Penyakit kencing manis (DM)
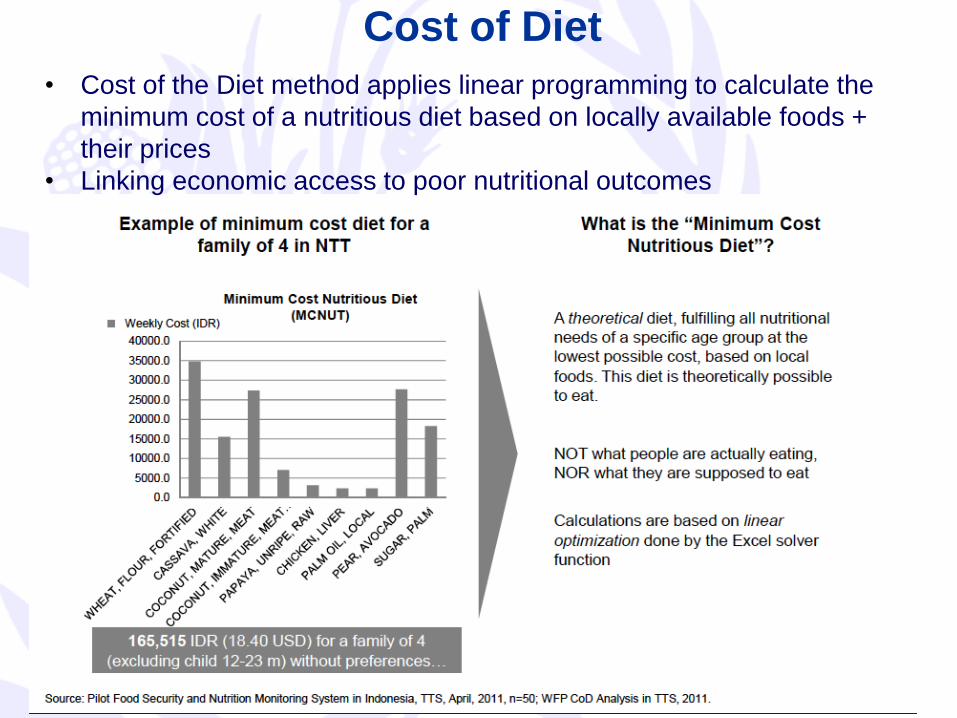
Cost of Diet
• Cost of the Diet method applies linear programming to calculate the
minimum cost of a nutritious diet based on locally available foods +
their prices
• Linking economic access to poor nutritional outcomes
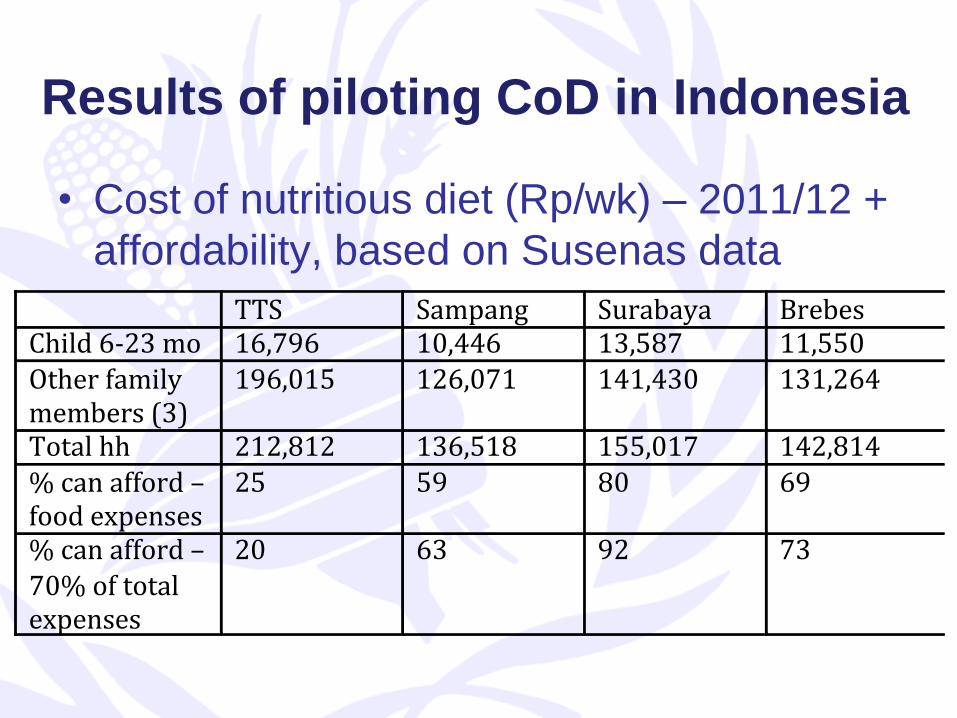
Results of piloting CoD in Indonesia
• Cost of nutritious diet (Rp/wk) – 2011/12 +
affordability, based on Susenas data
TTS Sampang Surabaya BrebesChild6-23mo 16,796 10,446 13,587 11,550Otherfamilymembers(3)
196,015 126,071 141,430 131,264
Totalhh 212,812 136,518 155,017 142,814%canafford–foodexpenses
25 59 80 69
%canafford–70%oftotalexpenses
20 63 92 73
39
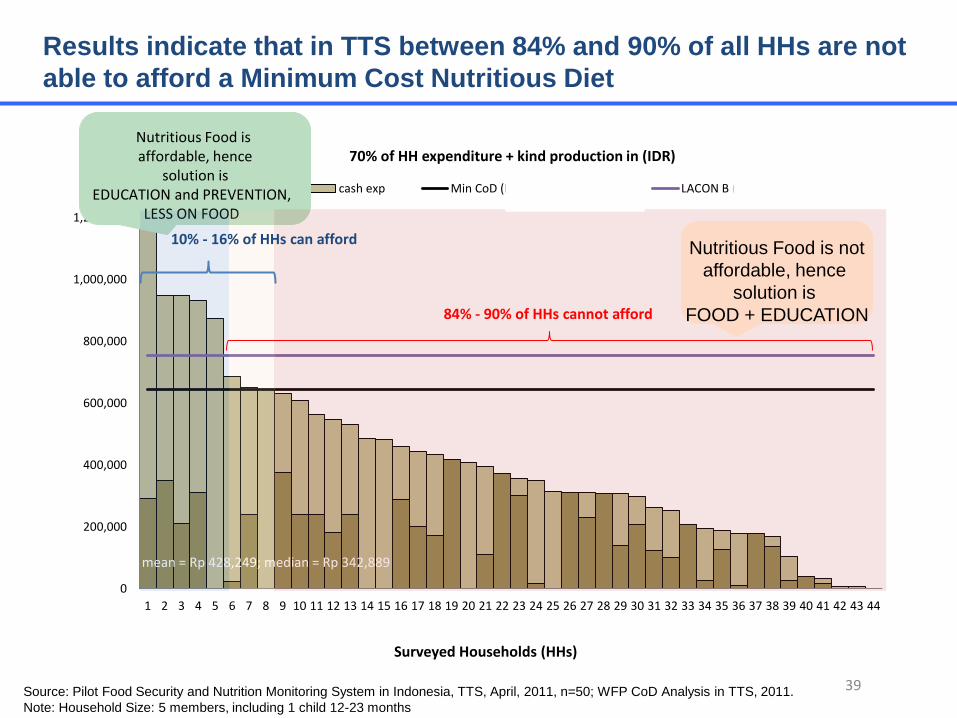
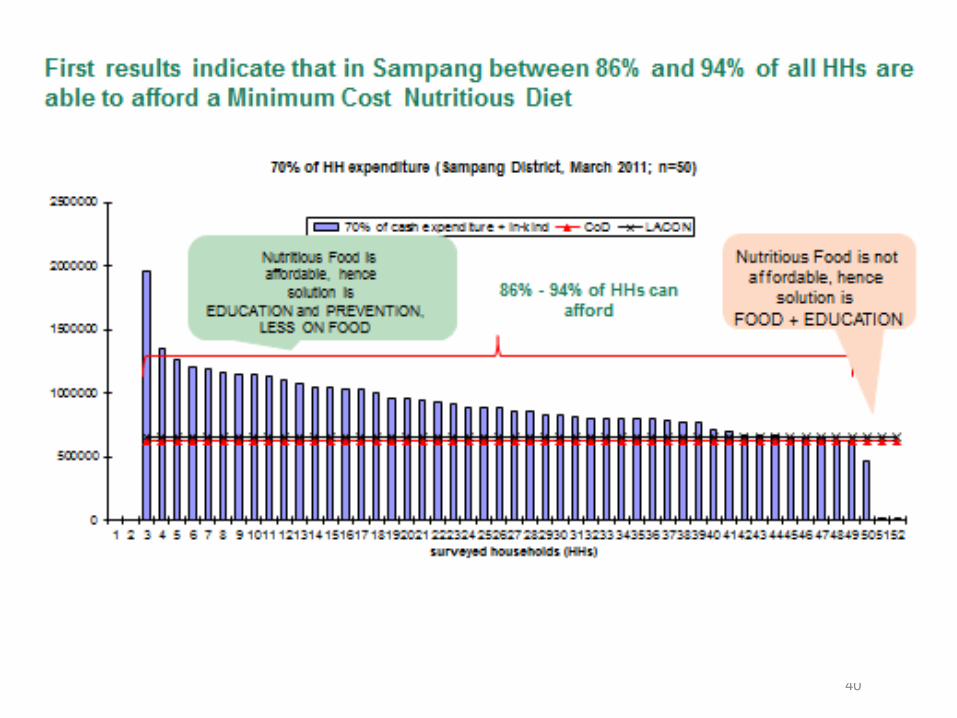
Results indicate that in TTS between 84% and 90% of all HHs are not
able to afford a Minimum Cost Nutritious Diet
0
200,000
400,000
600,000
800,000
1,000,000
1,200,000
1 2 3 4 5 6 7 8 9 10 11 12 13 14 15 16 17 18 19 20 21 22 23 24 25 26 27 28 29 30 31 32 33 34 35 36 37 38 39 40 41 42 43 44
70% of HH expenditure + kind production in (IDR)
own exp cash exp Min CoD (Rp 577,916/hh/mth) LACON B (Rp 760,416/hh/mth)
mean = Rp 428,249; median = Rp 342,889
Nutritious Food is affordable, hence
solution is EDUCATION and PREVENTION,
LESS ON FOOD
84% - 90% of HHs cannot afford
10% - 16% of HHs can afford
Source: Pilot Food Security and Nutrition Monitoring System in Indonesia, TTS, April, 2011, n=50; WFP CoD Analysis in TTS, 2011.
Note: Household Size: 5 members, including 1 child 12-23 months
Surveyed Households (HHs)
Nutritious Food is not
affordable, hence
solution is
FOOD + EDUCATION
40
CoD pilot Indonesia
• This tool gives good impression of
economic aspects + constraints for
nutritious diet
• Strategies & programs should also take
into consideration:
– NE + BCC – to stimulate best choices
– Food preferences – what do people like & do
– Expenditure pattern – how is extra cash used
• Different context + options in different
places – local decision making
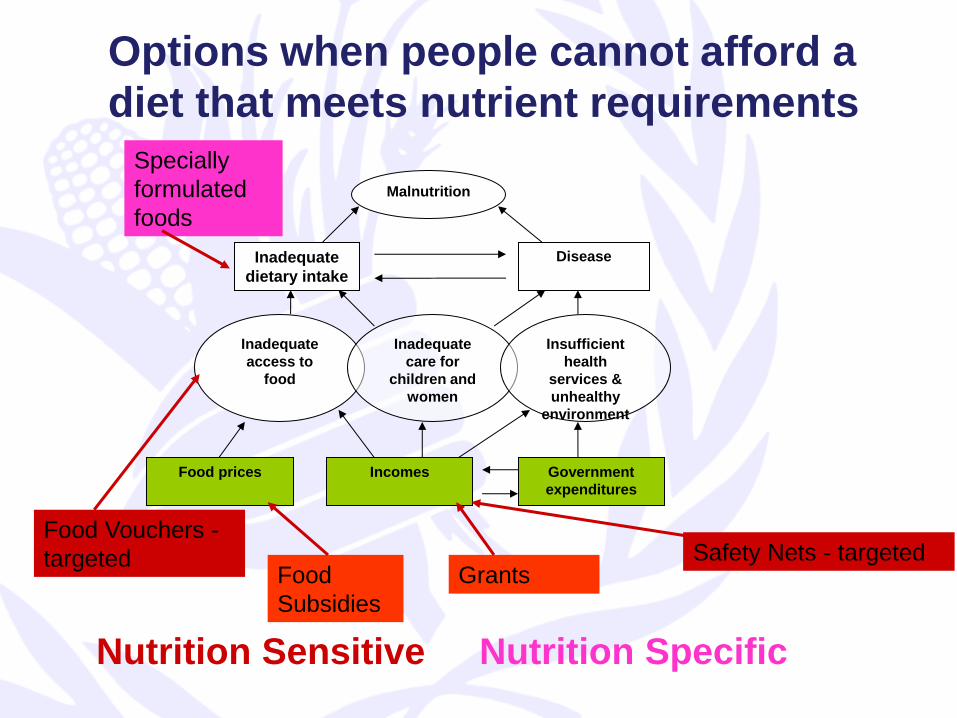
Malnutrition
Inadequate
dietary intake
Disease
Inadequate
access to
food
Inadequate
care for
children and
women
Insufficient
health
services &
unhealthy
environment
Food prices Incomes Government
expenditures
Safety Nets - targeted
Specially
formulated
foods
Food
Subsidies
Food Vouchers -
targeted Grants
Nutrition Sensitive Nutrition Specific
Options when people cannot afford a
diet that meets nutrient requirements
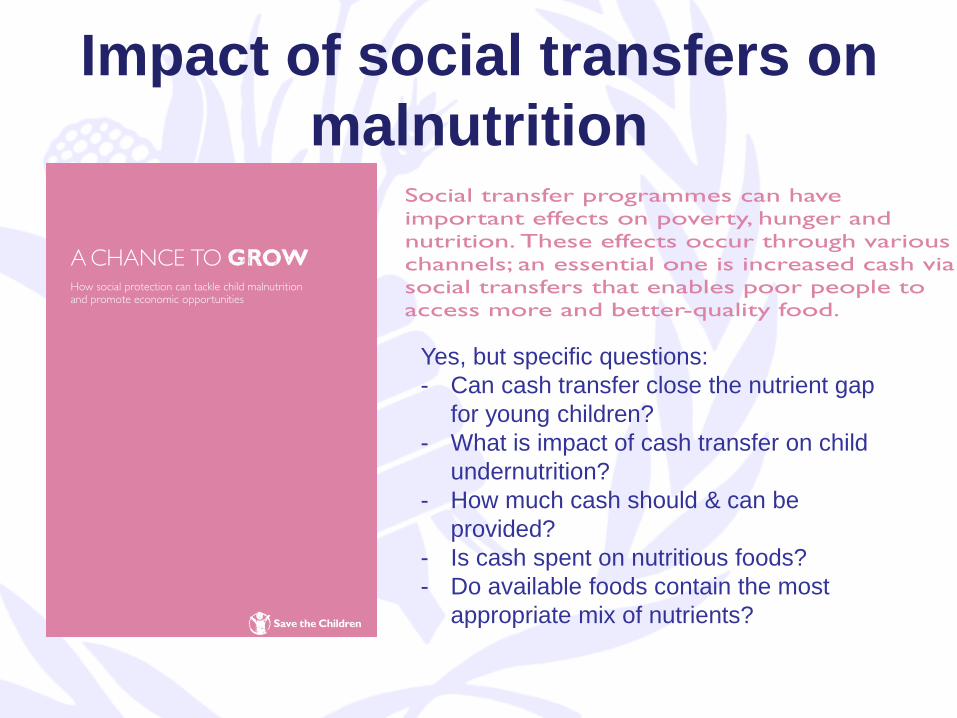
Impact of social transfers on
malnutrition
Yes, but specific questions:
- Can cash transfer close the nutrient gap
for young children?
- What is impact of cash transfer on child
undernutrition?
- How much cash should & can be
provided?
- Is cash spent on nutritious foods?
- Do available foods contain the most
appropriate mix of nutrients?
• Food, vouchers or cash supports
household and likely improves diet
• But, extent to which nutrient needs of
specific groups are met varies and hence
the impact on nutritional status varies
J Nutr 2005; 135: 1423-9.
Study of impact of social transfer on
malnutrition in Niger Epicentre/MSF & WFP
• Just protecting the child – child-specific food is
likely better than equivalent amount as cash
(±10 euro/mo)
• Support to vulnerable households –include
specific nutritious foods for vulnerable groups
(u2, PLW)
Scaling Up Nutrition
Together, we can achieve
what no single effort could,
and make the world a healthier,
stronger place for us all.
Focused on the importance of thousand days
SUN is a multi-stakeholder movement focused on increasing prioritization,
resources and action to reduce global child undernutrition and promotes the
scale up of nutrition specific and sensitive approaches through country-lead
and coordinated approaches. SUN website: www.scalingupnutrition.org.
The SUN Framework & Roadmap (2010) outlines the strategies for
addressing child undernutrition through coordinated, multi-stakeholder and
country-lead approaches to scaling up nutrition specific and sensitive
interventions.
Direct nutrition specific interventions include: increasing intake of vitamins
and minerals for mothers /young children (and all with food fortification),
promoting good nutrition practices (breast feeding, complementary feeding,
hygiene), therapeutic feeding for malnourished with special foods.
What is the SUN?
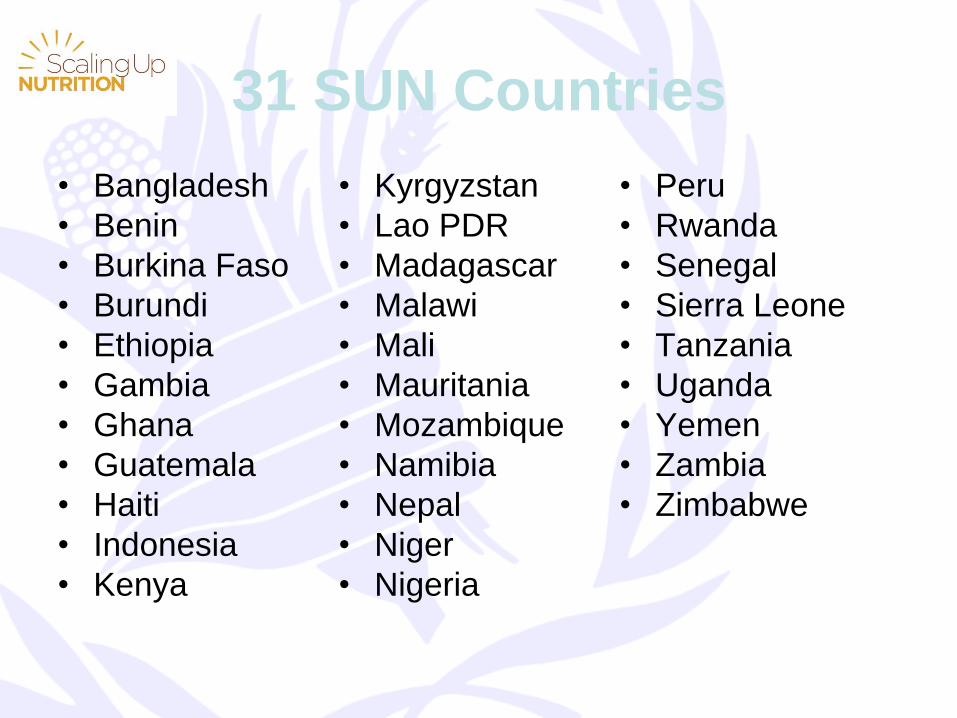
31 SUN Countries
• Bangladesh
• Benin
• Burkina Faso
• Burundi
• Ethiopia
• Gambia
• Ghana
• Guatemala
• Haiti
• Indonesia
• Kenya
• Kyrgyzstan
• Lao PDR
• Madagascar
• Malawi
• Mali
• Mauritania
• Mozambique
• Namibia
• Nepal
• Niger
• Nigeria
• Peru
• Rwanda
• Senegal
• Sierra Leone
• Tanzania
• Uganda
• Yemen
• Zambia
• Zimbabwe
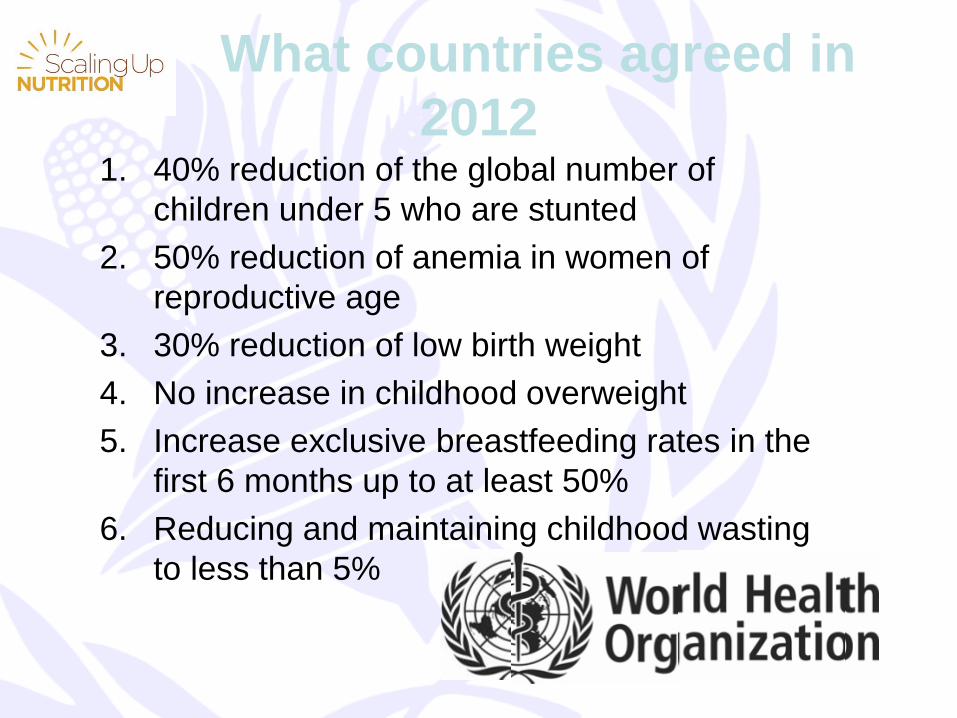
What countries agreed in
2012 1. 40% reduction of the global number of
children under 5 who are stunted
2. 50% reduction of anemia in women of
reproductive age
3. 30% reduction of low birth weight
4. No increase in childhood overweight
5. Increase exclusive breastfeeding rates in the
first 6 months up to at least 50%
6. Reducing and maintaining childhood wasting
to less than 5%
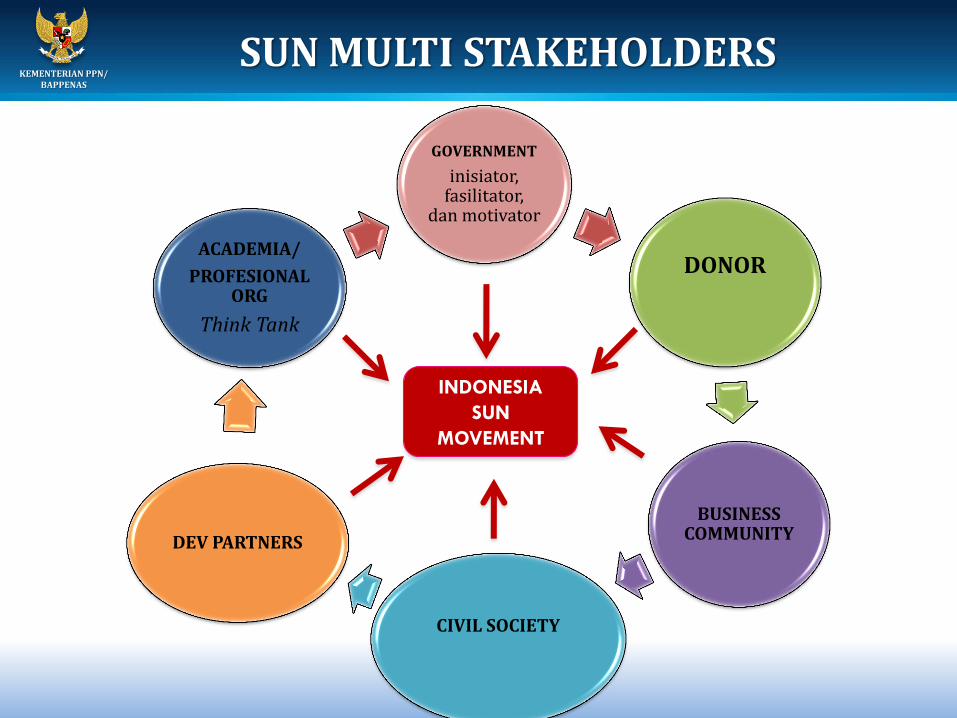
KEMENTERIAN PPN/ BAPPENAS
SUN MULTI STAKEHOLDERS
GOVERNMENT
inisiator, fasilitator,
dan motivator
DONOR
BUSINESS COMMUNITY
CIVIL SOCIETY
DEV PARTNERS
ACADEMIA/
PROFESIONAL ORG
Think Tank
INDONESIA
SUN
MOVEMENT
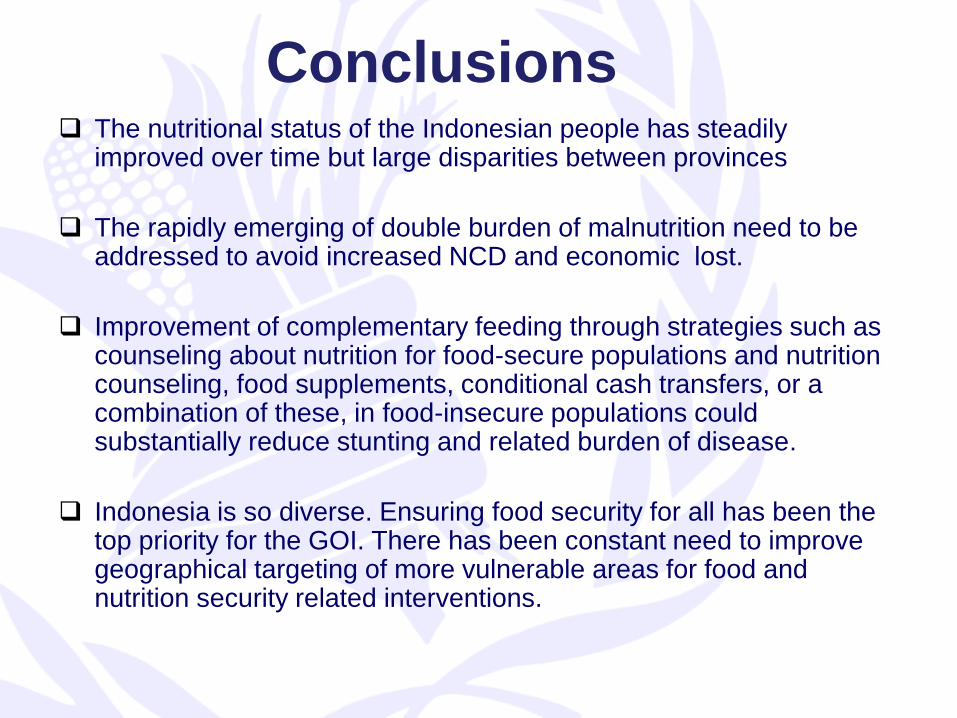
Conclusions The nutritional status of the Indonesian people has steadily
improved over time but large disparities between provinces
The rapidly emerging of double burden of malnutrition need to be addressed to avoid increased NCD and economic lost.
Improvement of complementary feeding through strategies such as counseling about nutrition for food-secure populations and nutrition counseling, food supplements, conditional cash transfers, or a combination of these, in food-insecure populations could substantially reduce stunting and related burden of disease.
Indonesia is so diverse. Ensuring food security for all has been the top priority for the GOI. There has been constant need to improve geographical targeting of more vulnerable areas for food and nutrition security related interventions.
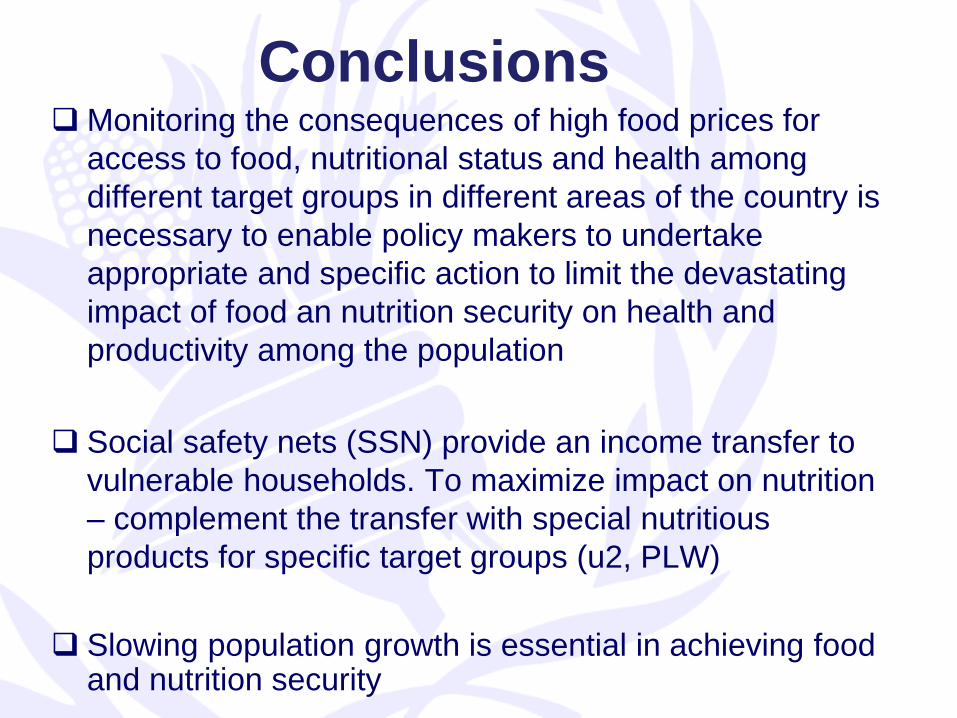
Conclusions Monitoring the consequences of high food prices for
access to food, nutritional status and health among
different target groups in different areas of the country is
necessary to enable policy makers to undertake
appropriate and specific action to limit the devastating
impact of food an nutrition security on health and
productivity among the population
Social safety nets (SSN) provide an income transfer to
vulnerable households. To maximize impact on nutrition
– complement the transfer with special nutritious
products for specific target groups (u2, PLW)
Slowing population growth is essential in achieving food and nutrition security
Reference: • R Shrimpton and C Rokx, 2012. The Double Burden of
malnutrition. World Bank.
• MW Bloem, S de Pee, LT Hop, NC Khan, A Laillou, Minarto, R
Moench-Pfanner, D Soekarjo, Soekirman, JA Solon, C Theary,
and E Wasantwisut. 2013. Key strategies to further reduce
stunting in Southeast Asia: Lessons from the ASEAN countries
workshop . Food and Nutrition Bulletin
• G Baldi, E Martini, M Catharina, S Muslimatun, U Fahmida, A
Jahari, Hardinsyah, R Frega, P Geniez, N Grede, Minarto, M. W.
Bloem, and Saskia de Pee. 2013. Cost of the Diet (CoD) tool: First
results from Indonesia and applications for policy discussion on
food and nutrition security. Food and Nutrition Bulletin
• www.foodsecurityatlas.org
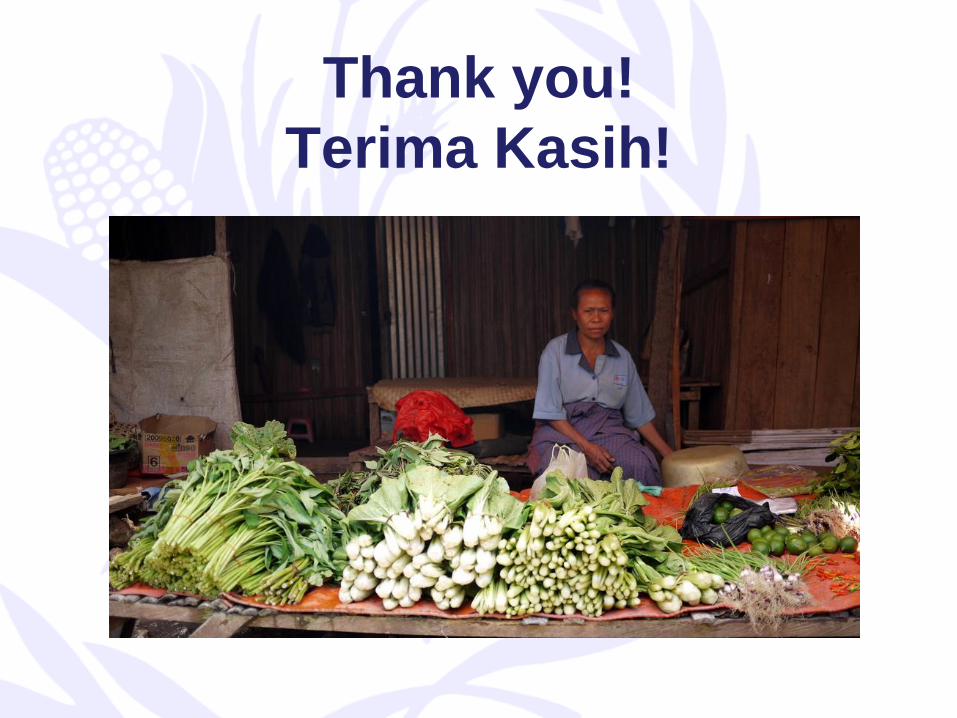
Thank you!
Terima Kasih!