Embed Size (px)
Citation preview

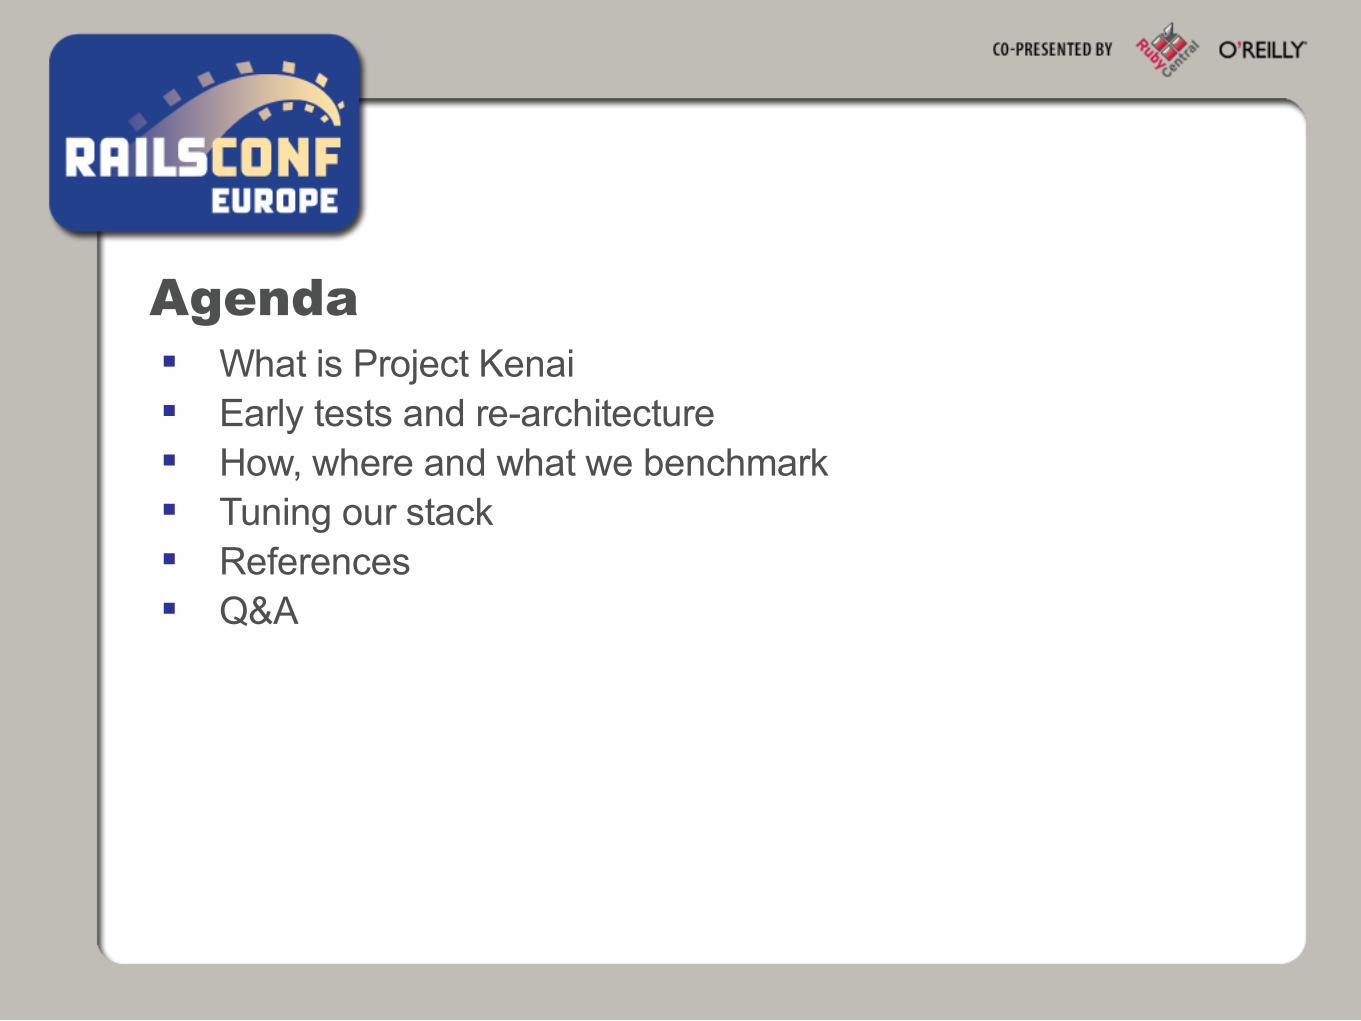
Agenda What is Project Kenai Early tests and re-architecture How, where and what we benchmark Tuning our stack References Q&A
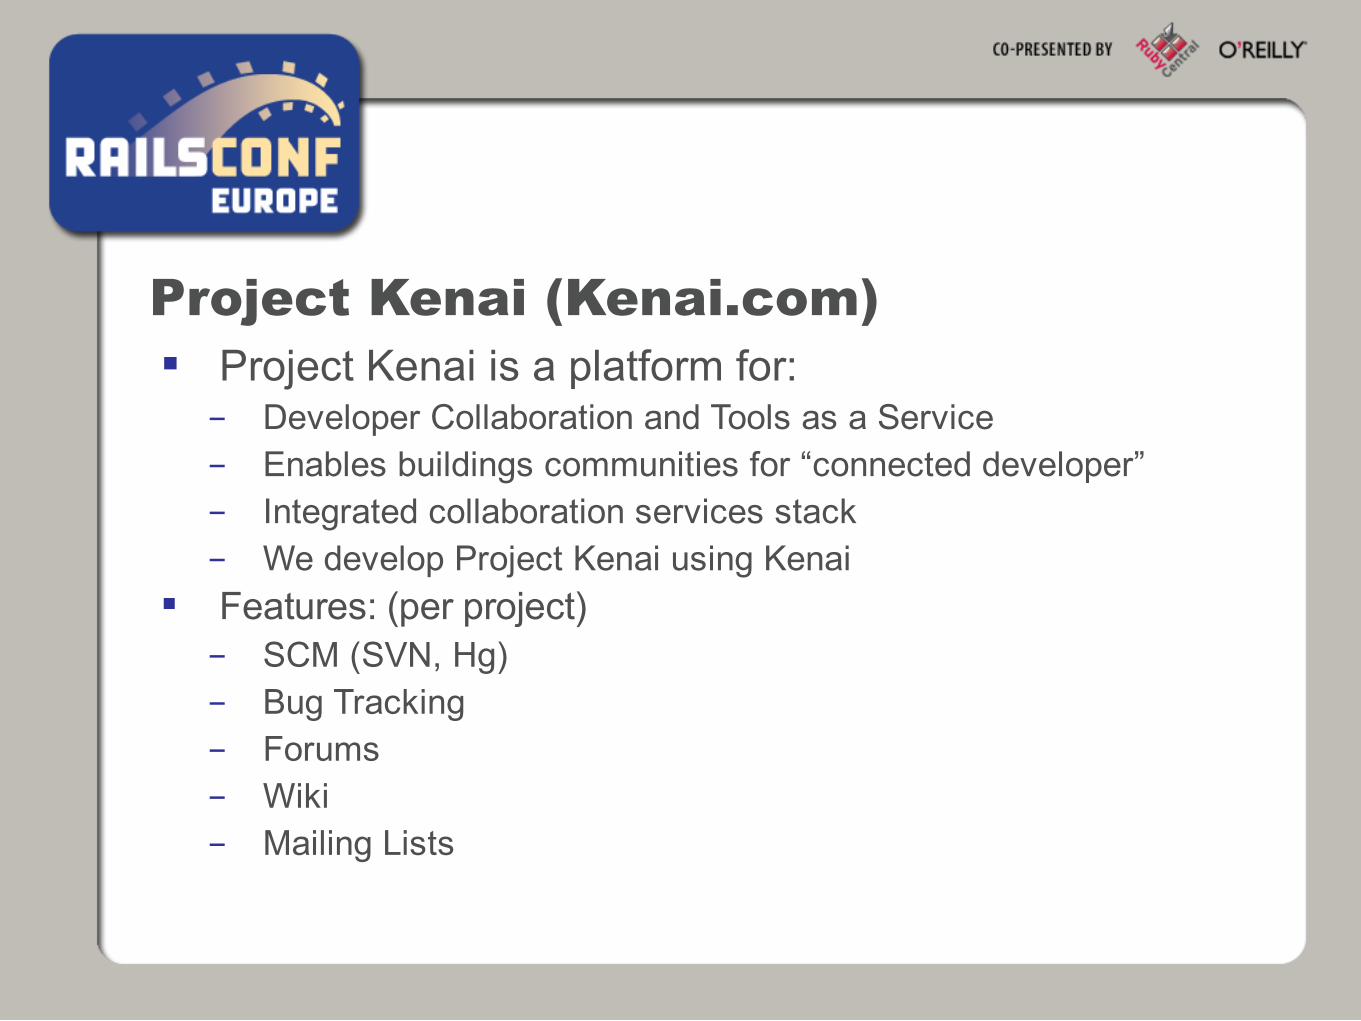
Project Kenai (Kenai.com) Project Kenai is a platform for:- Developer Collaboration and Tools as a Service - Enables buildings communities for “connected developer”- Integrated collaboration services stack- We develop Project Kenai using Kenai
Features: (per project)- SCM (SVN, Hg)- Bug Tracking- Forums- Wiki- Mailing Lists
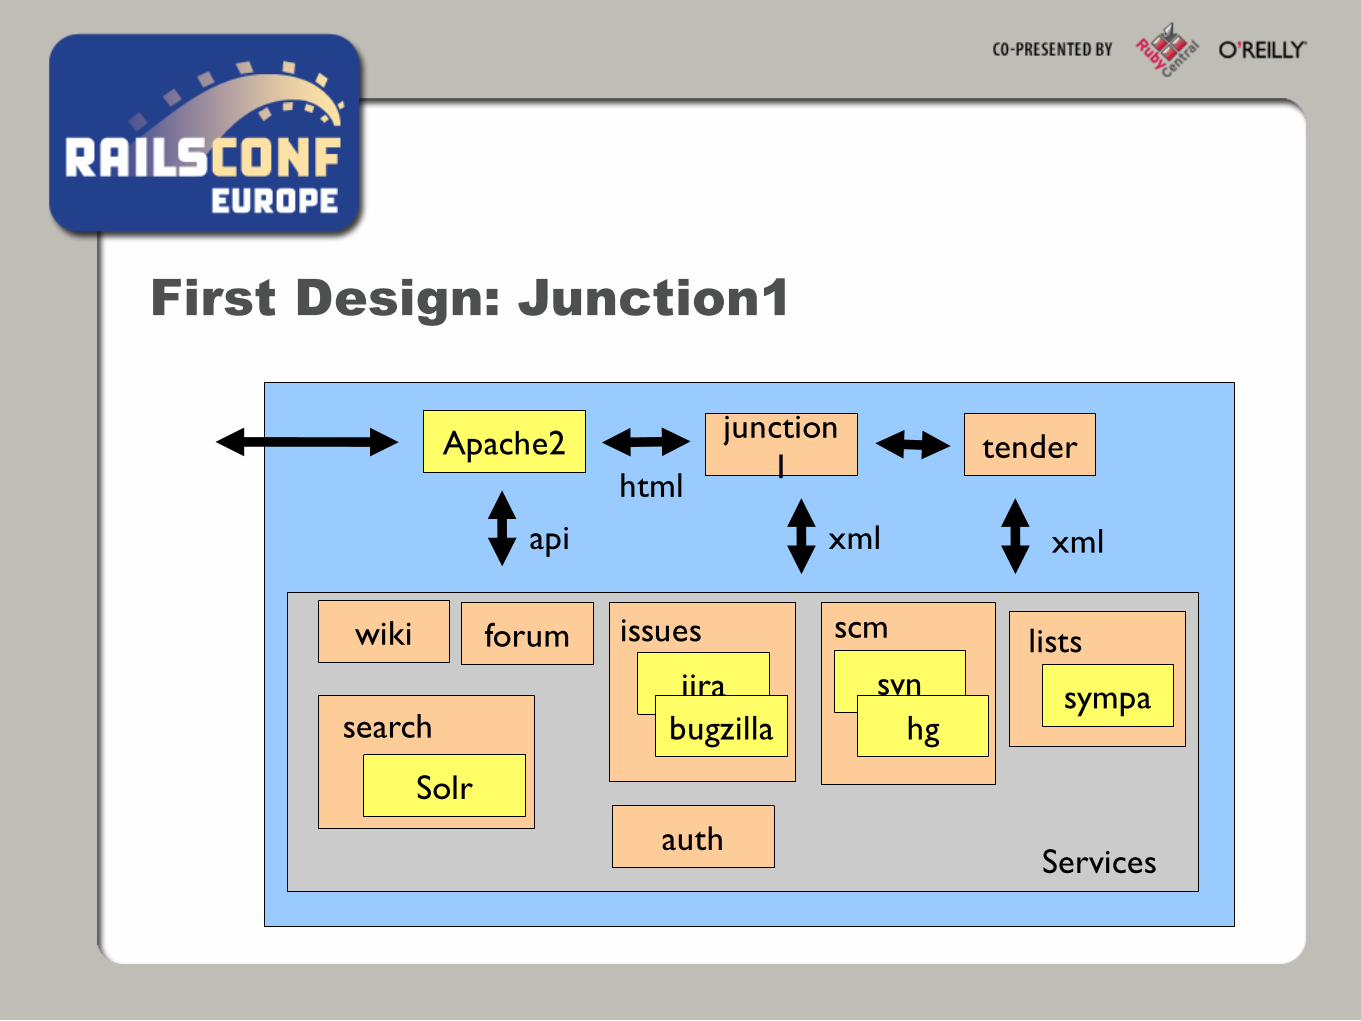
First Design: Junction1
wiki forum
jira svnhgbugzilla
issues scm
xml
tenderjunction1
Apache2
xml
sympa
lists
Services
Solr
search
auth
api
html
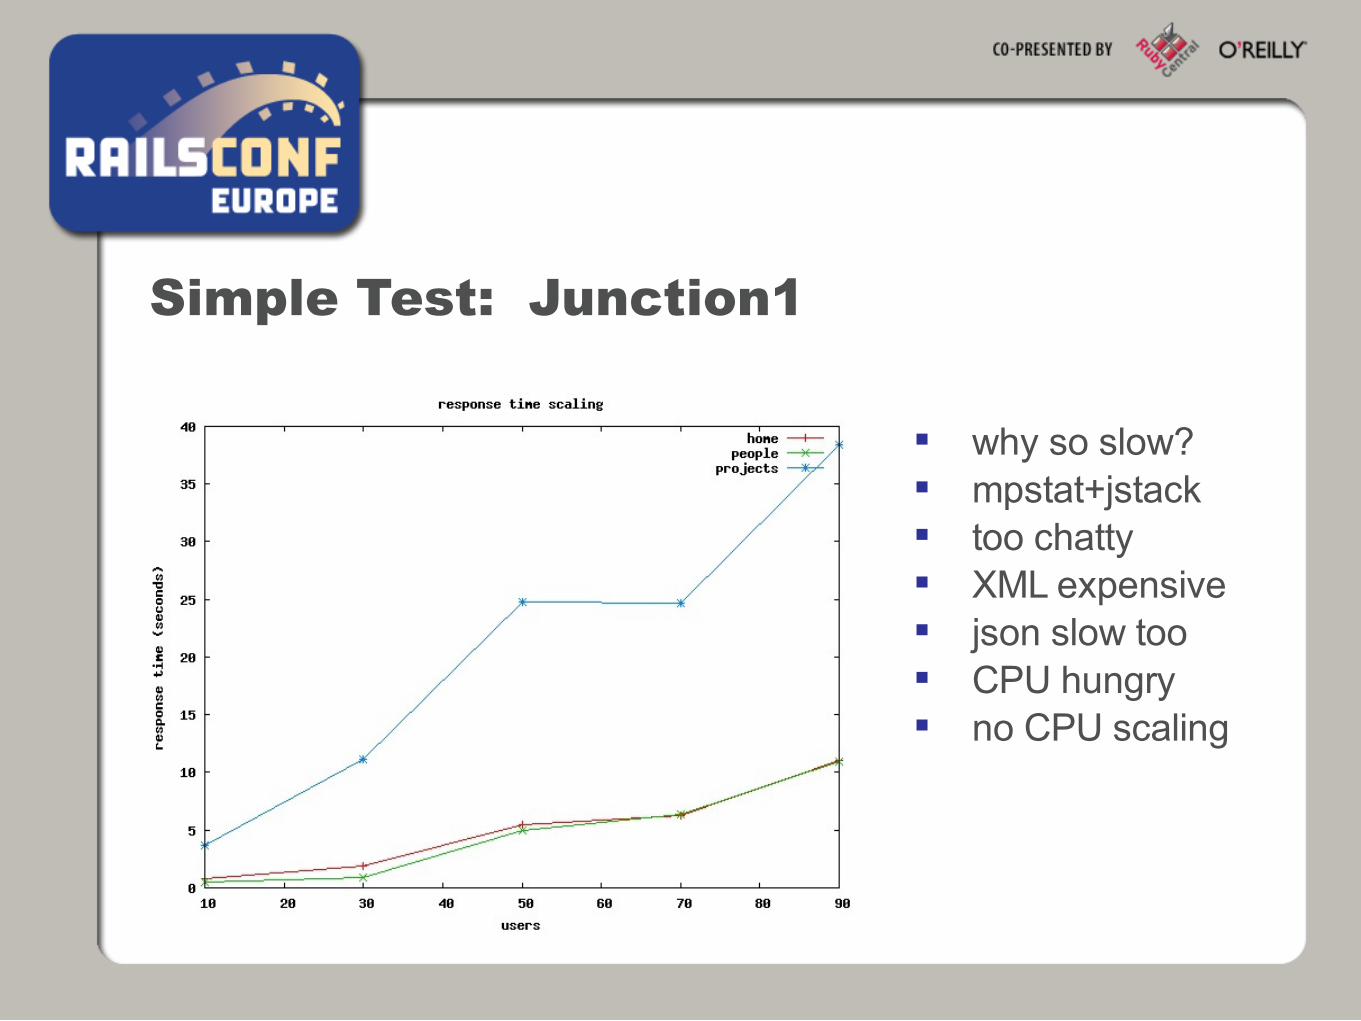
Simple Test: Junction1
why so slow? mpstat+jstack too chatty XML expensive json slow too CPU hungry no CPU scaling
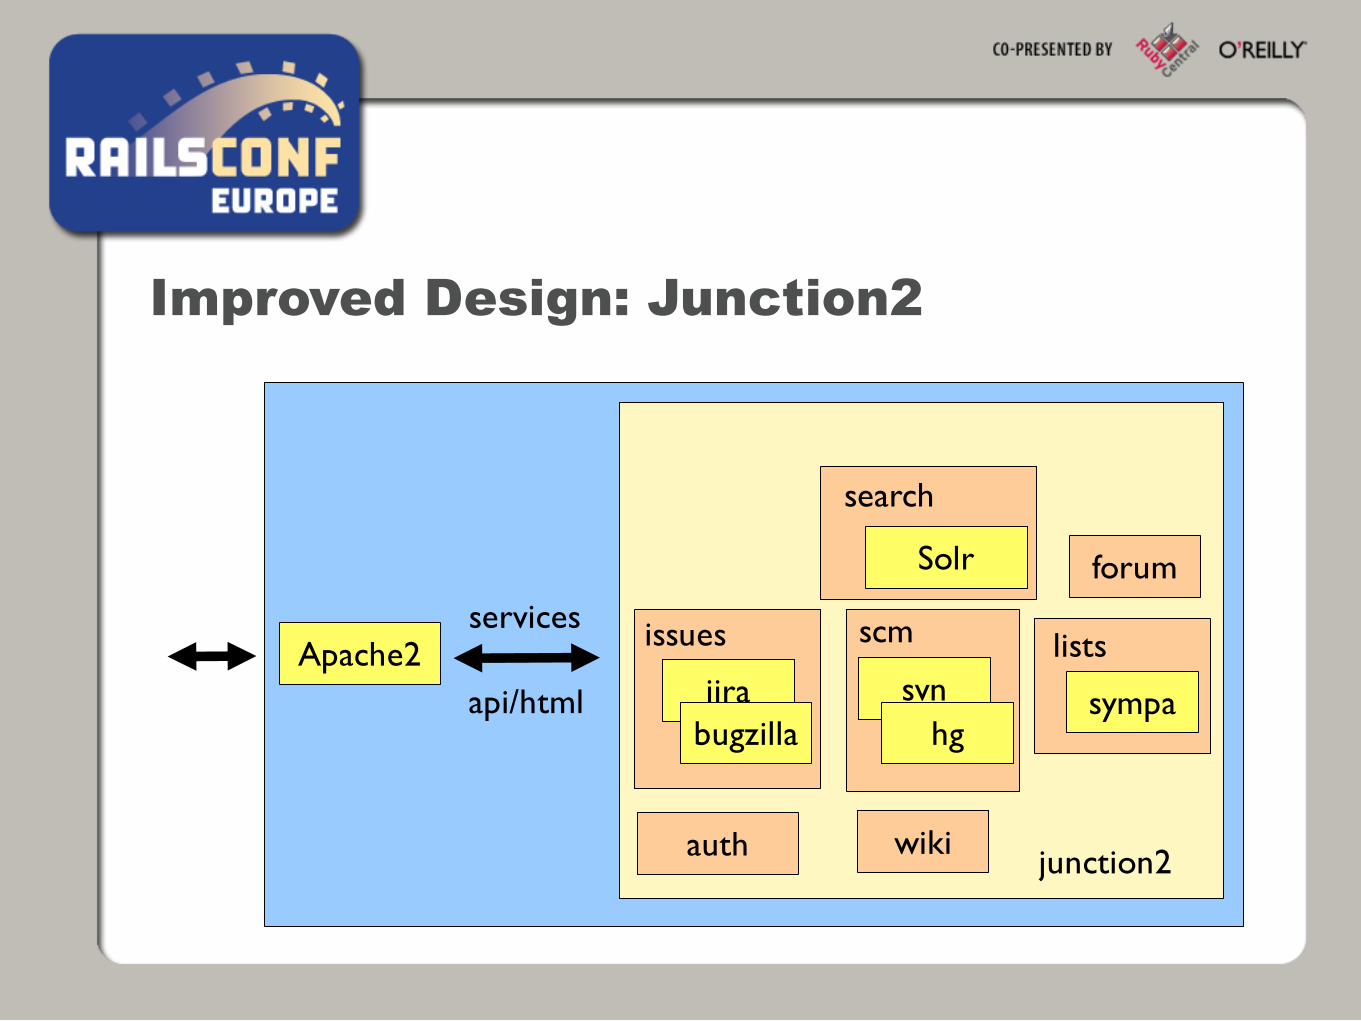
Improved Design: Junction2
wiki
forum
jira svnhgbugzilla
issues scmApache2
sympa
lists
junction2
Solr
search
auth
api/html
services

Simple Test: Junction2
no chatter better CPU
usage CPU scales much better
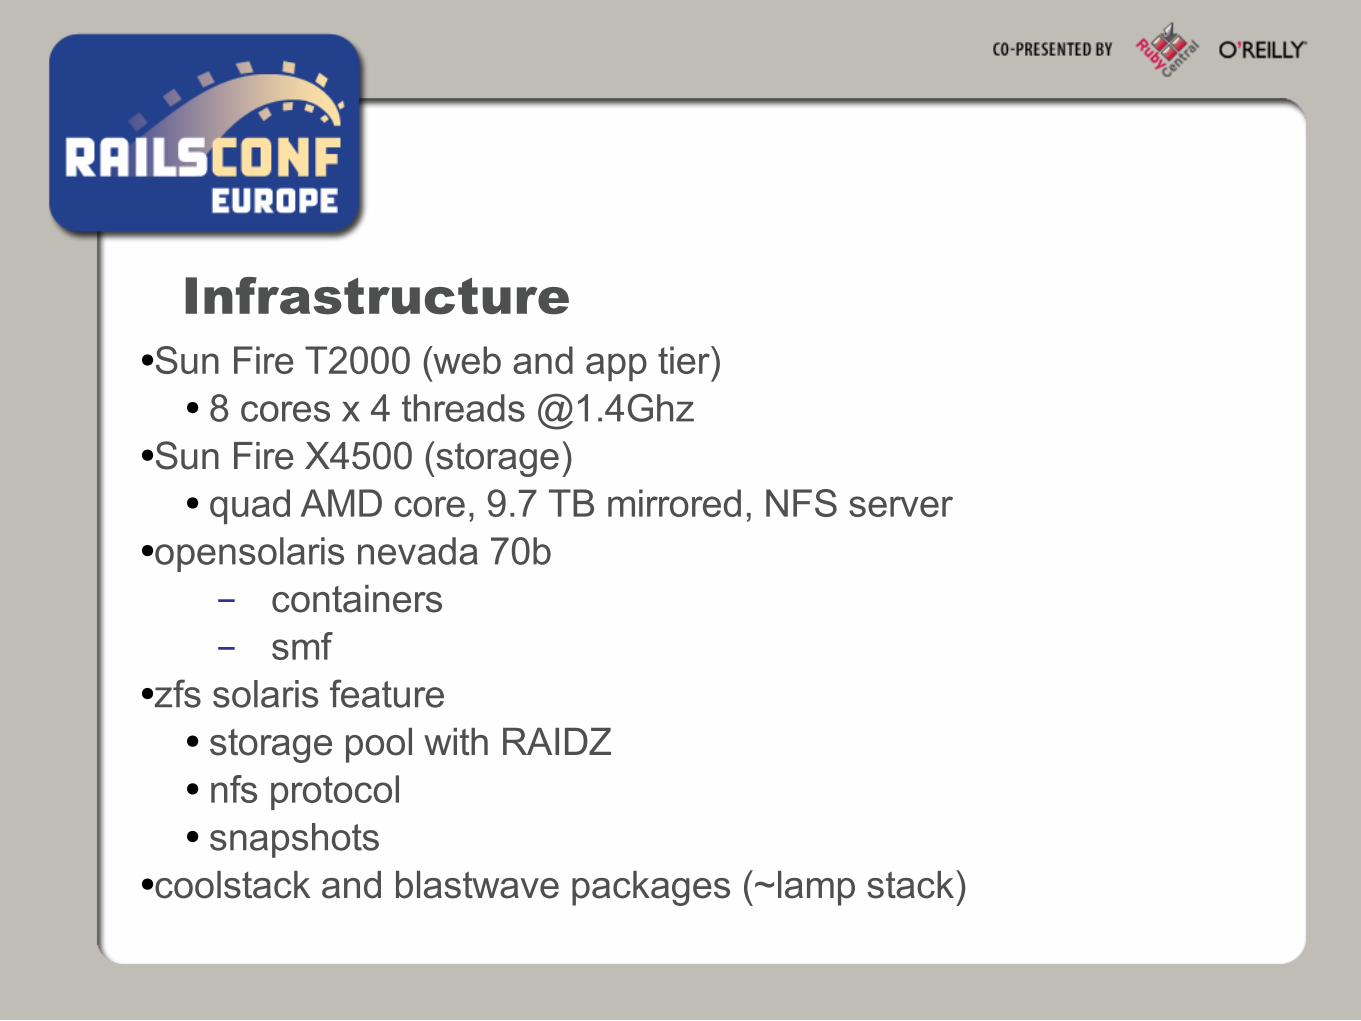
Infrastructure●Sun Fire T2000 (web and app tier)
● 8 cores x 4 threads @1.4Ghz●Sun Fire X4500 (storage)
● quad AMD core, 9.7 TB mirrored, NFS server●opensolaris nevada 70b
- containers- smf
●zfs solaris feature● storage pool with RAIDZ● nfs protocol● snapshots
●coolstack and blastwave packages (~lamp stack)
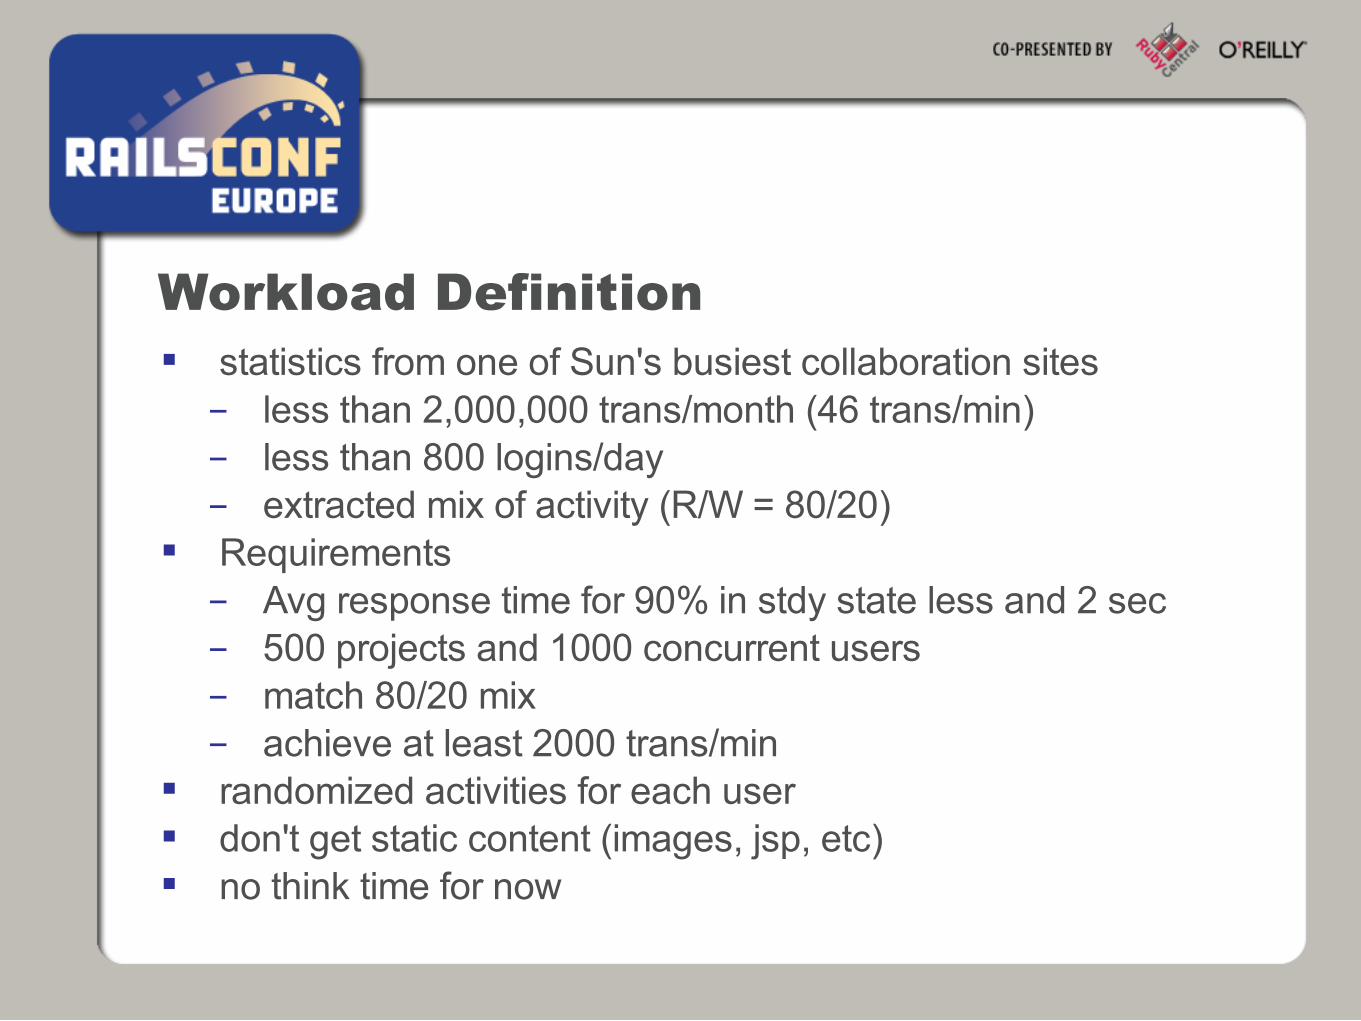
Workload Definition statistics from one of Sun's busiest collaboration sites- less than 2,000,000 trans/month (46 trans/min)- less than 800 logins/day- extracted mix of activity (R/W = 80/20)
Requirements- Avg response time for 90% in stdy state less and 2 sec- 500 projects and 1000 concurrent users- match 80/20 mix- achieve at least 2000 trans/min
randomized activities for each user don't get static content (images, jsp, etc) no think time for now
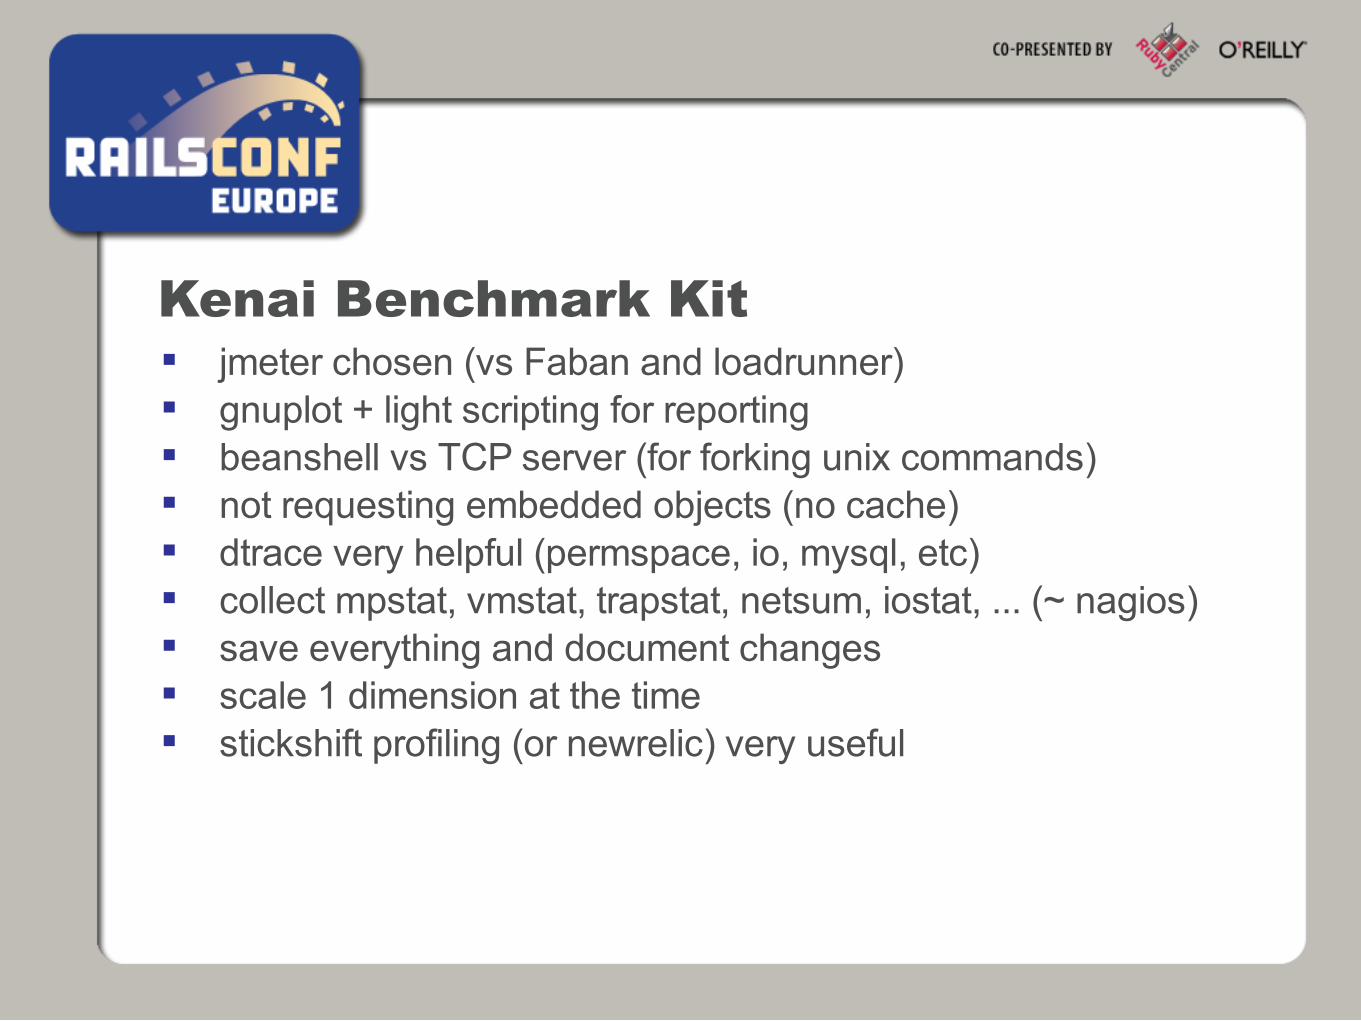
Kenai Benchmark Kit jmeter chosen (vs Faban and loadrunner) gnuplot + light scripting for reporting beanshell vs TCP server (for forking unix commands) not requesting embedded objects (no cache) dtrace very helpful (permspace, io, mysql, etc) collect mpstat, vmstat, trapstat, netsum, iostat, ... (~ nagios) save everything and document changes scale 1 dimension at the time stickshift profiling (or newrelic) very useful
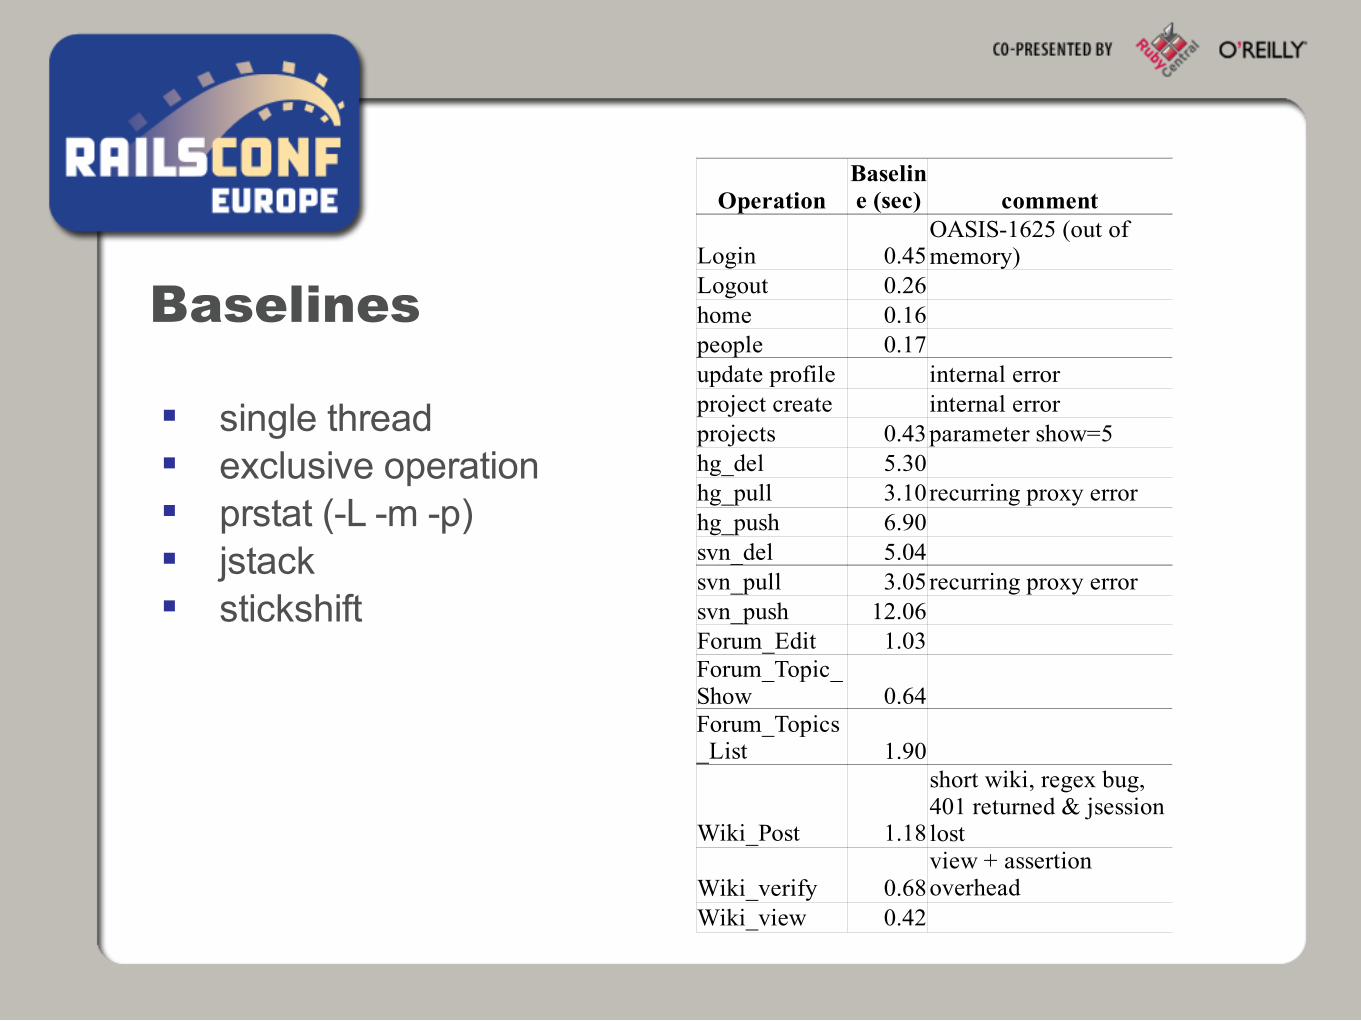
Baselines
single thread exclusive operation prstat (-L -m -p) jstack stickshift
Operation comment
Login 0.45Logout 0.26home 0.16people 0.17update profile internal errorproject create internal errorprojects 0.43parameter show=5 hg_del 5.30hg_pull 3.10recurring proxy errorhg_push 6.90svn_del 5.04svn_pull 3.05recurring proxy errorsvn_push 12.06Forum_Edit 1.03
0.64
1.90
Wiki_Post 1.18
Wiki_verify 0.68Wiki_view 0.42
Baseline (sec)
OASIS-1625 (out of memory)
Forum_Topic_ShowForum_Topics_List
short wiki, regex bug, 401 returned & jsession lostview + assertion overhead
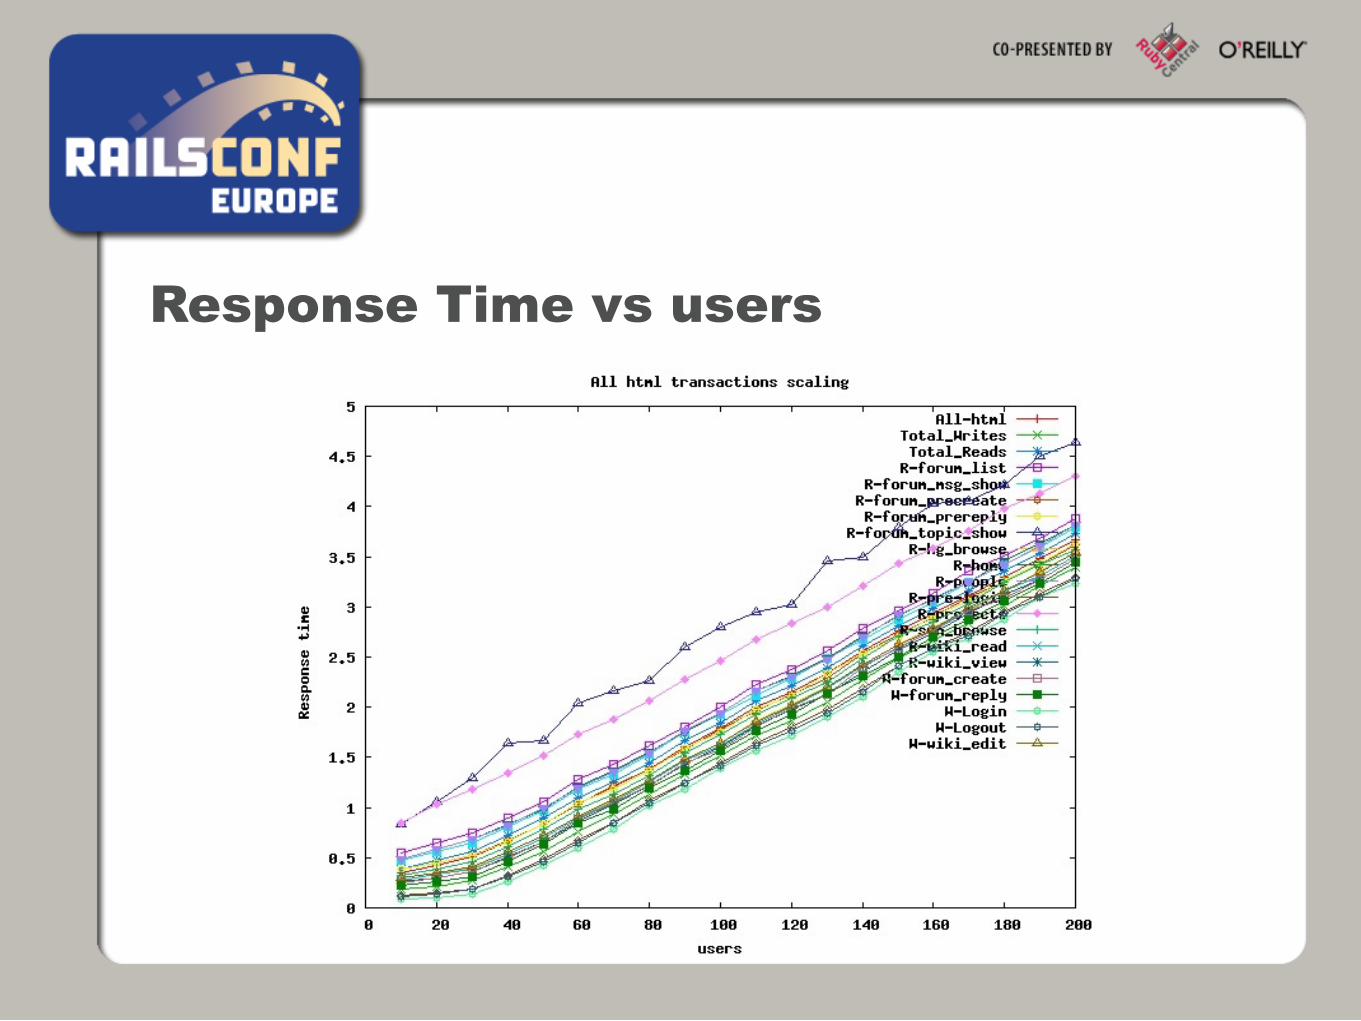
Response Time vs users
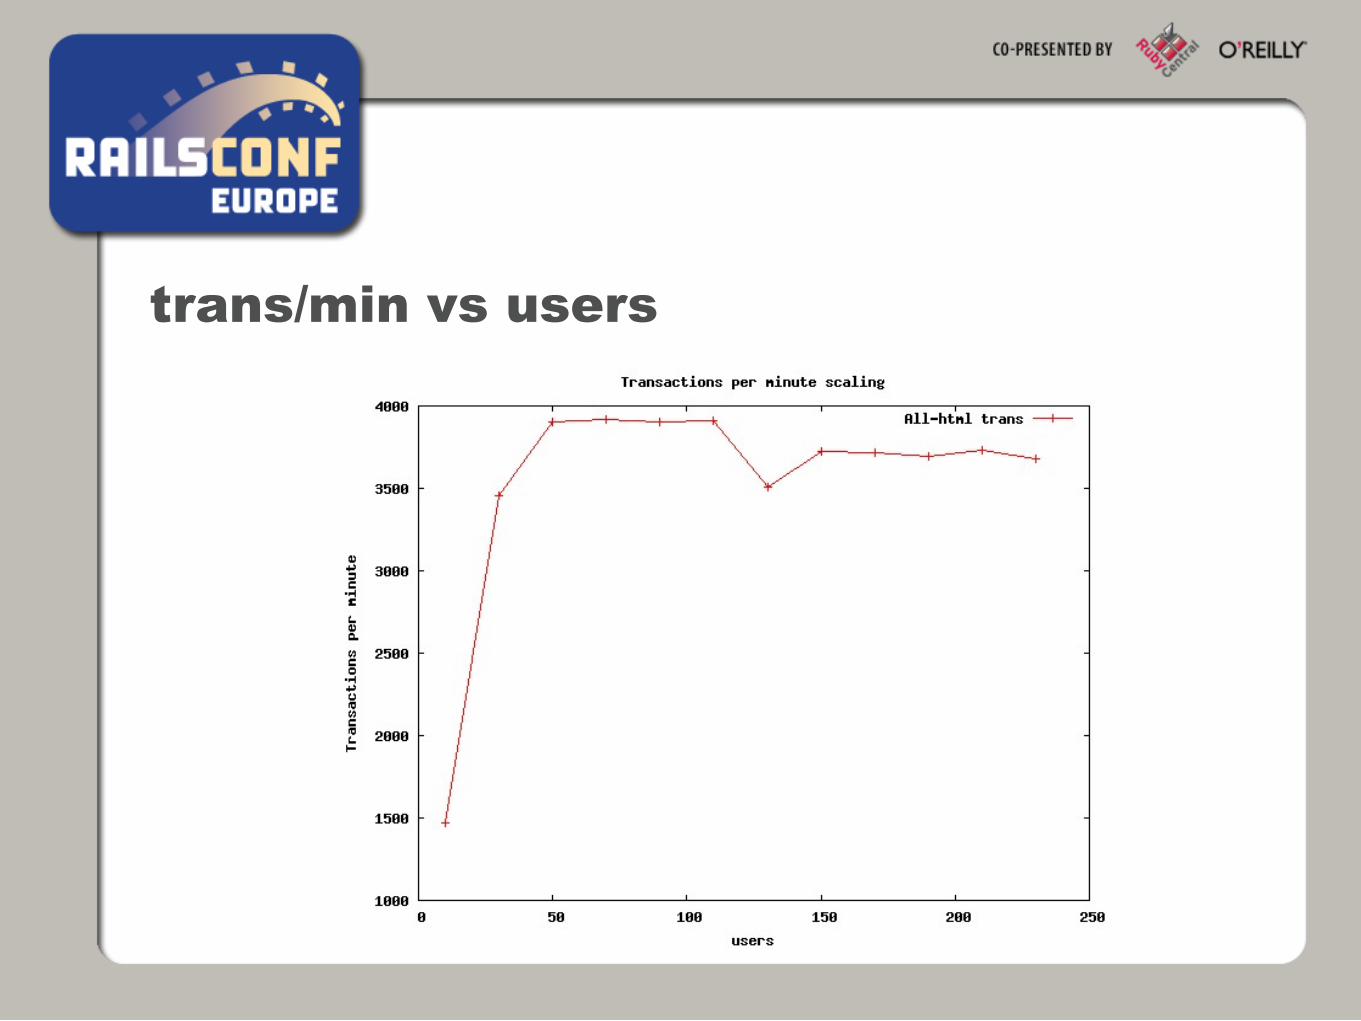
trans/min vs users
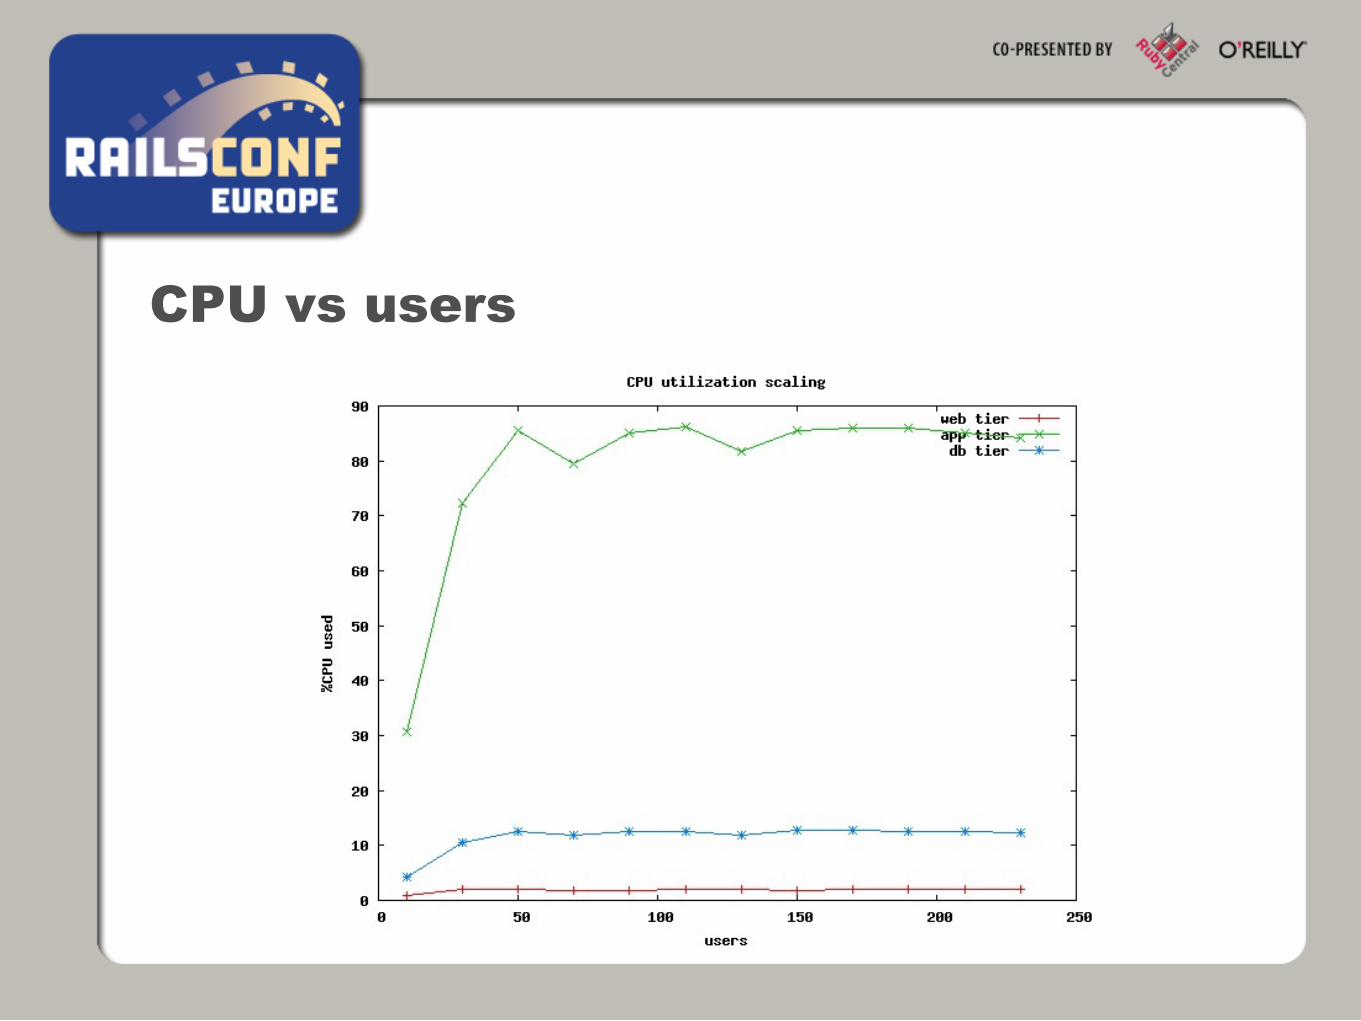
CPU vs users
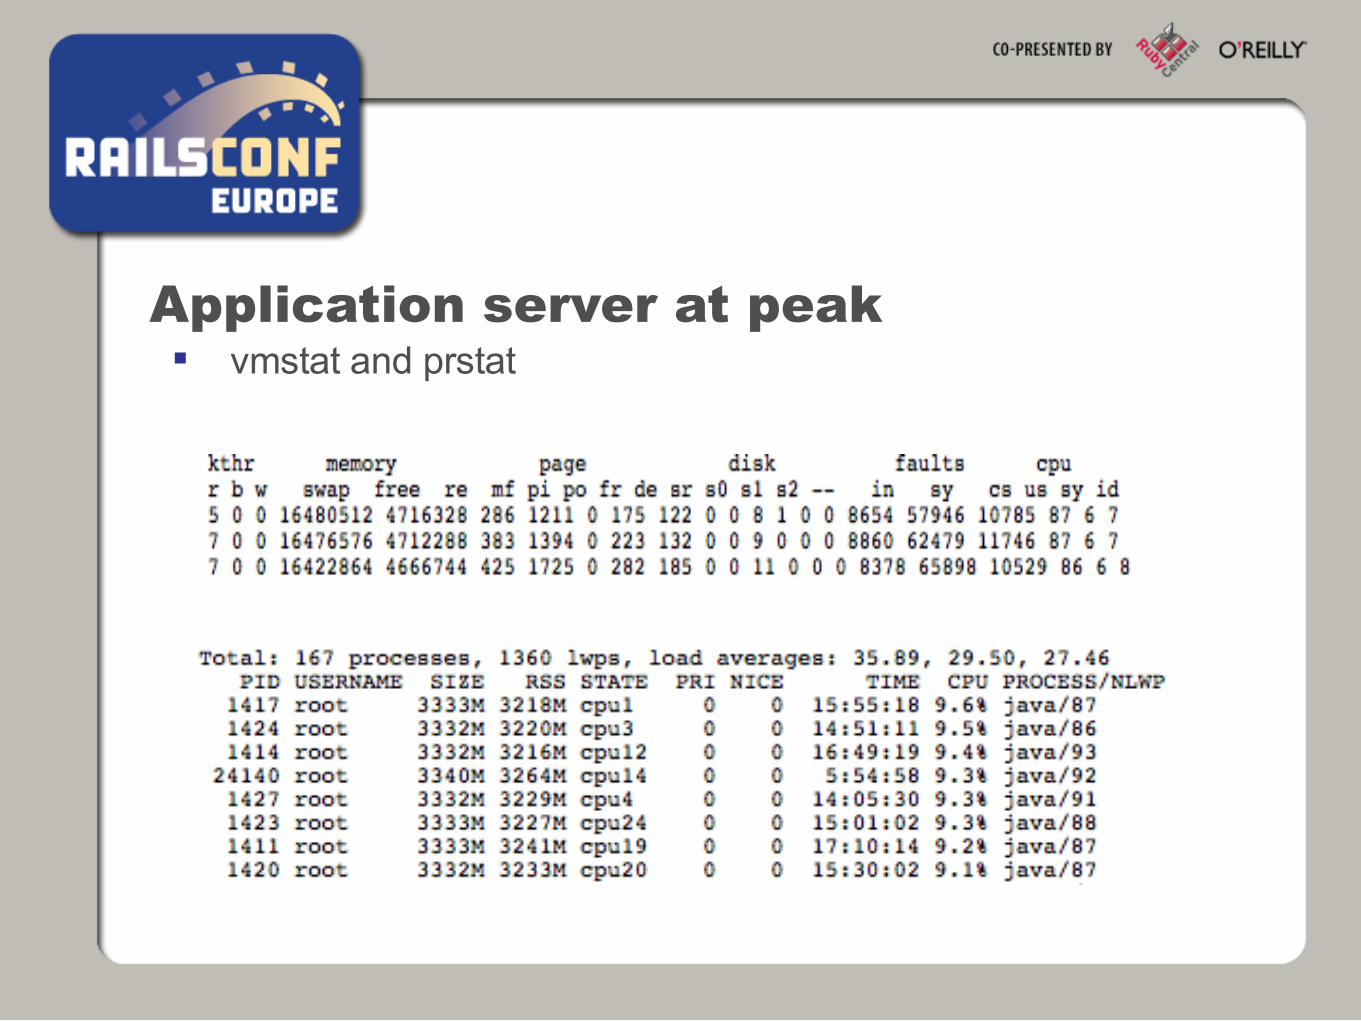
Application server at peak vmstat and prstat
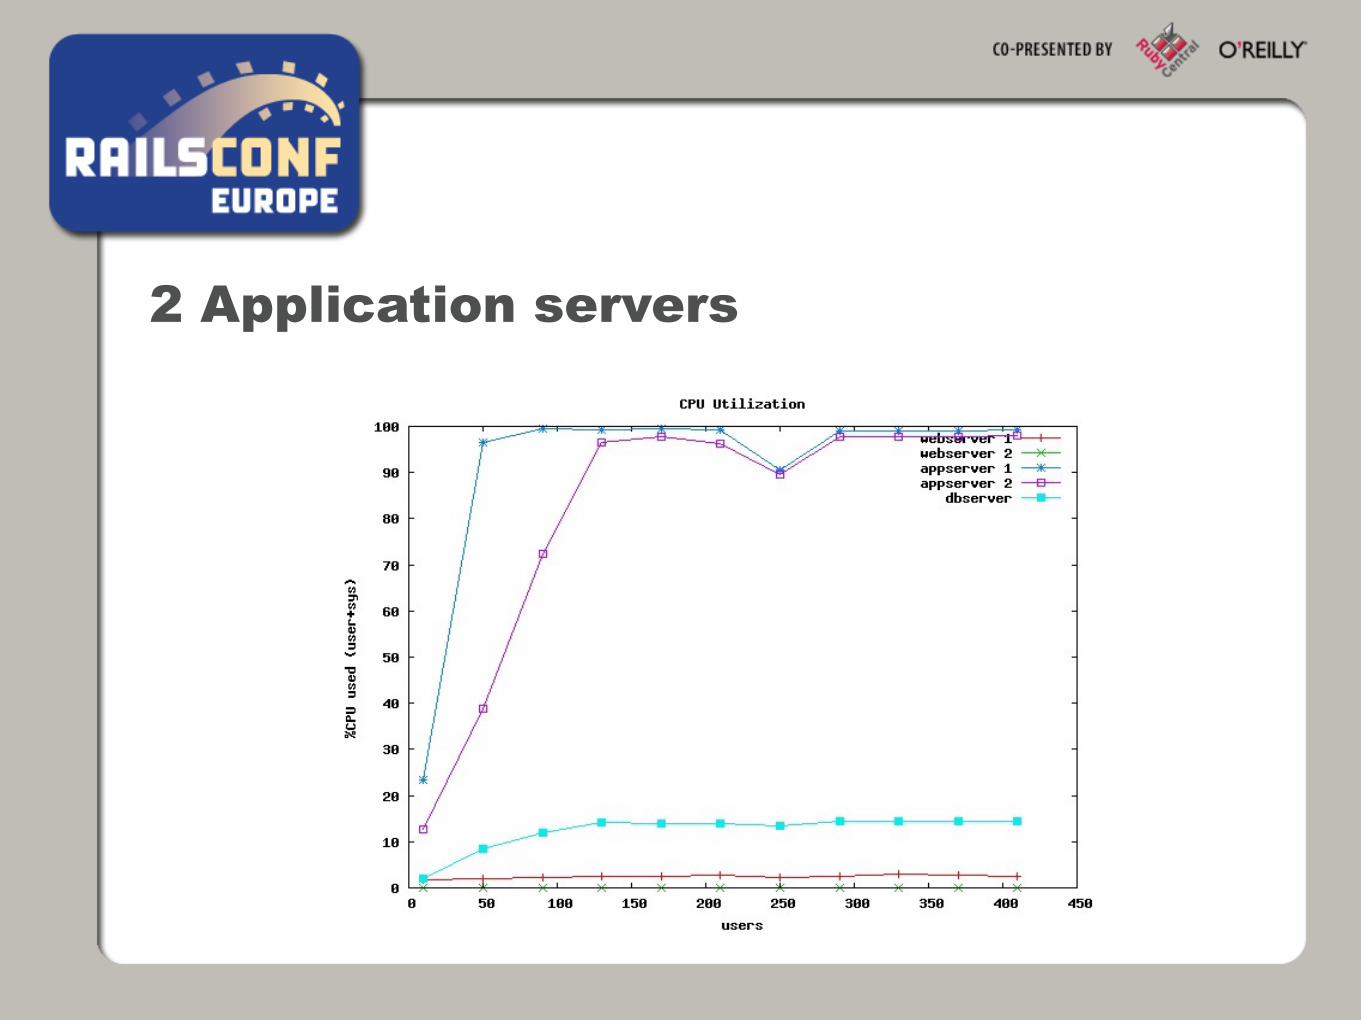
2 Application servers
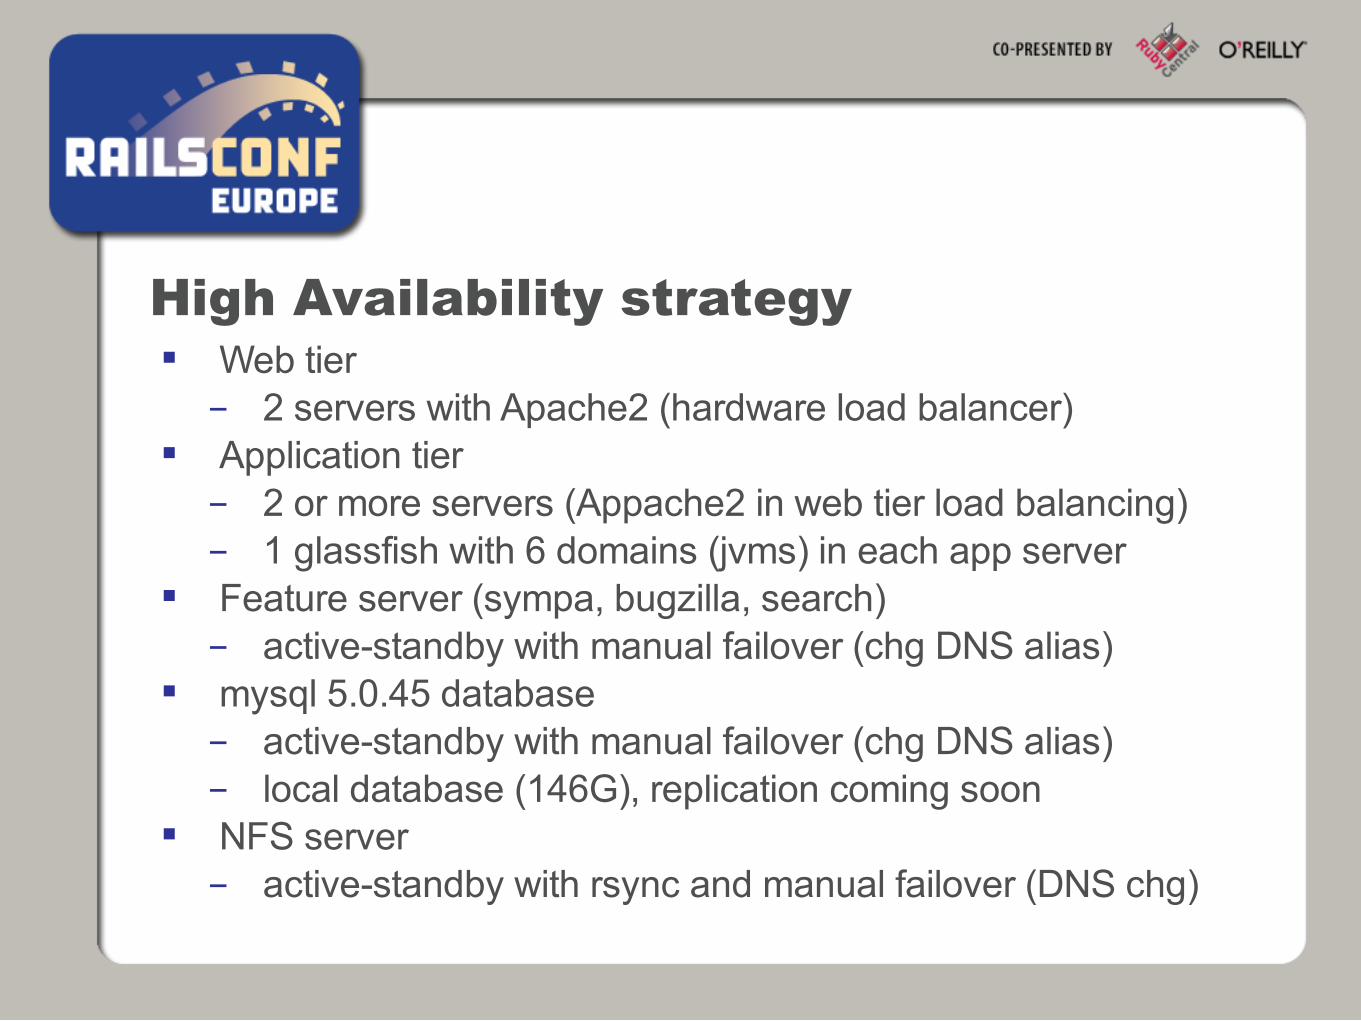
High Availability strategy Web tier- 2 servers with Apache2 (hardware load balancer)
Application tier- 2 or more servers (Appache2 in web tier load balancing)- 1 glassfish with 6 domains (jvms) in each app server
Feature server (sympa, bugzilla, search)- active-standby with manual failover (chg DNS alias)
mysql 5.0.45 database- active-standby with manual failover (chg DNS alias)- local database (146G), replication coming soon
NFS server- active-standby with rsync and manual failover (DNS chg)
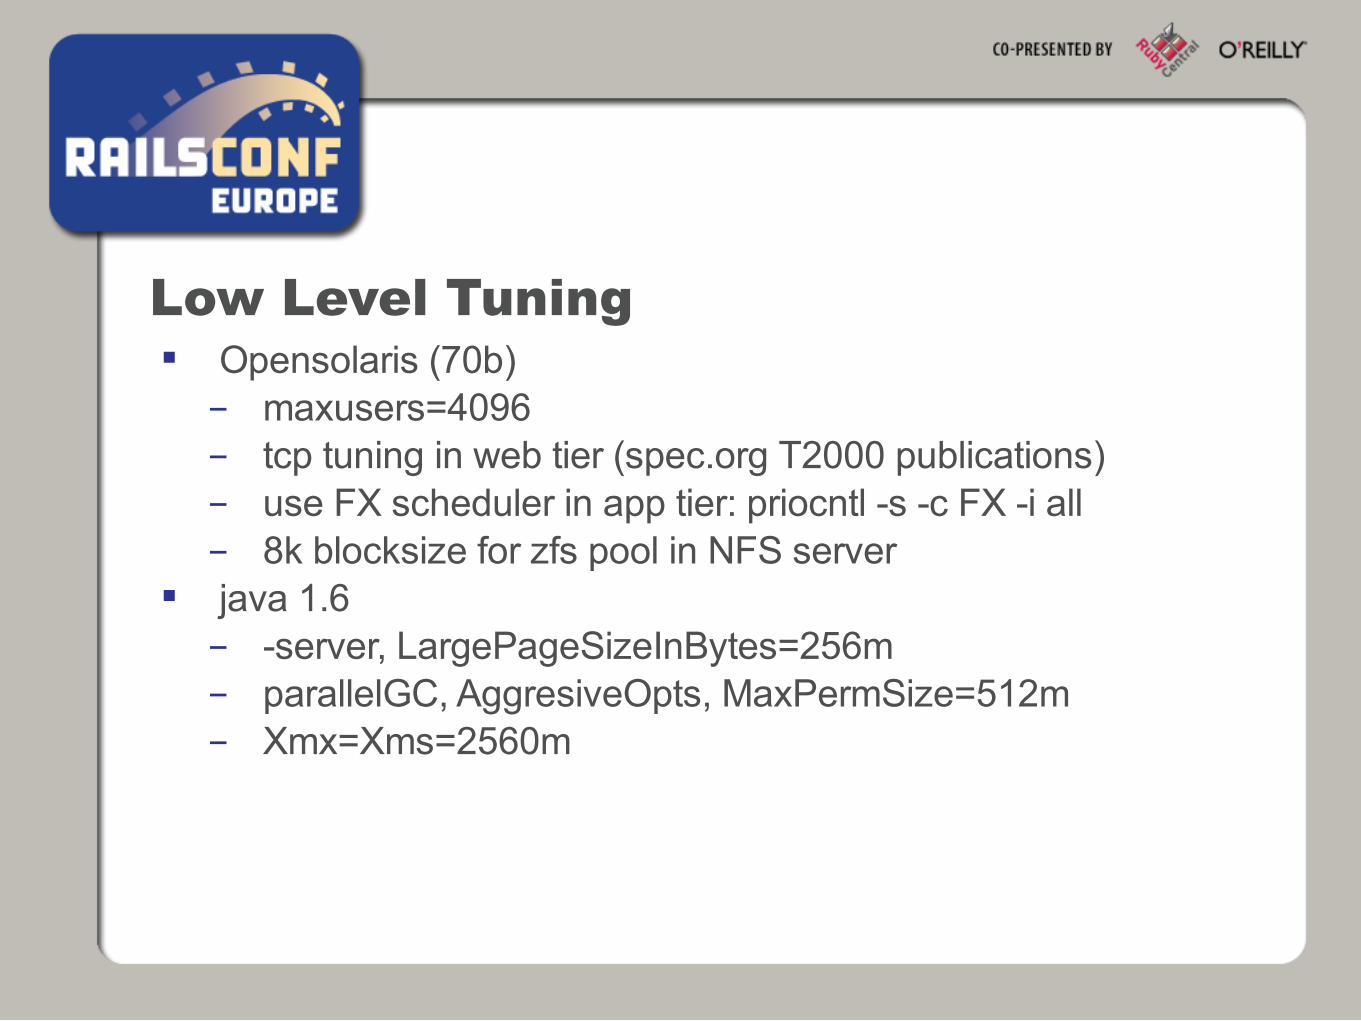
Low Level Tuning Opensolaris (70b)- maxusers=4096- tcp tuning in web tier (spec.org T2000 publications)- use FX scheduler in app tier: priocntl -s -c FX -i all- 8k blocksize for zfs pool in NFS server
java 1.6- -server, LargePageSizeInBytes=256m - parallelGC, AggresiveOpts, MaxPermSize=512m- Xmx=Xms=2560m
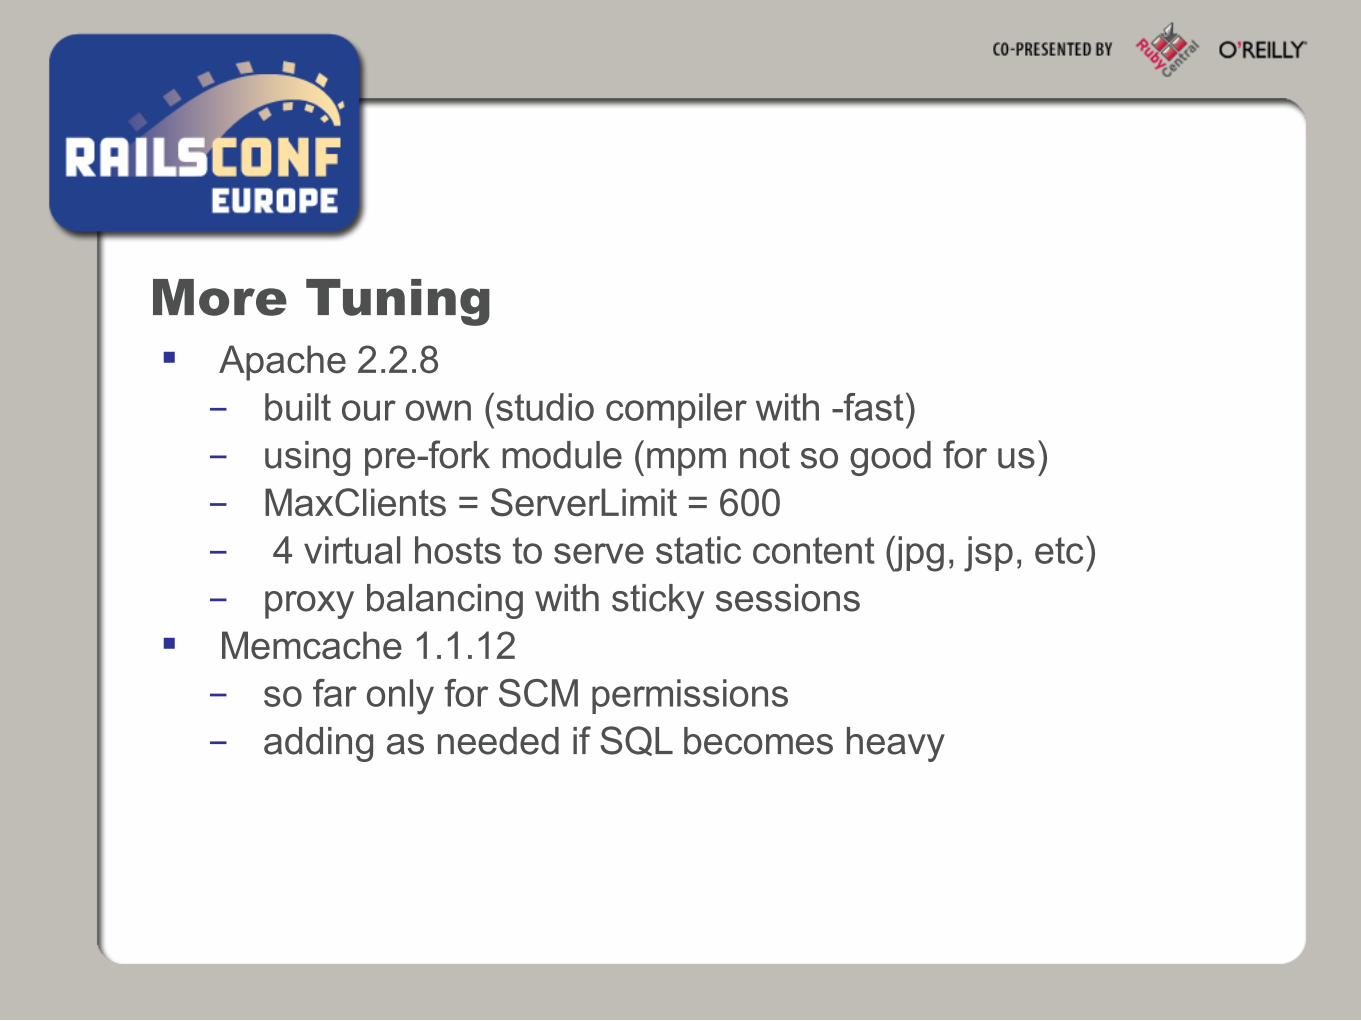
More Tuning Apache 2.2.8- built our own (studio compiler with -fast)- using pre-fork module (mpm not so good for us)- MaxClients = ServerLimit = 600- 4 virtual hosts to serve static content (jpg, jsp, etc)- proxy balancing with sticky sessions
Memcache 1.1.12- so far only for SCM permissions- adding as needed if SQL becomes heavy
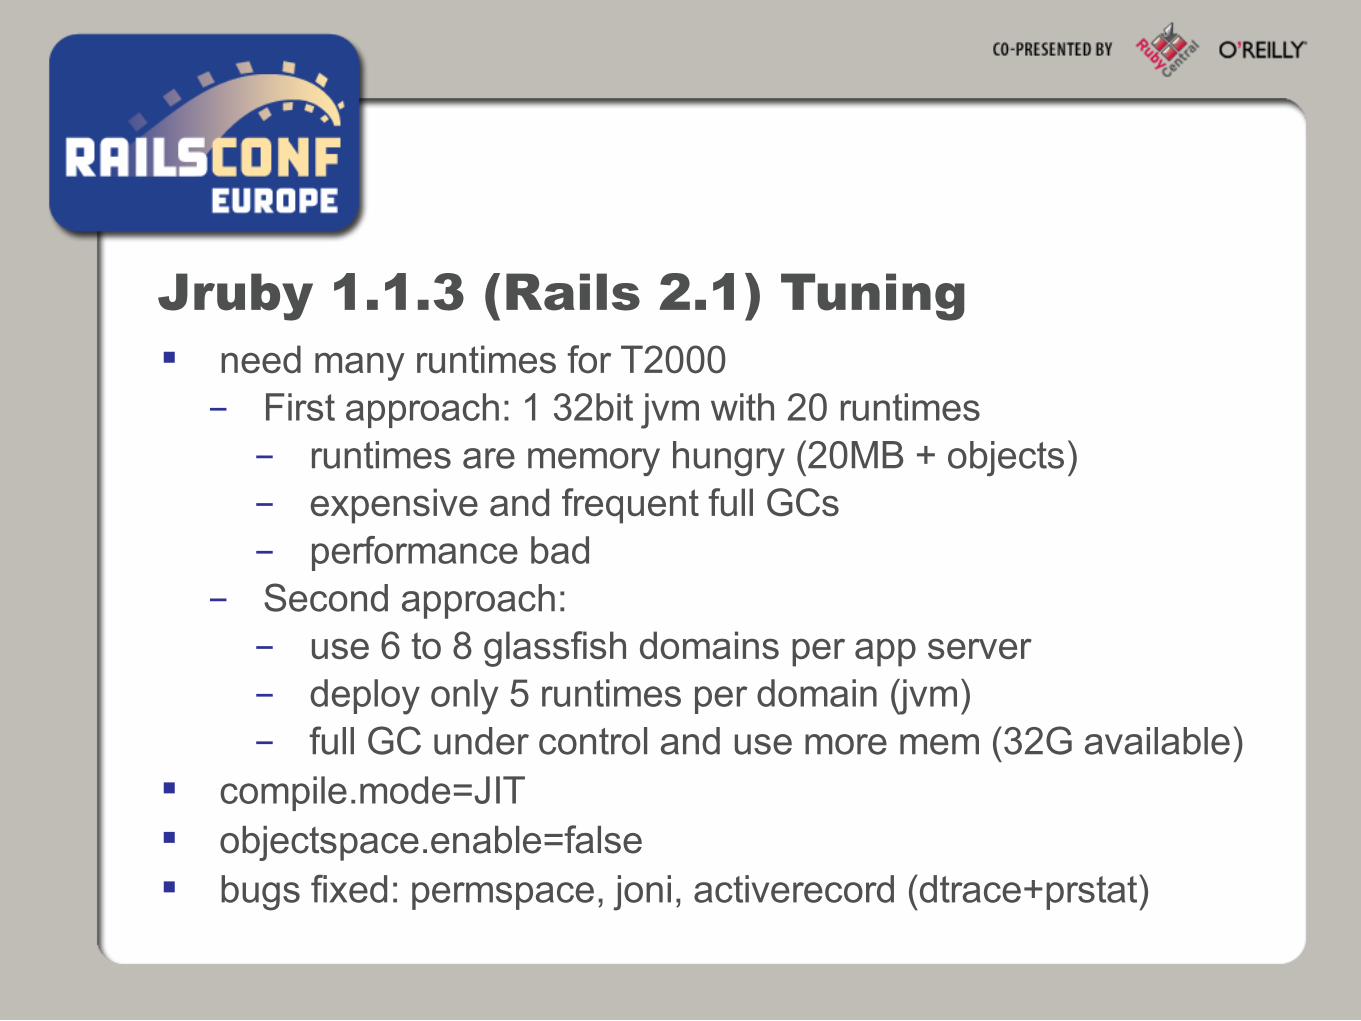
Jruby 1.1.3 (Rails 2.1) Tuning need many runtimes for T2000- First approach: 1 32bit jvm with 20 runtimes- runtimes are memory hungry (20MB + objects)- expensive and frequent full GCs- performance bad
- Second approach:- use 6 to 8 glassfish domains per app server- deploy only 5 runtimes per domain (jvm)- full GC under control and use more mem (32G available)
compile.mode=JIT objectspace.enable=false bugs fixed: permspace, joni, activerecord (dtrace+prstat)

Glassfish Tuning 5 acceptor-threads 5 request-processing threads (and warbler) connection-pool validation = table accepts lots of connections- connection-pool queue-size-in-bytes=30000- connection-pool max-pending-count=30000
-Dcom.sun.enterprise.server.ss.ASQuickStartup=false
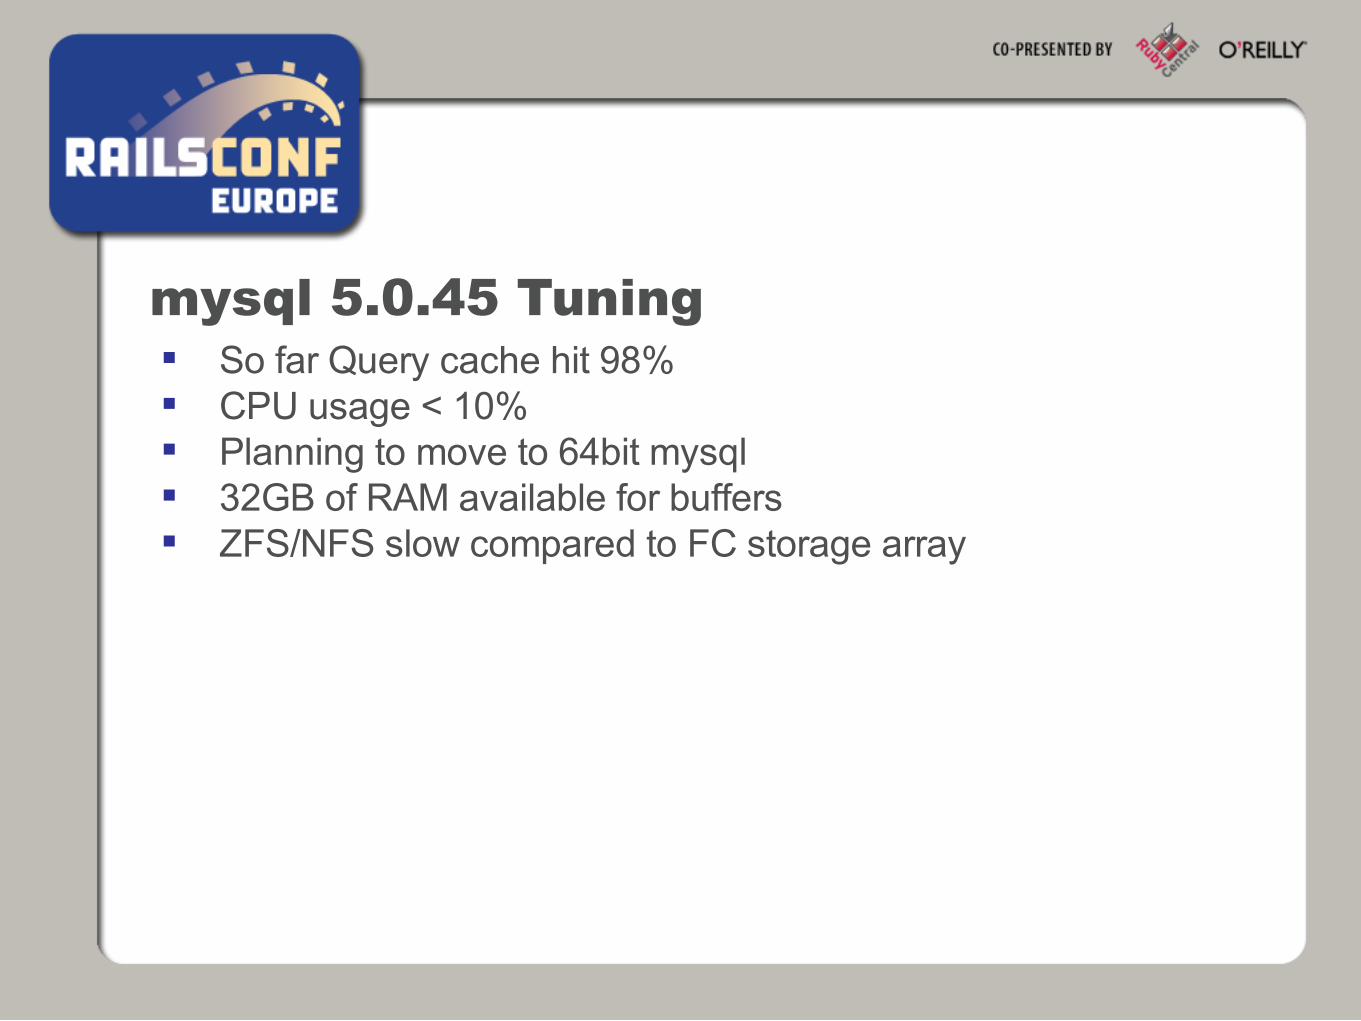
mysql 5.0.45 Tuning So far Query cache hit 98% CPU usage < 10% Planning to move to 64bit mysql 32GB of RAM available for buffers ZFS/NFS slow compared to FC storage array
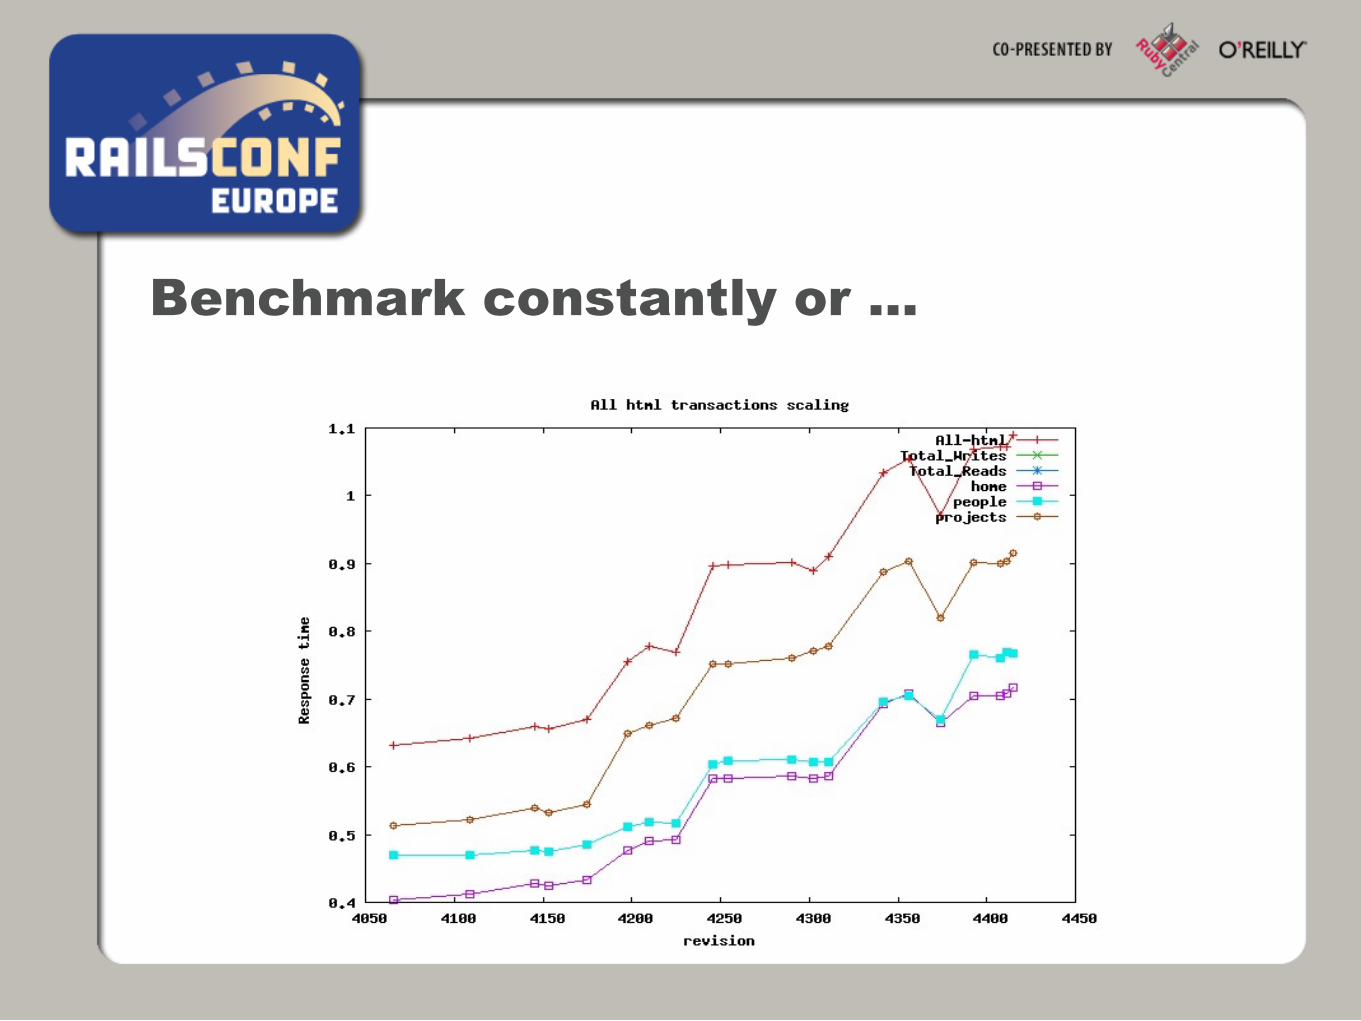
Benchmark constantly or ...
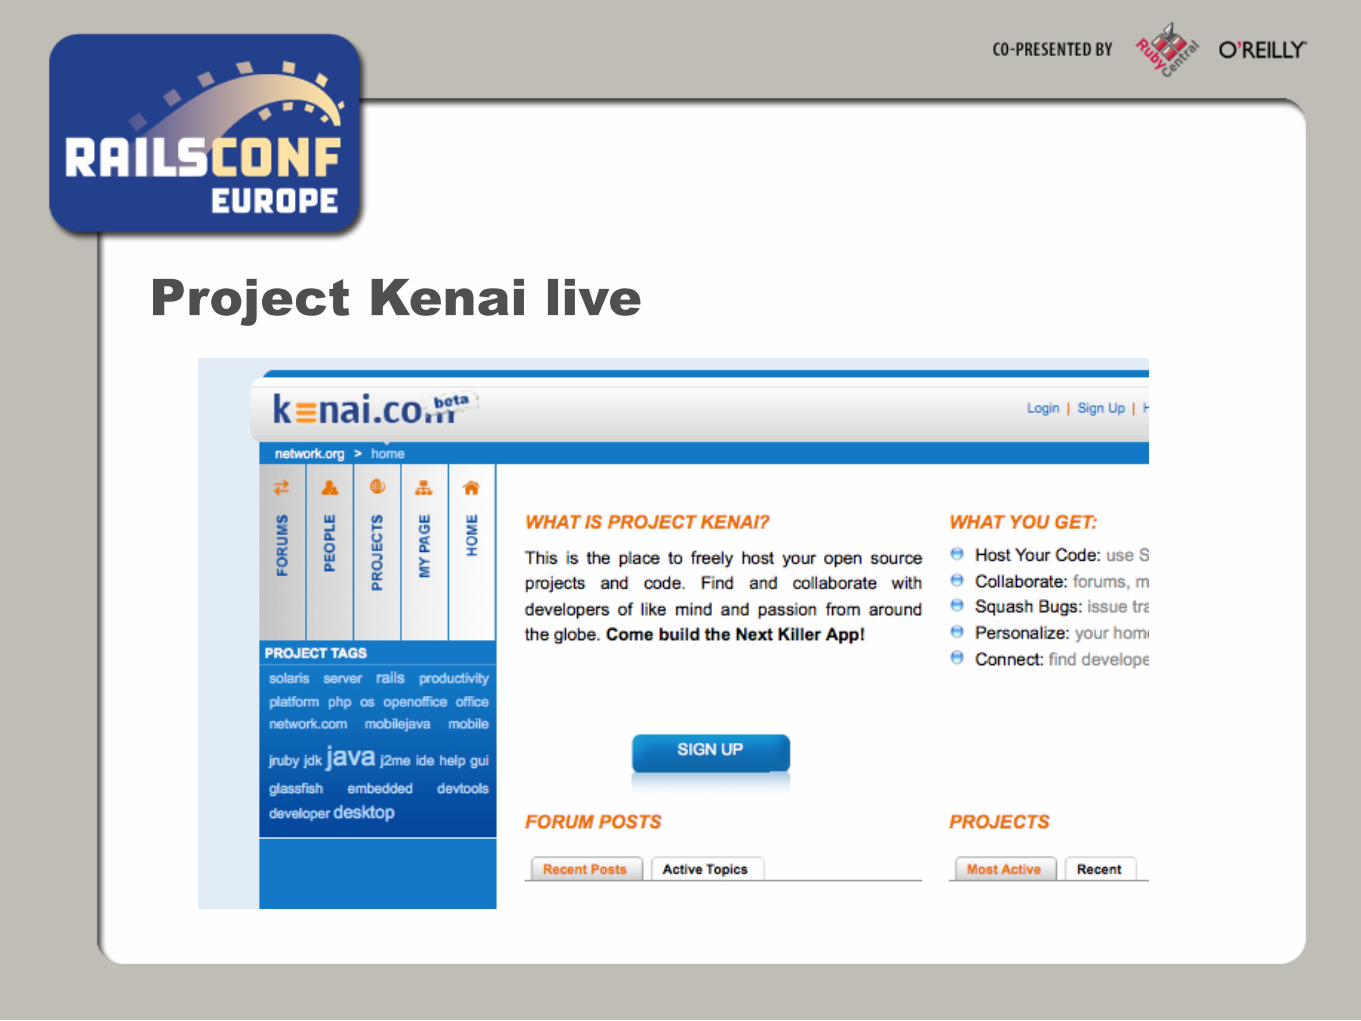
Project Kenai live
References Nick Sieger (team leader) - http://blog.nicksieger.com
Dtrace toolkit- http://opensolaris.org/os/community/dtrace/dtracetoolkit/
More Kenai performance details- http://jfdo.blogspot.com
Project Kenai- http://kenai.com
Solaris Inernals (Richard McDougall)- http://www.solarisinternals.com

Q&A