Embed Size (px)
Citation preview
Achieving Increased Uptime with Machine Intelligence
A SignifAI technical paper
SignifAI Product Management May 2017
A SIGNIFAI TECHNICAL PAPER | 2
IntroductionThese days, when a system goes down it has the potential to affect
just about every part of a business. The consequences can range from
customers being unable to purchase goods and services, to unhappy
users negatively discussing the brand on social media, to partners
being unable to collaborate, to employees failing to stay productive
because their tools are unavailable. It is therefore no surprise that
when such a high-stakes responsibility falls upon a typically small
TechOps team, the day-to-day stress for them is going very high.
In this paper we’ll explore how machine intelligence can enable
TechOps teams to increase their system uptime by identifying and
prioritizing critical issues automatically, quickly getting to the root
cause of an issue with its full context (including logs, events and
metrics), formulating accurate remediations faster and finally, surfacing
powerful correlations that can lead to deep insights about potential
issues which may threaten uptime in the future..
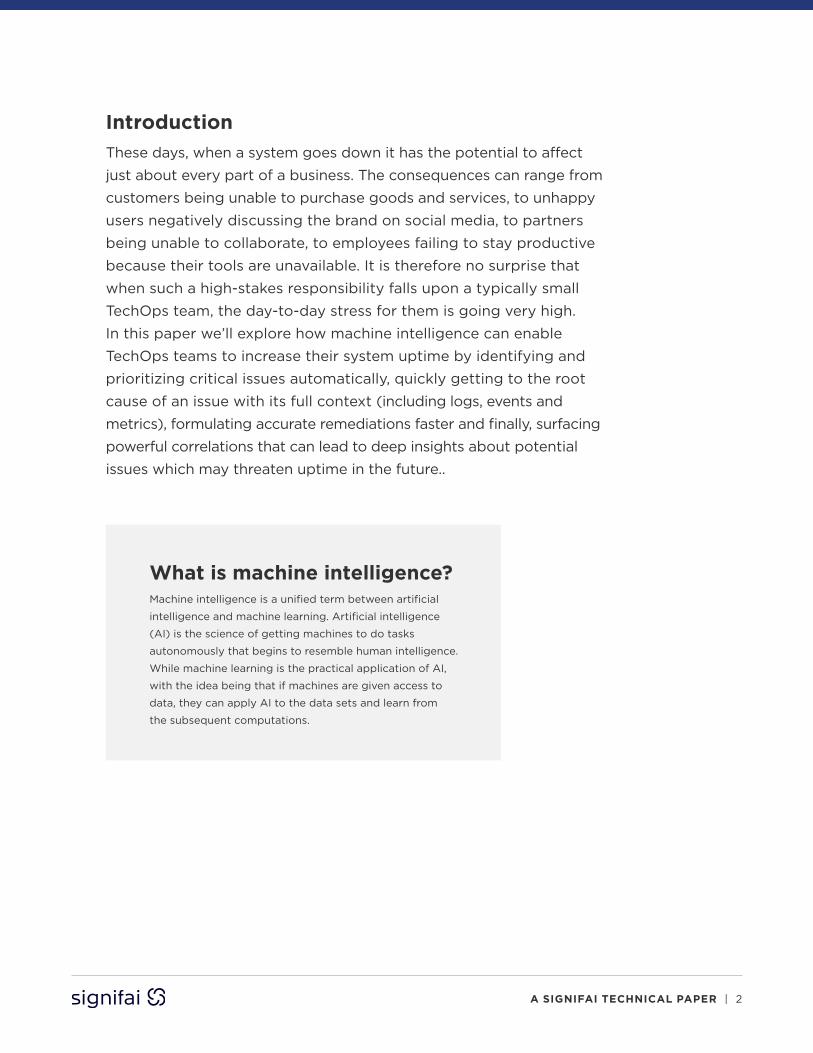
What is machine intelligence?Machine intelligence is a unified term between artificial
intelligence and machine learning. Artificial intelligence
(AI) is the science of getting machines to do tasks
autonomously that begins to resemble human intelligence.
While machine learning is the practical application of AI,
with the idea being that if machines are given access to
data, they can apply AI to the data sets and learn from
the subsequent computations.
A SIGNIFAI TECHNICAL PAPER | 3
Downtime, Prioritization and Manual ProcessesDespite having a variety of monitoring tools, many TechOps
teams still operate in a highly reactive mode when it comes
to downtime. This is to be expected when a team is in the
business of constantly fighting fires. There is simply no time
to implement processes and systems that will allow them to
identify issues before they cause outages. An organization
that spends more time reacting to issues versus
implementing proactive solutions will ultimately compound
their problems because when a team feels understaffed
relative to the work that needs to be done, employees
will churn. The result of cycling through staff is the loss of
institutional knowledge about how the systems work, how
issues were resolved in the past and those solutions which
might be relevant to an outage in the present. Employee
retention issues aside, a TechOps team faces very real
threats to uptime in the following ways:
Siloed and Incompatible Monitoring Data
Monitoring tools are great at capturing specific types of
data, but in doing so they make it very challenging to
then correlate the data with other potentially relevant,
but incompatible data formats across the application and
infrastructure stack. The variety of monitoring data from a
single system can include:
• Log data being captured by tools like Splunk,
Elastic or Loggly
• Events data generated by systems with a message-
driven architecture
• Metrics captured by APM tools like NewRelic,
AppDynamics or some in-house, custom
instrumentation
False Positives and Alert Noise Paradoxically, deploying many monitoring tools to ensure
you have enough coverage across the entire stack ends
up generating more visual, email and messaging alerts
than can be efficiently sorted through. Amongst TechOps
teams, this is commonly referred to as “Alert Noise.”
Inefficient Root Cause Analysis Even if you are able to filter “the signal from the
alert noise” to find the issues of greatest priority, the
subsequent root cause analysis can still be inefficent.
Why? Because correlating large volumes of monitoring
data of differing types in real-time makes finding the true
cause of an issue challenging even for the most skilled
engineers. When downtime happens, every second counts
and not being able to correlate all the relevant data
related to an issue may mean that whatever solution is
ultimately deployed might simply mask the underlying
problem and not get to its true remediation.
Cumbersome Knowledge Capture and Sharing Teams often struggle with how to document and share
“lessons learned” with other team members so that
applicable solutions from the past can be applied to
issues happening in the present. Sometimes the outputs
of outages and “war room” meetings are documented
in difficult to search email threads, chat logs, wikis, code
repos and spreadsheets. This leads to an organization
being highly dependent on the experience of senior
engineers who can recall solutions and their relevance to
atheparticular issue at hand. This poses an obvious risk to
the organization, especially if the engineer is not available
at the time of the outage or leaves the company.
A SIGNIFAI TECHNICAL PAPER | 4
Custom SolutionsMany TechOps teams attempt to address these challenges
through a variety of customized or point solutions which
although going a long way in alleviating a specific pain
point, do come with development and maintenance costs,
as well as functional limitations. In the next section we
examine the pros and cons of these customized solutions.
Custom Alerting Dashboards
TechOps teams often build customized dashboards using
open source tools like Grafana or Kibana. The goal of
these dashboards is to present vast amounts of data in a
visualized format for the purpose of being able to detect
patterns and draw insights. Although, custom alerting
dashboards are helpful at alleviating some of the pains
identified above, they fall short in the following ways:
• They don’t work with all data sources, doing nothing
to eliminate data silos. Kibana for example works
with log data from Elasticsearch and Grafana with
time-series databases like Graphite, InfluxDB or
OpenTSDB. These are specialized tools that create
siloed streams based on siloed data repositories.
• Despite the fact that these tools are feature rich, they
only provide data visualization. This assists in one of the
early steps of the analytical process related to getting
to an answer, but doesn’t provide a complete solution.
• Custom dashboards require constant maintenance to
remain functional if any of the underlying components
introduce breaking API changes or new data sources.
Custom Data Analysis
Custom data analysis is used by TechOps teams for the
purpose of attempting to address specific production
issues. This is typically a reactive process performed under
extreme time pressure. It involves making a first guess
at what the issue might be and where the relevant data
may be located. Next, the engineers will go searching for
the data and then gather it all in one place. The final step
involves analyzing the data and then drawing a conclusion
from it. This can be done manually or with a process that
formalizes each step.
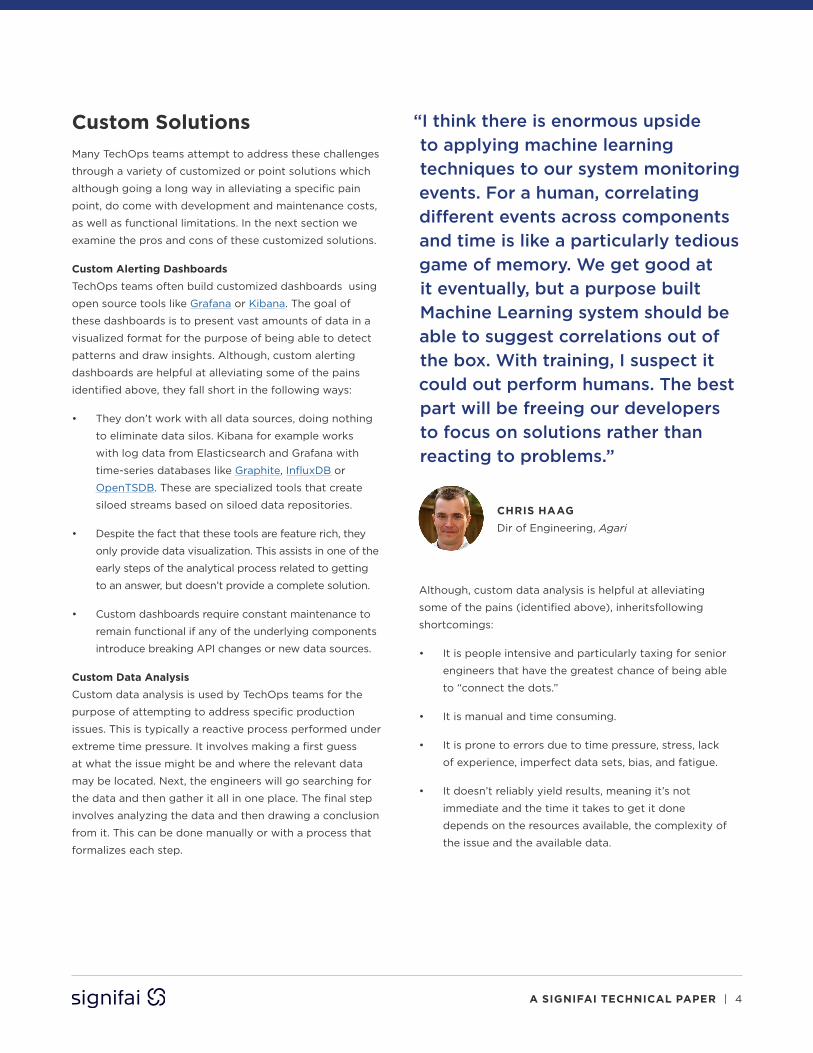
“I think there is enormous upside to applying machine learning techniques to our system monitoring events. For a human, correlating different events across components and time is like a particularly tedious game of memory. We get good at it eventually, but a purpose built Machine Learning system should be able to suggest correlations out of the box. With training, I suspect it could out perform humans. The best part will be freeing our developers to focus on solutions rather than reacting to problems.”
CHRIS HAAG Dir of Engineering, Agari
Although, custom data analysis is helpful at alleviating
some of the pains (identified above), inheritsfollowing
shortcomings:
• It is people intensive and particularly taxing for senior
engineers that have the greatest chance of being able
to “connect the dots.”
• It is manual and time consuming.
• It is prone to errors due to time pressure, stress, lack
of experience, imperfect data sets, bias, and fatigue.
• It doesn’t reliably yield results, meaning it’s not
immediate and the time it takes to get it done
depends on the resources available, the complexity of
the issue and the available data.
A SIGNIFAI TECHNICAL PAPER | 5
Manual Processes
There are also manual processes that TechOps teams can
use to address downtime. The typical five steps required
to address a production issue are:
1. Formulate a hypothesis
2. Search and gather the relevant data
3. Analyze the data and draw conclusions that may or
may not validate the initial hypothesis
4. Decide on a course of action to best address the issue
5. Verify that the issue is fixed, otherwise revisit the
above and repeat
The manual processes a TechOps team would employ to
resolve an issue will inherit all the limitations that humans
have in terms of their ability to make sense of a given
range of issues and on analyzing a large data set, over a
period of time, in a consistent way. Humans also have the
ability to get distracted, especially if they are receiving a
large quantity of noisy alerts.
Point Solutions
Point solutions are another method for TechOps teams to
employ which includes things like:
• Anomaly detection on time-series data, for example:
Anodot
• Log monitoring, for example: Splunk or Sumologic
• Event aggregation, for example: BigPanda
• Network monitoring, for example: Kentik
Point solutions attempt to address the need for
visualizations on a specific part of the environment, or some
very specific type of analysis, on a set of consistent data.
Although point solutions can alleviate some very specific
pains, they fall short in that they only answer very specific
questions that don’t provide the full coverage that
encompasses the broad mission of a TechOps team, which
is to ensure customer SLAs, internal system availability
and reliability. They can be useful, but need to be
complemented with additional tooling to compensate for
each tool’s inherent limitations.
A SIGNIFAI TECHNICAL PAPER | 6
Unlocking the Power of Machine IntelligenceSignifAI is machine intelligence that helps TechOps teams
get to accurate answers faster by finding correlations in
real-time, among very large volumes of log, event and
metrics monitoring data. SignifAI makes this possible with
its Deep Knowledge™ correlations which are driven by
algorithms and the collective expertise of the TechOps
team. This enables a team to get to root causes quickly,
regardless of the seniority of the engineers currently on
shift. And because SignifAI is a machine, it never leaves the
team and therefore retains perfect memory. This means
SignifAI can match the cause and resolution of an issue
from the past, with an issue happening right now. These
powerful correlations also unlock predictive Insights &
Answers™ to issues that could threaten uptime in the
future. When TechOps teams deliver more uptime, they
finally find the time to work on more complex problems
that require creative solutions...precisely the things that
machines can’t do.
Prioritize and Take Action
SignifAI makes it easy to prioritize alerts that signal
threats to uptime or performance. This is achieved
through the automatic correlation of alerts from all of
your various monitoring systems into unified incidents
prioritized by severity. Not only does it become simple
to know where to start taking action, but SignifAI also
delivers a recommended solution with each alarm.
Fast Root Cause Analysis
Because SignifAI automatically correlates log, event
and metrics data from disparate monitoring systems, it
helps you get to the true cause of an issue faster versus
checking multiple tools or having to confer with multiple
colleagues. Full visibility and context about a problem
means the solutions you implement won’t mask more
serious underlying problems.
Get Accurate Answers Automatically
SignifAI provides relevant, uniquely tailored solutions to
any problems it detects in real-time or predictively to
those that may occur in the future. These solutions are
informed by a combination of SignifAI’s learning engine
and the TechOps team’s operational expertise.
Capture and Transfer Knowledge
SignifAI understands that a major challenge TechOps
teams struggle with is how to efficiently capture the
knowledge their collective team possesses. A subsequent
challenge is how to make that knowledge easily accessible
to junior Site Reliability Engineers (SRE) so they can
perform closer to the level of a senior engineer. This only
becomes possible if the solutions are readily available,
indexed and can be correlated accurately against issues.
What is Deep Knowledge™?SignifAI’s term for knowledge represented
in SignifAI whether from implicit decisions
and user actions or explicit decisions.
What are Insights and Answers™?These are the outputs SignifAI produces.
SignifAI generates insights that are
unique to an environment, plus provides
diagnostics and recommendations that
informs potential answers into the root
cause of an issue.
A SIGNIFAI TECHNICAL PAPER | 7
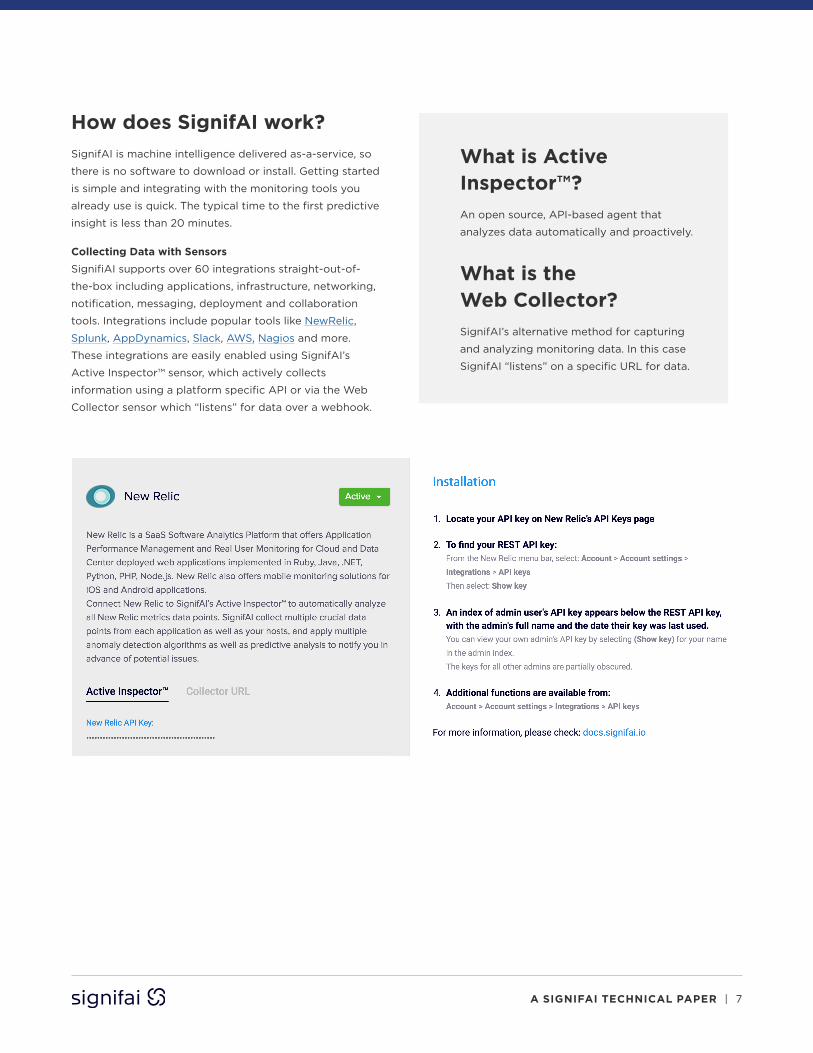
How does SignifAI work?SignifAI is machine intelligence delivered as-a-service, so
there is no software to download or install. Getting started
is simple and integrating with the monitoring tools you
already use is quick. The typical time to the first predictive
insight is less than 20 minutes.
Collecting Data with Sensors
SignifiAI supports over 60 integrations straight-out-of-
the-box including applications, infrastructure, networking,
notification, messaging, deployment and collaboration
tools. Integrations include popular tools like NewRelic,
Splunk, AppDynamics, Slack, AWS, Nagios and more.
These integrations are easily enabled using SignifAI’s
Active Inspector™ sensor, which actively collects
information using a platform specific API or via the Web
Collector sensor which “listens” for data over a webhook.
What is Active Inspector™?An open source, API-based agent that
analyzes data automatically and proactively.
What is the Web Collector?SignifAI’s alternative method for capturing
and analyzing monitoring data. In this case
SignifAI “listens” on a specific URL for data.
A SIGNIFAI TECHNICAL PAPER | 8
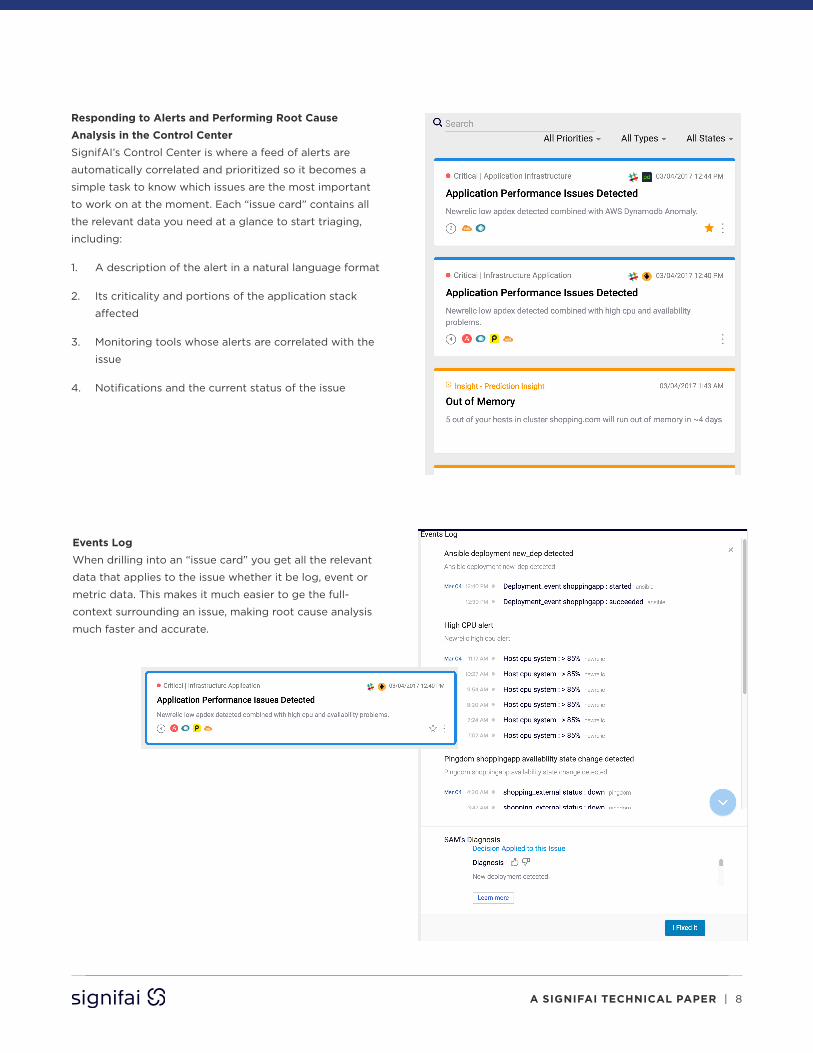
Responding to Alerts and Performing Root Cause Analysis in the Control Center SignifAI’s Control Center is where a feed of alerts are
automatically correlated and prioritized so it becomes a
simple task to know which issues are the most important
to work on at the moment. Each “issue card” contains all
the relevant data you need at a glance to start triaging,
including:
1. A description of the alert in a natural language format
2. Its criticality and portions of the application stack
affected
3. Monitoring tools whose alerts are correlated with the
issue
4. Notifications and the current status of the issue
Events Log
When drilling into an “issue card” you get all the relevant
data that applies to the issue whether it be log, event or
metric data. This makes it much easier to ge the full-
context surrounding an issue, making root cause analysis
much faster and accurate.
A SIGNIFAI TECHNICAL PAPER | 9
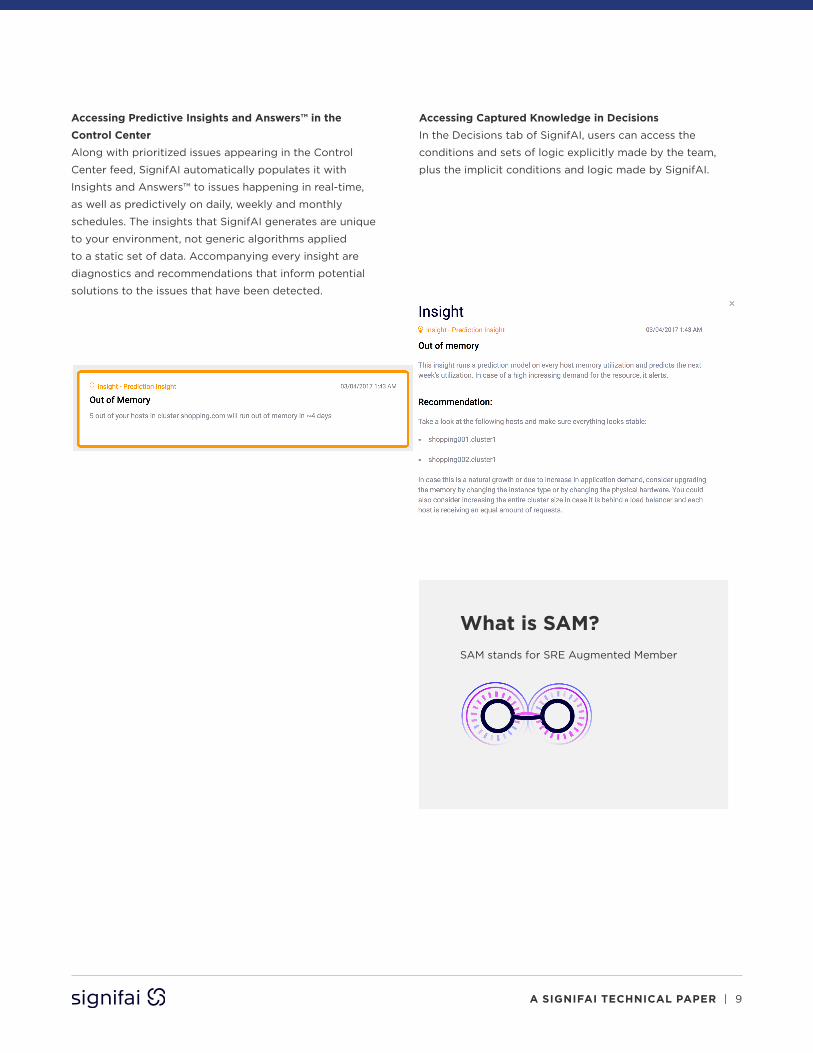
Accessing Predictive Insights and Answers™ in the Control Center Along with prioritized issues appearing in the Control
Center feed, SignifAI automatically populates it with
Insights and Answers™ to issues happening in real-time,
as well as predictively on daily, weekly and monthly
schedules. The insights that SignifAI generates are unique
to your environment, not generic algorithms applied
to a static set of data. Accompanying every insight are
diagnostics and recommendations that inform potential
solutions to the issues that have been detected.
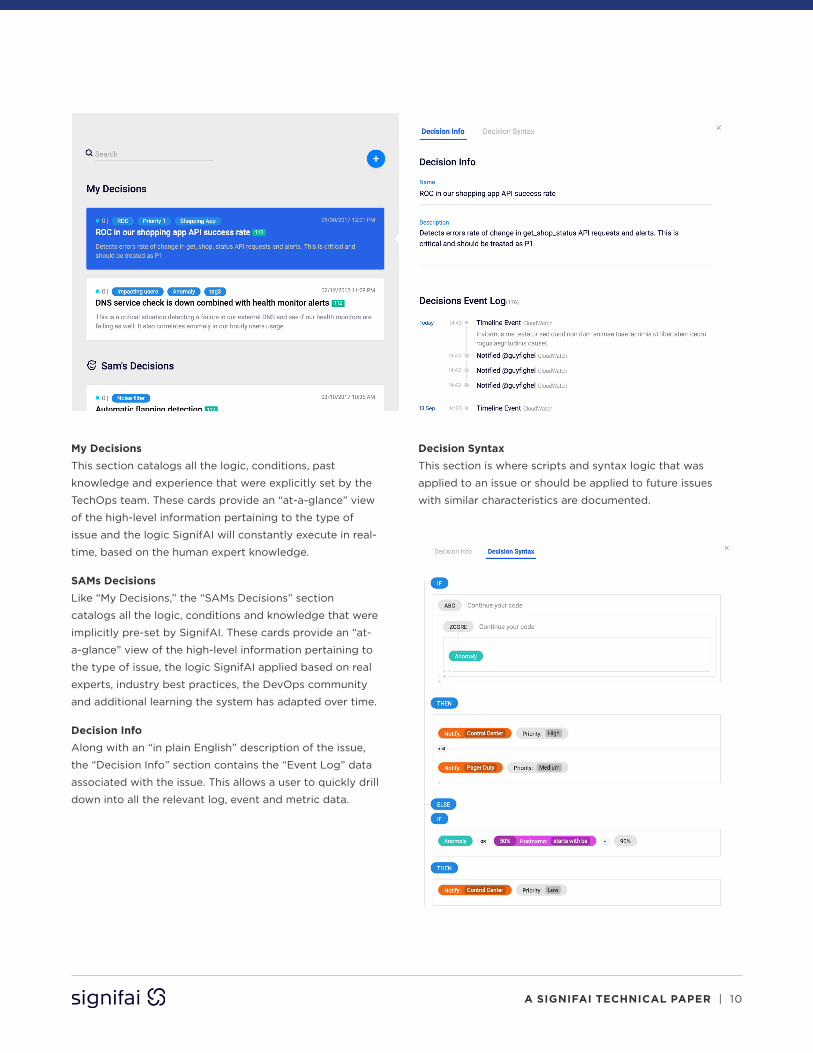
Accessing Captured Knowledge in Decisions
In the Decisions tab of SignifAI, users can access the
conditions and sets of logic explicitly made by the team,
plus the implicit conditions and logic made by SignifAI.
What is SAM?SAM stands for SRE Augmented Member
A SIGNIFAI TECHNICAL PAPER | 10
My Decisions
This section catalogs all the logic, conditions, past
knowledge and experience that were explicitly set by the
TechOps team. These cards provide an “at-a-glance” view
of the high-level information pertaining to the type of
issue and the logic SignifAI will constantly execute in real-
time, based on the human expert knowledge.
SAMs Decisions
Like “My Decisions,” the “SAMs Decisions” section
catalogs all the logic, conditions and knowledge that were
implicitly pre-set by SignifAI. These cards provide an “at-
a-glance” view of the high-level information pertaining to
the type of issue, the logic SignifAI applied based on real
experts, industry best practices, the DevOps community
and additional learning the system has adapted over time.
Decision Info Along with an “in plain English” description of the issue,
the “Decision Info” section contains the “Event Log” data
associated with the issue. This allows a user to quickly drill
down into all the relevant log, event and metric data.
Decision Syntax This section is where scripts and syntax logic that was
applied to an issue or should be applied to future issues
with similar characteristics are documented.
A SIGNIFAI TECHNICAL PAPER | 11
ConclusionIn this paper we looked at the pros and cons of varying
custom solutions, as well as, the application of machine
intelligence to the major challenges facing TechOps
teams today. Machine intelligence has the benefit of
having a perfect memory of past issues and solutions,
being “on call” 24/7 with the capacity to correlate large
volumes of data in real-time,. When applied correctly,
machine intelligence can help a TechOps team increase
their system uptime by identifying and prioritizing
critical issues automatically, quickly getting to the root
cause of issue with its full context, formulating accurate
remediations faster and leveraging powerful correlations
to unlock deep insights to potential threats that may
threaten uptime in the future.
Next Steps• Sign up for a FREE trial of SignifAI
• Watch the product demo
• Download the SignifAI datasheet
• Learn about SignifAI the company
About SignifaiSignifAI was founded by a team of TechOps engineers
who faced the challenge of delivering uptime at scale for
years. Frustrated by available solutions, they decided to
take a new approach with machine intelligence. SignifAI
is a cloud-based machine intelligence platform that
makes use of a TechOps team’s operational expertise,
artificial intelligence and their existing monitoring tools to
automate the identification, prevention and remediation
of production problems. SignifAI is backed by Highland
Capital Partners and headquartered in Sunnyvale, CA,
with offices in Tel Aviv.
For more information, visit: https://signifai.io