Embed Size (px)
DESCRIPTION
Achieving Our Mission. Using Continuous Quality Improvement to Promote and Enhance Community Corrections Kimberly Gentry Sperber, Ph.D. Efforts To Date. “What Works” Literature Principles of Effective Interventions Growing evidence based on individual program evaluations and meta-analyses - PowerPoint PPT Presentation
Citation preview

Achieving Our Mission
Using Continuous Quality Improvement to Promote and Enhance Community Corrections
Kimberly Gentry Sperber, Ph.D.
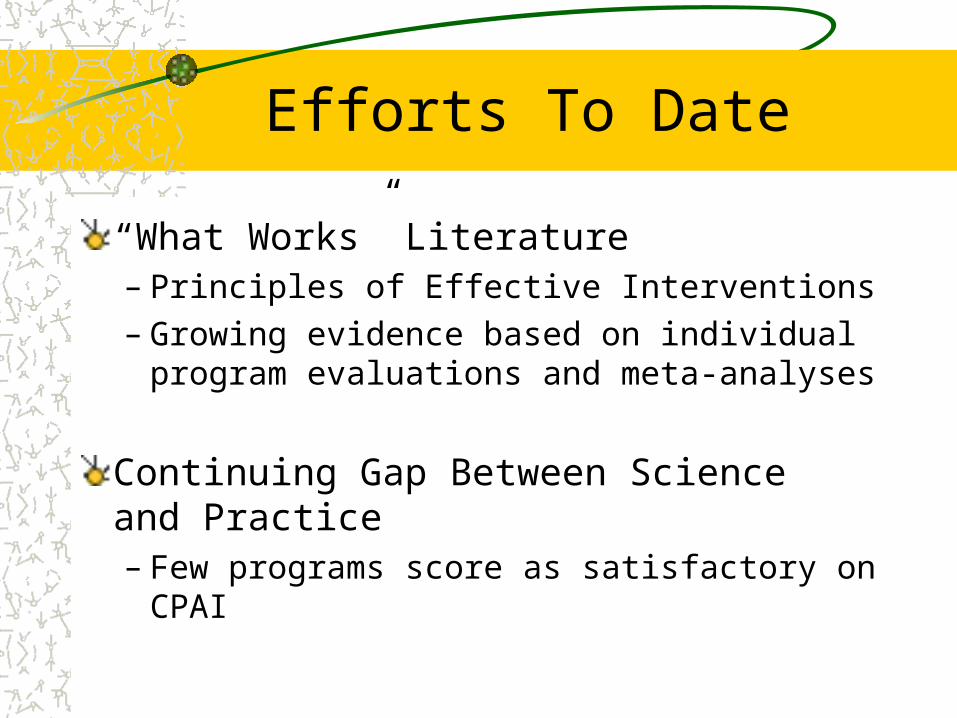
Efforts To Date
“What Works” Literature– Principles of Effective Interventions– Growing evidence based on individual program
evaluations and meta-analyses
Continuing Gap Between Science and Practice– Few programs score as satisfactory on CPAI
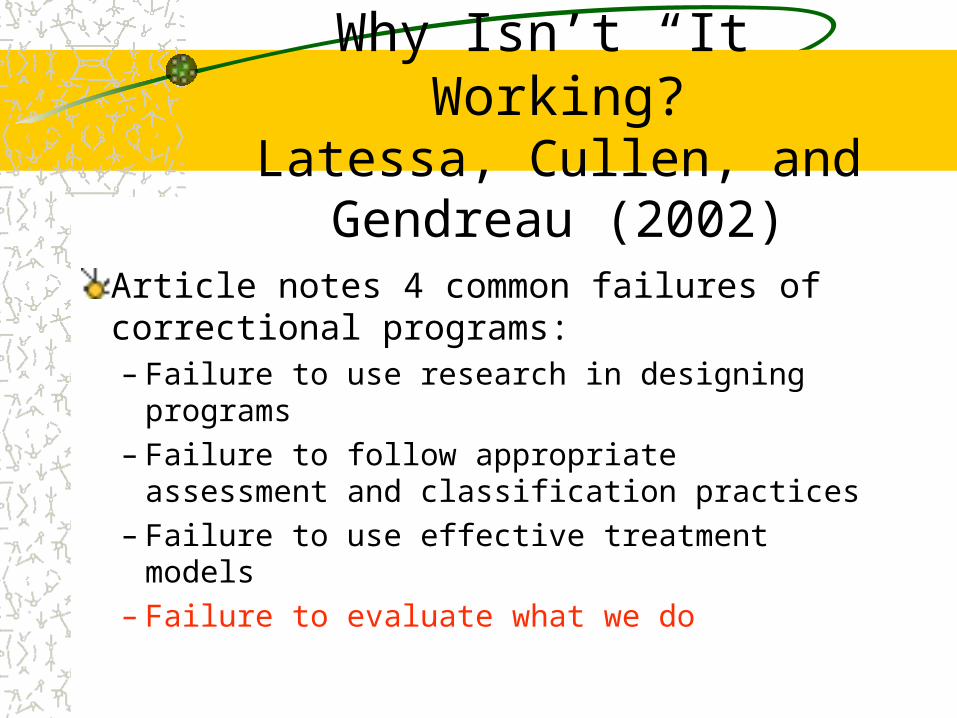
Why Isn’t “It” Working?Latessa, Cullen, and Gendreau (2002)
Article notes 4 common failures of correctional programs:– Failure to use research in designing programs– Failure to follow appropriate assessment and
classification practices– Failure to use effective treatment models– Failure to evaluate what we do

CPAI Data as Evidence of Fidelity
Lowenkamp and Latessa (2005)Examined data from 38 residential correctional programs for adultsLooked at relationship between program fidelity and program effectiveness.Program fidelity was assessed using the CPAI.Found significant correlation between fidelity and effectiveness– CPAI scores correlated to reincarceration

Lowenkamp and Latessa FindingsContinued
Differences in recidivism rates based on CPAI scores:– Scores of 0-49% demonstrated 1.7% reduction
compared to comparison group.– Scores of 50-59% demonstrated 8.1% reduction.– Scores of 60-69% demonstrated 22% reduction.

CPAI Data Continued
Holsinger (1999)Examined data from Adolescent Community Correctional Facilities in OhioLooked at relationship between program fidelity and program effectiveness.Program fidelity was assessed using the CPAI.Outcome measures examined included any court contact, felony or misdemeanor, felony, personal offense, and commitment to a secure facility

CPAI Data Continued
Total composite score significantly correlated with all outcome measures.Each individual domain of the CPAI also significantly correlated with all of the outcomes– Program Implementation– Client Assessment– Program Characteristics– Staff Quality– Evaluation

More Fidelity Research
Landenberger and Lipsey (2005)– Brand of CBT didn’t matter but quality of implementation did.– Implementation defined as low dropout rate, close monitoring of quality and fidelity,
and adequate training for providers.
Schoenwald et al. (2003) – Therapist adherence to the model predicted post-treatment reductions in problem
behaviors of the clients.
Henggeler et al. (2002)– Supervisors’ expertise in the model predicted therapist adherence to the model.
Sexton (2001)– Direct linear relationship between staff competence and recidivism reductions.

More Fidelity Research Cont’d.
Schoenwald and Chapman (2007)– A 1-unit increase in therapist adherence score predicted 38% lower rate of
criminal charges 2 years post-treatment– A 1-unit increase in supervisor adherence score predicted 53% lower rate of
criminal charges 2 years post-treatment.
Schoenwald et al. (2007)– When therapist adherence was low, criminal outcomes for substance abusing
youth were worse relative to the outcomes of the non-substance abusing youth.
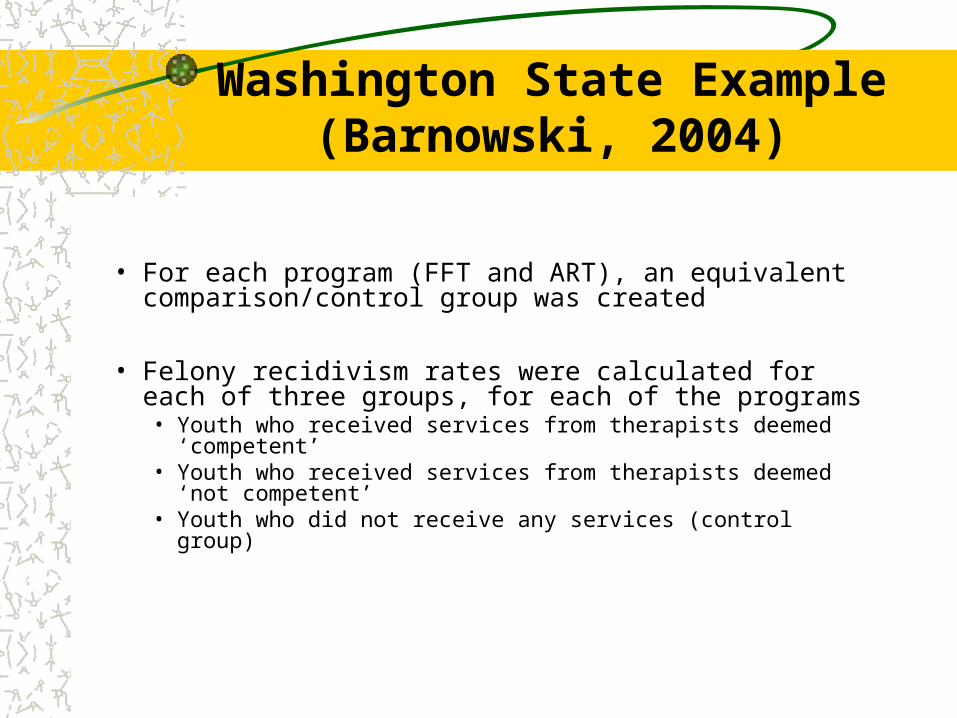
Washington State Example(Barnowski, 2004)
• For each program (FFT and ART), an equivalent comparison/control group was created
• Felony recidivism rates were calculated for each of three groups, for each of the programs• Youth who received services from therapists deemed ‘competent’• Youth who received services from therapists deemed ‘not competent’• Youth who did not receive any services (control group)

Family Functional Therapy Results: % New Felony
139 6
2519
11
3227
17
0
10
20
30
40
50
60
70
6 Months 12 Months 18 Months
FFT Not Competent
Control group
FFT Competent
Results calculated using multivariate models in order to control for potential differences between groups

Project Greenlight
Short-term prison-based reentry program in New York– CBT Skills Training– Employment Services– Housing Services– Drug Education and Awareness– Family Counseling– Practical Skills Training– Community-Based Networks– Familiarity With Parole– Individualized Release Plans

Project Greenlight Benefits
Participants received more service referralsParticipants reported more contacts with community services after releaseParticipants demonstrated significantly more familiarity with parole conditionsParticipants were more positive about parole

But Did It Work?
17.214.4 13
34.1
26.824.2
0
5
10
15
20
25
30
35
Arrests at 6 Months Arrests at 12Months
Greenlight
No Services
Existing TransServices

What Went Wrong?
Violation of the risk principle– Ceased use of risk assessment instrument when staff deemed process
too cumbersome
Violation of the need principle– All offenders received same services whether needed or not
Violation of the fidelity principle– Staff modified delivery of the CBT curriculum (shortened the duration,
increased frequency, increased class size)
Differential staff competence– Certain case managers produced worse outcomes

UC Halfway House/CBCF Study in Ohio: A Look at Fidelity Statewide
Average Treatment Effect was 4% reduction in recidivismLowest was a 41% Increase in recidivismHighest was a 43% reduction in recidivism
Programs that had acceptable termination rates, had been in operation for 3 years or more, had a cognitive behavioral program, targeted criminogenic needs, used role playing in almost every session, and varied treatment and length of supervision by risk had a 39% reduction in recidivism
What Do We Know About Fidelity?
Fidelity is related to successful outcomes (i.e., recidivism reductions).Poor fidelity can lead to null effects or even iatrogenic effects.Fidelity can be measured and monitored.Fidelity cannot be assumed.

Monitoring Fidelity Through a CQI Process
QA versus CQICQI – What Is It?InfrastructurePeer ReviewIndicators
Client SatisfactionAction PlanningProcess EvaluationOutcome EvaluationBenefits

QA – The Old Way
Retrospective review processEmphasis on regulatory and contract complianceCatching people being bad leads to hide and seek behavior
CQI – The New Way
CQI is a prospective processHolds quality as a central priority within the organizationFocus on customer needs; relies on feedback from internal and external customersEmphasizes systematic use of dataNot blame-seekingTrust, respect, and communicationMove toward staff responsibility for quality , problem solving and ownership of services

Objectives of CQI
To facilitate the Agency’s missionTo ensure appropriateness of servicesTo improve efficiency of services/processesTo improve effectiveness of directing services to client needsTo foster a culture of learningTo ensure compliance with funding and regulatory standards

Building a CQI Process
Formal infrastructureCore Elements– Documentation Review– Indicators
• Process Versus Outcome• Performance Goals• Action Planning
– Customer Satisfaction• Clients, Staff, Stakeholders
– Program Evaluation

Process Evaluation
Sample Projects

Process Evaluation
Are we serving our target population?Are the services being delivered?Did we implement the program as designed (tx fidelity)?Are there areas that need improvement?

Example 1Review of LSI Scores
Reviewed all open cases at Facility ARecorded LSI risk category, UC Risk category, and name of interviewer77.5% of cases reviewed did not have a match between staff rating and UC rating
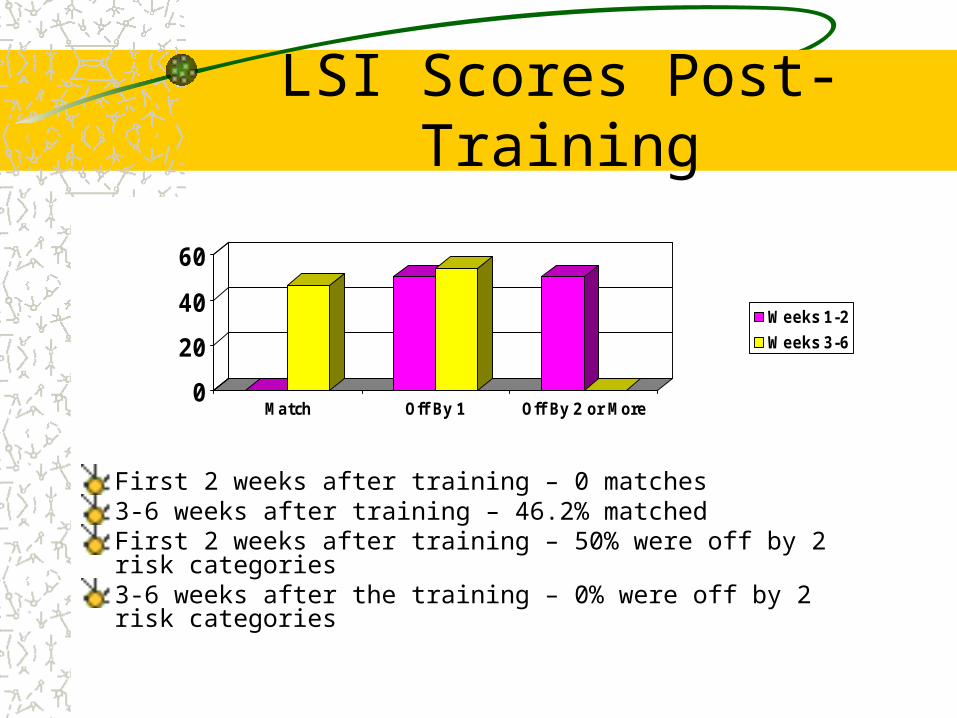
LSI Scores Post-Training
First 2 weeks after training – 0 matches3-6 weeks after training – 46.2% matchedFirst 2 weeks after training – 50% were off by 2 risk categories3-6 weeks after the training – 0% were off by 2 risk categories
0
20
40
60
Match Off By 1 Off By 2 or More
Weeks 1-2
Weeks 3-6

Individual LSI Reviews
Schedule of videotaped interviewsSubmitted for reviewUse of standardized audit sheetFeedback loop for staff developmentAggregate results to inform training efforts

Sample LSI Audit Items
Explained purpose of interviewAdequate use of open-ended questionsAvoided double-barreled questionsAdequate use of follow-up questionsOvercame problems such as silence or excessive talkingUsed interview guideScored correctlyTx plan clearly relates to information captured in LSI
Example2
CBIT Site Assessments
Cognitive Behavioral Implementation TeamSite visits for observation and ratingStandardized assessment processStandardized reports back to sitesCombination of quantitative data and qualitative data

Example 3 Focus Review at an Adolescent Residential Program
Examined changes in client characteristics over timeExamined successful completion over timeIdentified factors predictive of AWOL’s, incidents, and completionExamined use of role-plays in groupsPrimary predictors of intermediate outcomes:– Overall Risk (education and peers specifically also important)– Criminal History– Treatment Dosage– Involvement in incidents

Example 4
Focus Review at a Male Halfway House - Rural
Clients with any/more incidents were less likely to graduate successfully.Clients who lost a job while in the program were significantly less likely to graduate successfully.Clients with higher total LSI-R scores were also less likely to successfully complete the program.Clients with higher total LSI-R scores were more likely to engage in program rule infractions. Clients with higher intake HIT scores were more likely to engage in program rule infractions at TCC. Thus, individuals categorized as having stronger anti-social thinking patterns were more likely to be involved in incidents.Age was also found to be predictive of rule infractions, with younger clients exhibiting greater likelihood of engaging in more incidents than older clients.
Employments status was found to be a significant predictor of program incidents. Specifically, clients who lost a job while in the program were more likely to violate program rules. Dosage levels were found to be predictive of raw HIT score improvement.

Example 5Assessing Best Practices at 17 Sites
Use of ICCA Treatment Survey to establish baselineComplete again based on best practicePerform Gap AnalysisAction PlanReassess
Outcome Evaluation
Sample Projects

Outcome Evaluation
Are our services effective?Do clients benefit (change) from the services?
Intermediate outcomes– Reduction in risk– Reduction in antisocial values
Long-term outcomes– Recidivism– Sobriety
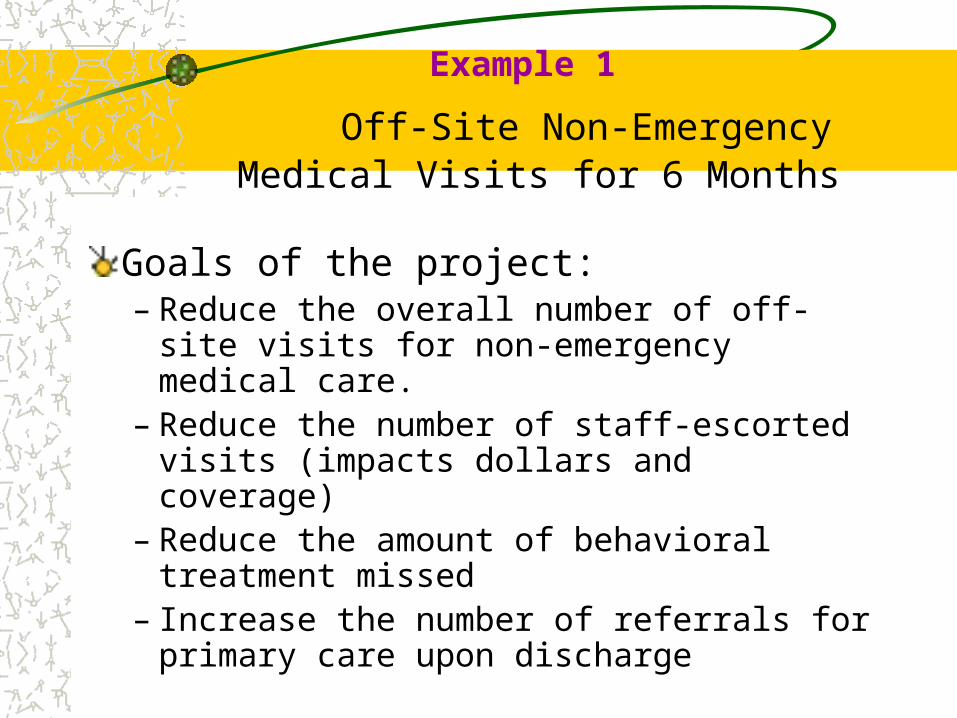
Example 1 Off-Site Non-Emergency Medical Visits for 6 Months
Goals of the project:– Reduce the overall number of off-site visits for non-
emergency medical care.– Reduce the number of staff-escorted visits (impacts
dollars and coverage)– Reduce the amount of behavioral treatment missed– Increase the number of referrals for primary care
upon discharge
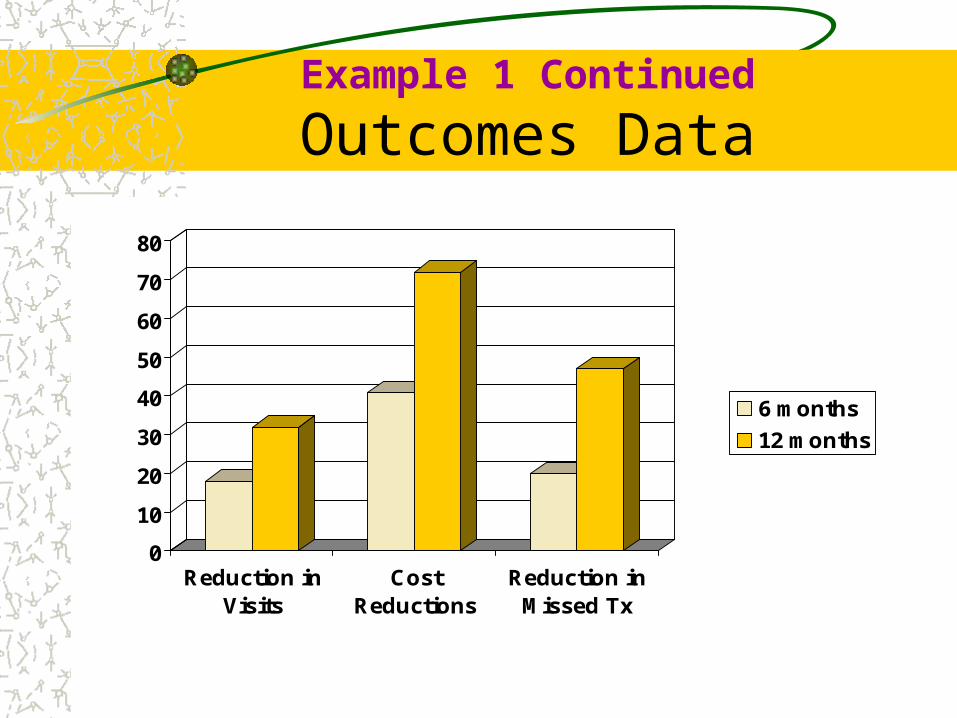
Example 1 Continued
Outcomes Data
0
10
20
30
40
50
60
70
80
Reduction inVisits
CostReductions
Reduction inMissed Tx
6 months
12 months

Sample Cost ComparisonER versus On-Site Care
ER VISIT COSTS$ 400 Average Visit $ 34 Average Staff Cost$$$ Hospital Pharmacy
TOTAL$ 434 not including pharmacy
savings
TALBERT HOUSE$ 62.50 Average Visit $ 0 off-site staff costMedication savings: samples, patient
assistance programs
TOTAL$62.50 average cost/visitSavings of $371.50/visit

Example 2 Relationship Between Intermediate Outcomes and
Recidivism
Female adolescent program’s intermediate outcome measures:– Antisocial attitudes– Self-esteem– Self-efficacy– Family functioning
Determine whether improvement on intermediate measures results in lower recidivism.

Example 2
Relationship Between Intermediate Outcomes and Recidivism
Preliminary Results– Increased self-esteem = 71%– Increased self-efficacy = 61.3%– Reduced antisocial attitudes = 82.7%
• All statistically significant
– Statistically significant improvement in family functioning:• Cohesion• Conflict• Organization• Intellectual-Cultural Orientation• Moral-Religious Emphasis

Example 3 Outcomes Pre/Post TFM Implementation
Passages Program for Girls
Table 1. Chi-Square Significant Differences % of Cases
Pre-TFM TFM χ2 p Successful Program Completion 74.50% 56.80% 6.234 0.013* Reduced Endorsement of Antisocial Attitudes 80.00% 94.40% 2.06 0.151 Increased Self-Esteem 70.30% 81.00% 0.907 0.341 Increased Self-Efficacy 58.70% 90.50% 7.143 0.008* Positive Drug Test While in Residential Program 3.10% 1.20% 0.677 0.411 Positive Drug Test Post-Discharge 20.40% 2.50% 13.239 .000* New Offense Post-Discharge 32.80% 25.00% 0.435 0.509 Technical Violations Post-Discharge 64.1% 15.00% 14.705 .000*
*Sig. at the .05 level. (p<.05)

Example 4
Outcome Evaluation of New Dosage Protocol
Practical application of the risk principleSeeking to quantify how much dosage is required to reduce recidivismWill compare clients discharged from the program pre-implementation to clients discharged from the program post-implementation.

Benefits of Program Evaluation
Proof of effective services• Maintain or secure funding• Improve staff morale and retention• Educate key stakeholders about services
Highlights opportunities for improvementData to inform quality improvement initiativesEstablish/enhance best practicesMonitor/ensure treatment fidelity

The Role of QA/QI in Community Corrections(based on UC Halfway House and CBCF study)
6
1
0
2
4
6
8
Internal QA No Internal QA
% C
hang
e in
Rec
idiv
ism

NPC Research on Drug CourtsDrug Court Uses Evaluation Feedback to Make Modifications
11%
44%
0%
10%
20%
30%
40%
50%
YesN=4
NoN=6
* "Percent improvement in outcome costs" refers to the percent savings for drug court compared to business-as-usual
Perc
ent
Impr
ovem
ent
in O
utco
me
Cost
s*

Conclusions
Many programs are not implementing the principles of effective intervention with strong fidelity.Result is an ongoing gap between science and practice.This gap often results in null or even iatrogenic effects.Correctional organizations have a responsibility to ensure effective services.Monitoring fidelity is key to success.Responsibility for EBP needs to be aligned at all levels – administration, management, line staff.Need to focus on creating formal infrastructure to support and sustain evidence-based practices.