Embed Size (px)
Citation preview
Healthcare Systems and Services Practice
Achieving ROI from EHRs: Actionable insights that can transform care deliveryBede Broome, MD, PhD; Nikita Sharma; and Sri Velamoor
1
A clinically oriented definition of value To derive lasting impact from EHR and other
technology investments, health systems
must optimize their clinical and nonclinical
workflows to transform care delivery and
patient interactions. The data within an EHR
system, if properly analyzed, can support a
number of approaches for improving opera-
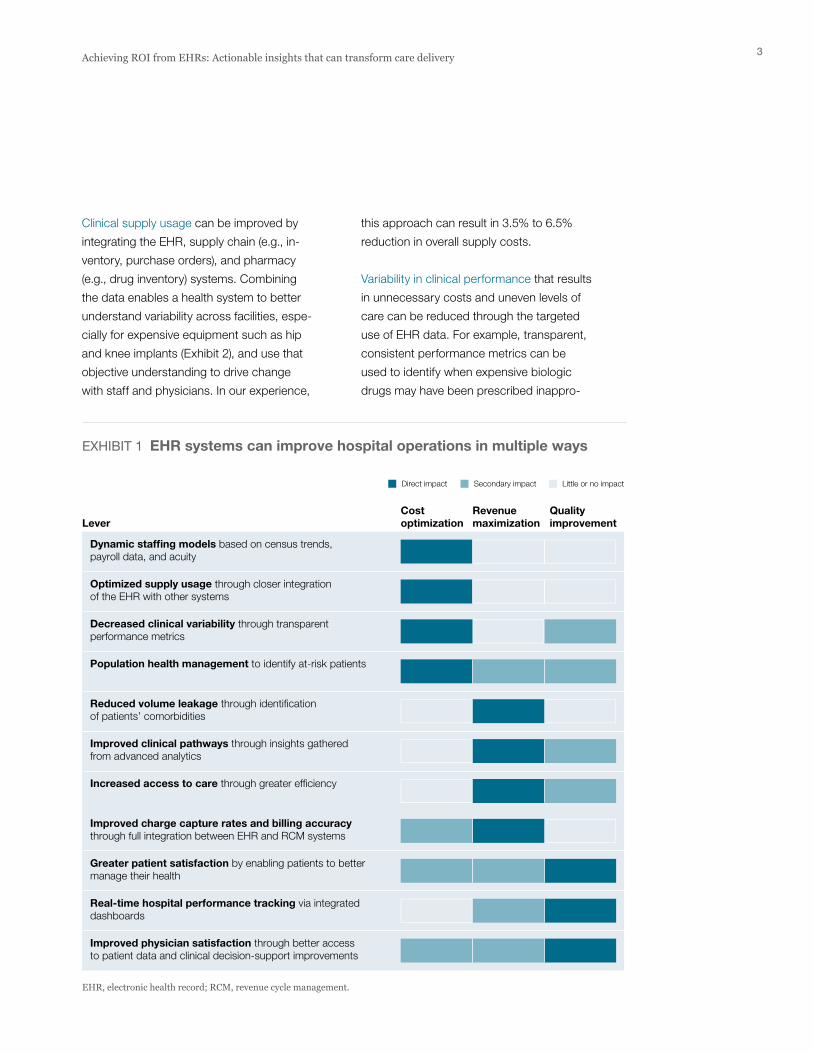
tions (Exhibit 1). Which approaches should
be prioritized first will depend on a health
system’s starting position and strategic goals.
The following are examples of how these
levers can be deployed.
Cost optimizationA dynamic staffing model can be used to
optimize staffing levels. We developed such
a model using EHR-derived historical patient
census data, broken down by unit and acuity.
The EHR data was adjusted to incorporate
likely future growth (e.g., in specific service
lines) and matched with payroll data to
identify staffing costs by type (registered
nurses, technicians, orderlies, etc.). The
model’s output identified the optimal staffing
schedule for each unit, including the types
of staff needed and the best mix of full-time,
part-time, flex, and float personnel. In our
experience, such an approach can save a
health system 0.5% to 1.5% in total labor
costs when compared with what traditional
manual approaches to staffing optimization
can achieve.
US health systems invested more than $10
billion in electronic health record (EHR) systems
between 2008 and 2013, and were projected
to spend another $10 billion to $15 billion by
2016.1 For most health systems, these invest-
ments constitute their largest capital expendi-
tures, but few if any systems have maximized
the return on those investments. To capture the
full impact of their investments, health systems
must look beyond traditional arguments for
EHR implementation, such as efficiency gains
and meaningful use incentives. (To understand
why, see the sidebar on p. 2). Instead, they
should emphasize both clinically and opera-
tionally oriented sources of value, including
better supply utilization, improved clinical out-
comes, and new labor practices that optimize
both care quality and service efficiency. When
done right, these approaches can generate
10% to 20% of additional contribution impact—
which, on a per-bed basis, can amount to an
additional $10,000 to $20,000 in annual margin.2
In this paper, we will describe the opportunity
health systems have to maximize the value
derived—directly or indirectly—from EHR
systems. First, we will discuss 11 ways in which
EHRs, together with linked IT systems and
applications, can transform hospital operations
through cost reductions, revenue enhancements,
and quality improvements. Next, we will intro-
duce an EHR maturity curve that lays out the
phases of implementation and value capture.
Finally, we will discuss the steps health systems
need to take to achieve more value.
Achieving ROI from EHRs: Actionable insights that can transform care deliveryTraditional arguments for EHR implementation such as efficiency gains and meaningful-use incentives are insufficient to maximize a health system’s returns on its technology investments. However, clinically and operationally oriented sources of value can generate an additional $10,000 to $20,000 per bed in annual margin.
Bede Broome, MD, PhD; Nikita Sharma; and Sri Velamoor
1 Gartner and McKinsey CIO/COO survey; revenue for top 20 EHR vendors.
2 Assumes that the average annual revenue per bed is $1 million; savings are based on the impact of applying new value levers. Note: EHR systems can create both revenue and cost benefits; therefore, impact is expressed as a margin benefit.
2 McKinsey & Company Healthcare Systems and Services Practice
Collectively, meaningful use incentives, efficiency/automation,
and rationalization of legacy clinical systems often deliver
only about 25 to 35 cents on each dollar spent on an EHR
system. Not only do they fall short in achieving incremental
value above the ori ginal investment, but they typically also
fail to create sustainable strategic advantages.
Meaningful use incentives
Although the 2009 American Recovery and Reinvestment
Act gave health systems a financial incentive to achieve
meaningful use of EHRs, many hospitals have struggled
to capture this source of value. Among the challenges that
have impeded them are complications related to migration
from legacy systems; problems in implementing, stabilizing,
and optimizing the new EHR systems; and diffi culties in
achieving high provider adoption rates. We estimate that,
for most health systems, the incentives translate to only
15 or 20 cents on each dollar of capital investment in an
EHR system.
Efficiency/automation
After reviewing a broad swath of industry case examples,
we found that, when done right, EHR implementation can
result in 5% to 10% cost reduction through gains in opera-
tional efficiency. However, most EHR implementations tend
to reduce pro ductivity during the first year or two because
of the need for significant training programs, investments
in maintenance staff, lags in adoption, and the failure to
integrate clinical process change into installation.
More immediate savings of about 5% of IT operations
spending can be obtained primarily through IT auto-
mation gains (e.g., reduced transcription expenses).
However, these savings contribute virtually nothing in
terms of increased clinical operations efficiency. Lead-
ing EHR vendors are starting to offer more competitive
pricing to improve their value proposition and shorten
time to ROI.
Rationalization of legacy clinical systems
At most hospitals, IT operations feature an assortment of
disconnected software products from various eras, on in-
compatible platforms, often with overlapping functionality.
Most large health systems have anywhere from 250 to 5,000
IT applications deployed across the enterprise. The total cost
of ownership (TCO) can range between $5 million and $500
million per year, depending on the size of the health system,
and often requires between 40% and 60% of incremental
annual IT operating spend on top of licensing spend.
Most health systems estimate that rationalizing such systems
can lead to a 10% to 15% reduction in TCO over five years.
To put these numbers into practical terms, consider as an
example a $10+ billion health system that has upwards of
1,200 applications and spends about $120 million annually
in application development and maintenance. For this organi-
zation, the TCO for this diverse application footprint is about
$220 million, once the technical infrastructure required to
support it is accounted for. EHR implementation could enable
this health system to rationalize hundreds of applications,
reducing its run-rate spending by perhaps $40 million to $50
million. However, once the health system accounts for the
needed investments and migration costs, as well as the time-
frame required for EHR imple mentation, the potential oppor-
tunity likely decreases to between $20 million and $30 million,
most of which accrues as soft-dollar savings.
Nevertheless, health systems must continue to focus on
rationalizing legacy IT systems lest potential M&A activity
and the legacy systems’ instability exponentially raise the
complexity tax associated with managing their clinical IT
environments. As the provision of healthcare becomes more
complex, the benefits offered by an integrated EHR system
that can provide a longitudinal view of patient charts and enable
insights into population health increase. Buying a set of best-
of-breed IT systems can be more costly and not as provider-
friendly, and can sometimes pose challenges for patient care.
Why traditional sources of value from EHRs fall short
3Achieving ROI from EHRs: Actionable insights that can transform care delivery
this approach can result in 3.5% to 6.5%
reduction in overall supply costs.
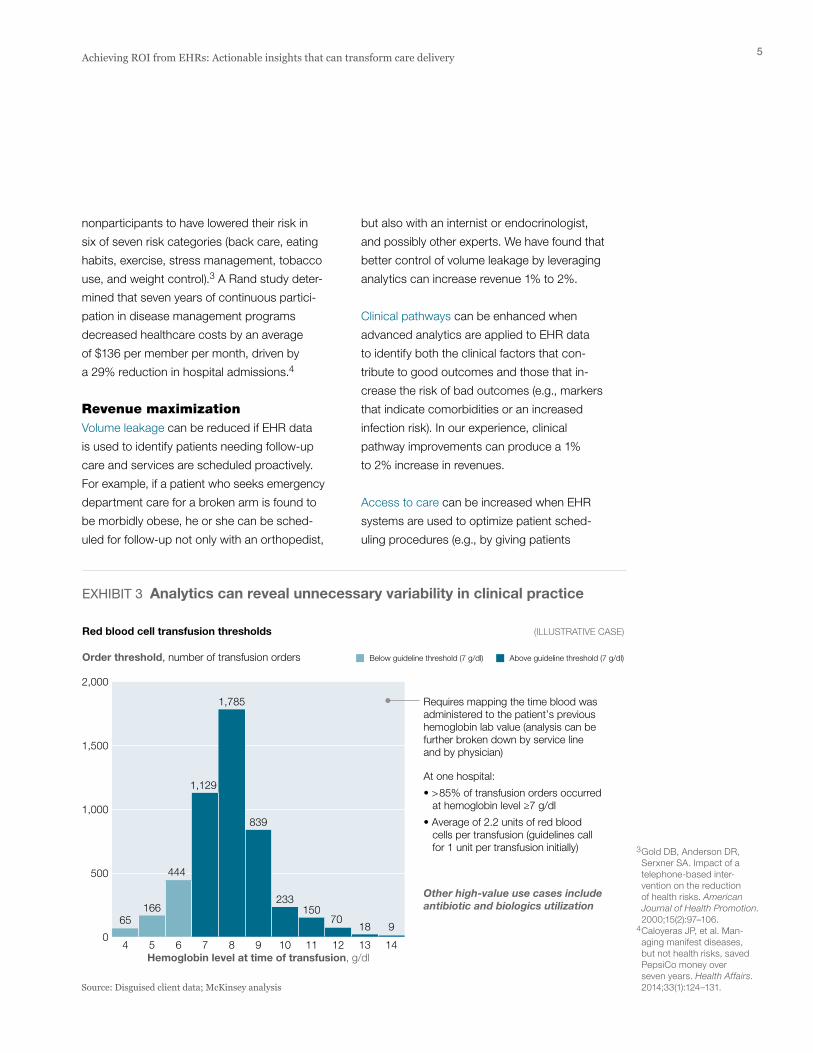
Variability in clinical performance that results
in unnecessary costs and uneven levels of
care can be reduced through the targeted
use of EHR data. For example, transparent,
consistent performance metrics can be
used to identify when expensive biologic
drugs may have been prescribed inappro-
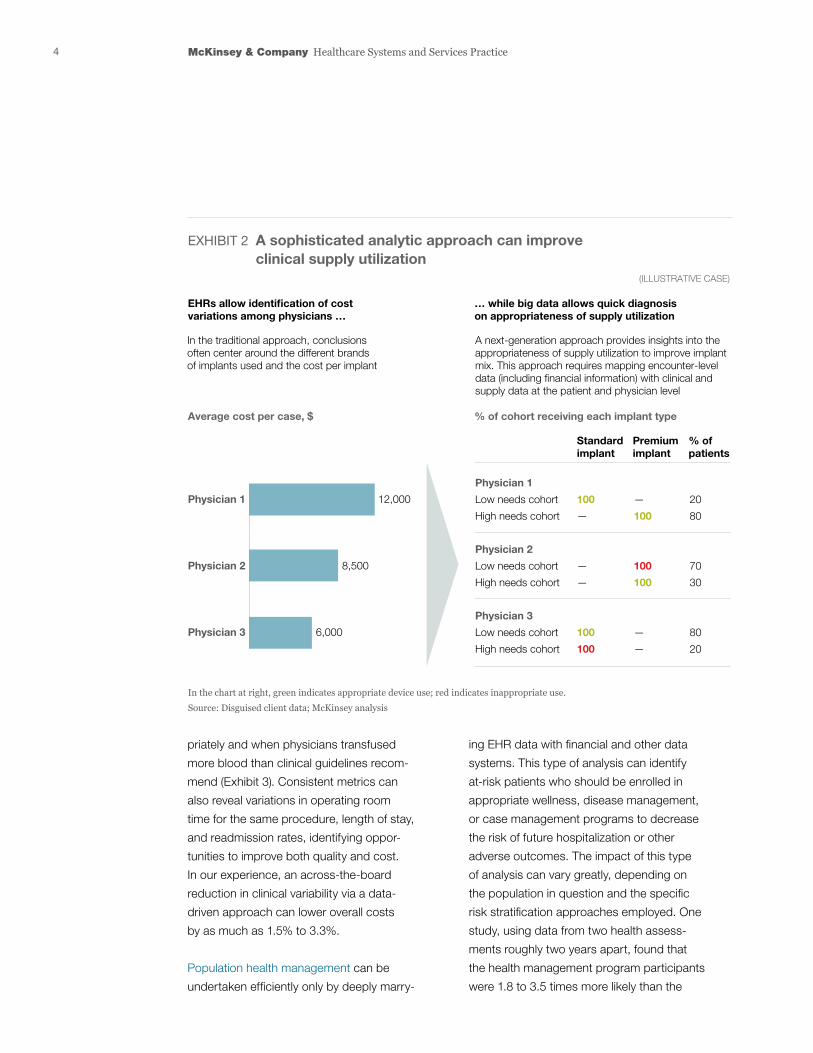
Clinical supply usage can be improved by
integrating the EHR, supply chain (e.g., in-
ventory, purchase orders), and pharmacy
(e.g., drug inventory) systems. Combining
the data enables a health system to better
understand variability across facilities, espe-
cially for expensive equipment such as hip
and knee implants (Exhibit 2), and use that
objective understanding to drive change
with staff and physicians. In our experience,
EHR Value Capture — August 2016
Exhibit 1 of 7
Dynamic staffing models based on census trends, payroll data, and acuity
CostoptimizationLever
Revenuemaximization
Qualityimprovement
Direct impact Secondary impact Little or no impact
Optimized supply usage through closer integration of the EHR with other systems
Decreased clinical variability through transparent performance metrics
Population health management to identify at-risk patients
Reduced volume leakage through identification of patients’ comorbidities
Improved charge capture rates and billing accuracy through full integration between EHR and RCM systems
Improved clinical pathways through insights gathered from advanced analytics
Increased access to care through greater efficiency
Greater patient satisfaction by enabling patients to better manage their health
Real-time hospital performance tracking via integrated dashboards
Improved physician satisfaction through better access to patient data and clinical decision-support improvements
EHR, electronic health record; RCM, revenue cycle management.
EXHIBIT 1 EHR systems can improve hospital operations in multiple ways
4 McKinsey & Company Healthcare Systems and Services Practice
ing EHR data with financial and other data
systems. This type of analysis can identify
at-risk patients who should be enrolled in
appropriate wellness, disease management,
or case management programs to decrease
the risk of future hospitalization or other
adverse outcomes. The impact of this type
of analysis can vary greatly, depending on
the population in question and the specific
risk stratification approaches employed. One
study, using data from two health assess-
ments roughly two years apart, found that
the health management program participants
were 1.8 to 3.5 times more likely than the
priately and when physicians transfused
more blood than clinical guidelines recom-
mend (Exhibit 3). Consistent metrics can
also reveal variations in operating room
time for the same procedure, length of stay,
and readmission rates, identifying oppor-
tunities to improve both quality and cost.
In our experience, an across-the-board
reduction in clinical variability via a data-
driven approach can lower overall costs
by as much as 1.5% to 3.3%.
Population health management can be
undertaken efficiently only by deeply marry-
% of cohort receiving each implant type
Physician 1
Low needs cohort 100 — 20
High needs cohort — 100 80
Physician 2
Low needs cohort — 100 70
High needs cohort — 100 30
Physician 3
Low needs cohort 100 — 80
High needs cohort 100 — 20
Average cost per case, $
… while big data allows quick diagnosis on appropriateness of supply utilization
Standard implant
Premiumimplant
% of patients
EHRs allow identification of cost variations among physicians …
In the traditional approach, conclusions often center around the different brands of implants used and the cost per implant
(ILLUSTRATIVE CASE)
A next-generation approach provides insights into the appropriateness of supply utilization to improve implant mix. This approach requires mapping encounter-level data (including financial information) with clinical and supply data at the patient and physician level
12,000Physician 1
8,500Physician 2
Physician 3 6,000
In the chart at right, green indicates appropriate device use; red indicates inappropriate use.Source: Disguised client data; McKinsey analysis
EHR Value Capture — August 2016
Exhibit 2 of 7
EXHIBIT 2 A sophisticated analytic approach can improve clinical supply utilization
5Achieving ROI from EHRs: Actionable insights that can transform care delivery
but also with an internist or endocrinologist,
and possibly other experts. We have found that
better control of volume leakage by leveraging
analytics can increase revenue 1% to 2%.
Clinical pathways can be enhanced when
advanced analytics are applied to EHR data
to identify both the clinical factors that con-
tribute to good outcomes and those that in-
crease the risk of bad outcomes (e.g., markers
that indicate comorbidities or an increased
infection risk). In our experience, clinical
pathway improvements can produce a 1%
to 2% increase in revenues.
Access to care can be increased when EHR
systems are used to optimize patient sche d-
uling procedures (e.g., by giving patients
nonparticipants to have lowered their risk in
six of seven risk categories (back care, eating
habits, exercise, stress management, tobacco
use, and weight control).3 A Rand study deter-
mined that seven years of continuous partici-
pation in disease management programs
decreased healthcare costs by an average
of $136 per member per month, driven by
a 29% reduction in hospital admissions.4
Revenue maximizationVolume leakage can be reduced if EHR data
is used to identify patients needing follow-up
care and services are scheduled proactively.
For example, if a patient who seeks emergency
department care for a broken arm is found to
be morbidly obese, he or she can be sched-
uled for follow-up not only with an orthopedist,
3 Gold DB, Anderson DR, Serxner SA. Impact of a telephone-based inter- vention on the reduction of health risks. American Journal of Health Promotion. 2000;15(2):97–106.
4 Caloyeras JP, et al. Man- aging manifest diseases, but not health risks, saved PepsiCo money over seven years. Health Affairs. 2014;33(1):124–131.
Order threshold, number of transfusion orders
Hemoglobin level at time of transfusion, g/dl
Requires mapping the time blood was administered to the patient’s previous hemoglobin lab value (analysis can be further broken down by service line and by physician)
At one hospital:
• >85% of transfusion orders occurred at hemoglobin level ≥7 g/dl
• Average of 2.2 units of red blood cells per transfusion (guidelines call for 1 unit per transfusion initially)
Other high-value use cases include antibiotic and biologics utilization
4 5 6 7 8 9 10 11 12 13 14
65166
444
1,129
1,785
839
233150
7018 9
Red blood cell transfusion thresholds
Source: Disguised client data; McKinsey analysis
Above guideline threshold (7 g/dl)Below guideline threshold (7 g/dl)
2,000
1,500
1,000
500
0
(ILLUSTRATIVE CASE)
EHR Value Capture — August 2016
Exhibit 3 of 7
EXHIBIT 3 Analytics can reveal unnecessary variability in clinical practice
6 McKinsey & Company Healthcare Systems and Services Practice
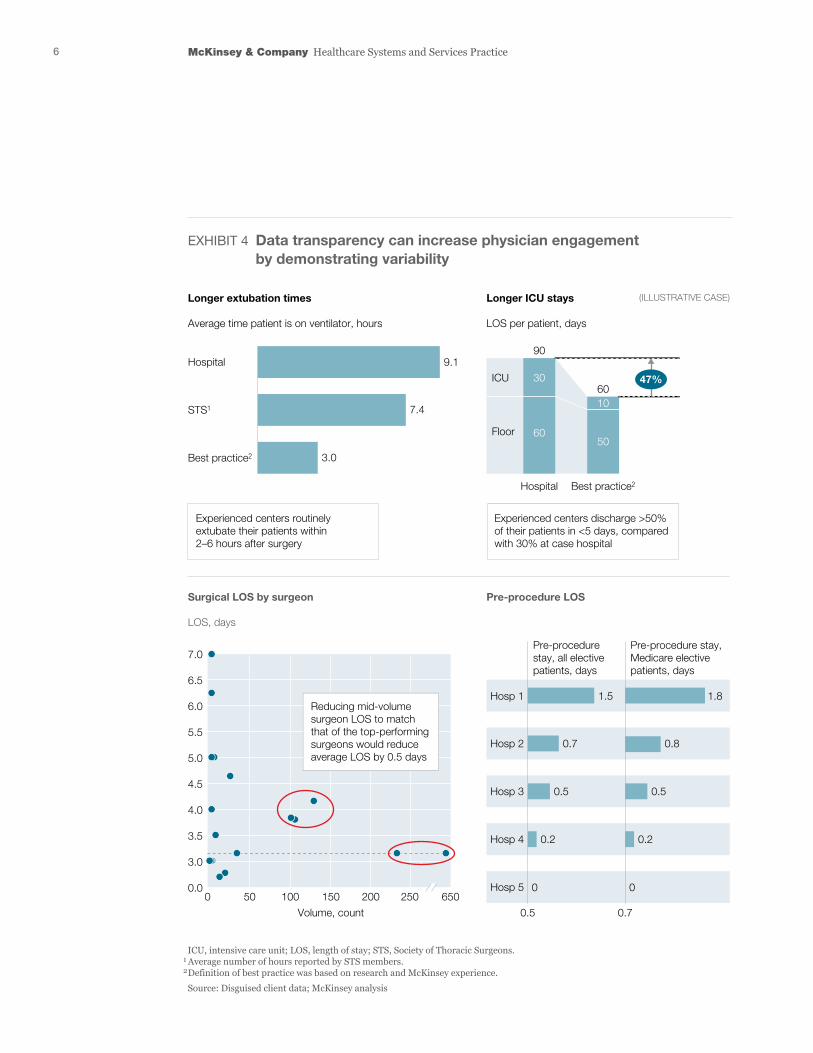
Longer extubation times
Average time patient is on ventilator, hours
Surgical LOS by surgeon
LOS, days
Pre-procedure LOS
Pre-procedure stay, Medicare elective patients, days
Pre-procedure stay, all elective patients, days
Longer ICU stays
LOS per patient, days
Hosp 1 1.5
0.7 0.8
0.5
1.8
Hosp 2
Hosp 3
Hosp 4
Hosp 5
9.1
7.4
50 100 150
Volume, count
200 250 6500
3.0
Hospital
STS1
Best practice2
7.0
6.5
6.0
5.5
5.0
4.5
4.0
3.5
3.0
0.0
ICU
90
60
Floor
Hospital Best practice2
(ILLUSTRATIVE CASE)
ICU, intensive care unit; LOS, length of stay; STS, Society of Thoracic Surgeons.1 Average number of hours reported by STS members.2 Definition of best practice was based on research and McKinsey experience. Source: Disguised client data; McKinsey analysis
30
60
10
50
47%
0.5
0.2
0 0
0.2
0.70.5
Reducing mid-volume surgeon LOS to match that of the top-performing surgeons would reduce average LOS by 0.5 days
Experienced centers routinely extubate their patients within 2–6 hours after surgery
Experienced centers discharge >50% of their patients in <5 days, compared with 30% at case hospital
EHR Value Capture — August 2016
Exhibit 4 of 7
EXHIBIT 4 Data transparency can increase physician engagement by demonstrating variability
7Achieving ROI from EHRs: Actionable insights that can transform care delivery
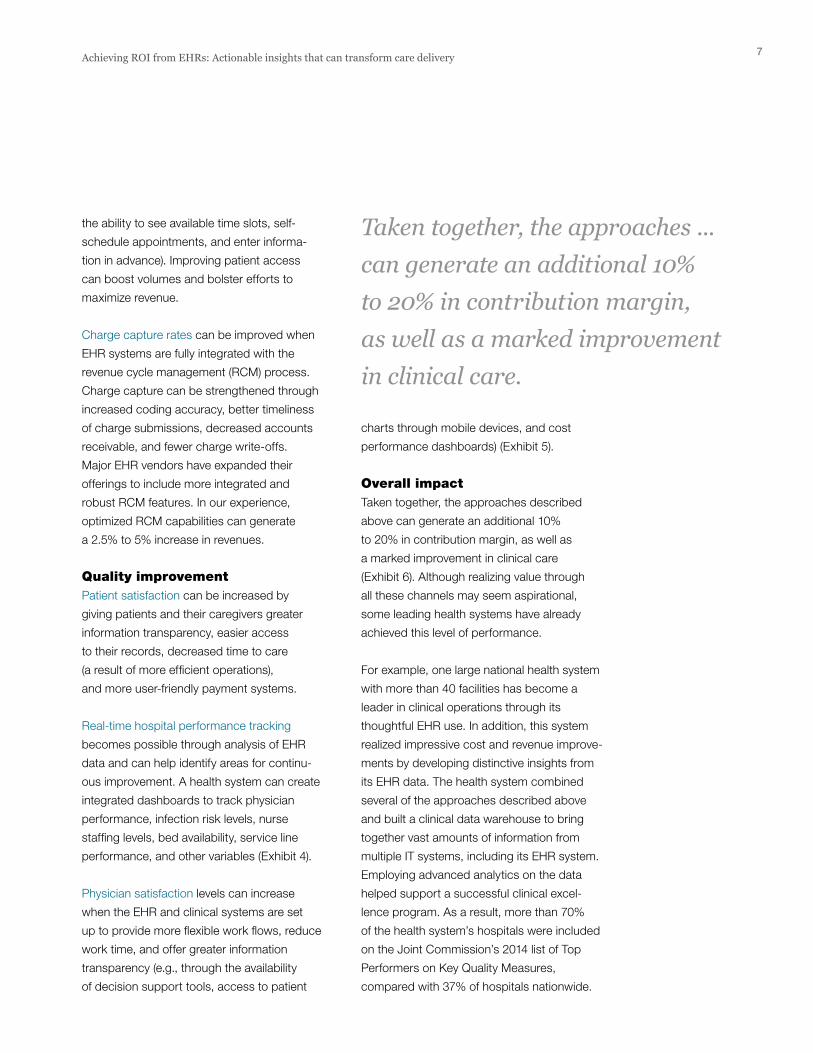
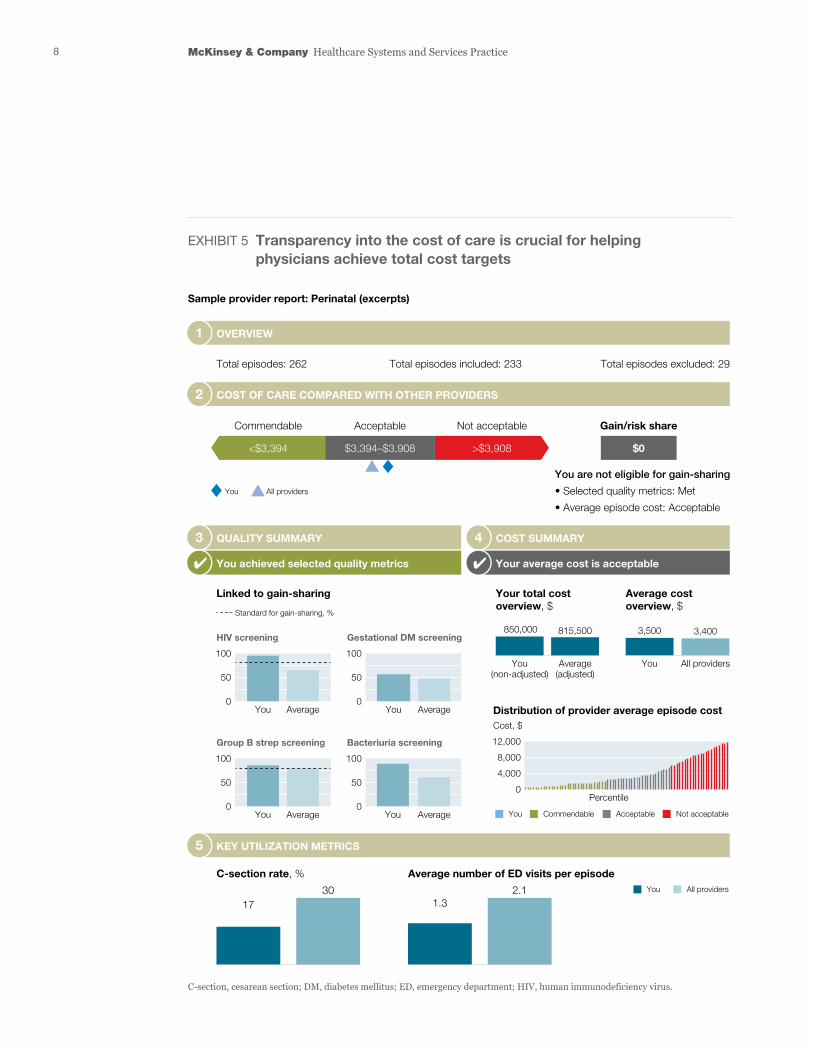
charts through mobile devices, and cost
performance dashboards) (Exhibit 5).
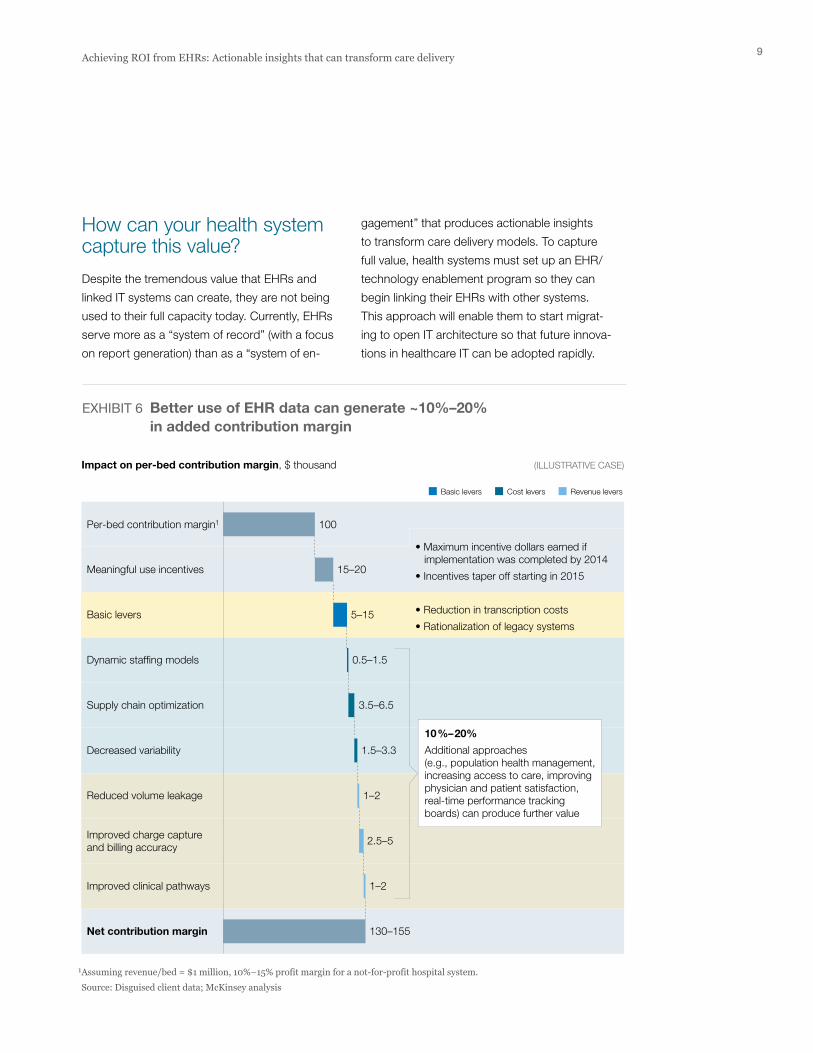
Overall impactTaken together, the approaches described
above can generate an additional 10%
to 20% in contribution margin, as well as
a marked improvement in clinical care
(Exhibit 6). Although realizing value through
all these channels may seem aspirational,
some leading health systems have already
achieved this level of performance.
For example, one large national health system
with more than 40 facilities has become a
leader in clinical operations through its
thoughtful EHR use. In addition, this system
realized impressive cost and revenue improve-
ments by developing distinctive insights from
its EHR data. The health system combined
several of the approaches described above
and built a clinical data warehouse to bring
together vast amounts of information from
multiple IT systems, including its EHR system.
Employing advanced analytics on the data
helped support a successful clinical excel-
lence program. As a result, more than 70%
of the health system’s hospitals were included
on the Joint Commission’s 2014 list of Top
Performers on Key Quality Measures,
compared with 37% of hospitals nationwide.
the ability to see available time slots, self-
schedule appointments, and enter informa-
tion in advance). Improving patient access
can boost volumes and bolster efforts to
maximize revenue.
Charge capture rates can be improved when
EHR systems are fully integrated with the
revenue cycle management (RCM) process.
Charge capture can be strengthened through
increased coding accuracy, better timeliness
of charge submissions, decreased accounts
receivable, and fewer charge write-offs.
Major EHR vendors have expanded their
offerings to include more integrated and
robust RCM features. In our experience,
optimized RCM capabilities can generate
a 2.5% to 5% increase in revenues.
Quality improvementPatient satisfaction can be increased by
giving patients and their caregivers greater
information transparency, easier access
to their records, decreased time to care
(a result of more efficient operations),
and more user-friendly payment systems.
Real-time hospital performance tracking
becomes possible through analysis of EHR
data and can help identify areas for continu-
ous improvement. A health system can create
integrated dashboards to track physician
performance, infection risk levels, nurse
staffing levels, bed availability, service line
performance, and other variables (Exhibit 4).
Physician satisfaction levels can increase
when the EHR and clinical systems are set
up to provide more flexible work flows, reduce
work time, and offer greater information
transparency (e.g., through the availability
of decision support tools, access to patient
Taken together, the approaches ... can generate an additional 10% to 20% in contribution margin, as well as a marked improvement in clinical care.
8 McKinsey & Company Healthcare Systems and Services Practice
Total episodes: 262
C-section rate, % Average number of ED visits per episode
Commendable
Standard for gain-sharing, %
You Average
You All providers
Acceptable Not acceptable
Total episodes included: 233 Total episodes excluded: 29
You are not eligible for gain-sharing
• Selected quality metrics: Met
• Average episode cost: Acceptable
Gain/risk share
OVERVIEW
Sample provider report: Perinatal (excerpts)
1
COST OF CARE COMPARED WITH OTHER PROVIDERS2
KEY UTILIZATION METRICS5
QUALITY SUMMARY3 COST SUMMARY4
Linked to gain-sharing
HIV screening
100
50
0
Your total cost overview, $
Average cost overview, $
You achieved selected quality metrics✔ Your average cost is acceptable
$0<$3,394 $3,394–$3,908 >$3,908
You All providers
You Commendable Acceptable Not acceptable
1730
1.32.1
✔
You Average
You(non-adjusted)
850,000 815,500 3,500 3,400
Average(adjusted)
You All providers
Gestational DM screening
100
50
0
You Average
Group B strep screening
100
50
0You Average
Bacteriuria screening
100
50
0Percentile
Cost, $
Distribution of provider average episode cost
12,000
8,000
4,000
0
C-section, cesarean section; DM, diabetes mellitus; ED, emergency department; HIV, human immunodeficiency virus.
EHR Value Capture — August 2016
Exhibit 5 of 7
EXHIBIT 5 Transparency into the cost of care is crucial for helping physicians achieve total cost targets
9Achieving ROI from EHRs: Actionable insights that can transform care delivery
gagement” that produces action able insights
to transform care delivery models. To capture
full value, health systems must set up an EHR/
technology enablement program so they can
begin linking their EHRs with other systems.
This approach will enable them to start migrat-
ing to open IT architecture so that future innova-
tions in healthcare IT can be adopted rapidly.
How can your health system capture this value?
Despite the tremendous value that EHRs and
linked IT systems can create, they are not being
used to their full capacity today. Currently, EHRs
serve more as a “system of record” (with a focus
on report generation) than as a “system of en-
Impact on per-bed contribution margin, $ thousand
Per-bed contribution margin1
Basic levers
Dynamic staffing models
Supply chain optimization
Decreased variability
Reduced volume leakage
Improved charge capture and billing accuracy
Improved clinical pathways
Net contribution margin
Meaningful use incentives
• Maximum incentive dollars earned if implementation was completed by 2014
• Incentives taper off starting in 2015
• Reduction in transcription costs
• Rationalization of legacy systems
Cost levers
1 Assuming revenue/bed = $1 million, 10%–15% profit margin for a not-for-profit hospital system. Source: Disguised client data; McKinsey analysis
Basic levers Revenue levers
100
15–20
5–15
0.5–1.5
3.5–6.5
1.5–3.3
1–2
2.5–5
1–2
130–155
(ILLUSTRATIVE CASE)
10%–20%
Additional approaches (e.g., population health management, increasing access to care, improving physician and patient satisfaction, real-time performance tracking boards) can produce further value
EHR Value Capture — August 2016
Exhibit 6 of 7
EXHIBIT 6 Better use of EHR data can generate ~10%–20% in added contribution margin
10 McKinsey & Company Healthcare Systems and Services Practice
baseline requirement if the journey is to
succeed. Such a model helps ensure that all
the necessary cross-functional stakeholders
are engaged early and remain engaged
through out the EHR/technology enablement
program. It can also accelerate alignment
and collaboration on key issues related
to work flow, operations, technology, and
change management.
In our experience, most successful imple-
mentations of this nature rest on three
governing principles:
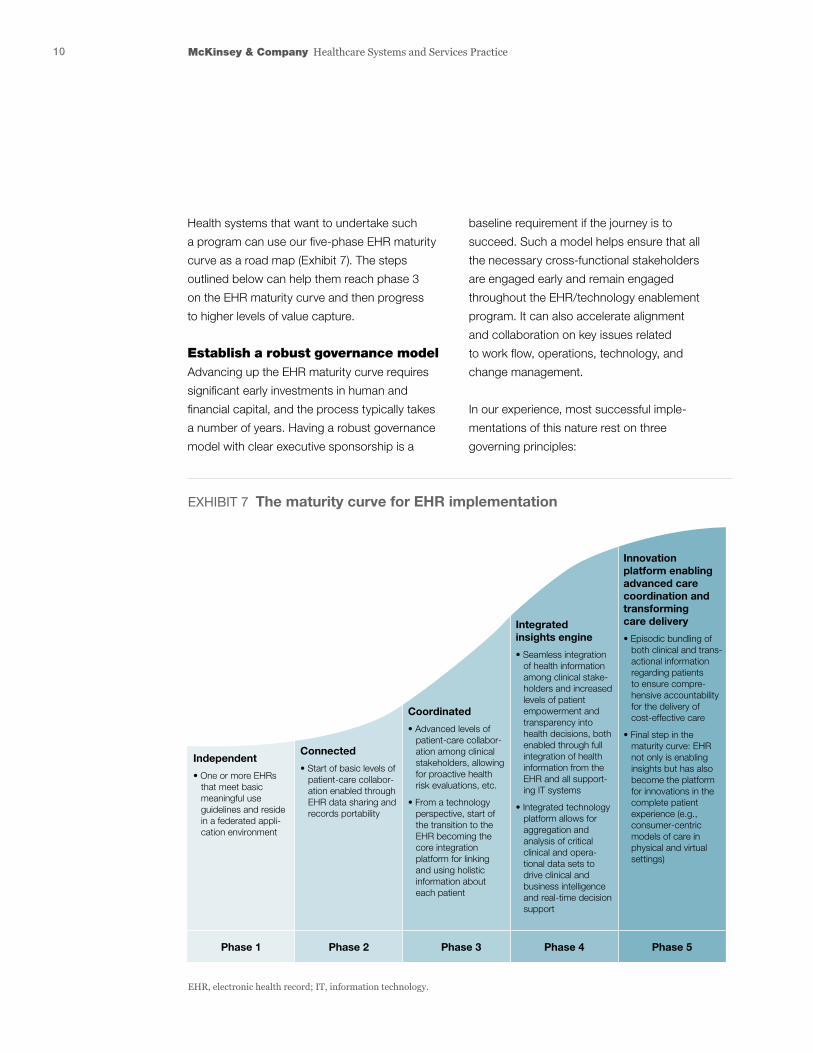
Health systems that want to undertake such
a program can use our five-phase EHR maturity
curve as a road map (Exhibit 7). The steps
outlined below can help them reach phase 3
on the EHR maturity curve and then progress
to higher levels of value capture.
Establish a robust governance modelAdvancing up the EHR maturity curve requires
significant early investments in human and
financial capital, and the process typically takes
a number of years. Having a robust governance
model with clear executive sponsorship is a
EHR, electronic health record; IT, information technology.
Phase 1 Phase 2 Phase 3 Phase 4 Phase 5
Independent
• One or more EHRs that meet basic meaningful use guidelines and reside in a federated appli- cation environment
Connected
• Start of basic levels of patient-care collabor- ation enabled through EHR data sharing and records portability
Coordinated
• Advanced levels of patient-care collabor- ation among clinical stakeholders, allowing for proactive health risk evaluations, etc.
• From a technology perspective, start of the transition to the EHR becoming the core integration platform for linking and using holistic information about each patient
Integrated insights engine
• Seamless integration of health information among clinical stake- holders and increased levels of patient empowerment and transparency into health decisions, both enabled through full integration of health information from the EHR and all support- ing IT systems
• Integrated technology platform allows for aggregation and analysis of critical clinical and opera- tional data sets to drive clinical and business intelligence and real-time decision support
Innovation platform enabling advanced care coordination and transforming care delivery
• Episodic bundling of both clinical and trans- actional information regarding patients to ensure compre- hensive accountability for the delivery of cost-effective care
• Final step in the maturity curve: EHR not only is enabling insights but has also become the platform for innovations in the complete patient experience (e.g., consumer-centric models of care in physical and virtual settings)
EHR Value Capture — August 2016
Exhibit 7 of 7
EXHIBIT 7 The maturity curve for EHR implementation
11Achieving ROI from EHRs: Actionable insights that can transform care delivery
representation on this committee ensures
that the clinical strategy determines the
tech nology solution—not other way around.
Portfolio management. This multidisciplinary
team, which includes administrative, clinical,
and IT leaders, weighs clinical, regulatory,
financial, and strategic considerations so
it can determine which opportunities should
be pursued and prioritize their implementa-
tion. This approach helps ensure that the EHR/
technology enablement program focuses
on areas with clear value targets to avoid
investment of resources over several years
in projects with significant ambiguity about
actual outcomes.
Implementation and value capture. To ensure
that value capture is front and center through
every phase of the EHR/technology enable-
ment program, cross-functional (e.g., clinical,
IT, finance) teams should oversee the imple-
mentation and deployment of each prioritized
project. These teams should be responsible
for tracking end-to-end value capture, not just
the installation of technology widgets.
Ongoing performance management. This
cross-functional team helps oversee the
First, healthcare providers should control
the development/configuration agenda to
ensure that clinical benefits are achieved.
Second, an open-architecture approach
should be adopted for all existing and anti-
cipated applications. Given the rapid pace
of inno vation in the broader healthcare IT
space, it is critical that health systems give
themselves the flexibility needed to partner
with the start-ups and large technology
companies developing the innovations.
Third, the program should be overseen
by multi disciplinary teams of leaders who
have a shared understanding of clinical,
analytic, technology, and operational
concerns. These teams enable “unnatural
collaborations” across functional and organi-
zational silos to emerge. The following multi-
disciplinary teams, working in conjunction
to ensure collaboration and successful
im plementation, are typically needed:
Strategy and design. This team should be
headed by administrative and clinical leaders
(e.g., the chief medical officer), as well as tech-
nology leaders. The administrative and clinical
leaders define the desired clinical workflows
and functions that will help achieve the health
system’s strategic goals and produce value.
The technology leaders provide insight into
cutting-edge capabilities and tools that can
be used to realize the strategy.
Technology and data architecture definition.
This group, led by IT leaders (e.g., the chief
information officer or technology director),
establishes the overall technology and data-
architecture approach that will bring together
the EHR system, all other technology assets,
and leading third-party solutions. Clinical
To ensure that value capture is front and center through every phase of the EHR/technology enablement program, cross-functional … teams should oversee the implementation and deployment of each prioritized project.
12 McKinsey & Company Healthcare Systems and Services Practice
The information audit focuses on technology.
The health system should assess the avail-
ability, quality, response speed, and integra-
tion potential of all related data elements.
Critical areas to evaluate include the existing
interface engine, single sign-on functionality,
wireless capabilities, and network security.
This information will help shape the scale
and scope of the project.
Emphasize a focus on valueAlthough the organizational readiness assess-
ment provides insight into the full set of mind-
sets and behaviors that need to be altered,
the first and most critical change is for stake-
holders is to adopt a focus on value. This
requires the stakeholders to shift from a report
mind-set to an insight mind-set. The EHR
system and all information assets must be
set up to deliver actionable insights to en-
sure that stakeholders remain laser-focused
on cap turing value, not simply on creating
copious statistical reports.
Identify and size opportunities for value creationOnly by identifying and sizing opportunities
can a health system determine how and
where organizational resources should be
deployed to maximize value delivered.
All key stakeholders (clinical, operational,
and financial) should help identify what func-
tionality gaps and information asymmetries
currently exist within the health system, and
they must thoroughly understand how value
is being left on the table as a result. This
understanding will make it easier for stake-
holders to align on the use cases most likely
to deliver significant operational, revenue
cycle, and/or clinical impact. Once these
use cases are defined, the health system
long tail of an EHR/technology enablement
program by defining and tracking key per-
formance indicators and other metrics for
measuring progress. This team also provides
guidance to the implementation teams when
challenges arise and helps resolve conflicts
between clinical and technology priorities.
Understand organizational readiness Establishing a baseline understanding of the
readiness of people and systems to move
toward greater value capture is essential for
shaping the implementation plan. We recom-
mend an organizational readiness assessment
and information audit. This knowledge helps
identify the types of programs and communi-
cation channels required to promote adoption
and transform mind-sets and behaviors. Fur-
thermore, it provides insight into any skill gaps
that need to be addressed. If EHR/technology
enablement programs are to succeed, health
systems must have the right mix of technical,
analytic, clinical, and business skills, as well
as cross-functional resources. A ready organi-
zation can undergo an EHR implementation
with fewer cost overruns in a shorter time
line, and is better prepared to capture value
once the EHR system is in place.
A health system should identify everyone with-
in the organization who is or will be affected
by the EHR system and conduct a usage
survey to determine how they currently interact
with the EHR and other IT systems, and how
ready they are to adopt new approaches to
value capture. The health system should also
conduct in-depth interviews with key influ-
encers (e.g., physicians who could become
champions of the new system) to develop
a holistic understanding of the current state
of technology adoption.
13Achieving ROI from EHRs: Actionable insights that can transform care delivery
It should then develop solutions based on
information liquidity, extensibility, and scale.
Often, this requires the health system to
migrate toward an open-architecture design
and away from closed-loop systems tethered
to the existing EHR system.
We recommend health systems adopt a two-
speed architecture approach so that it can
begin to use the EHR system in new ways
(e.g., to improve consumer engagement)
while continuing to derive value from traditional
EHR functions. As part of this process, it must
decide which opportunities it wants to priori-
tize. The answer to this question will help the
health system decide which approach to value
capture it wants to pursue: should the EHR
system encompass all care delivery, or will
it be part of a broader set of tools that are
interconnected to enable advanced analytics
and other benefits?
Technology experts should have primary
responsibility for designing and building the
end-state system. However, the right mix of
clinical, business, and analytics leaders should
be included throughout the design process
to validate the data, check that it is correctly
interpreted, and ensure that the final product
delivers the insights required. Leading EHR
vendors are starting to offer data analytics
can develop the specific algorithms and
identify the data elements from other IT
systems that must be combined with the EHR
system to estimate the value to be captured.
Note that defining, sizing, and prioritizing the
use cases should not be the domain of just
the technology team or clinical department.
Rather, a multidisciplinary effort combining
expertise from a variety of groups—clinical
operations, supply chain, technology, HR,
analytics, and finance—is required.
Facilitate broad adoptionAchieving phase 3 on the maturity curve
requires that all physicians and nurses consis-
tently and substantively use the EHR system
as part of their daily workflow. This change
will occur only if the physicians and nurses
can see concrete examples of how EHR use
will improve patient outcomes and help them
work more efficiently. To ensure that such
examples can be found, both physicians and
nurses should be involved from the beginning
in the EHR/technology enablement program
to confirm how the EHR system is currently
being used, identify value capture opportuni-
ties, and design the new EHR work flow.
To further encourage adoption, physician
champions can be enlisted to encourage
their peers to increase their EHR use. Tailor-
ing communication and training programs
can also help achieve this goal.
Mitigate the ‘complexity tax’ and have a clear approach to value captureContent must trump tools. Thus, a health
system should reassess its technology
infrastructure to identify the key sources of
complexity currently impeding data sharing.
Content must trump tools. Thus, a health system should reassess its technology infrastructure to identify the key sources of complexity currently impeding data sharing.
14 McKinsey & Company Healthcare Systems and Services Practice
. . .EHR systems can be used to create or de-
stroy value for health systems. Today’s health
systems have a gold mine of data within their
IT, clinical, and business systems—data that
can be used to develop new insights into
how to capture value. The EHR system can
be used as the catalyst for this effort. By
combining data from other systems with
EHR records, health systems can identify
the approaches that will best enable them
to improve care quality, optimize costs,
and/or maximize value. This approach has
the potential to revolutionize both care deliv-
ery and health system economics. It can also
position pro viders to begin making dramatic
changes to their cost structure and prepare
to become the hospitals of the future.
Bede Broome, MD, PhD (Bede_Broome@McKinsey. .com) is a partner in McKinsey’s South-ern California office. Nikita Sharma (Nikita_Sharma@McKinsey. .com) is an associate partner in McKinsey’s Chicago office. Sri Velamoor ([email protected]) is a partner in McKinsey’s Southern California office.
capabilities (not just reporting) as part of their
“out of the box” functionality.
Develop ‘test and learn’ capabilities Health systems should adopt a more agile,
iterative approach to technology deployment.
Capturing value from EHR investments
cannot be achieved through a “big bang.”
It instead requires patience so that multiple
pilot projects can be designed and deployed
to generate quantitatively and qualitatively
validated insights. To keep implementation
costs low, the pilots should include workable
prototypes of analytic and collaboration tools.
Creating the prototypes and running the pilots
requires focused development and analytics
capacity, the ability to scale the current state
“control” environment up and down rapidly,
and tremendous executional discipline (espe-
cially the willingness to close down pilots
that do not meet established testing criteria).
This approach can yield significant value at a
fraction of the capital investment committed
to the overall project and often becomes
self-funding.
For more information, contact [email protected]
Copyright © 2016 McKinsey & Company
Any use of this material without specific permission of McKinsey & Company is strictly prohibited.www.mckinsey.com/client_service/healthcare_systems_and_services