Embed Size (px)
Citation preview

The Issue of Performance Why
Do you need a Maturity Level 5
Achieving the Organizational Business Objectives Through Optimized Operational Processes
CMMI ML 4 & 5 PAs Recap
• Quantitative Project Management• Organizational Process Performance• Causal Analysis and Resolution• Organizational Innovation and Deployment
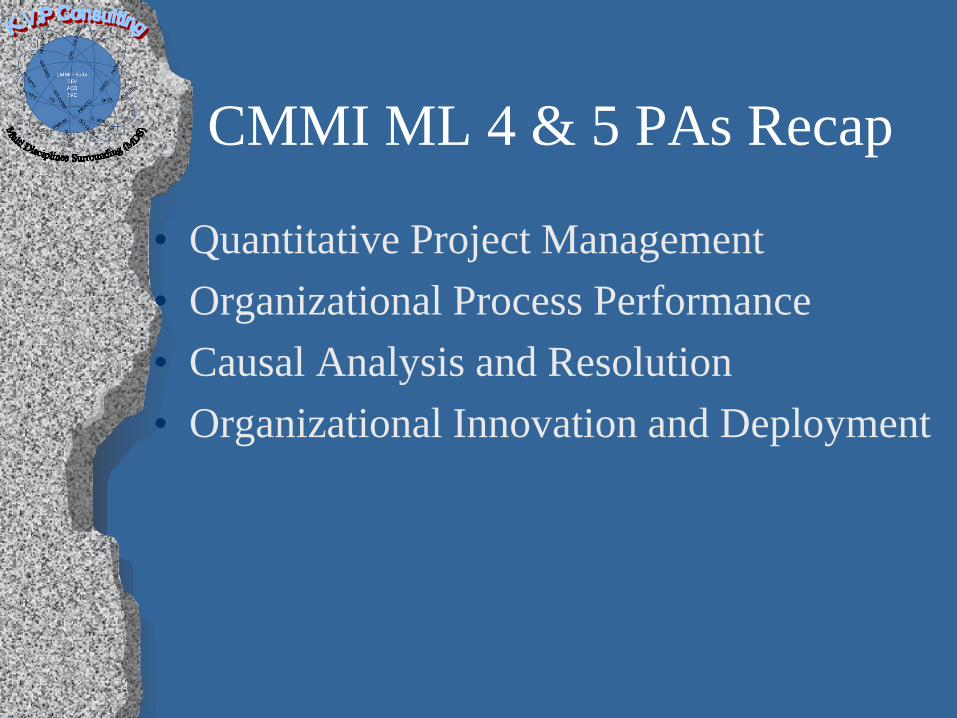
Specific Practices of QPMSG 1 Quantitatively Manage the Project
SP 1.1 Establish the Project’s ObjectivesSP 1.2 Compose the Defined ProcessSP 1.3 Select the Subprocesses That Will Be Statistically ManagedSP 1.4 Manage Project Performance
SG 2 Statistically Manage Subprocess PerformanceSP 2.1 Select Measures and Analytic TechniquesSP 2.2 Apply Statistical Methods to Understand VariationSP 2.3 Monitor Performance of the Selected SubprocessesSP 2.4 Record Statistical Management Data

EstablishProject’s
Objectives
Compose the Defined
Process
Project’s Quality andProcess-Performance
Objectives
Remedial Actions
Quantitative Project Management Context
OPP
Select theSubprocesses
that Will BeStatisticallyManaged
Quantitatively Manage the Project
ManageProject
Performance
Predictions ofQuality and
Process Performance
SelectedSubprocesses
Organization’sMeasurement
Repository
Statistically Manage Subprocess Performance
RecordStatistical
ManagementData
MonitorPerformance
of the SelectedSub-
processes
ApplyStatistical
Methods toUnderstand
Variation
SelectMeasures
and AnalyticTechniques
SubprocessCapability
IPM
MA
QPM Summary•QPM involves both quantitative and statistical management. The project
• establishes quantitative objectives based on the organization’s business objectives and needs of the customer
• composes a defined process based on historical capability data that will help it meet those objectives
• monitors the project quantitatively to assess whether the project is on course to achieve its objectives.
•For each subprocess to be statistically managed,• objectives are established for its process performance• its variation is understood (subprocess is stable)• when the subprocess fails to achieve its objectives, corrective action is
taken
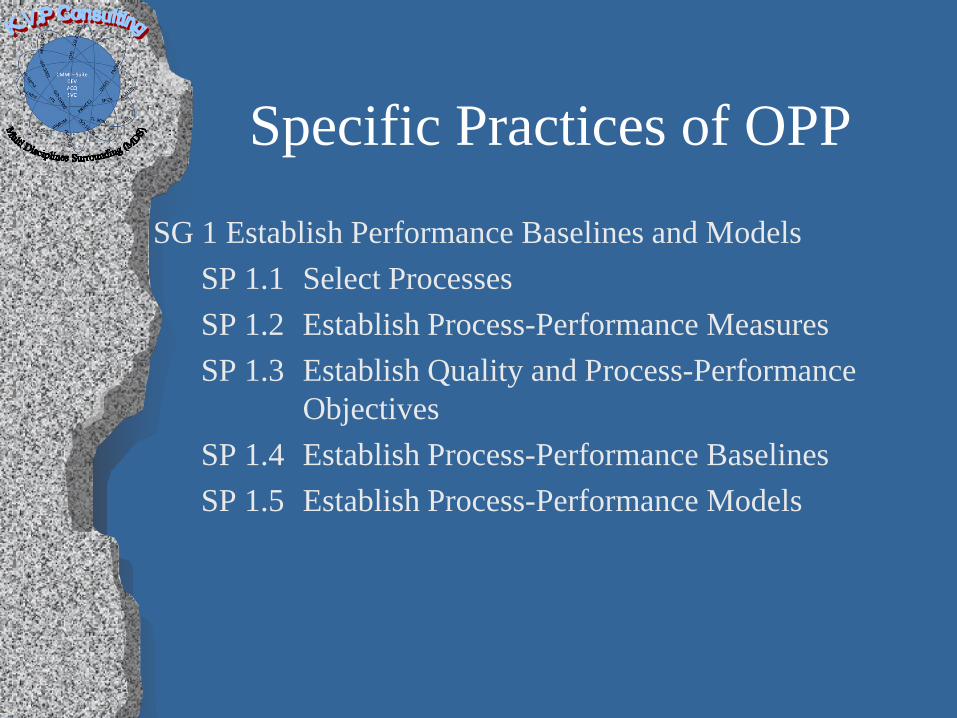
Specific Practices of OPP
SG 1 Establish Performance Baselines and ModelsSP 1.1 Select ProcessesSP 1.2 Establish Process-Performance Measures SP 1.3 Establish Quality and Process-Performance
ObjectivesSP 1.4 Establish Process-Performance BaselinesSP 1.5 Establish Process-Performance Models
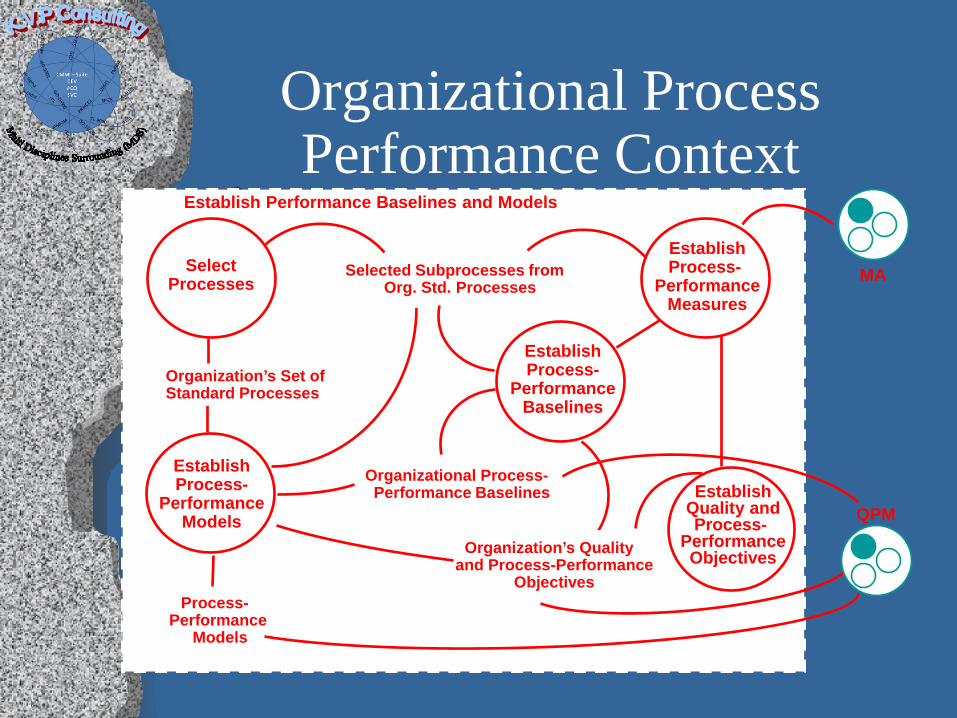
Organizational Process Performance Context
•Select
Processes
EstablishProcess-
PerformanceModels
EstablishQuality andProcess-
PerformanceObjectives
EstablishProcess-
PerformanceMeasures
Selected Subprocesses from Org. Std. Processes
Organizational Process-Performance Baselines
Process-Performance
Models
EstablishProcess-
PerformanceBaselines
Organization’s Quality and Process-Performance
Objectives
Establish Performance Baselines and Models
MA
QPM
Organization’s Set ofStandard Processes

OPP Summary
•The first three SPs establish processes (subprocesses), measures, and objectives at the organization level that focus and align the quantitative management activities of projects (QPM) with the business objectives of the organization.•The last two SPs take the actual results obtained from projects to create baselines and models that enable the next project to predict what performance to expect from selecting certain subprocesses for its use, and thereby assess its ability to meet its objectives.
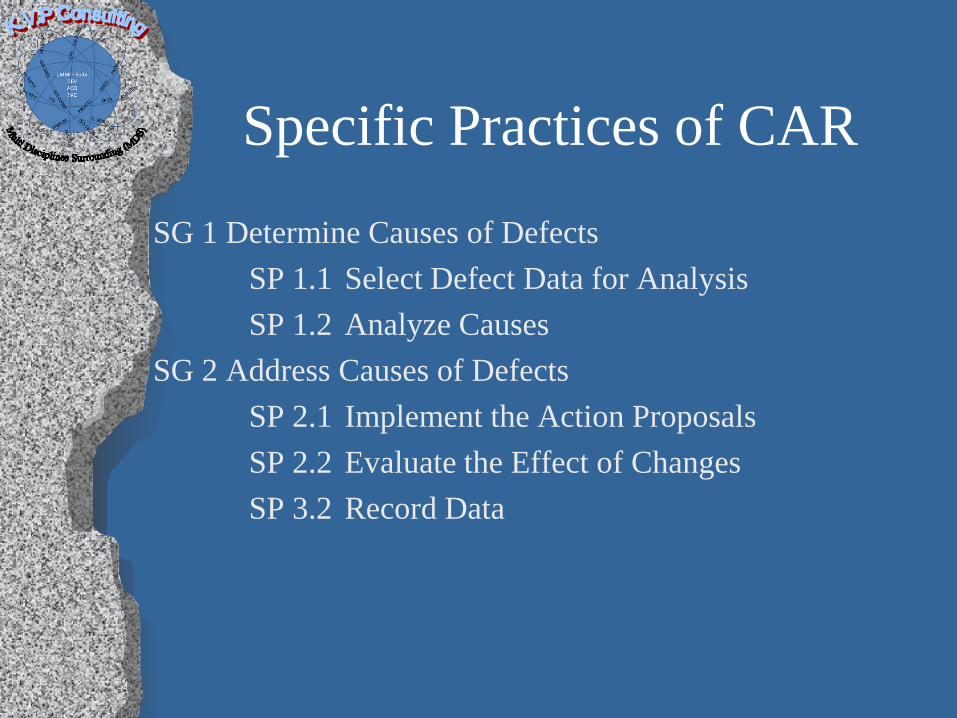
Specific Practices of CAR
SG 1 Determine Causes of DefectsSP 1.1 Select Defect Data for AnalysisSP 1.2 Analyze Causes
SG 2 Address Causes of DefectsSP 2.1 Implement the Action ProposalsSP 2.2 Evaluate the Effect of ChangesSP 3.2 Record Data

Causal Analysis and Resolution Context
SelectDefect Data
for Analysis
AnalyzeCauses
Implementthe ActionProposals
Evaluatethe Effect
of Changes
RecordData
Selected Action Proposals &Improvement
Proposals
CAR Records
PerformanceMeasures
DetermineCauses of Defects
Address Causesof Defects
QPM
Defects and Problems
Action Proposals
OID
CAR Summary
•CAR has its greatest value when performed in the context of a quantitatively managed process.•CAR involves
• a selection of defects or problems whose resolution would benefit the organization
• a root cause analysis• development and implementation of an action plan to
remove the root causes of the defects or problems
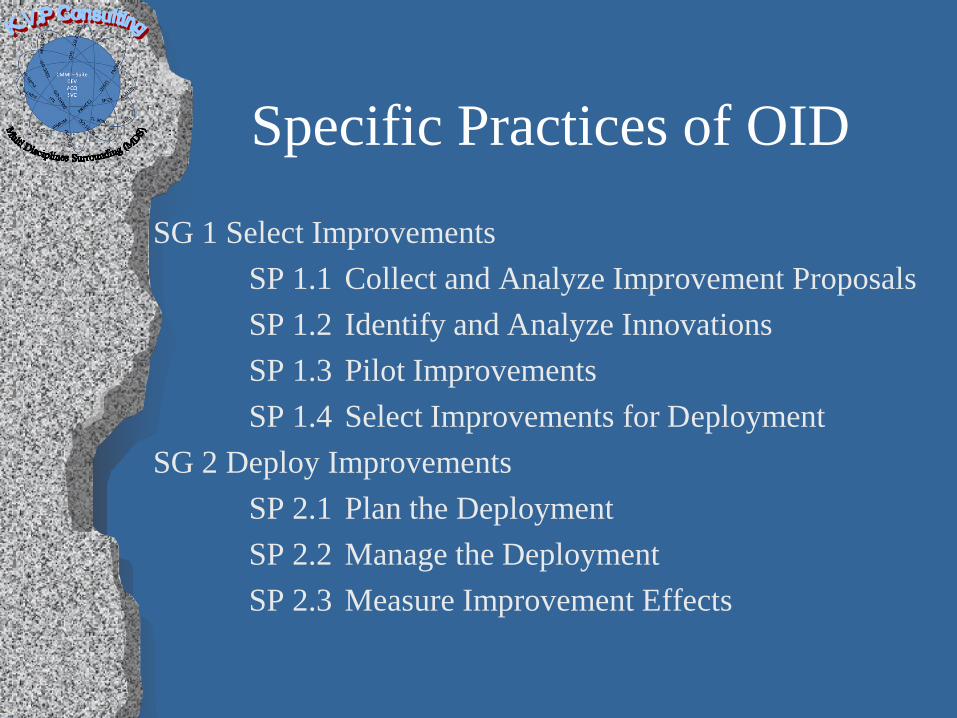
Specific Practices of OID
SG 1 Select ImprovementsSP 1.1 Collect and Analyze Improvement ProposalsSP 1.2 Identify and Analyze Innovations SP 1.3 Pilot ImprovementsSP 1.4 Select Improvements for Deployment
SG 2 Deploy ImprovementsSP 2.1 Plan the DeploymentSP 2.2 Manage the DeploymentSP 2.3 Measure Improvement Effects
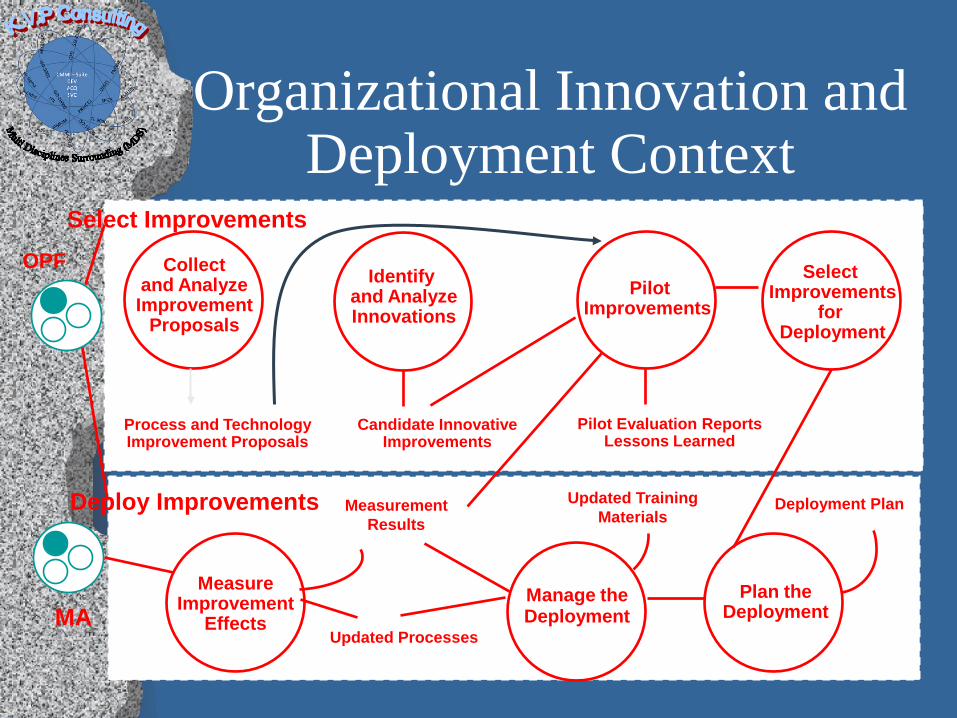
Organizational Innovation and Deployment Context
Collectand AnalyzeImprovement
Proposals
Candidate Innovative Improvements
PilotImprovements
Pilot Evaluation ReportsLessons Learned
Select Improvements
for Deployment
Manage theDeployment
MeasureImprovement
EffectsPlan the
Deployment
Deploy Improvements
Select Improvements
Identify and AnalyzeInnovations
Process and Technology Improvement Proposals
Deployment PlanUpdated Training Materials
Measurement Results
MA
OPF
Updated Processes
OID Summary
•OID uses the quantitative information developed at ML4 to identify, analyze, and select incremental and innovative improvements to the organization’s processes and technologies.•OID involves both incremental improvement (everyone in the organization is involved) and revolutionary improvements (outward looking and opportunistic) to targeted processes.•Improvements are introduced systematically in the organization by conducting pilots, analyzing costs and benefits, and planning and managing deployment.•OID embodies continuous improvement that results from implementing all the PAs in the model.

However
The Theory in the Model is Nice
Real Life is More Complicated
Much More
Considerations for Optimization
• Optimization is successful when the cost of manufacturing will drop and your profit will increase
• Produce high-quality products within shorter time lines
• To Correct balance between time and cost versusyield and quality is essential to maximize return on investment

Considerations for Optimization
• Demonstration of the scalability • Partial selection of what to optimize
• Material • Cost of product • Design for
• Scalability• Availability• Reliability• Serviceability• Maintainability• Supportability• Stability• Reusability
• Sustainability of the Technology as a solution
Main Steps for High Maturity Process Improvement
• During our analysis and planning, we were able to identifyimprovement targets in main lifecycle areas such as
• operations, • information, • governance, • people • organizational structure, • portfolios, • project execution, • finance.
• And as in core process that are critical to the system success such as stakeholder management, technical interfaces and integration.
Main Steps for High Maturity Process Improvement
As the result of this observation we have built an action plan, • Then in the second step we have built a interfaces map
using the lifecycle model, which enable us to begin the improvement journey, and manage the transformation to higher maturity by building on each successive step, and ultimately delivering the benefits expected: • reuse • improved compatibility and quality• response time• interoperability• business agility.
• Process performance and its impact on the organization governance is a significant part of that journey
• Case Studies• Process Optimization (Brief Walkthrough)• Product Optimization (Brief Walkthrough)• Product Optimization Which Leads to Process
Optimization (Detailed Walkthrough)
Suggested MeasuresPlanned and Managed Process
• Availability and completeness of plan
• Plan for resource• Overall performing
time• Omissions in
performance• Compliance to plan

Process Levels and DimensionsArchitected and Improved Process
• Objectives• Structured• Monitored / Measured• Effective / Efficient• Process Interfaces and
Integration in Lifecycle
• Prioritize and Balance Resource Utilization within Larger Context
Suggested Measures Architected and Improved Process
• Process productivity• Process resources
utilization effectiveness• Process resources
utilization efficiency• Meeting the process
objectives• Other processes interfaces
efficiency• Process related defects
density
Process Levels and DimensionsOperationally Optimized Process
• Known Capability and Stable• Defined Ingredients• Known Critical Elements• Meeting Objectives• Controlled Interfaces• Responsive / Modifiable• Resilience / “Agile”• Relevant ‘What If’s Scenarios• Accepted Tolerance / Freedom
Boundaries• Predictable Outcomes
Suggested Measures Operationally Optimized Process
• Influence of Critical Elements on process output
• Process resources utilization ‘What If’s Scenarios
• Process elements capability• Quantitative definition of
process ingredients
Product Levels and Dimensions
• Planned and Managed System • Architected and Engineered System• Operationally Operated and Optimized
System
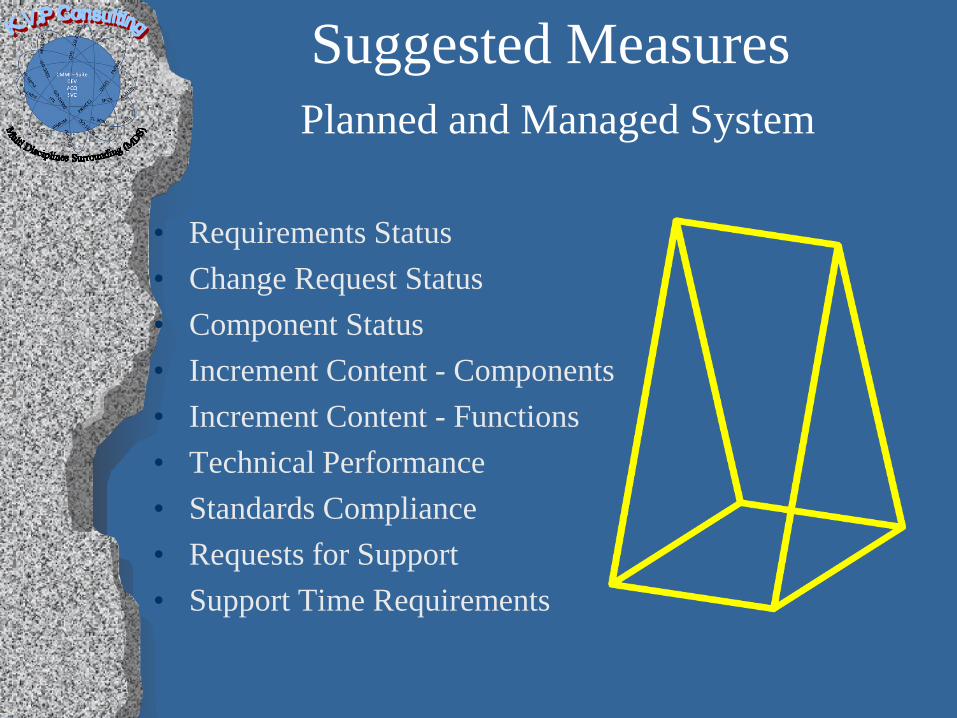
Suggested Measures Planned and Managed System
• Requirements Status • Change Request Status • Component Status • Increment Content - Components • Increment Content - Functions • Technical Performance • Standards Compliance • Requests for Support• Support Time Requirements
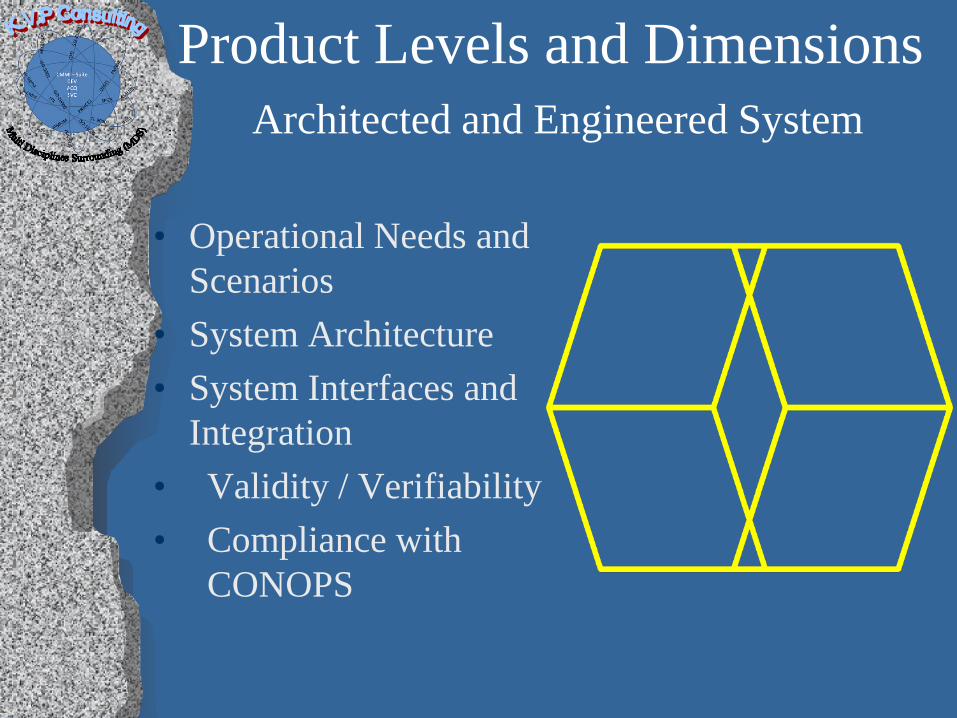
Product Levels and DimensionsArchitected and Engineered System
• Operational Needs and Scenarios
• System Architecture• System Interfaces and
Integration• Validity / Verifiability• Compliance with
CONOPS

Suggested Measures Architected and Engineered System
• Maintenance Actions • Technical Performance • Performance Rating• Requirements Coverage• Defect Containment• Utilization• Reuse level• Interfaces performance• Validation accuracy
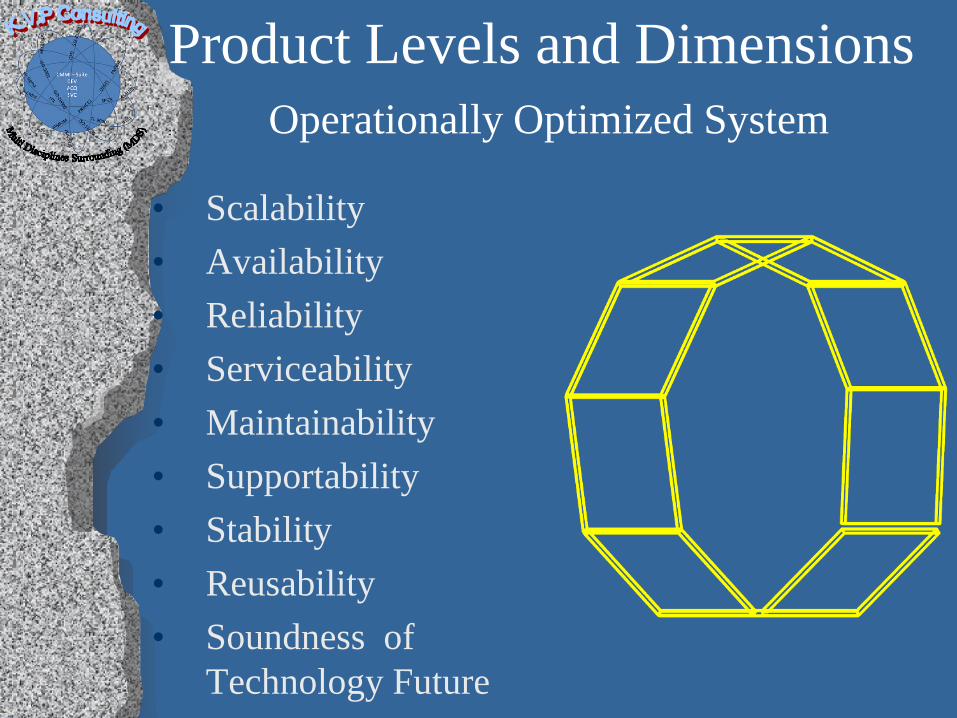
Product Levels and DimensionsOperationally Optimized System
• Scalability• Availability• Reliability• Serviceability• Maintainability• Supportability• Stability• Reusability• Soundness of
Technology Future
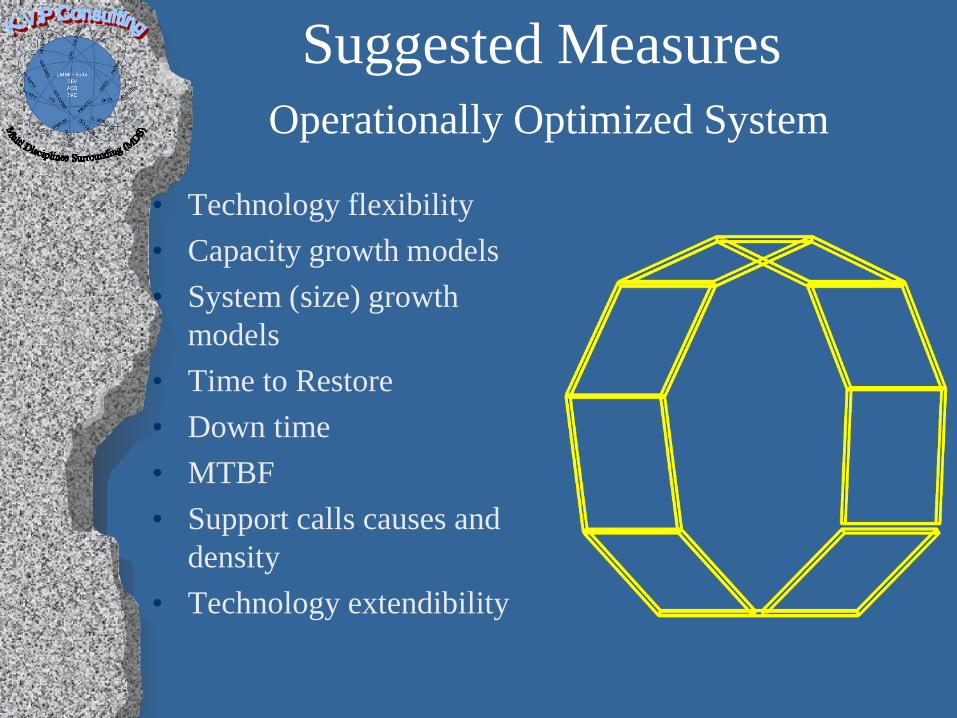
Suggested Measures Operationally Optimized System
• Technology flexibility• Capacity growth models• System (size) growth
models• Time to Restore• Down time• MTBF• Support calls causes and
density• Technology extendibility

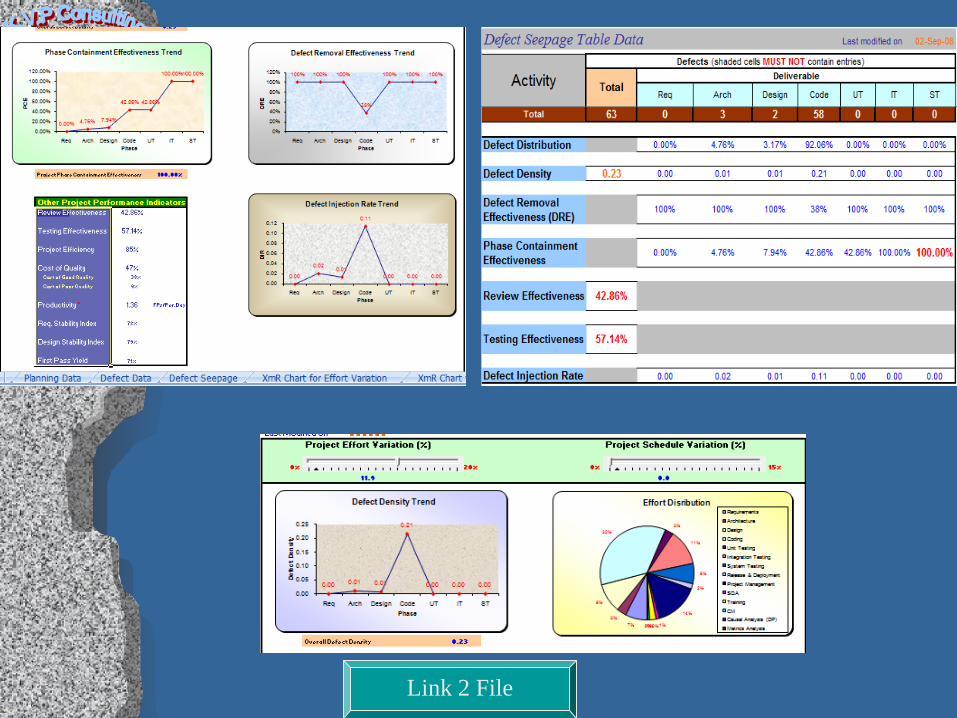
Case studies

Link 2 File

Link 2 File
Link 2 File
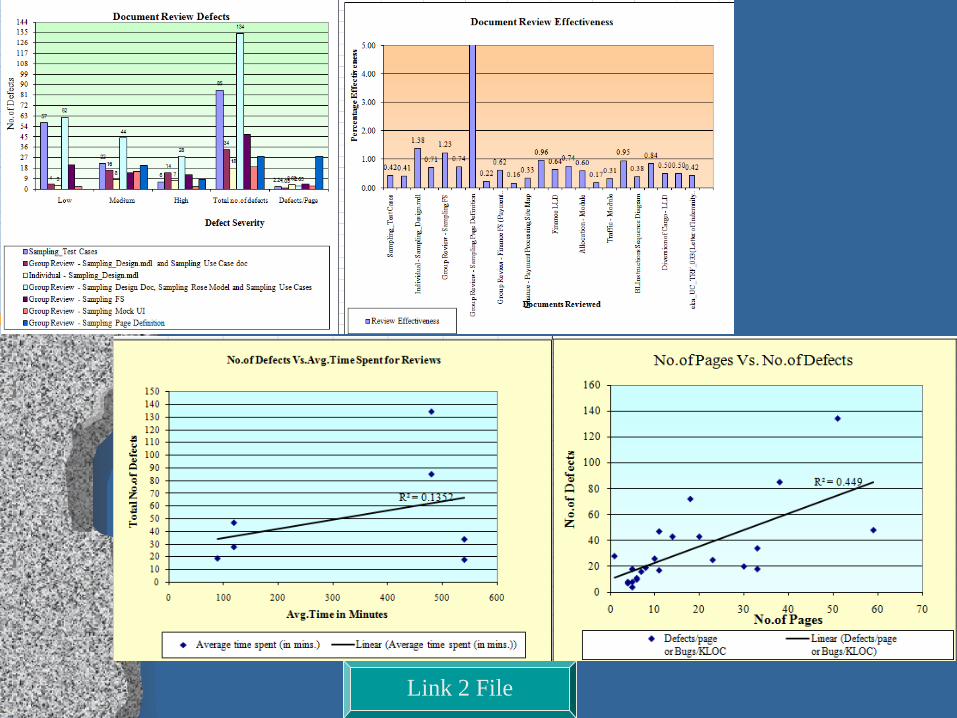
Link 2 File