Embed Size (px)
Citation preview

TANJUNG LUAR SHARK FISHERY - ACIAR PROJECT FIS/2006/142
ACIAR PROJECT FIS/2006/142
TANJUNG LUAR (EAST LOMBOK) LONGLINE
SHARK FISHERY FINAL REPORT

TANJUNG LUAR SHARK FISHERY - ACIAR PROJECT FIS/2006/142
ACIAR PROJECT FIS/2006/142
TANJUNG LUAR (EAST LOMBOK) LONGLINE
SHARK FISHERY FINAL REPORT
This report is an extension output from ACIAR Project FIS/2006/142, Developing new assessment and policy frameworks for Indonesia’s marine fisheries, including the control and management of Illegal, Unregulated and Unreported (IUU) Fishing. This project was a collaboration between Agency of Marine and Fisheries Research and Development (Indonesia), Directorate General of Capture Fisheries (Indonesia), University of Wollongong (Australia) and Commonwealth Scientific and Industrial Research Organisation (Australia). Suggested citation: White, W.T., Dichmont, C., Purwanto, Nurhakim, S., Dharmadi, West, R.J., Buckworth, R., Sadiyah, L., Faizah, R., Sulaiman, P.S. & Sumiono, B. (2012). Tanjung Luar (East Lombok) Longline Shark Fishery. Report prepared for ACIAR Project FIS/2006/142, Developing new assessment and policy frameworks for Indonesia’s marine fisheries, including the control and management of Illegal, Unregulated and Unreported (IUU) Fishing. Australian National Centre for Ocean Resources and Security (ANCORS), University of Wollongong, Australia. 53 pp. ISBN: 978-‐1-‐74128-‐227-‐6 (Hardcopy) ISBN: 978-‐1-‐74128-‐228-‐3 (eBook)

TANJUNG LUAR SHARK FISHERY - ACIAR PROJECT FIS/2006/142
Contents 1. INTRODUCTION ..................................................................................................... 1 1.1 Background ................................................................................................................................... 1 1.2 Project Objectives ...................................................................................................................... 2 1.3 The Tanjung Luar Shark Longline Fishery ...................................................................... 3 1.3.1 Fishery characteristics ........................................................................................................ 4 1.3.2 Catch Statistics Information .............................................................................................. 5 1.3.3 Effort Information .............................................................................................................. 11 1.3.4 Species, Sex and Size Composition Data ................................................................... 13 1.3.5 Comparison of gillnet and longline catches at Tanjung Luar .......................... 25 1.4 Yield per recruit analyses ................................................................................................... 26
2.0 RECOMMENDATIONS & FURTHER WORK .................................................... 37 3.0 REFERENCES ........................................................................................................ 41 APPENDICES ................................................................................................................ 43 Appendix 1: Supplementary Tables ........................................................................................ 43 Appendix 2: Data handling notes ............................................................................................. 46 Appendix 3: Protocol & keys for enumerators ................................................................... 47 Appendix 4: Recommendations from stakeholder workshops. ................................. 52

TANJUNG LUAR SHARK FISHERY - ACIAR PROJECT FIS/2006/142

TANJUNG LUAR SHARK FISHERY - ACIAR PROJECT FIS/2006/142
1
1. INTRODUCTION 1.1 Background This Final Report is an extension output of ACIAR Project FIS/2006/142: “Developing new assessment and policy frameworks for Indonesia’s marine fisheries, including the control and management of Illegal, Unregulated and Unreported (IUU) Fishing”. The project was a collaboration between the Agency of Marine and Fisheries Research and Development (AMAFRAD) and Directorate General of Capture Fisheries (DGCF), both of Indonesia’s Ministry of Marine Affairs and Fisheries, together with Australian partners University of Wollongong and Commonwealth Scientific and Industrial Research Organisation (CSIRO). The project commenced in 2008 with three principle objectives: 1. To develop new, fishery-‐specific stock assessment processes. 2. To develop new, innovative fisheries policy and management frameworks. 3. To develop improved scientific and policy frameworks for sustainable management of
Red Snapper stocks within Indonesia waters. Phase 1 of the project included a survey of all marine fisheries at seven fishing ports in six provinces: Tanjung Luar (West Nusa Tenggara), Kedonganan (Bali), Muncar (East Java), Pacitan (East Java), Sadeng (DI Yogyakarta), Cilacap (Central Java), and Palabuhanratu (West Java). In March 2009, three fisheries were chosen for in-‐depth study: Lobsters of south coast Java, sardines (lemuru) of Bali Strait, and the shark fishery of East Lombok. These fisheries became the focus for objectives 1 and 2 above during Phase 2. This required as complete as possible assessments of these selected fisheries through collation of existing information, field investigations, interviews with fisheries officers at all levels (National, Provincial, Regency and Sub-‐district), interviews with port authorities, fishers associations, fishing companies, and from consultations with all relevant stakeholders in workshops such as this one. Key issues were identified for each fishery and draft recommendations formulated to address the needs for improved fisheries statistics, seasonal market sampling, biological research, stock assessments, improved fisheries laws, regulations and management, and also addressing IUU fishing problems. The Report presents the results of an assessment workshop for the Tanjung Luar (East Java) Longline Shark Fishery. The Workshop objectives were to:
1. Analyse Dinas Perikanan catch and effort statistics and compare with the market survey data
2. Describe the species, sex and size composition data of the fishery based on the market survey data;
3. Describe issues with the various data sets and develop recommendations to address these;
4. Develop further policy recommendations based on analyses of the available information provide summaries of all information as a workshop report.
We examined information on shark catches and effort for the Tanjung Luar district. The information came from three separate sources: Market surveys conducted as part of this

TANJUNG LUAR SHARK FISHERY - ACIAR PROJECT FIS/2006/142
2
and previous ACIAR surveys, Dinas Perikanan statistics and “Local Fisheries” data. By the last we mean the data collected on catches and effort at each market. This data should be the basis of all aggregated provincial level Dinas Perikanan data, but is not subject to the scaling and aggregation rules. By using comparisons among these sets we can examine how statistics at different scales are produced, and whether procedures might be updated to provide better information for fisheries management. 1.2 Project Objectives Indonesian fisheries are among the largest and most productive worldwide, and are critical to the nation’s economic development and in providing food resources to millions of people. Based on FAO data for 2004, about 4.5 million tonnes of marine fish (value ~ $US3.2 billion) are harvested by millions of people using a range of gears, including hundreds of thousands of fishing boats. This places Indonesian marine capture fisheries among the top five in terms of national fisheries production. The University of Wollongong (UoW) and CSIRO Marine and Atmospheric Research from Australia have collaborated with agencies within the Ministry for Marine Affairs and Fisheries (MMAF) in Indonesia to develop a research project to: better understand the characteristics of the various district and provincial fisheries (e.g., fishing methods, capture species, fishing areas, fish marketing and trade, IUU fishing activities, fishing vessel licensing and regulatory framework, fisheries data collection process); and, to investigate new and innovative assessment and management approaches. The agencies within MMAF involved with the project are: the Research Centre for Fisheries Management and Conservation (RCFMC) and the Directorate General of Fisheries Resources Management (DFRM). A scoping study of fishing activities, catches, management and IUU fishing in seven fishing ports over a region that encompasses several provinces (West, Central & East Java, Lombok and Bali) has been completed and three fisheries selected as case studies for further detailed investigation: the Tanjung Luar (Lombok) Shark Fishery; the Bali Strait Lemuru Fishery; and, the South Java Lobster Fishery. For each of these fisheries, a series of stakeholder workshops, training and capacity building activities, and data review meetings will be conducted. These activities are designed to provide new fisheries data, raise awareness of fisheries research and management options, and engage with policy makers at the national, provincial and district levels of government. The primary goal of this Data Review and Assessment Meeting was to review the newly-‐derived and existing information concerning the Tanjung Luar (Lombok) Shark Fishery and provide initial assessment of the fishery and policy advice based on these analyses. Meeting objectives were specifically to:
• Describe species composition and finer scale biological information collected as part of several related ACIAR projects over the past 9 years;
• Evaluate the usefulness of the current Dinas Perikanan statistics; • Describe issues with existing data sets and develop recommendations to improve
collection of catch statistics and related information; and, • Develop policy recommendations and other advice based on these analyses.

TANJUNG LUAR SHARK FISHERY - ACIAR PROJECT FIS/2006/142
3
Information came from three separate sources: market surveys conducted by RCFC and CSIRO researchers as part of this and previous ACIAR projects; “local fisheries data”; and official Dinas Perikanan catch statistics. Local fisheries data is collected at each market and is not subject to scaling or aggregation. This data should be the basis for the Dinas Perikanan catch statistics, which have been scaled and aggregated according to an established procedure. 1.3 The Tanjung Luar Shark Longline Fishery Tanjung Luar is located in East Lombok and is part of the Nusa Tenggara Barat (NTB) province. The longline fishery for sharks is a dominant component of the landings at this site, and detailed market data of all sharks landed at this site between 2001 and 2011 show that the landings from the longline fishery represent 93% of the biomass of all sharks recorded during these surveys. This fishery targets sharks primarily for their fins, but all sharks are landed whole into the market place and almost all parts are utilised. Fishers use gill nets to obtain bait, typically skipjack tuna (Katsuwonis pelamis), for use on the longlines. The longline fishery consists of vessels operating drift longlines (pelagic) and vessels operating bottom set longlines. Landings occur between 6 am and 8 am every day with all sharks being brought into a covered area and lined up according to the boat by which they were caught. After 8 am, each boat’s catch is sold by auction and if sold, processors commence processing of the sharks immediately. Fins are removed first, then the trunk is cut in half longitudinally and cartilage, flesh and skin are separated into piles.
Landing of sharks at 6am from a drift longline boat at Tanjung Luar. Rows of landed sharks from three drift longline boats (one row = one boat) prior to auction

TANJUNG LUAR SHARK FISHERY - ACIAR PROJECT FIS/2006/142
4
1.3.1 Fishery characteristics There are a total of 41 vessels that use either drift or bottom longlines targeting sharks at Tanjung Luar. [note: data collected from Tanjung Luar fisheries office in 2009], of which
• 19 vessels were 5–10 GT; capacity between 1–10 tons • 22 vessels were 10–30 GT; capacity > 10 tons
The pelagic (drift) longlines have the following physical characteristics:
- Length – 1,000-‐2,000 m - Branch length 5 m - 500 hooks in total - hook size no. 1 - Multi filament nylon line no. 10
Illustration of a section of a drift longline Longlines are released to follow the current when setting. The fishing areas for the drift longlines are around Nusa Tenggara Timur (East Nusa Tenggara) and to as far as Sorong (Papua). Trip duration is 23-‐30 days, with a 4 person crew. June and July are peak months for this method. The bottom longlines have the following physical characteristics:
- Length – 18,000 m - 7-‐10 bamboo poles with flags and floats - 60 hooks between flags - Branch length 15 m - 30 m between branches - 600 hooks in total - hook size no. 0 - Multi filament nylon line no. 6
Illustration of a section of a bottom set longline Bottom longlines are set in 50-‐100 m depth. The fishing areas for the bottom longlines are around Nusa Tenggara Timur (East Nusa Tenggara) and Southern Sumbawa water. Trip duration is 7 days, with a 3-‐4 person crew. December to March is the peak season for this method.

TANJUNG LUAR SHARK FISHERY - ACIAR PROJECT FIS/2006/142
5
Utilisation of the catch Each boat’s catch of longline sharks is auctioned after all sharks are landed, often at around the same time (8–9 am) each day. Information on the final auction prices for the catches of 71 boats has been collected by the market data. Following auctioning, processors quickly start working on animals with fins being removed, then flesh, skin and cartilage being separated out.
Organising excised fins from sharks during processing Fins are dried at the landing site and fetch very high values once dried. Prices vary depending on size and species (prices per dry kilo):
• Hiu Korea I (super size) Rp. 500.000 / kg • Hiu Korea II (small size) Rp. 200.000 / kg • Hiu Kajen (large Carcharhinus sp) Rp. 1.000.000 / kg • Hiu Macan (tiger sharks) Rp. 800.000 / kg • Hiu Putih (largest size – C. obscurus) Rp. 1.500.000 / kg • Hiu martil (hammerhead sharks) Rp. 1.000.000 / kg
Fins are then sold and distributed to Lombok, Denpasar, Surabaya and Jakarta. The flesh is sold to the local area and salted; the salted meat then sent to East and West Java. The liver is processed for its oil and the resulting oil sent to Java. The skin is utilised as a food source (crackers – kerupak) or as leather for wallets, etc. Cartilage will often be sold as‘filler’ in shark-‐fin soup and teeth are exported to Bali to be sold as souvenirs. 1.3.2 Catch Statistics Information Three datasets were available to estimate catches of sharks by the longline fishery: 1) Market survey data: collected by this and previous ACIAR projects (White, Dharmadi, et al.). Daily species and catch composition data from Tanjung Luar on 85 occasions between April 2001 and February 2011. Data collected: species composition of the longline catches and gear type (bottom or pelagic); sex and total length (or precaudal length if tail damaged) or disc width were recorded for each individual shark or ray landed; clasper length (mm), clasper calcification, maturity level, weight (kg), fish number (if vertebrae collected), and number and mean size of embryos (opportunistic

TANJUNG LUAR SHARK FISHERY - ACIAR PROJECT FIS/2006/142
6
data); weight (kg) was estimated using previously published length vs. weight relationships. In each case, the equation was checked to make sure it was correct and gave realistic weight calculations. From 2004 onwards, the number of longline boats landing on each day was recorded and for each individual of each species a boat number (e.g. 1, 2, 3…) was recorded to indicate which particular boat they were landed from. 2) Provincial Dinas Perikanan data for East Lombok: Annual shark catches for East Lombok from 2000-‐2009. For comparison with Tanjung Luar data, this data was adjusted to account for the proportion of the provincial catches that is from Tanjung Luar (90%) and the proportion of the Tanjung Luar catch of sharks that is from the longline fishery (93% -‐ determined from market survey data). 3) “Local fisheries” daily data: Daily landing data (in kg) of key groups, including sharks, for 2009 and 2010 only. The shark data were then adjusted to reflect the proportion of the typical Tanjung Luar catch that is from the longline boats (i.e. 93%). Annual shark landings at Tanjung Luar Since landings of sharks varied throughout the year, to determine annual catches of sharks from the market survey data, a seasonal pattern of landings was developed to allow for estimation of annual catches based on the surveys available for that particular year. This pattern was produced by using average daily landings for each month observed in market survey data, with data for all years combined. These averages were calculated by dividing the total observed landings (tonnes) per month across all years by the number of survey days per month, across all years (Table 1). The resulting seasonal pattern (Fig. 1) shows catches highest in July to October and lowest in January and December. Table 1. Calculation of average daily landings for each month using the market survey data for all years combined.
Month Number of survey days
Total observed landings
(kgs)
Average landings per day (kgs)
January 4 1055.1 263.8 February 2 1852.6 926.3 March 12 10872.1 906.0 April 5 5742.6 1148.5 May 4 4087.0 1021.8 June 3 2658.0 886.0 July 9 15994.1 1777.1 August 11 19841.1 1803.7 September 8 24618.5 3077.3 October 13 24485.0 1883.5 November 4 2857.2 714.3 December 4 1435.8 358.9

TANJUNG LUAR SHARK FISHERY - ACIAR PROJECT FIS/2006/142
7
Fig. 1 Shark landings per day over each month for 2001 to 2011, indicating the seasonal
pattern in catches. Estimates are derived from Table 1.
To determine the annual catches based on market survey data, the monthly catches were estimated by scaling the average daily landings from market survey data, i.e. multiplying by the number of days within each month. Where there were no data available for a specific month, the monthly catches were interpolated by multiplying the ratio between average daily landings for that month and for the nearest month (where data available) by the estimated catches for the nearest month. The annual catches were then an aggregate of the monthly estimated catches for one year. Annual shark catches derived by provincial Dinas Perikanan data for east Lombok declined substantially over the early 2000s, from 1836 tonnes in 2001 to just 143 tonnes in 2005 (Table 2; Fig 2). (Note as per the note to Table 2, these figures have been adjusted to reflect Tanjung Luar). However, they increased steadily thereafter, to 731 tonnes in 2009. These should theoretically represent total whole fish weights, and not components such as fins. Catches were not broken down by species but just as ‘shark’. These estimates differ markedly from those derived directly from “Local Fisheries” data; however currently only one year overlaps to enable a comparison. The annual catch for 2009, the longline fishery was estimated from this latter source as 362 tonnes (total landings of sharks, not rays) in Tanjung Luar (summing daily data), compared to 731 tonnes by the Dinas data (Table 2 and Fig. 2). In contrast to information derived from Dinas Perikanan, estimates of annual catch based on market survey data indicate that there was no marked decline between 2001 and 2005, nor a subsequent increase in catches. The market survey data suggest that annual catches were reasonably constant over the decade and generally lower than the estimates from the Dinas Perikanan data (Table 2 and Fig. 2).
!

TANJUNG LUAR SHARK FISHERY - ACIAR PROJECT FIS/2006/142
8
Table 2. Calculation of annual landings (tonnes) based on data from the three sources: provincial Dinas Perikanan data (adjusted to Tanjung Luar only); markets survey data and “local fisheries” daily landings data, for the years where data is available between 2000 and 2011.
Year Dinas Perikanan Catch Data (Tanjung Luar only) (tonnes)1
Market Survey Data using seasonal
pattern (tonnes)
“Local Fisheries” data
(tonnes)2
2000 1726.2 -‐ -‐ 2001 1836.0 247.5 -‐ 2002 784.4 319.7 -‐ 2003 916.2 -‐ -‐ 2004 773.1 541.5 -‐ 2005 142.5 432.3 -‐ 2006 297.6 607.7 -‐ 2007 517.4 -‐ -‐ 2008 650.8 332.8 -‐ 2009 730.8 482.5 362.4 2010 -‐ 342.6 375.1 2011 -‐ 413.7 -‐
1Calculated by multiplying total catches from Dinas Perikanan data for east Lombok, by 93% to estimate catches from the longline fishery (based on market data), then by 90% to account for minor landing sites. 2Calculated by multiplying total catches by local Fisheries data by 93% to estimate longline landings.
Fig. 2 Comparison of annual shark catch estimates for Tanjung Luar, using longlines only, based on the three data sources: market survey data. Dinas Perikanan data and “Local Fisheries” data.
!

TANJUNG LUAR SHARK FISHERY - ACIAR PROJECT FIS/2006/142
9
It was considered that the market survey data was the best estimate of catches currently available for Tanjung Luar. “Local Fisheries” daily data were found to be similar in the two years available. The Dinas Perikanan summary statistics, however, were considered to be quite inaccurate: it appears that the quality of data at point of collection is good -‐ lack of reporting is not a major issue -‐ but subsequent treatment to scale data to produce annual summaries by district or region is introducing some serious biases. Although the overall annual landing estimates from the “local fisheries” and market survey data were very similar, it should be noted that substantial discrepancies were still observed at a daily level in some cases. For the period where the former data were available (2009 and 2010), market survey data were also available for 10 of the same days. The catches for these 10 days were compared to examine how the two data sources differed (Fig. 3). The resulting comparison shows that for about half of the days, the estimated landings of sharks were very similar. However, for three of the days, the local fisheries data overestimated the catch by about 1 tonne each day. Also, on one day (3), the local data had zero catch recorded while the market survey data reported close to 400 kg landed. For those days where inconsistencies in the data were observed, the immediately adjacent days were also different, thus translation errors do not appear to account for those differences. Thus it is important to note that, while the local data provide similar estimates of the shark catches at Tanjung Luar, there are still obvious under and overestimation of the catches occurring on some days. This was particular evident when comparing the catches of rays between the two data sources for the same survey days (Fig. 4). In this case, the catches of rays were similar on some of the days but on one particular day they underestimated the landings of rays by almost 5 tonnes! In fact the local fisheries data did not record this amount of rays for that whole month, let alone for that one day.
Fig. 3 Comparison of the catches (kg) of sharks from the “local fisheries” daily data and the market survey data for the 10 survey days which overlap between 2009 and 2010 at Tanjung Luar.
!

TANJUNG LUAR SHARK FISHERY - ACIAR PROJECT FIS/2006/142
10
Fig. 4 Comparison of the catches (kg) of rays from the local fisheries daily data and the market survey data for the 10 survey days which overlap between 2009 and 2010 at Tanjung Luar.
In conclusion, although the “local fisheries” data is providing reliable annual estimates of the shark catches at Tanjung Luar, there still appear to be some issues with the data collection at some stages. It is also not fully understood how this data is collected since on the market survey trips, there is no one visibly recording daily landings data. Estimates of monthly landings based on the local fisheries data and the market survey data also highlight the fact that they show similar trends, but under and overestimation still appears to be an issue (Fig. 5).
Fig. 5 Monthly estimates of shark longline landings using the market survey data and the “local fisheries” data. Arrows indicate timing of market surveys in 2009 and 2010.
!
! !

TANJUNG LUAR SHARK FISHERY - ACIAR PROJECT FIS/2006/142
11
1.3.3 Effort Information Dinas Perikanan data Information on fishing effort was provided by the provincial Dinas Perikanan. Data for the Regency of East Lombok are provided from seven landing sites, of which Tanjung Luar is just one. Data including catches, number of trips and number of boats are collected at each site, and then collated across the regency. Further processing of data occurs at the provincial level, where statistical summaries are provided for each regency. We were unable to extract effort data for Tanjung Luar alone. However sources in Dinas Perikanan indicated that effort from Tanjung Luar comprises about 70% of total longline effort from the East Lombok district but about 90% of shark catches. These percentages are a rough estimate as we were unable to obtain more precise information on this breakdown. Effort data were expressed as trips per year, but the calculation of this is not understood. It could be based on numbers of boats multiplied by trip length, but it is just not clear what to what the information actually refers. The data show a drop in effort between 2000 and 2002 and then a dramatic increase between 2004 to 2006, to almost 100,000 trips (Fig. 6). However, given the information we have on the number of boats and estimated number of trips from the market survey later (see in subsequent section), these appear to be gross overestimates of the number of trips occurring from this area. The dramatic increase seen between 2004 and 2006 does not match with observations at Tanjung Luar during this period as part of previous ACIAR projects focusing on this fishery.
Fig. 6 Annual effort for drift (pelagic) longline, expressed as total number of fishing trips, for Tanjung Luar. Data points were estimated as 70% of the total for the East Lombok district.
Likewise, the number of licences (gear units) in East Lombok by year, adjusted for drift longline only, varied between about 20,000 (2002) and 110,000 (2009) (Fig. 7). Given observed number of long-‐liners at Tanjung Luar was 41 boats (see earlier) and trip
!
!"
!20,000
!40,000
!60,000
!80,000
!100,000
!120,000
2000 2001 2002 2003 2004 2005 2006 2007 2008 2009
No.$of$trip
s
Year

TANJUNG LUAR SHARK FISHERY - ACIAR PROJECT FIS/2006/142
12
length is 23-‐30 days, this also appears to be a gross over-‐estimate. The rate of change between years is also not consistent between years.
Fig. 7 Annual number of registered longline gears, for the East Lombok province based on Dinas Perikanan data.
A further issue with the Dinas Perikanan data was that bottom longline effort data were only provided for three years, even though this gear type was utilised during the whole market survey period. In conclusion, the effort data provided by Dinas Perikanan appears to be quite inaccurate and not useable for estimation of effort patterns and certainly not useable for catch per unit effort calculations. Market survey data Collection of effort data was not a primary objective of the market sampling. However, as catches for sharks are separated by boat, then it is feasible to estimate the number of boats contributing to catches at the market at any sampling event. Based on the market data collected during this and the previous ACIAR projects, which recorded the number of both pelagic and bottom longline boats landing per day, the average daily landings of both longline types was calculated for each month (years combined). Also, the estimated number of landings per month as well as estimated annual totals was calculated. The overall pattern in number of landings follows a similar pattern to the annual catches per month with years combined (Figs 8 and 9). The number of pelagic longline landings per month are very low in January and February (high seas season) but increase markedly in March through to August; then decline rapidly in December. The number of bottom longline landings varied considerably throughout the year and were highest in February and October. The annual estimated total number of landings of both pelagic and bottom longline boats calculated using the above data is 686 and 597, respectively. These figures represent the number of trips per year by both longline types at Tanjung Luar based solely on our market data. Based on the fact that one bottom longline boat has a trip length of 7 days and thus can theoretically undertake 52 trips per year, an approximate number of 13
!
!"
!200
!400
!600
!800
!1,000
!1,200
2000 2001 2002 2003 2004 2005 2006 2007 2008 2009
Fishing'Ge
ar'Units
Year

TANJUNG LUAR SHARK FISHERY - ACIAR PROJECT FIS/2006/142
13
bottom longline boats was calculated for Tanjung Luar. Similarly with the pelagic longlines, based on a trip length of 23-‐30 days, an approximate number of 38-‐49 boats was calculated.
Fig. 8 Average number of landings per day for both longline types.
Fig. 9 Estimated number of landings per month for both longline types.
1.3.4 Species, Sex and Size Composition Data Overall species composition A total of 36 species were recorded from both longline types, comprising 31 shark species and 5 ray species (Fig. 10). Nine shark families were recorded with the Carcharhinidae (whaler sharks) being the most abundant with 18 species. All other families were represented by only 1, 2 or 3 species. Two of the species recorded from this fishery, Pseudotriakis microdon and Dasyatis microps, represented new records for Indonesia (White et al., 2006). Seventeen of the 36 species belong to one of the threatened categories according to the IUCN Red List of Threatened Species (www.iucnredlist.org) (see Table A1 in Appendix 1).
!
!

TANJUNG LUAR SHARK FISHERY - ACIAR PROJECT FIS/2006/142
14
Fig. 10 Number of species by family recorded from the longline fishery at Tanjung Luar.
Analysis of species composition data by years surveyed focused on the most abundant species. To identify the most important species in catches, we identified those species that comprised 20% or more of the catch, by number or weight, in any year, by either pelagic or bottom set longline gears. Species which constituted at least 20% to the total number or total biomass in a particular year were considered the most abundant species for further analysis (see Table A2 in Appendix 1). Annual trends in catches of abundant species Drift (pelagic) longline The results of analyses of the percentage contribution to the number and weight of each of the most abundant pelagic longline caught species in each of the survey years, showed that there was no obvious annual trend in catches for most species (Figs 11 and 12). Carcharhinus falciformis was by far the most abundant species landed by pelagic longlines in all years surveyed. By weight, C. falciformis was also a large proportion of the catch in each year, but a number of other species, C. obscurus, Galeocerdo cuvier, Isurus oxyrinchus, Prionace glauca and Alopias pelagicus also had a similar or slightly larger contribution to the catch in at least one of the years surveyed. In contrast to tuna longline catches where P. glauca typically represents the vast majority of the catch, far lower proportions were recorded in this study. This is likely related to the area being fished or the depth being fished. Prionace glauca is an oceanic species, but this fishery occurs generally relatively close to land (thus offshore waters rather than oceanic). This is consistent with the presence of large numbers of C. falciformis which prefer deepwater but close to landmasses. This species is typically considered a cool water species and in tropics tends to sit below the thermocline at around 80-‐100 m (Pepperell, 2010). This is in the fishing zone for tuna longlines but less so for the shark drift longlines which would be in shallower water.
!

TANJUNG LUAR SHARK FISHERY - ACIAR PROJECT FIS/2006/142
15
Fig. 11 Annual trends in the percentage (by number) of each of the 7 abundant species from the pelagic longline data.
Fig. 12 Annual trends in the percentage (by weight) of each of the 7 abundant species from the pelagic longline data.

TANJUNG LUAR SHARK FISHERY - ACIAR PROJECT FIS/2006/142
16
Bottom longline The results of analyses of the percentage contribution to the number and weight of each of the most abundant bottom longline caught species in each of the survey years, showed that there was no obvious annual trend in catches for most species (Figs 13 and 14). The only species which showed an apparent trend was Hexanchus griseus. However, this can be explained by the very large size of several individuals caught in some years. For example, in 2001several large individuals were recorded with one having an estimated weight of 632 kg. The most abundant species (by number) recorded from this gear type were Carcharhinus amblyrhynchos, C. obscurus and C. sorrah. By weight, C. obscurus was typically the most abundant species, with C. sorrah contributing much less due to the much smaller average size of this species.
Fig. 13 Annual trends in the percentage (by number) of each of the 8 abundant species from the bottom longline data.

TANJUNG LUAR SHARK FISHERY - ACIAR PROJECT FIS/2006/142
17
Fig. 14 Annual trends in the percentage (by weight) of each of the 8 abundant species from the bottom longline data.
There were no clear declining trends in catches over the years for any of the abundant species. This might indicate that there is little point of concern. However, it could also be a result of fishers needing to fish further away in order to obtain similar catches. During previous ACIAR projects, socioeconomists provided questionnaires to the fishers in Tanjung Luar and in this many indicated that catches have gone down and they need to fish further afield (Vieira, unpubl. data). Thus, this needs to be considered as well as the impact on the minor species, which one could argue are the species where you are more likely to see reductions in catches. The species composition differed markedly between the pelagic and bottom longlines which largely reflects habitat differences (bottom set in shelf waters vs drifting in offshore waters) as well as the fishing areas where gear is being deployed. Bottom longlines use slightly smaller hooks but it was not felt that selectivity differed substantially between pelagic and bottom longlines, or at least was a secondary factor compared to habitat differences. Trends in the mean length of sharks over time The mean length of each of the abundant shark species in each of the year was calculated to determine whether there were obvious trends in the size over time. For both longline

TANJUNG LUAR SHARK FISHERY - ACIAR PROJECT FIS/2006/142
18
types, there was no distinct trend in the mean length of sharks over the years surveyed for any of the species (Figs 15 and 16). It should be noted that this only refers to the most abundant species, and the limited data for some of the minor species does not allow for an analysis of the mean length over years. Carcharhinus longimanus is one of the minor species which was recorded in small numbers between 2001 and 2005, but has not been recorded in subsequent years. This may be due to declines in this species, or may be due to area being fished. This species is an oceanic species and prefers open waters thus fishing may not be occurring in such waters. However, Prionace glauca and Isurus oxyrinchus are oceanic species also but are still being landed in this fishery over the whole time series. Examination of the tuna longline bycatch in other regions would yield better information on this species.
Fig. 15 Mean length of the most abundant pelagic longline caught species over the years surveyed.

TANJUNG LUAR SHARK FISHERY - ACIAR PROJECT FIS/2006/142
19
Fig. 16 Mean length of the most abundant bottom longline caught species over the years surveyed. Seasonality of the catch For each of the most abundant species in either the pelagic or bottom longline fisheries, the average landings per day (both by weight and by number caught) was calculated for each month (yearly data combined) (Fig. 17). The monthly trends in C. falciformis landings closely followed the overall catch pattern produced from the market survey data with highest landings between March and October. Sphyrna lewini followed a relatively similar pattern with a clear peak in September and October. This peak coincides with the approximate time of birthing in this species and is also when the catch is dominated by large, often pregnant, females. Thus, this may represent a reproductively-‐motivated movement pattern of this species into the fishing areas being exploited. Carcharhinus obscurus landings showed a very distinct trend with a clear peak in August to October and very minimal landings in January to June. This is likely a result of movement patterns of the species, since primarily large subadults are landed in the fishery that are probably moving from adjacent regions at that time of the year. Prionace glauca catches showed a very distinct peak in catches in September, which would presumably be related to movement of the species or changes in area being fished. Alopias pelagicus catches were highest in July and September. Carcharhinus sorrah catches were greatest in February to May with very few or none recorded in other months. This species is a more inshore species so this peak may be reflected in the fishing areas exploited by the bottom longline fishers, or may be a result of movement patterns of the species at this time of the year. Isurus oxyrinchus catches were greatest between May and October which followed the peak fishing season of the pelagic longline boats. The remaining species catches exhibited little monthly variation.

TANJUNG LUAR SHARK FISHERY - ACIAR PROJECT FIS/2006/142
20
Fig. 17 Mean weights landed by days surveyed of the most abundant longline caught species throughout the year (yearly data combined).
TANJUNG LUAR SHARK FISHERY - ACIAR PROJECT FIS/2006/142
21
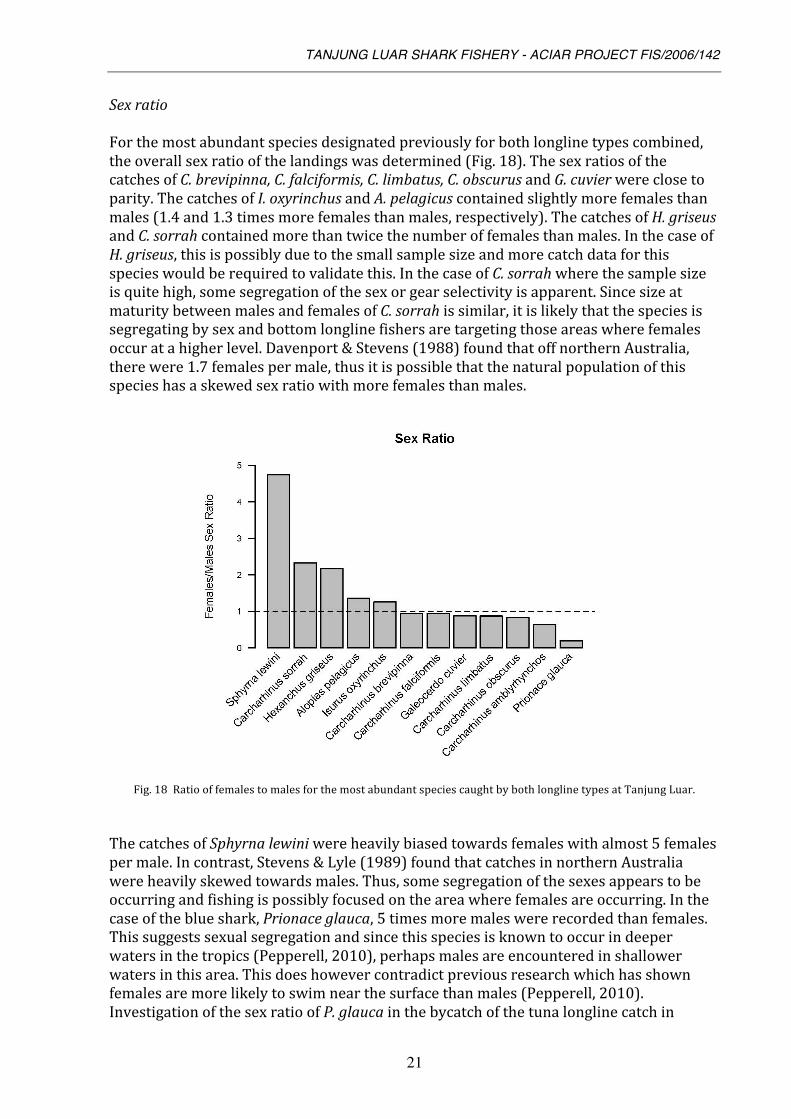
Sex ratio For the most abundant species designated previously for both longline types combined, the overall sex ratio of the landings was determined (Fig. 18). The sex ratios of the catches of C. brevipinna, C. falciformis, C. limbatus, C. obscurus and G. cuvier were close to parity. The catches of I. oxyrinchus and A. pelagicus contained slightly more females than males (1.4 and 1.3 times more females than males, respectively). The catches of H. griseus and C. sorrah contained more than twice the number of females than males. In the case of H. griseus, this is possibly due to the small sample size and more catch data for this species would be required to validate this. In the case of C. sorrah where the sample size is quite high, some segregation of the sex or gear selectivity is apparent. Since size at maturity between males and females of C. sorrah is similar, it is likely that the species is segregating by sex and bottom longline fishers are targeting those areas where females occur at a higher level. Davenport & Stevens (1988) found that off northern Australia, there were 1.7 females per male, thus it is possible that the natural population of this species has a skewed sex ratio with more females than males.
Fig. 18 Ratio of females to males for the most abundant species caught by both longline types at Tanjung Luar. The catches of Sphyrna lewini were heavily biased towards females with almost 5 females per male. In contrast, Stevens & Lyle (1989) found that catches in northern Australia were heavily skewed towards males. Thus, some segregation of the sexes appears to be occurring and fishing is possibly focused on the area where females are occurring. In the case of the blue shark, Prionace glauca, 5 times more males were recorded than females. This suggests sexual segregation and since this species is known to occur in deeper waters in the tropics (Pepperell, 2010), perhaps males are encountered in shallower waters in this area. This does however contradict previous research which has shown females are more likely to swim near the surface than males (Pepperell, 2010). Investigation of the sex ratio of P. glauca in the bycatch of the tuna longline catch in

TANJUNG LUAR SHARK FISHERY - ACIAR PROJECT FIS/2006/142
22
Indonesia would be required to understand this sex ratio pattern better. This species is known to show strong sexually segregation and off eastern Australia a similar sex ratio to that observed in this study was also recorded (Stevens, 1984). In the latter study, females were observed most abundantly in September and October, but in our study females only constituted 16% of the catch in these months. It therefore appears as if the gear used by these fishers is not fishing in habitats where females occur or, more likely, females are located in different areas, not fished by these longliners. Examination of the tuna longline bycatch would be valuable to better understand this process. One important conclusion that can come from this data is that the Tanjung Luar fishery is likely to be heavily impacting on S. lewini populations given it is one of the most abundant species caught and that it catches predominantly females. In contrast, this fishery is likely to only have low impact on P. glauca populations given that it predominantly catches males. Length frequency distributions Length frequency histograms were produced for the abundant species in both the pelagic and bottom longline fisheries. Length classes of 100 mm were used and individuals were classified as either immature or mature based on known female and male maturity (see Appendix 1, Table A2). The length frequency plots for the abundant pelagic longline species (Fig. 19) show that for the majority of species, the majority of the catch is comprised of immature individuals. This is particularly evident in Carcharhinus obscurus where although only a relatively small size range of individuals was recorded, almost all of these sharks were just prior to becoming mature. A similar situation was also found with Galeocerdo cuvier, with the vast majority of individuals recorded being immature. In contrast, the vast majority of Prionace glauca recorded were mature with only a very small number of immature individuals recorded. The length frequency plots for the abundant bottom longline species (Fig. 20) showed a more mixed result. The catches of several species, C. amblyrhynchos, C. limbatus and C. sorrah, were dominated by mature individuals. As was shown in Fig. 19, C. obscurus and G. cuvier catches were dominated by immature individuals. Carcharhinus brevipinna and Sphyrna lewini catches were dominated by immature sharks, but they also included a large number of mature individuals.

TANJUNG LUAR SHARK FISHERY - ACIAR PROJECT FIS/2006/142
23
Fig. 19 Length frequency histograms for the abundant species caught by pelagic longlines at Tanjung Luar. Red bars indicate immature individuals; blue bars indicate mature individuals.

TANJUNG LUAR SHARK FISHERY - ACIAR PROJECT FIS/2006/142
24
Fig. 20 Length frequency histograms for the abundant species caught by bottom longlines at Tanjung Luar. Red bars indicate immature individuals; blue bars indicate mature individuals.

TANJUNG LUAR SHARK FISHERY - ACIAR PROJECT FIS/2006/142
25
1.3.5 Comparison of gillnet and longline catches at Tanjung Luar To gain an understanding of the effect of other gear types on the species that were abundant in the longline fishery catches, the proportion of catches by both number and weight caught by gillnets for the abundant species were determined where comparable data was available. Such comparable data were available for 24 of the 85 days surveyed. The number and biomass of sharks caught by gillnets compared to longlines at Tanjung Luar was proportionally low for the vast all but one, Carcharhinus sorrah, of the abundant species (Table 3). The most abundant longline caught species, C. falciformis, was also caught by gillnets operating out of Tanjung Luar, but this only represented 2 and 10% by number and weight, respectively, of the catches of this species. It is clear from this data that the longline fishery accounts for the vast majority of the catches of the dominant species at Tanjung Luar. Carcharhinus obscurus and Hexanchus griseus were not caught by gillnets at this site, at least during the surveys conducted on this and previous projects. One important finding from this dataset is that for some species, in particular C. sorrah, the catches from multiple fisheries need to be taken into account.
Table 3 Proportion of gillnet catches to longline catches for the most abundant species.
% by number
% by weight
Alopias pelagicus 2.8 26.0 Carcharhinus amblyrhynchos 16.3 15.8 Carcharhinus brevipinna 11.1 7.2 Carcharhinus falciformis 2.1 10.0 Carcharhinus limbatus 9.6 7.8 Carcharhinus obscurus 0 0 Carcharhinus sorrah 50.0 56.3 Galeocerdo cuvier 0.6 1.0 Hexanchus griseus 0 0 Prionace glauca 0.4 3.3 Sphyrna lewini 1.6 5.7

TANJUNG LUAR SHARK FISHERY - ACIAR PROJECT FIS/2006/142
26
1.4 Yield per recruit analyses As indicated in the preceding ACIAR project, Artisanal Fisheries for Sharks and Rays in Eastern Indonesia, yield per recruit analyses are a means of providing general policy advice about the capacity for a species to support sustainable fisheries, when full assessments based on abundance or fishing mortality rate information, are not feasible. Utilising the methods and analyses developed by Blaber et al. (2009), we introduce a new analysis for Alopias pelagicus and updated analyses, given new biological information, for Sphyrna lewini, Prionace glauca, Isurus oxyrinchus, Carcharhinus falciformis and C. obscurus. Data derived from the current project and updated literature information were both used to inform the analyses (see Appendix 1, Table A3). Information required included age at maturity, maximum age, litter size, sex ratio, length-‐weight relationships and the von Bertalanffy parameters (Linf and K, as well as t0 or Lzero). These were established from the market sampling data or, if this was not possible, taken from the literature (Appendix 1, Table_A3). For three species, I. oxyrinchus, C. falciformis and C. obscurus, the growth information included in the analyses was via a form of the von Bertalanffy growth function (Semba et al., 2009), that utilises additional information on pup size at birth, i.e. Lzero (Appendix 1, Table A3). However, as estimation of all the parameters in the growth function is affected by changing the form of the function used, it was possible to use this approach for only those species where growth equations had been published in that way. The proportion of reproductive potential remaining after harvest (Gallucci et al., 2006) was also determined. For given relative age at vulnerability attributes of a fishery, this indicates the ability of a population to grow or not. As in Blaber et al. (2009), this is presented as an additional reference point. The per recruit models used published life history parameters and observations from market sampling. A 50:50 sex ratio was assumed for all species. Since relative vulnerability at age i (vi) was unknown, a range of values are considered. Relative vulnerability at age was calculated as:
( )
( )1
1 12
i
iv
i
Ω
Ω Ω=
Ω + (0.1)
where 1Ω is a concentration parameter, determining the steepness of the relative vulnerability at age curve, and 2Ω is the age at 50% relative vulnerability. The different ages at 50% vulnerability were tested in the analyses: 0, 6 and 14 years. This reflects the variety of fishing gears observed in the region. Average length and then weight for each age were calculated from the von Bertalanffy growth function and length-‐weight regression: ( )( )01 K i i
iL L e− −∞= − (0.2)
where tL is the length at age, i L∞ is the average maximum length, K is the instantaneous rate of growth, and i0 is the age at which length is zero.

TANJUNG LUAR SHARK FISHERY - ACIAR PROJECT FIS/2006/142
27
and b
i iW aL= (0.3)
A Leslie Matrix discrete model (Quinn & Deriso, 1999) of an unharvested population, assuming population parameters remain constant over time, can be written as:
1t t+ =N MN where the population vector of female abundance Nt in year t is multiplied by the projection matrix M (of size imax by imax) to get the female population vector of abundance in year t+1. The projection matrix was developed as:
where Si is the annual survival fraction of age i at the beginning of the year, and fi is the net fecundity of age i females.
For a fished population, the formula becomes:
1t t+ =N MHN where H is the harvest matrix with diagonal elements hi (or iFe− ) is the harvest survival matrix at age i. There are properties of this projection matrix that are useful. For example, if the dominant eigenvalue of the MH matrix (λʹ′ -‐ giving the multiplicative increase of the harvested population at the stable age distribution or can be defined as the long-‐term deterministic measure of growth rate of a population in a constant environment) is equal to 1, then it indicates that those harvests have led to a stationary population size (Quinn and Deriso 1999); if λʹ′ < 1 then abundance ultimately decreases, while if λʹ′ >1 then abundance increases. In the latter case, after a population reaches a stable age distribution, it will grow exponentially at a rate equal to lambda. Gallucci et al. (2006) calculate the reproductive potential and demonstrate that the fraction of the reproductive potential harvested annually, Φ , is linearly related to the annual change in population size, λʹ′ . They further calculate a value which is:
( )1 /stationary λ λΦ = − Where λ is the dominant eigenvector of matrix M. Thus the proportion of reproductive potential that remains after fishing can be used as an indicator of whether a population has the capacity to grow, and the value can be used as a reference point. It is therefore possible to calculate the corresponding fishing mortality (Fstationary) that, over the long term and given a specific age at 50% vulnerability (Ω2), would produce a population that is in a stable state. The following standard per recruit outputs were also calculated for the three ages at 50% vulnerability: the equilibrium fishing mortality that corresponded to the maximum yield per recruit, Fmax, and the equilibrium fishing mortality at 20% of virgin stock size.
!
1 0 2 0 max
1
2
max
0 00
0 0
o i
i
S f S f S fS
SS
! "# $# $# $# $# $% &
KK
M ML
!Φstationary
!Φstationary
TANJUNG LUAR SHARK FISHERY - ACIAR PROJECT FIS/2006/142
28
The key outputs from the per-‐recruit analyses, as well as calculated instantaneous natural mortality rates, M, are shown in Table 4 and Figures 21 to 26. As in the previous study, these analyses show that substantial fishing across age classes when age at 50% vulnerability (Ω2) was low, would result in erosion of population biomass and low total yield, and that fishing mortality would have to be very low for fishing to be sustainable. Sustainable instantaneous fishing mortality rates, F, would need to be 0.1 year-‐1 or less, for most of the species investigated and was as low as 0.05 year-‐1 for Carcharhinus obscurus and Sphyrna lewini. This generally low productivity reflected combined low natural mortality rates, delayed maturity and low fecundity. Natural mortality, M was estimated to be no greater than 0.12 year-‐1 (for Prionace glauca) among the species examined here, but was less than 0.06 year-‐1 for C. obscurus. The updated input parameters increased the estimate of M for Isurus oxyrinchus to 0.0962 (from 0.06 in Blaber et al., 2009). Given that optimum harvest levels for some pelagic finfish have been shown to be of the order of 0.6 M (Patterson 1992), it is likely that harvest levels for many of the sharks and rays should be as little 6-‐8% and for those with the lowest M values, might be as little as 3%. However, the level of sustainable fishing mortality, as expected, is also very dependent on the age at 50% vulnerability, which is usually determined by the gear type and size. If all age classes are selected, only A. pelagicus among the species analysed can sustain fishing mortality levels greater than 0.1 year-‐1. In contrast, C. obscurus and S. lewini were able to sustain fishing mortality rates of just 0.05 year-‐1 (Fmax1, Table 4). Also, with all age classes fully vulnerable, the maximum fishing mortality in the yield per recruit, , was often at a similar scale to the equilibrium fishing mortality rate at 20% virgin stock size (F20; Table 4), also indicating the low productivity of these species. The values of Fstationary (the value of F below which spawning biomass would grow) for the species when all age classes were equally selected was low for most species, although not identical to Fmax, with the Fstationary for A. pelagicus Isurus oxyrinchus and C. falciformis, being substantially less than the corresponding Fmax. For S. lewini, the Fstationary (0.131) was marginally larger than the corresponding Fmax, at 0.10, but for P. glauca, the Fstationary (0.472) was much greater than the corresponding Fmax (0.15). If the age at which the fish were fully subject to fishing were substantially delayed, all species were more resilient to fishing, and yields and fishing mortality rates from the fully fished age classes could be higher. For all of the species investigated, increasing the age at 50% vulnerability (Ω2) to 6 years increased potential yields per recruit, by 30% or more (Table 4). The instantaneous fishing mortality rate that could be sustained was increased substantially in all cases, especially so for blue sharks, P. glauca, with an increase from 0.15 year-‐1 to 0.60 year-‐1 (Table 4; Figs. 21-‐26). The increased resilience to fishing was also reflected in the values of Fstationary. Comparison of Fstationary values for Ω2=6 with those for Ω2=0 shows a strong relative increase (Table 4). Nevertheless, values of Fstationary for C. obscurus, C. falciformis, I. oxyrinchus and A. pelagicus, were close to or less than 0.1 year-‐1. The value for S. lewini, (0.176 year-‐1) was a little larger and was near the corresponding Fmax (Table 4). Again, the Fstationary for P. glauca (27.44 year-‐1) was atypical of the group investigated, and was much greater than the corresponding Fmax of 0.6 year-‐1.

TANJUNG LUAR SHARK FISHERY - ACIAR PROJECT FIS/2006/142
29
Increasing the age at 50% vulnerability (Ω2) to 14 years did not universally increase potential yields per recruit. For two species, A. pelagicus and P. glauca, with M values relatively higher than those for the other species, the maximum yield per recruit at Ω2 = 14 years, was similar to that at Ω2=0 years (Table 4; Fig. 21, Fig. 26). For the remaining species, however, there were substantial increases of 20-‐30% (Table 4 Figs, 22-‐25). There were, however, universal increases in the values of all the parameters indicating resilience when the age at 50% selectivity was increased. Thus Fmax and F20 values for all species all showed substantial increases when (Ω2) was set to 14 years (Table 4, Figs 21-‐26). The value of Fstationary, for P. glauca, 32.05 year-‐1(Table 4), was very high, indicating high resilience for this species when only the oldest age classes were fully subject to fishing.
Fig. 21 Per-‐recruit analyses and harvested reproductive fraction, as functions of fishing mortality rate, for Alopias
pelagicus at Tanjung Luar.

TANJUNG LUAR SHARK FISHERY - ACIAR PROJECT FIS/2006/142
30
Fig. 22 Per-‐recruit analyses and harvested reproductive fraction, as functions of fishing mortality rate, for Isurus oxyrinchus at Tanjung Luar.

TANJUNG LUAR SHARK FISHERY - ACIAR PROJECT FIS/2006/142
31
Fig. 23 Per-‐recruit analyses and harvested reproductive fraction, as functions of fishing mortality rate, for Carcharhinus falciformis at Tanjung Luar.

TANJUNG LUAR SHARK FISHERY - ACIAR PROJECT FIS/2006/142
32
Fig. 24 Per-‐recruit analyses and harvested reproductive fraction, as functions of fishing mortality rate, for Carcharhinus obscurus at Tanjung Luar.

TANJUNG LUAR SHARK FISHERY - ACIAR PROJECT FIS/2006/142
33
Fig. 25 Per-‐recruit analyses and harvested reproductive fraction, as functions of fishing mortality rate, for Sphyrna lewini at Tanjung Luar.

TANJUNG LUAR SHARK FISHERY - ACIAR PROJECT FIS/2006/142
34
Fig. 26 Per-‐recruit analyses and harvested reproductive fraction, as functions of fishing mortality rate, for Prionace glauca at Tanjung Luar.
As in the previous ACIAR study of sharks in eastern Indonesia (Blaber et al., 2009), the work here underscored the fundamental difficulty of managing fisheries sustainably for some shark species: slow-‐growing, late-‐maturing species with low fecundity could not sustain fishing at more than minimal fishing mortality levels unless younger age classes were significantly protected. Carcharhinus obscurus and I. oxyrinchus for example, maturing at 20 years of age and with low natural mortality rates, could sustain very little fishing except on the very oldest age classes. Updated information for Sphyrna lewini and Carcharhinus falciformis, (Appendix 1, Table A3), specifically growth parameters for these populations and age at 50% maturity parameters as well as a number of pups per year, all indicated that the species are less productive in this region than previously indicated for those species. The reduced litter size observed in this study for C. obscurus had the consequence of reducing the fishing mortality rates which this species might sustain. The analyses of Blaber et al. (2009), utilised data from other regions. The effect of changes in parameters was reflected in the results for the per-‐recruit analyses. In particular the values of Fstationary in the cases where

TANJUNG LUAR SHARK FISHERY - ACIAR PROJECT FIS/2006/142
35
50 % selectivity was 6 years and 14 years, were substantially lower than those indicated in Blaber et al. (2009). The higher values in Blaber et al. (2009)might have been interpreted as showing significant resilience when younger age classes were effectively protected. In the current study, the Fstationary values were much lower, and while indicating that there would be some resilience benefit when those younger age classes are not selected, even then only a low level of fishing would be likely to be sustainable. Such a change highlights the importance of using information that is derived from local data. Protection of the younger age classes, controlling the minimum age at 50% selection to age 6 years, provided increased yields per recruit to all species but especially to A. pelagicus and P. glauca, the two species of the group with relatively higher M values. The relatively low age at maturity and high fecundity for P. glauca (Table A3) would have also enhanced this effect. Further increasing the minimum age at 50% selection to age 14 years increased yields per recruit for all species considered, excepting A. pelagicus and P. glauca: by this age, most of the productivity of these last two species has been lost to natural mortality. Protection of the younger age classes via selectivity changes conferred resilience benefits, as indicated by increasing Fstationary Fmax and F20values across all species, as the age at 50% selectivity was increased. The results suggest that there would be yield benefits and increasing resilience benefits by effectively protecting younger sharks. Thus there might be management options available that, via gear controls, might reduce mortality on the younger age classes. Alternatively if the ontogeny and spatial dynamics of these species were well known, then there might be opportunities for spatial management to provide similar protection. The per recruit analyses presented here are simple analyses, based on limited information, that are intended to provide general policy direction. Managers and researchers associated with these fisheries should be encouraged to undertake more detailed and alternative analyses, to further explore policy options and to drive acquisition of information to support better management. Nevertheless, general policy directions from our analyses are clearly that these sharks can mostly sustain only limited fishing pressure, especially if there is significant impact on the youngest age classes. For the less-‐productive species, sustainable annual harvest rates may be less than 5%. Consequently, these species may be overfished even while appearing abundant, and initially sustaining high catch rates. It is also important to consider that the fisheries landing shark at Tanjung Luar are not the only fisheries in this area that catch sharks. There are many interactions with other fisheries, such as tuna longline and gillnet fisheries, that all catch younger sharks of at least some of the species. Fishers from other areas can catch fish around Tanjung Luar, while fishers from Tanjung Luar can also fish elsewhere. This means that there are no clear management options applying to the Tanjung Luar area in isolation that might be suggested. Reduction of shark bycatch in these other fisheries might improve sustainability.

TANJUNG LUAR SHARK FISHERY - ACIAR PROJECT FIS/2006/142
36
Table 4 Results from the Yield per recruit analyses. C. obscurus C. falciformis I. oxyrinchus P. qlauca S. lewini A. pelagicus M 0.0546 0.0706 0.0962 0.11607 0.06312 0.1074 out1 0.0714 0.0674 0.0365 0.4724 0.1312 0.037 out2 0.0931 0.1045 0.0481 27.4405 0.17559 0.0567 out3 0.1705 0.5801 0.09 32.0503 0.3891 0.262 Lambda 1.071 1.065 1.0356 1.5034 1.1338 1.035 Phi 0.0663 0.0614 0.0344 0.3348 0.11807 0.0342 YPRMax1 24243527 10 25 162 7 12
YPRMax2 33522139.8820404+0i 16 36 276 9 16
YPRMax3 44224774.5123861+0i 21 41 161 12 12
Fmax1 0.05 0.1 0.1 0.15 0.05 0.2 Fmax2 0.1 0.25 0.25 0.6 0.1 1.3 Fmax3 0.25 1.75 1.95 1.95 0.2 1.95 F20perc1 0.05 0.1 0.1 0.2 0.05 0.1 F20perc1 0.05 0.1 0.1 0.2 0.05 0.1 F20perc3 0.15 1.95 0.2 1.95 0.15 1.95

TANJUNG LUAR SHARK FISHERY - ACIAR PROJECT FIS/2006/142
37
2.0 RECOMMENDATIONS & FURTHER WORK The Dinas Perikanan statistics should not be used in its current form for the analysis of the Tanjung Luar shark longline fishery. Urgent action should be to scrutinise the process by which this statistical data is collected and calculated for the area and provide input into constructing a better system. Some management actions are not pertinent to the fishery, e.g. P. glauca is mostly impacted by the tuna fishery and less so by the Tanjung Luar shark fishery where mostly males are landed. A well-‐designed market sampling program including daily estimation of catches was considered to be the most accurate means of determining catch and effort information. Market sampling could be continued by enumerators for one week per month (just sharks and rays), over 12 months. If there is no lunar effect, this could be conducted by the lemuru enumerators who do not sample on the full moon. Project has provided a written protocol for this activity (see Appendix 3). This would provide an excellent level of coverage of shark catches and will test whether the suggested protocol is manageable by the enumerators. These enumerators would be able to collect length information for the species known to occur in the longline fishery and the use of already identified length-‐weight relationships for these species will enable accurate weights of the catches to be determined. This will require development of an appropriate data sheet and file system (W. White to construct). As we were unable to ascertain in this project how local fisheries data is collected, enumerators would be able to provide this insight. Monitoring should also continue to collect information separating bottom and pelagic longlines and the number of landings on the days surveyed. A summary, recommendations and next steps required for the various aspects covered in this report are summarised in the table below. The major recommendations/conclusions resulting from this are:
1. Dinas Perikanan data is not useable without the derivation and treatment (scaling etc) of data being made explicit – OTHERWISE DO NOT USE
2. Most market data suggest no major problem but indications trip length is extending and may mask changes to fishing areas or patterns.
3. Because of high impact on S. lewini management should concentrate upon this species
4. YPR shows several species are quite vulnerable to fishing. 5. Extend the market collection method to get catch and effort data by the “local
fisheries” officers –protocols to be constructed

TANJUNG LUAR SHARK FISHERY - ACIAR PROJECT FIS/2006/142
38
Reporting Recommendation/Summary
information New Steps
1. Species Composition
• Difference between pelagic/bottom longlines, and composition by weight and numbers but 7-8 species are dominant.
• No trends over time. • Need to monitor
catches of both longline types using both numbers and weights.
• Recommendation 2: Most market data suggest no major problem but indications trip length is extending and may mask changes.
• Continue species and size composition monitoring.
• Attempt to monitor at species level for 36 key spp then others.
• Highlight TEPs.
2. Mean length • No apparent trend for the abundant species.
• Continue monitoring.
• Analyse minor species catches to detect any declines in these species.
• Analyse proportion of juveniles caught in gillnet and other fisheries at TL
3. Length Frequency
• This is a fishery for large sharks but much of the catch is immature.
• A number of other fisheries also catch immature fish of some species, e.g. S. lewini and C. falciformis (but not all species, e.g. P. glauca)
• Monitor catches of species caught by the longline fishery in other fisheries at TL
4. Per recruit analyses
• Good info used from actual population (ACIAR projects).
• Should calculate value PR
• Recommendation 4: YPR shows several species quite vulnerable to fishing.
• Need to look at all
• Convert age to length.
• Need to consider cumulative impacts from other fisheries

TANJUNG LUAR SHARK FISHERY - ACIAR PROJECT FIS/2006/142
39
the fisheries taking juv. As bycatch – such as gillnet and tuna fisheries
5. Sex ratio • High impact on S. lewini likely because high % of females, YPR attributes, size composition. Many fisheries in other regions report mostly males caught for S. lewini. Females possibly more oceanic?
• Most species ~ 50:50 • P. glauca is the
opposite, low % females (impact in other fisheries not known).
• Recommendation 3: Because of high impact on S. lewini management should concentrate upon this species.
• Sex ratio in tuna longline fishery for overlapping species should be determined
6. Seasonality • Strong seasonality in some species. Often relative to the seasonal catch and effort pattern.
• C. sorrah: high catches between Feb and May.
• Ground truth with new enumerator data.
7. Catch comparisons
• Market and Dinas data have a very different pattern.
• 2005 Dinas data at issue but do not know why. “Local Fisheries” and market survey data match relatively well.
• Little confidence in Dinas Perikanan statistics. Affected by change in databasing, collection and analysis methods suggested, e.g. 2005 catch low across all fishing methods
• Recommendation 5: extend the market collection method to get catch and effort data by the “local
• Calculate proportion of this fishery in numbers caught relative to other fisheries
• Need clarity on who and how local fisheries data is collected.
• Extend Dinas Perikanan data to 2010.
• Need description from local to provincial level data collection and handling methods.

TANJUNG LUAR SHARK FISHERY - ACIAR PROJECT FIS/2006/142
40
fisheries” officers –protocols to be constructed
8. Effort comparison
(DP # boats X # trips X #days/trip)
• Dinas Perikanan effort statistics 20-120 thousand trips!?! No confidence in scale or trends: huge leaps from 1 year to next; over-estimate by orders of magnitude then makes sense. Implied number of vessels huge, much more than ever observed during market surveys.
• Market data 50-60 vessels, about 1200 trips/year. This data is sound.
• Confirm that there have been changes in trip lengths over time -Simon Viera
9. CPUE • Recommendation 1: Dinas Perikanan data is not useable – DO NOT USE
• Need CPUE estimates from market data (median catch per trip from market data)
TANJUNG LUAR SHARK FISHERY - ACIAR PROJECT FIS/2006/142
41
3.0 REFERENCES Bishop, S. D. H., Francis, M. P., Duffy, C. & Montgomery, J. C. (2006) Age, growth, maturity,
longevity and natural mortality of the shortfin mako shark (Isurus oxyrinchus) in New Zealand waters. Marine and Freshwater Research 57: 143–154.
Blaber, S. J. M., Dichmont, C. M., White, W., Buckworth, R., Sadiyah, L, Iskandar, B., Nurhakim, S., Pillans, R., Andamari, R., Dharmadi & Fahmi (2009) Elasmobranchs in southern Indonesian fisheries: the fisheries, the status of the stocks and management options. Reviews in Fish Biology and Fisheries 19: 367–391.
Castro, J. I. & Mejuto, J. (1995) Reproductive parameters of blue shark, Prionace glauca, and other sharks in the Gulf of Guinea. Marine of Freshwater Research 46: 967–973.
Compagno, L. J. V. (2001) Sharks of the world. An annotated and illustrated catalogue of shark species known to date. Volume 2. Bullhead, mackerel and carpet sharks (Heterodontiformes, Lamniformes and Orectolobiformes). Rome, Italy: FAO.
Davenport, S. & Stevens, J.D. (1988) Age and growth of two commercially important sharks (Carcharhinus tilstoni and C. sorrah) from northern Australia. Australian Journal of Marine and Freshwater Research 39: 417–433.
Gallucci, V.F., Taylor, I.G. & Erzini, K. (2006) Conservation and management of exploited shark populations based on reproductive value. Canadian Journal of Fisheries and Aquatic Sciences 63: 931–942.
Last, P. R. & Stevens, J. D. (2009) Sharks and Rays of Australia. Australia: CSIRO Australia.
Lessa, R., Santana, F. M. & Hazin, F. H. (2004) Age and growth of the blue shark Prionace glauca (Linnaeus, 1758) off northeastern Brazil. Fisheries Research 66: 19–30.
Liu, K.M., Chen, C.T., Tai-‐Hsiang, L. & Joung, S.J. (1999) Age, Growth, and Reproduction of the Pelagic Thresher Shark, Alopias pelagicus in the Northwestern Pacific. Copeia 1, 68–74.
Oshitani, S., Hideki, N. & Tanaka, S. (2003) Age and growth of the silky shark Carcharhinus falciformis from the Pacific Ocean. Fisheries Science 69: 456-‐464.
Pepperell, J. (2010) Fishes of the Open Ocean: A Natural History and Illustrated Guide. UNSW Press, 272 pp.
Piercy, A. C., Sulikowski, J. & Burgess, G. (2007) Age and growth of the scalloped hammerhead shark, Sphyrna lewini, in the north-‐west Atlantic Ocean and Gulf of Mexico. Marine and Freshwater Research 58: 34–40.
Quinn, T.J. II & Deriso, R.B. (1999) Quantitative fish dynamics. Oxford University Press, New York, 542 p.
Ribot-‐Carballal, M.C., Galván-‐Magaña, F.Y & Quiñónez-‐Velázquez, C. (2005) Age and growth of the shortfin mako shark Isurus oxyrinchus from the western coast of Baja California Sur, Mexico. Fisheries Research 76: 14–21.
Semba, Y. N., Nakano, H. & Aoki, I. (2009) Age and growth analysis of the shortfin mako, Isurus oxyrinchus, in the western and central North Pacific Ocean. Environmental Biology of Fishes 84: 377–391.
Simpfendorfer, C.A. (2000) Growth rates of juvenile dusky sharks, Carcharhinus obscurus (Leseur, 1818), from southwestern Australia estimated from tag-‐recapture data. Fishery Bulletin 98: 811–822.

TANJUNG LUAR SHARK FISHERY - ACIAR PROJECT FIS/2006/142
42
Simpfendorfer, C.A., McAuley, R., Chidlow, J. & Unsworth, P. (2002) Validated age and growth of the dusky shark, Carcharhinus obscurus, from Western Australia. Marine and Freshwater Research 53: 567–573.
Skomal, G.B. & Natanson, L.J. (2003) Age and growth of the blue shark (Prionace glauca) in the North Atlantic Ocean. Fishery Bulletin. 101: 627–639.
Stevens, J.D. (1984) Biological observations on sharks caught by sport fishermen off New South Wales. Australian Journal of Marine and Freshwater Research 35: 573-‐590.
Stevens, J.D. & Lyle, J.M. (1989) Biology of three hammerhead sharks (Eusphyra blochii, Sphyrna mokarran and S. lewini) from northern Australia. Australian Journal of Marine and Freshwater Research 40: 129–146.
White, W.T. (2007a) Biological observations on lamnoid sharks (Lamniformes) caught by fisheries in eastern Indonesia. Journal of the Marine Biological Association of the United Kingdom 87: 781–788.
White, W.T. (2007b) Catch composition and reproductive biology of whaler sharks (Carcharhiniformes: Carcharhinidae) caught by fisheries in Indonesia. Journal of Fish Biology 71: 1512–1540.
White, W.T., Last, P.R., Stevens, J.D., Yearsley, G.K., Fahmi & Dharmadi (2006) Economically Important Sharks and Rays of Indonesia. ACIAR Publishing, Canberra, 329 pp.
White, W.T., Bartron, C. & Potter, I.C. (2008) Catch composition and reproductive biology of Sphyrna lewini (Carcharhiniformes, Sphyrnidae) in Indonesian waters. Journal of Fish Biology 72: 1675–1689.

TANJUNG LUAR SHARK FISHERY - ACIAR PROJECT FIS/2006/142
43
APPENDICES Appendix 1: Supplementary Tables Table A1 Species composition and relevant IUCN red list categories.
Family Scientific name Common name Red List category
Sharks
Alopiidae Alopias pelagicus Pelagic Thresher Vulnerable
Alopiidae Alopias superciliosus Bigeye Thresher Vulnerable
Carcharhinidae Carcharhinus albimarginatus Silvertip Shark Near Threatened
Carcharhinidae Carcharhinus altimus Bignose Shark Data Deficient
Carcharhinidae Carcharhinus amblyrhynchos Grey Reef Shark Near Threatened
Carcharhinidae Carcharhinus amboinensis Pigeye Shark Data Deficient
Carcharhinidae Carcharhinus brevipinna Spinner Shark Near Threatened
Carcharhinidae Carcharhinus falciformis Silky Shark Near Threatened
Carcharhinidae Carcharhinus leucas Bull Shark Near Threatened
Carcharhinidae Carcharhinus limbatus Common Blacktip Shark Near Threatened
Carcharhinidae Carcharhinus longimanus Oceanic Whitetip Shark Vulnerable
Carcharhinidae Carcharhinus melanopterus Blacktip Reef Shark Near Threatened
Carcharhinidae Carcharhinus obscurus Dusky Shark Vulnerable
Carcharhinidae Carcharhinus plumbeus Sandbar Shark Vulnerable
Carcharhinidae Carcharhinus sorrah Spottail Shark Near Threatened
Carcharhinidae Galeocerdo cuvier Tiger Shark Near Threatened
Carcharhinidae Loxodon macrorhinus Sliteye Shark Least Concern
Carcharhinidae Negaprion acutidens Sicklefin Lemon Shark Vulnerable
Carcharhinidae Prionace glauca Blue Shark Near Threatened
Carcharhinidae Triaenodon obesus Whitetip Reef Shark Near Threatened
Ginglymostomatidae Nebrius ferrugineus Tawny Nurse Shark Vulnerable
Hemigaleidae Hemipristis elongatus Fossil Shark Vulnerable
Hexanchidae Hexanchus griseus Bluntnose Sixgill Shark Near Threatened
Hexanchidae Hexanchus nakamurai Bigeye Sixgill Shark Data Deficient
Lamnidae Isurus oxyrinchus Shortfin Mako Vulnerable
Lamnidae Isurus paucus Longfin Mako Vulnerable
Pseudotriakidae Pseudotriakis microdon False Catshark Data Deficient
Sphyrnidae Sphyrna lewini Scalloped Hammerhead Endangered
Sphyrnidae Sphyrna mokarran Great Hammerhead Endangered
Sphyrnidae Sphyrna zygaena Smooth Hammerhead Vulnerable
Stegostomatidae Stegostoma fasciatum Zebra Shark Vulnerable Rays
Dasyatidae Dasyatis microps Smalleye Stingray Data Deficient
Dasyatidae Himantura fai Pink Whipray Least Concern
Dasyatidae Himantura uarnak Reticulate Whipray Vulnerable
Rhinidae Rhina ancylostoma Shark Ray Vulnerable Rhynchobatidae Rhynchobatus spp Wedgefish Vulnerable

TANJUNG LUAR SHARK FISHERY - ACIAR PROJECT FIS/2006/142
44
Table A2 Length-‐at-‐maturity for females and males and size at birth for the species designated as the most abundant species by either the pelagic or bottom longline, by weight or by number, in one of the years surveyed.
Length-‐at-‐maturity (mm)
Female Male
Birth size Source
Alopias pelagicus 2853 2468 1370 White (2007a) Carcharhinus amblyrhynchos 1350 1350 550
Last & Stevens (2009)
Carcharhinus brevipinna 1950 1950 745 Last & Stevens (2009)
Carcharhinus falciformis 2161 2078 676 Market survey data Carcharhinus limbatus 1725 1894 605 White (2007b)
Carcharhinus obscurus 3050 2800 950 Last & Stevens (2009)
Carcharhinus sorrah ~1200 1117 535 White (2007b)
Galeocerdo cuvier 3300 3000 650 Last & Stevens (2009)
Hexanchus griseus 4200 3150 675 Last & Stevens (2009)
Isurus oxyrinchus 2800 1950 650 Last & Stevens (2009)
Prionace glauca 2200 2200 425 Last & Stevens (2009)
Sphyrna lewini 2285 1756 400 White et al. (2008)

TANJUNG LUAR SHARK FISHERY - ACIAR PROJECT FIS/2006/142
45
Table A3 Biological parameters used for the yield per recruit analyses for selected abundant species in the Tanjung Luar longline fishery. Note the following parameters used identical values for each of the 7 species: Temp = 25, MaxIter = 40, Fm_inc = 0.05, ah_inc = 0.5.
Parameter Value Source Parameter Value Source
Alopias pelagicus
Isurus oxyrinchus
Linf 3335 Drew et al. (in prep): F
Linf 3083 Semba et al. (2009): F
Kgrowth 0.11 Drew et al. (in prep): F
Kgrowth 0.09 Semba et al. (2009): F
Tzero -5.69 Drew et al. (in prep): F
Lzero 597 Semba et al. (2009): F
Pups per female 2 White (2007)
Pups per female 5 Compagno (2001)
AgeMat 12 Drew et al. (in prep): F
AgeMat 20 Bishop et al. (2006)
SexRatio 0.5
SexRatio 0.5
MaxAge 25 Drew et al. (in prep): F
MaxAge 29 Bishop et al. (2006)
Lwa 4.00E-07 Liu et al. (1999)
Lwa 0.000014 Ribot-Carballal et al. (2005)
LWb 3.2165 Liu et al. (1999)
LWb 2.98 Ribot-Carballal et al. (2005)
Carcharhinus falciformis
Prionace glauca
Linf 3204 Bartron et al. (in prep): F
Linf 3737 Skomal & Natan. (2003): F
Kgrowth 0.057 Bartron et al. (in prep): F
Kgrowth 0.13 Skomal & Natan. (2003): F
Lzero 823 Bartron et al. (in prep): F
Tzero -1.77 Skomal & Natan. (2003): F
Pups per female 4 Bartron et al. (in prep)
Pups per female 19 Castro & Mejuto (1995)
AgeMat 13.5 Bartron et al. (in prep): F
AgeMat 5 Skomal & Natan. (2003)
SexRatio 0.5
SexRatio 0.5
MaxAge 19 Bartron et al. (in prep)
MaxAge 15 Skomal & Natan. (2003)
Lwa 0.000001 Oshitani et al. (2003): F
Lwa 2.57E-05 Lessa et al. (2004)
LWb 3.2329 Oshitani et al. (2003): F
LWb 3.05 Lessa et al. (2004)
Carcharhinus obscurus
Sphyrna lewini
Linf 4150 Simpfendorfer (2002): F
Linf 3206 Drew et al. (in prep): F
Kgrowth 0.043 Simpfendorfer (2002): F
Kgrowth 0.048 Drew et al. (in prep): F
Lzero 885 Simpfendorfer (2002): F
Tzero -2.68 Drew et al. (in prep): F
Pups per female 4 Last & Stevens (2009)
Pups per female 12.5 White et al. (2009)
AgeMat 20 Simpfendorfer (2000)
AgeMat 17.5 Drew et al. (in prep): F
SexRatio 0.5
SexRatio 0.5
MaxAge 32 Simpfendorfer (2000)
MaxAge 45 Drew et al. (in prep): F
Lwa 2.512 Simpfendorfer (2000): F
Lwa 4.00E-06 Piercy et al. (2007): F
LWb 3.1253 Simpfendorfer (2000): F
LWb 3.0279 Piercy et al. (2007): F
Carcharhinus sorrah
Linf 1239 Davenport & Stevens (1988)
Kgrowth 0.34 Davenport & Stevens (1988)
Tzero -1.9 Davenport & Stevens (1988)
Pups per female 5
AgeMat 2 Davenport & Stevens (1988)
SexRatio 0.56
MaxAge 7 Davenport & Stevens (1988)
Lwa 0.000004 Davenport & Stevens (1988)
LWb 3.027 Davenport & Stevens (1988)

TANJUNG LUAR SHARK FISHERY - ACIAR PROJECT FIS/2006/142
46
Appendix 2: Data handling notes Where there were blanks for variables headed the “No. of (females, males, unsexed, eggs, embryos, embryos
left, embryos right), these were made zero (not Null). With the variables storing length data, (TL, PCL, FL)
the Null fields (i.e. nothing in the database field) indicated that that measurement was not taken. For
example, if a stingray was measured, then the disc width (DW) field was used and the total length field left
blank (Null).
For rays, Disc Width was the standard measurement. Weight was rarely measured, but when recorded it
was entered into the database. The alternative was Est weight (an estimate of the weight using published
and tested length vs weight relationships). These data items were alternatives – so that where Est weight
was not recorded that would indicate that should be a weight measurement for that record, and vice versa.
CLO was clasper outer length (mm) – Null indicates that this was not measured (males) or
not applicable (females). CL calc is clasper calcification (NC, not calcified, PC -‐ partially calcified, FC -‐ fully
calcified). FC indicates a mature animal. Is Null if not recorded for males and is default always Null for
females. Maturity: where not recorded this was Null.
Fish number is a specimen number only assigned to an individual when vertebrae were retained. This
unique fish number could be used to link various tissue samples (vertebrae, tissue for genetics, gonads,
embryos). Note that the first 2 digits of fish number refer to the year sampled, and the following digits are a
sequential number per species in a year.
On any particular day, the catch for each boat could be determined. The boats were referred to as boat 1, 2
etc. Catch composition and total weight of the catch could be referenced per boat on any particular day.
Note that date and boat are a unique combination. i.e. Boat 1 on 11/2/2010 is not the same boat as Boat 1
on 12/2/2010. In earlier trips this data was not recorded but is available for about three quarters of the
surveys. Longline type was recorded as either Bottom or Pelagic and is selected for each record and is
never blank.

TANJUNG LUAR SHARK FISHERY - ACIAR PROJECT FIS/2006/142
47
Appendix 3: Protocol & keys for enumerators (adapted from White et al. 2006)
Tanjung Luar Shark data collection
Pengumpulan Data cucut Tanjung Luar • Longline sharks are all brought into the tiled undercover area • Seluruh hasil tangkapan cucut dari rawai permukaan diangkut ke dalam tempat pelelangan
ikan • The landings from each boat landing on a day are placed into a separate row from the next
boat • Cucut yang didaratkan dikelompokkan secara terpisah setiap kapal • Each longline boat either fished with a pelagic (drift) longline or a bottom longline • Hasil tangkapan cucut dari rawai permukaan dan rawai dasar juga dipisahkan • Sharks will remain in area whole until auction process • Hasil tangkapan cucut tetap di tempat pelelangan sampai dilakukan proses lelang • After auction process sharks are then processed quickly • Segera setelah proses lelang selesai cucut langsung dipotong-potong dengan cepat
Data collection: 1. Species composition: use identification key and book to identify each shark
Komposisi jenis : menggunakan kunci identifikasi cucut -‐ For each individual – record level of accuracy of identification
(1 – good, 2 – average, 3 – unsure, 4 – unknown) Setiap individu dicatat berdasarkan tingkat ketelitian dalam melakukan identifikasi (1-baik, 2-cukup, 3-kurang pasti/ragu-ragu, 4-tidak diketahui)
2. Sex: record if male, female or unknown. Jenis kelamin : dicatat (jantan, betina) atau tidak diketahui.
-‐ Males have claspers at all sizes -‐ Jantan memiliki klasper pada semua ukuran -‐ Use unknown if pelvic fins removed and cannot determine sex -‐ Gunakan kata “unknown” jika sirip perut sudah dipotong dan tidak diketahui jenis
kelaminnya. 3. Length:
Panjang : -‐ Measure length from tip of snout to tip of tail (total length, TL) -‐ Pengukuran panjang dari ujung moncong sampai ujung ekor (panjang total, TL) -‐ If tail damaged then measure precaudal length (PCL) – from snout tip to origin of
upper lobe of caudal fin -‐ Jika ekor rusak maka diukur panjang standar, mulai dari ujung moncong -‐
4. Sampai dibagian atas lubang sirip ekor . 5. Boat number:
Jumlah kapal -‐ For each individual shark, the number of the boat which is came from (e.g. 1, 2, 3,
etc) needs to be recorded -‐ Masing-masing hasil tangkapan cucut, dicatat jumlah kapal dan berasal dari mana
(misalnya : 1,2,3 dst.) -‐
6. Longline type: 7. Tipe rawai permukaan
-‐ Record if from pelagic or bottom longline (can ask fisherman if not sure) -‐ Catat apakah termasuk rawai pelagis atau rawai permukaan (tanyakan ke
nelayan, untuk meyakinkan) Additional data: Data tambahan:
1. Auction prices of sharks:

TANJUNG LUAR SHARK FISHERY - ACIAR PROJECT FIS/2006/142
48
Harga cucut yang dilelang -‐ For each of boat that has landed each day, record the price that the catch sells for
at the auction -‐ Setiap kapal yang mendaratkan cucut per hari, catat berapa hasil lelang.
2. Photographs: Photo :
-‐ Each day take at least one photo of the longline caught sharks -‐ Paling tidak dilakukan pengambilan foto setiap hari dari hasil tangkapan rawai
cucut -‐ Also take one photo of the large mobulid rays -‐ Pengambilan foto juga dilakukan pada pari berukuran besar (Mobula sp)
Data entry: Use provided excel file:
-‐ Use a new worksheet for each day -‐ Use a new file for each month of sampling -‐ Email file to William and Dharmadi after each trip to Lombok
Entry data : Gunakan program excel. -‐ Gunakan worksheet baru setiap hari -‐ Gunakan file baru untuk setiap sampling bulanan. -‐ Kirim file ke William dan Dharmadi setelah survei dari Lombok
Key to longline species 1a Body very flat, rounded; tail whip-like ………………………………………………….. stingrays Tubuh sangat datar, membulat, ekor seperti cemeti/cambuk.................................. Pari b Body not strongly flattened; tail not whip-like Tubuh tidak rata, ekor tidak seperti cemeti/cambuk ........................................................... 2 2a Snout triangular Bentuk moncong segitiga …………………………………………..………..… Rhynchobatus spp b Snout not triangular Bentuk moncong tidak segitiga ..................................................................................................... 3 3a Head flattened and broadly rounded; back with ridges lined with large
thorns…………………………………………………………………………………… Rhina ancylostoma ; punggung dengan gurat-gurat menonjol, dilengkapi dengan gerigi atau duri yang besar-besar
b Head not flattened; back without ridges with large thorns Bentuk kepala tidak datar, punggung tanpa gerigi terdapat duri besar ......................... 4a A single dorsal fin; 6 gill slits on each side of head
Memiliki satu sirip punggung; 6 celah insang di bagian sisi kepalanya…......... …………………………………………………………………………………………………….Hexanchus spp
b 2 dorsal fins; 5 gill slits on each side of head
Memiliki dua sirip punggung; 5 buah celah insang di bagian sisi kepala...................... 5 5a Head with lateral expansions, hammer-shaped
Bentuk kepala melebar ke samping, seperti martil ................................................................ 6 b Head not expanded laterally
Kepala tidak melebar ke samping…………………………………………………............................. 7 6a Head without a median indent

TANJUNG LUAR SHARK FISHERY - ACIAR PROJECT FIS/2006/142
49
Kepala tanpa lekukan di bagian tengah ........................................................ Sphyrna zygaena b Head with a median indent; first dorsal fin very tall; anterior profile of head almost straight Kepala terdapat lekukan dibagian tengah, sirip punggung pertama sangat tinggi, bentuk
kepala bagian depan hampir lurus …….………………………. Sphyrna mokarran c Head with a median indent; first dorsal fin shorter; anterior profile of curved
Kepala bagian tengah terdapat lekukan,sirip punggung pertama lebih pendek, bagian depan melengkung..................................................................................... .Sphyrna lewini
7a Prominent lateral ridges on body; body yellow with dark spots Gurat samping yang tampak pada tubuh; ....................................... Stegostoma fasciatum b No ridges or spots on body Tidak ada gurat dibagian punggung atau bintik pada tubuhnya.................................. 8a Caudal-fin upper lobe equal to or more than half total length, lower lobe distinct
Panjang sirip ekor bagian atas hamper sama atau lebih panjang dari separuh panjang totalnya, bagian bawah berbeda…………………………………………………………… 9
b Length of upper caudal-fin lobe much less than half total length
Panjang sirip ekor bagian atas jauh lebih pendek dari separuh panjang totalnya. 10 9a Eyes moderately large; no deep groove on head Mata cukup besar, tidak ada galur pada kepalanya .............................. Alopias pelagicus b Eyes very large; deep groove on head Mata sangat besar; dalam galur di kepala ........................................ Alopias superciliosus 10a Dorsal fins situated posteriorly on body, the first over pelvic fins
Sirip punggung terletak di belakang tubuh, pertama di balik sirip dada ……………….. ……………………………………………………………………………………………. Nebrius ferrugineus
b Dorsal fins further forward, the first closer to pectoral fins
Sirip belakang lebih lanjut maju, yang pertama yang lebih dekat ke sirip dada .... 11 11a Caudal fin almost symmetrical, lunate; a strong keel on either side of caudal peduncle
Sirip ekor hampir simetris, seperti bulan sabit; terdapat lunas (keel) di kedua sisi pangkal ekornya
b Caudal fin asymmetrical, heterocercal; keel on each side of caudal peduncle low or absent Sirip ekor tidak simetris, bagian atas lebih panjang dari bagian bawah; lunas (keel) di pangkal ekor tidak ada atau lemah………………………………………………………………. 13
12a Pectoral fins much shorter than head; snout very pointed and white ventrally
Sirip dada lebih pendek dari pada kepala; moncong sangat runcing dan putih dibagian tengah perut………………………………………………………………. Isurus oxyrinchus
b Pectoral fins much longer than head; snout bluntly pointed and dark ventrally Sirip dada lebih panjang dari pada kepala; moncong runcing dan gelap dibagian perut ……………………………………………………………………………………………. Isurus paucus
13a Body with many dark bars on body; labial furrows very long
Tubuh banyak garis-garis gelap; galur bibir sangat panjang …… Galeocerdo cuvier b Body without dark bars; labial furrows not very long Tubuh tanpa garis-garis, galur bibir tidak panjang ………………………………………… 14

TANJUNG LUAR SHARK FISHERY - ACIAR PROJECT FIS/2006/142
50
14a Spiracles present; teeth protruding from mouth when closed Terdapat spirakel/lubang kecil dekat mulut; gigi menonjol dari mulut kalau ditutup …………………………………………………………………………… Hemipristis elongatus
b No spiracles; teeth not protruding from mouth when closed Tidak spirakel/lubang kecil dekat mulut; gigi tidak menonjol dari mulut kalau ditutup ………………………………………………………………………………………………………….. 15
15a Second dorsal fin half or more height of first dorsal fin
Sirip punggung kedua setengah atau lebih tinggi dari pada sirip punggung pertama.................................................................................................................................................... 16
b Second dorsal fin less than half height of first dorsal fin Sirip punggung kedua kurang dari setengah sirip punggung pertama ....................... 17 16a Dorsal fins white-tipped Sirip Belakang dengan ujung putih........................................................... Triaenodon obesus b Dorsal fins without white tips
Sirip belakang tanpa ujung putih ………………………………………… Negaprion acutidens 17a First dorsal fin situated between pectoral and pelvic fins; body deep blue
Sirip punggung terletak di antara sirip dada sirip perut; badan dalam warna biru ………………………………………………………………………………………………….. Prionace glauca
b First dorsal fin further forward, closest to pectoral fins; body not blue
Sirip punggung lebih ke depan, paling dekat ke sirip dada; badan tidak biru. . . . . . . ………………………………………………………………………………………………. Carcharhinus spp
18a Pectoral and first dorsal fins very broad distally; most fins with mottled white tips
Sirip dada dan sirip punggung pertama sangat lebar ; umumnya ujung bagian sirip terdapat warna putih loreng............................................................ Carcharhinus longimanus
b Not as above Tidak seperti diatas
........................................................................................................................... 19 19a First dorsal, pectoral, caudal, and sometimes pelvic fins, with distinct white tips
Sirip punggung pertama, sirip dada, sirip ekor, dan kadang-kadang sirip perut, terdapat warna putih n jelas ................................................... Carcharhinus albimarginatus
b Not as above Tidak seperti diatas .......................................................................................................................... 20 20a Caudal fin with a distinct wide black margin along entire posterior margin
Sirip ekor dengan garis tepi hitam yang lebar jelas sepanjang seluruh bagian belakang garis tepi ..................................................................... Carcharhinus amblyrhynchos
b Not as above Tidak seperti diatas ......................................................................................................................... 21 21a Interdorsal ridge present Terdapat gurat dibagian punggung ..................................................................................... 22 b Interdorsal ridge absent

TANJUNG LUAR SHARK FISHERY - ACIAR PROJECT FIS/2006/142
51
Tidak terdapat gurat dibagian punggung ........................................................................... 26 22a Second dorsal, pectoral and lower caudal fins with distinct black tips
Sirip punggung kedua, sirip dada lebih rendah dari sirip ekor dengan ujung sirip nampak jelas warna hitam ……………...................................................... Carcharhinus sorrah
b Fins without distinct black tips Tanpa warna hitam dibagian ujung sirip ............................................................................ 23 23a First dorsal origin behind pectoral fin free tips; second dorsal inner margin very long Sirip punggung pertama terletak di belakang sirip dada; garis tepi sirip punggung sangat
panjang ...................................................................................... Carcharhinus falciformis b Not as above Tidak seperti diatas ......................................................................................................................
24 24a First dorsal fin situated further back, its origin closer to pectoral fin free rear tips than insertion
Sirip punggung pertama terletak lebih jauh kebelakang, lebih dekat ke sirip dada sirip, lebih tegak dari pada lekukannya …………………………… Carcharhinus obscurus
b First dorsal fin situated forward, its origin closer to pectoral fin insertion than free rear tips Sirip punggung terletak didepan, lebih dekat ke lekukan sirip dada dari pada ujung belakang ……………………………………………………………………………………………………… 25
25a First dorsal fin very tall Sirip punggung pertama sangat tinggi ..…………………………… Carcharhinus plumbeus b First dorsal fin only moderately tall Sirip punggung pertama cukup tinggi ………………………………… Carcharhinus altimus 26a First dorsal fin with broad distinct black tip (<1.5 m long)
Sirip punggung tanpa warna lebar hitam ............................. Carcharhinus melanopterus b First dorsal fin without broad black tip (if black tipped not broad)
Sirip punggung tanpa warna lebar hitam (jika hitam ujungnya , tidak lebar) ……. 27 27a Upper teeth broad and triangular Gigi atas lebar dan segi tiga …………………………….. Carcharhinus leucas/amboinensis b Upper teeth narrow, not triangular Gigi atas lebar dan tidak segi tiga ………………………………………………………………… 28 28a First dorsal fin relatively low, its origin over pectoral fin free rear tips
Sirip punggung relatif rendah, melebihi sirip dada bebas berdiri tegak dan runcing. ……………………………………………………………………………………. Carcharhinus brevipinna
b First dorsal fin taller, its origin over or forward of pectoral fin insertions Sirip punggung lebih tinggi, melebihi atau didepan lekukan sirip dada .................................................................................................................. Carcharhinus limbatus

TANJUNG LUAR SHARK FISHERY - ACIAR PROJECT FIS/2006/142
52
Appendix 4: Recommendations from stakeholder workshops.
WORKSHOP ON PROVINCIAL MANAGEMENT FOR SHARK FISHERIES
Mataram, 25-‐27 January 2011
Workshop on Provincial Management for Shark Fisheries was held on 25 – 27 January 2011 at Jayakarta Hotel, Mataram, West Nusa Tenggara. The workshop is implementation of collaboration project between The Government of Indonesia and The Government of Australia, which is ACIAR Project No. FIS/2006/142: Developing new assessment and policy framework for Indonesia’s marine fisheries, including the control and management of Illegal, Unregulated and Unreported (IUU) Fishing. The objectives of the workshop are (1) to collect information of shark fisheries in West Java, Central Java, DI Yogyakarta, East Java and West Nusa Tenggara, (2) to identify issues within shark capture in West Java, Central Java, DI Yogyakarta, East Java and West Nusa Tenggara, and (3) to collect some inputs for implementation of The National Plan of Action for Shark (NPOA Shark).
Workshop on Provincial Management for Shark Fisheries was opened and headed by Director of Fisheries Resources Management. The participant of the workshop are as following : Dr. Ron West (University of Wollongong), Mr. Craig Proctor and Dr. William White (CSIRO), Head of Sub Directorate of Western Fishing Surveillance-‐Directorate General of Marine Fisheries Surveillance and Control-‐MMAF, Head of Sub Division of Research Operational Management-‐Research Centre of Fisheries Management and Conservation-‐MMAF, Head of Program Division-‐Centre of Fisheries Extension Development-‐MMAF, Head of Provincial Fisheries Office of West Nusa Tenggara, Head of Provincial Fisheries Office of DI. Yogyakarta, Head of Provincial Fisheries Office of West Java, Head of Capture Fisheries Division of West Java Fisheries Office, Head of Capture Fisheries Section of Central Java Fisheries Office, Head of Capture Fisheries Division of East Java Fisheries Office, Head of Sub Directorate of Fisheries Resources Management in IEEZ and Highseas, Head of Sub Directorate of Fisheries Resources Management in Teritorial Water and Islands, Head of Sub Directorate of Fisheries Resources Management Evaluation-‐Directorate General of Capture Fisheries-‐MMAF, Head of District Fisheries Office of Gunung Kidul, Head of Tanjung Luar Fishing Port-‐East Lombok, representative from Cilacap Fishing Port, Palabuhanratu Fishing Port, Prigi Fishing Port, Sadeng Fishing Port, Entrepreneur/Trader from Cilacap (UD Mina Pamrih Rahayu) and Entrepreneur/ Trader from Tanjung Luar (UD Barokah).
1. Shark Fisheries Issues:
a. Fishery extension staff has not been involved in collecting of shark fisheries information.
b. Generally, shark is bycatch, but for Cilacap, Palabuhanratu, and Tanjung Luar Fishing Port, shark is main target for some fishing gears.
TANJUNG LUAR SHARK FISHERY - ACIAR PROJECT FIS/2006/142
53
c. Shark data collection is not optimum due to lack of enumerator knowledge in identification of shark species so that available data is not accurate.
d. Implementation of shark fisheries NPOA is not optimum. e. Research, publication and information of shark fisheries is limited.
2. Action Plans: a. Empowerment and improvement the role of fishery extension staff in shark data
collection. b. Training on shark species identification for the enumerator. c. Monitoring of shark capture activity. d. Review of data collection method and develop shark fisheries database including
fishing logbook implementation. e. Further research of shark fisheries. f. Dissemination information in order to raise awareness of the stakeholders on the
important of shark fisheries management.
3. Key Steps : a. Sosialization the important of shark fisheries management to the stakeholders by
brochures, poster, roadshow, community-‐based management (POKWASMAS). b. Use the shark fisheries information as part of material for The Coordination
Forum of Fisheries Resources Utilization Management in 2011. c. Review of existing catch data and research for shark and rays. d. Define the role and function of each institution in the management of shark
fisheries (Directorate General of Capture Fisheries, Research Centre of Fisheries Management and Conservation, Centre of Fisheries Extension Development, Directorate General of Marine Fisheries Surveillance and Control, Province/District Fisheries Official, Fishing Port Authority).
e. Training on shark species identification for the enumerator. f. Monitoring of shark capture activity. g. Determine the priority of NPOA shark elements to be implemented in all over
Indonesia.
4. Recommendations : a. Propose the training on shark species identification for the enumerator in 2011 to
The ACIAR. b. Develop NPOA shark guidelines for the stakeholders in the implementation of the
NPOA in all over Indonesia. c. Use the standard form in data collection and evaluation of the capture and
utilization of shark in the fishery base landing, and fishing port. d. Implementation of fishing Logbook in regard to Minister Regulation No. 18/ 2010. e. Further research of shark fisheries in Indonesia.