Embed Size (px)
Citation preview
July, 1932 ACIDITY FUNCTIONS OF SULFURIC AND PERCHLORIC ACIDS 2721
[CONTRIBUTION FROM THE DEPARTMENT O F CHEMISTRY, COLUMBKA UNIVERSITY I
A SERIES OF SIMPLE BASIC INDICATORS. I. THE ACIDITY FUNCTIONS OF MIXTURES OF SULFURIC AND
PERCHLORIC ACIDS WITH WATER’
BY LOUIS P. HAMMETT AND ALDEN J. DEYRUP~ RECEIVED MARCH 9, 1932 PUBLISHED J U L Y 6, 1932
Recent work, especially that of Hantzsch and of Hall and Conant, has demonstrated that we have to deal in ordinary chemical systems with a range of acidity much wider than is comprised in the field of dilute aqueous solutions. It has not however given us any single experimental criterion of acidity or any general method of measuring it. When, for instance, the acidity of a solution is determined by means of a simple basic indicator, the thing measured really is the tendency of the acids present, under the conditions prevailing, to transfer hydrogen ion to a neutral organic mole- cule, the indicator base, converting it to a positive ion. I t has been pointed out3 that such a measure of acidity is not in general the same as that given by an acid indicator, and that neither is a measure of the theo- retical concept of hydrogen ion activity.‘
The “acidity in terms of a basic indicator” is, nevertheless, a most significant quantity, certainly for the equilibrium in any reaction in which hydrogen ion is added to a neutral molecule, and probably for the inter- pretation of cases of acid catalysis in which the first step is addition of hydrogen ion to a neutral substrate. We have now given it a definite formulation in terms of an acidity function, Ho, and have developed a series of indicators by means of which this function can be measured for any solution &hose acidity lies between that of dilute aqueous solutions and that of 100% sulfuric acid.
The possibility of measuring such an acidity function, of applying it to other properties of a solution than the indicator effects which serve to measure it and of determining the relative basicities of indicators by the “step method” which we have use:, all depend upon one fundamental assumption. This is that the relative strength of two bases of the same charge type is independent of the medium in which they are compared. The approximate validity of this rule is evidenced by a number of in-
This article is based upon part of a dissertation submitted by Alden J. Deyrup to the Faculty of Pure Science of Columbia University in partial fulfilment of the requirements for the degree of Doctor of Philosophy, March, 1932.
Gottsberger Fellow, 1931-1932. Hammett, THIS JOURNAL, 50, 2666 (1928). This conclusion is emphasized by the demonstration by Taylor, J . Phys. Chem.,
31, 1478 (1927), and by Guggenheim, ibid. , 33, 842 (1929); 34, 1540, 1758 (1930), of the theoretical as well as the practical impossibility of the determination of individual ion activities.
2722 LOUIS P. HAMMETT AND ALDEN J. DEYRUP VOl. 54
ve~tigations;~ we shall discuss its precision later in the light of our own results.
We define a simple basic indicator as a non-ionized or neutral substance capable of adding one hydrogen ion per molecule without any complicating further reactionse and in such a way that a color change is determined by the extent of the reaction.’ We further define the strength of such an indicator or of any other monoacid base by the function
where a is activity, c is concentration and f is activity coefficient, and refer activities in all solvents to the same reference standard, a dilute aqueous solution. In such a solution therefore
and pK’ = - log COHaCCB - CBH+
If now we determine the ionization ratios of two such bases B and C in any given solution whatsoever
The first term on the right is measurable colorimetrically if the bases are indicators; our fundamental assumption is equivalent to the statement that the activity coefficient term is zero and that the activity coefficient ratio fB/fBH+ in a given solution is the same for all bases. From this determination of the ionization ratios we therefore calculate the relative strengths of the two bases by the equation
If we have a series of simple basic indicators covering any range of acidities whatever, we may by a stepwise application of this procedure, using any convenient solutions, obtain the base strength relative to water of the whole series. We can thus determipe the basicities of those substances, too weakly basic for direct measurement in dilute aqueous solutions, which we must use for the study of strongly acid solutions.
Pring, Trans. Faraday Soc., 19, 705 (1924); Michaelis and Mizutani, Z. physik. Chem., 116, 135 (1925); Mizutani, ibid., 116, 350; 118, 318, 327 (1925); Ebert, Ber., 58B, 175 (1925); Hall, THIS JOURNAL, 52, 5115 (1930); Halford, ibid., 53, 2939, 2944 (1931); Bronsted, Ber., 61, 2049 (1928).
A mobile tautomerism of either base or ion is not a complication in this sense. See A. A. Noyes, THIS JOURNAL, 32, 815 (1910).
In the same way a simple acid indicator may be defined in terms of the addition of one hydrogen ion to a singly charged anion. Other types exist but offer less promise of usefulness.
6 Goldschmidt and Mathiesen, 2. physik. Chem., 119, 439 (1926);
July, 1932 ACIDITY FUNCTIONS OF SULFURIC AND PERCHLORIC ACIDS 2723
We define the acidity function Ho by the equation
It may be interpreted as a measure of the extent to which a base of zero strength (pK’) reacts with hydrogen ion in the solution in question, or of the strength of a base which is half converted to the corresponding ion in that solution. In its equivalent form
the equation shows that the value of HO is definite and independent of the particular indicator used to measure it to the extent that our fundamental assumption that the ratio fB/fBH+ is the same for different bases in a given solution is exact. In dilute aqueous solution Ho becomes equal to the PH; in acetic acid it is theoretically equal to the ( P H ) ~ * ~ of Hall and Conant18 but differs by an additive constant from the value actually given by their scale. The quantity uH+fB/fBH+ is of the type which Guggenheimg has shown to have an operational or physical meaning.
It is clear that there is a whole series of acidity functions, and we propose that they be distinguished by a subscript representing the sign of the base in the conjugate acid-base systemlo used for their determination. Thus in terms of the simple acid indicator whose color change is determined by the reaction
A ’ + H t e H A
the acidity function H- is determined by the equations
(6) CA’ H- = log - f fiK~.4 CHA
Similarly the acidity functions H+ and H++ are defined by the extent of the indicator reactions
B + f H + = BH++ and B + + + H t B H t t t
respectively. The number of substances known to give reversible color changes with
strong acids is enormousll and i t is not difficult to find others. These can be used for the measurement of acidity with changing medium only if it
* See the first criterion of selection of a scale of acidity given in the footnote, THIS JOURNAL, 49, 3059 (1927).
Guggenheim, J . Phys. Chem., 33, 842 (1929). lo Bronsted, Chem. Rev., 5 , 231 (1928). *l The following papers contain extensive lists of examples: Baeyer and Villiger,
Ber., 35, 1189 (1902); Kaufmann and Beisswenger, ibid., 36, 561 (1903); Hofmann and Kirmreuther, ibid., 42, 4856 (1909); Hofmann, Metzler and Lecher, ib id . , 43, 178, 183 (1910); Hofmann, Roth, Hobold and Metzler, ibid., 43, 2629 (1910); Fischer and Gross, J . prakt. Chem., [ 2 ] 84, 377 (1911).
2724 LOUIS P. HAMMETT AND ALDEN J. DEYRUP VOl. 54
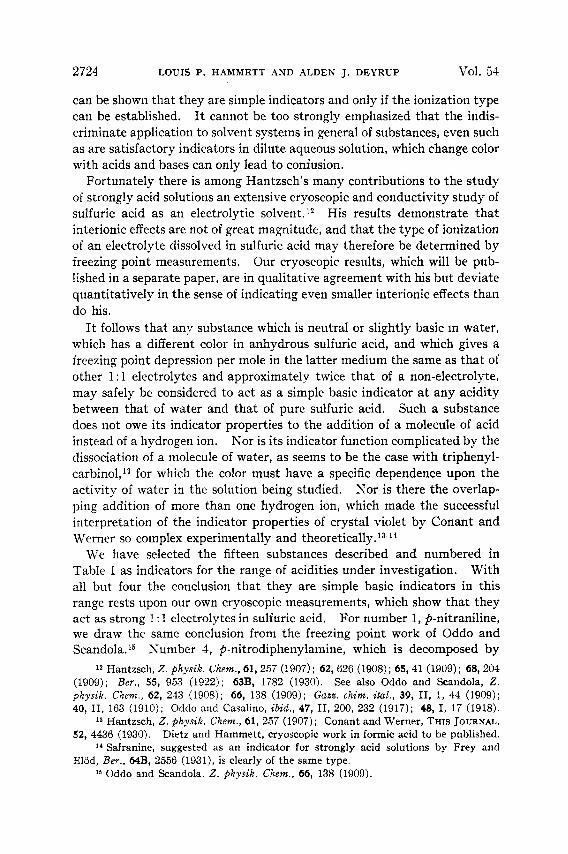
can be shown that they are simple indicators and only if the ionization type can be established. It cannot be too strongly emphasized that the indis- criminate application to solvent systems in general of substances, even such as are satisfactory indicators in dilute aqueous solution, which change color with acids and bases can only lead to confusion.
Fortunately there is among Hantzsch's many contributions to the study of strongly acid solutions an extensive cryoscopic and conductivity study of sulfuric acid as an electrolytic solvent.'* His results demonstrate that interionic effects are not of great magnitude, and that the type of ionization of an electrolyte dissolved in sulfuric acid may therefore be determined by freezing point measurements. Our cryoscopic results, which will be pub- lished in a separate paper, are in qualitative agreement with his but deviate quantitatively in the sense of indicating even smaller interionic effects than do his.
It follows that any substance which is neutral or slightly basic in water, which has a different color in anhydrous sulfuric acid, and which gives a freezing point depression per mole in the latter medium the same as that of other 1 : 1 electrolytes and approximately twice that of a non-electrolyte, may safely be considered to act as a simple basic indicator a t any acidity between that of water and that of pure sulfuric acid. Such a substance does not owe its indicator properties to the addition of a molecule of acid instead of a hydrogen ion. Nor is its indicator function complicated by the dissociation of a molecule of water, as seems to be the case with triphenyl- carbinol,I3 for which the color must have a specific dependence upon the activity of water in the solution being studied. Nor is there the overlap- ping addition of more than one hydrogen ion, which made the successful interpretation of the indicator properties of crystal violet by Conant and Werner so complex experimentally and theoretically. 13s1'
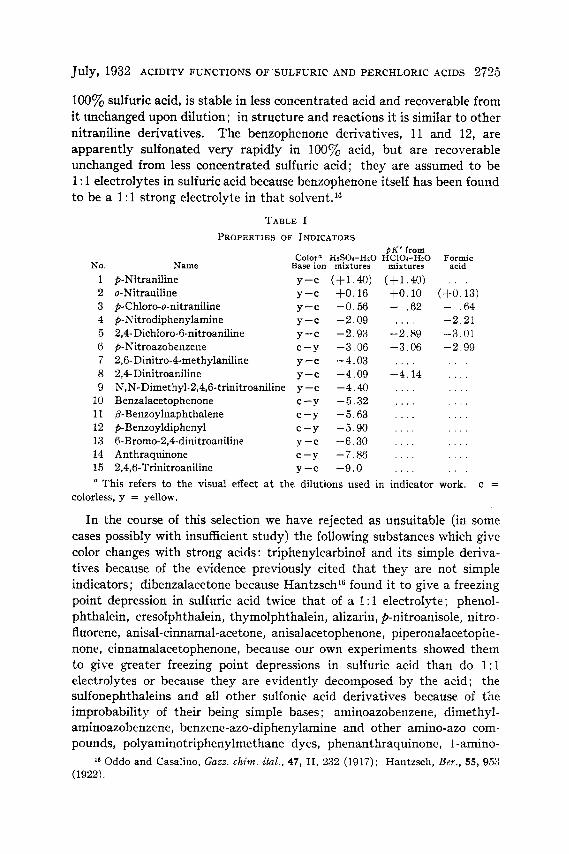
We have selected the fifteen substances described and numbered in Table I as indicators for the range of acidities under investigation. With all but four the conclusion that they are simple basic indicators in this range rests upon our own cryoscopic measurements, which show that they act as strong 1 : 1 electrolytes in sulfuric acid. For number 1, p-nitraniline, we draw the same conclusion from the freezing point work of Odd0 and Scandola. Number 4, p-nitrodiphenylamine, which is decomposed by
12 Hantzsch, 2. physik. Chem., 61, 257 (1907); 62, 626 (1908); 65, 41 (1909); 68,204 (1909); Ber., 55, 953 (1922); 63B, 1782 (1930). See also Odd0 and Scandola, 2. physik. Chem., 62, 243 (1908), 66, 138 (1909); Gam. chim. ital., 39, 11, 1, 44 (1909); 40, 11, 163 (1910); Odd0 and Casalino, ibid. , 47, 11, 200, 232 (1917); 48, I, 17 (1918).
13 Hantzsch, 2. physik. Chem., 61,257 (1907); Conant and Werner, THIS JOURNAL,
52, 4436 (1930). Dietz and Hammett, cryoscopic work in formic acid to be published. l4 Safranine, suggested as an indicator for strongly acid solutions by Frey and
Elod, Ber., 64B, 2556 (1931), is clearly of the same type. l5 Odd0 and Scandola, 2. physik. Chem., 66, 138 (1909).
July, 1932 ACIDITY FUNCTIONS OF SULFURIC AND PERCHLORIC ACIDS 2725
100% sulfuric acid, is stable in less concentrated acid and recoverable from it unchanged upon dilution; in structure and reactions it is similar to other nitraniline derivatives. The benzophenone derivatives, 11 and 12, are apparently sulfonated very rapidly in 100% acid, but are recoverable unchanged from less concentrated sulfuric acid; they are assumed to be 1 : 1 electrolytes in sulfuric acid because benzophenone itself has been found to be a 1 : 1 strong electrolyte in that solvent.16
TABLE I PROPERTIES OF INDICATORS
N O .
1 2 3 4 5 6 7 8 9
10 11 12 13 14 15
Name
p-Nitraniline o-Nitraniline p-Chloro-o-nitraniline p-Nitrodiphenylamine 2,4-Dichloro-6-nitroaniline p-Nitroazobenzene 2,6-Dinitro-4-methylaniline 2,4-Dinitroaniline N,N-Dimethyl-2,4,6- trinitroaniline Benzalacetophenone 8-Benzoylnaphthalene p-Benzoyldiphenyl 6-Bromo-2,4-dinitroaniline Anthraquinone 2,4,6-Trinitroaniline
OK' from Color" HzSOI-HZO HClOcHzO Formic
Base ion mixtures mixtures acid
Y --c Y --c Y --c Y --c Y --c c -Y Y --c Y --c Y --c c -Y C -Y c -Y Y --c c-Y Y --c
( f 1 . 4 0 ) fO. 16 -0.56 -2.09 -2.93 -3.06 -4.03 -4.09 -4.40 -5.32 -5.63 -5.90 -6.30 -7.86 -9.0
( + I , 40) +o. 10 - .62
. . I .
-2.89 -3.06 . . . .
-4.14 . . . . . . . . . . . . . . . . . . . . . . . . . . . .
. . . . (+0 . 13) - .64 -2.21 -3.01 -2.99
. . . .
. . . .
. . . .
. . . .
. . . .
. . . . , . . . . . . . , . . .
a This refers to the Visual effect a t the dilutions used in indicator work. c =
colorless, y = yellow.
In the course of this selection we have rejected as unsuitable (in some cases possibly with insufficient study) the following substances which give color changes with strong acids : triphenylcarbinol and its simple deriva- tives because of the evidence previously cited that they are not simple indicators; dibenzalacetone because HantzschI6 found i t to give a freezing point depression in sulfuric acid twice that of a 1:l electrolyte; phenol- phthalein, cresolphthalein, thymolphthalein, alizarin, p-nitroanisole, nitro- fluorene, anisal-cinnamal-acetone, anisalacetophenone, piperonalacetophe- none, cinnamalacetophenone, because our own experiments showed them to give greater freezing point depressions in sulfuric acid than do 1:l electrolytes or because they are evidently decomposed by the acid; the sulfonephthaleins and all other sulfonic acid derivatives because of the improbability of their being simple bases ; aminoazobenzene, dimethyl- aminoazobenzene, benzene-azo-diphenylamine and other amino-azo com- pounds, polyaminotriphenylmethane dyes, phenanthraquinone, l-amino-
l6 Odd0 and Casalino, G u m chim. ital., 47, 11, 232 (1917); Hantzsch, Bu. , 55, 953 (1922).
2726 LOUIS P. HAMMETT AND ALDEN 3, DEYRUP Vol. 54
and 2-aminoanthraq~inone~ because they have a second ionization step and second color change in the range investigated; xanthone and 2,4,6,2’,4’,G’- hexanitrodiphenylamine, because of low solubility.
In addition to a proper selection of indicators, any precise indicator work with changing medium must consider the fact that the absorption of light by a colored substance in solution depends to some extent upon the medium in which i t is dissolved, even in cases where the inert nature of the solvent makes chemical reaction in the ordinary sense very improbable. From the numerous previous investigation^'^ of this “medium effect” and our own experiments the following general conclusions may be drawn: (1) that its magnitude is specific with regard to the colored substance and the change of solvent; (2) that it is not directly dependent on the charge of the colored substance, the color intensity of neutral molecules being changed as well as that of ions; (3) that its magnitude has not exceeded a factor of two in any case investigated.
In theory, therefore, we should make colorimetric comparisons in a constant medium; in practice it is more convenient to do this indirectly, making the direct comparison with a solution either in water or in 96% sulfuric acid. For the case of an indicator which is non-ionized and colored in water and colorless a t high acidity, we define “the stoichiometric color intensity relative to water,” I,, of a solution A by the equation
C W . L W I, = - CdLa
where C, and C, are the stoichiometric concentrations of indicator in solution A and in water, respectively, and L, and L, are the lengths of a column of solution A and of a column of water containing these concen- trations of indicator a t colorimetric balance.18
We define “the specific color intensity of the colored form relative to
(8 )
water,” S,, by the equation sw - [Blw.Lw
[B 1 a . L ~~
where [B], is the concentration of the colored base in water, [B], its concentration in solution A. From these equations and from
and C. = [B]. + [BH+]. C, = [BIw since [BH+Iw = 0
we obtain
17 H. C. Jones and Guy, Physik. Z., 13, 649 (1912); Hantzsch and Glover, Ber., 39, 4153 (1906); von Halban and Ebert, 2. physik. Chem., 112, 321 (1924); Sidgwick, Worboys and Woodward, Proc. Roy. SOC. (London), A129, 537 (1930); Kolthoff, J . Phys. Chem., 32, 1820 (1928).
18 This is an expression of Lambert’s law and Beer’s law. See von Halban and Siedentopf, 2. physik. Chem., 100, 208 (1922); von Halban and Ebert, ibid., 112, 321 (1924).
July, 1932 ACIDITY FUNCTIONS OF SULFURIC AND PERCHLORIC ACIDS 2727
A determination of the ionization ratio [BH f]/[B J and the acidity, Ho, in a given solution must be made by determining I,, and by then decreas- ing the acidity with as little change in medium properties as possible until the indicator is completely in the non-ionized colored form. Then [BH + ] = 0 and S, = I,.
If the color change is in the reverse sense (base colorless, cation colored) a similar equation and process are used
where I h = stoichiometric color intensity relative to a medium H, for instance 96y0 sulfuric acid, in which the indicator is completely converted to the colored form, and & = specific color intensity of the colored form relative to the medium H.
The present article describes the standardization of the series of indi- cators by the use of mixtures of water with sulfuric acid and with perchloric acid, together with some corollaries of the incidental determination of the values of the acidity function, Ho, in these mixtures. These are particu- larly convenient solutions for the intercomparison of indicators by the step method; within the precision which our fundamental assumption allows, the values of basicity thus obtained will hold for other media. A following article shows that the indicator series thus standardized may indeed be successfully used in the investigation of solutions in the anhydrous solvent formic acid.
Materials and Procedure Sulfuric Acid.-Chemically pure concentrated sulfuric acid was tested for clarity in
the colorimeter (several samples had to be rejected because of a faint brownish tint). It was standardized to +0.1’70 by titration with recently prepared 0.1 molar sodium hydroxide solution standardized with potassium acid phthalate from the Bureau of Standards. The value thus obtained was found to check with a gravimetric determina- tion by precipitation of barium sulfate within 0.1%. It was kept in a tightly stoppered bottle, and was again standardized when nearly exhausted to make certain that it had not changed.
Commercial C. P. fuming acid could not be used to make up acid of concentrations greater than 96% because of its color. Decolorization with nitric acid or sodium per- sulfate left traces of oxidizing substances which destroyed the indicators. Colorless samples obtained from one manufacturer also destroyed indicators. We finally dis- tilled sulfur trioxide from 30% fuming acid directly into 96y0 acid in an all-glass appa- ratus.
The various concentrations of acid required were made up by direct weighing of concentrated acid and water. Densities used in calculating indicator concentrations were taken from the “International Critical Tables.” In the range of composition between 98 and 100% acid, where the acidity changes so rapidly with water content that volumetric analysis is not sufficiently accurate, solutions were prepared by addition of weighed amounts of water to acid of maximum freezing point.
I n the range from 97 to 100% acid, the acidity-composition curves were determined both with the acid described above and with a sample purified by distillation in a plati-
2728 LOUIS P. HAMMETT AND ALDEN J. DEYRUP VOl. 54
num still. The latter was found to contain no detectable amount of platinum and less than 0.0002 molar sulfur dioxide. The curves were congruent within experimental error.
Perchloric Acid.-C. P. 7070 acid was standardized against 0.1 molar sodium hydroxide. It was restandardized a t the end of the series of experiments to make certain that i t had not changed. Dilutions were made in the same way as with sulfuric acid.
Except where otherwise noted they were obtained from well-known dealers. Melting points were determined by the capillary-tube method with a thermometer calibrated a t the Bureau of Standards, and have been corrected for stem exposure. The tests of purity indicated by the letters A and B are explained later.
1. M. p. 148.9'. 2. Recryst. from alcohol, m. p. 71.7'. 3. Prepared by neu- tralization of the hydrochloride; recryst. from water, m. p. 116.1". B. 4. Recryst. from alcohol, m. p. 133". B. 5. Prepared by chlorination of 4-chloro-2-nitroaniline by the method of Witt;l9 recryst. from alcohol and from acetone, m. p. 101.1'. A and B. 6. Prepared (a) by nitration of azobenzene;20 recryst. from acetone to constant m. p, 130.8". (b) From p-nitronitrosobenzene and aniline;21 recryst. from acetone to constant m. p. 129.2'. Tests of purity-equal specific color intensity and conwen t intensity curves of a and b. Prepared by nitration of acet-p-toluidide and saponification of the acetyl derivative;** recryst. from alcohol and from acetone, m. p. 169'. B. 8. Recryst. from acetone and from alcohol, m. p. 180"; A and B. Prepared by inter- action of picryl chloride and dimethylamine;23 recryst. from acetic acid, m. p. 141 '. B. 10. Recryst. from alcohol, m. p. 55.5'. A and B. 11. Prepared by H. P. Treffers in this Laboratory by the method of M ~ n t a g n e ; ~ ~ recryst. from alcohol, m. p. 82.7". B. Prepared by H. P. Treffers by the method of Montagne;26 recryst. from alco- hol, m. p. 101.6". B. 13. Prepared by bromination of 2,4-dinitr0aniline;~B recryst. from acetic acid, m. p. 150.5-152". B. 14. Recryst. from alcohol. 15. Recryst. from acetic acid.
Rocedure.-For the experiments in sulfuric acid-water mixtures, a solution of known concentration of the indicator in 96% acid was placed in a short buret rigidly clamped and a definite number of drops were allowed to fall into a portion OF the solu- tion under investigation, and then a definite number into the liquid to be used as refer- ence standard. For both series the composition of the acid-water mixture was corrected for the effect of the added indicator solution.
The solutions, immediately after addition of the indicator, were brought to 25 * 3", transferred to the colorimeter cups, and compared, The reference standard was waterz7 for those indicators whose acid form is colorless, and 96% sulfuric acid or 70% per-
Indicators.-These are listed by number from Table I.
7 .
9.
12.
A similar procedure was used for the perchloric acid series.
Witt, Ber., 8, 820 (1875). *O Janowsky, Monatsh., 7, 124 (1886). 21 Bamberger and Hiibner, Ber., 36, 3803 (1903). 22 Beilstein and Kuhlberg, Ann., 158, 341 (1871); Jackson and Ittner, Am. Chem.
23 Von Romburgh, Rec. trav. chim., 2, 105 (1883). 2 4 Montagne, Rec. trav. chim., 26, 281 (1907); Rousset, Bull. soc. chim., [111] 15,
25 Montagne, Rec. trav. chim., 27, 357 (1908). 26 Korner, Jahresber., 350 (1875). 27 With the two most strongly basic indicators, 1 and 2, the water reference solu-
J . , 19, 6 (1897).
71 (1896).
tion was made slightly alkaline to prevent ionization of the indicator.
July, 1932 ACIDITY FUNCTIONS OF SULFURIC AND PERCHLORIC ACIDS 2729
chloric acid for those having colored ions and colorless molecules. From these com- parisons the color intensity, I , or I h , was calculated by equation 8.
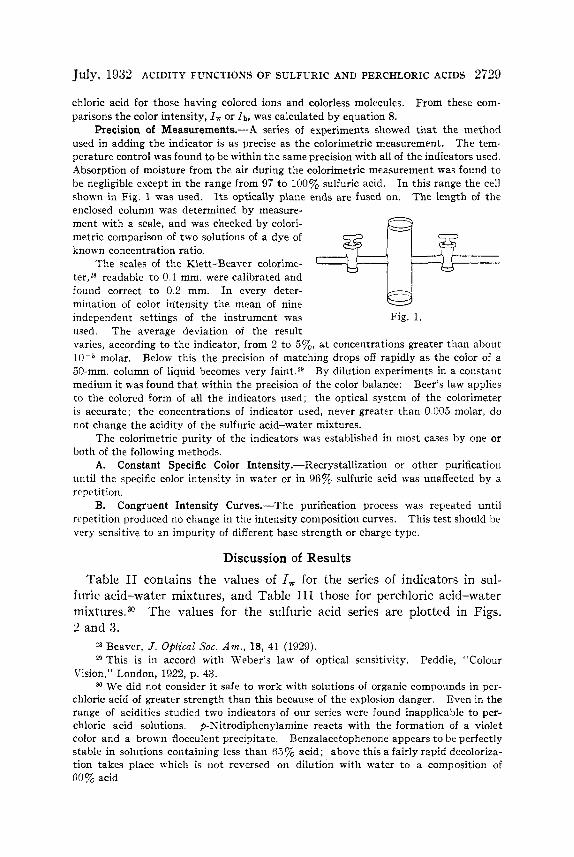
Precision of Measurements.-A series of esperiments showed that the method used in adding the indicator is as precise as the colorimetric measurement. The tem- perature control was found to be within the same precision with all of the indicators used. Absorption of moisture from the air during the colorimetric measurement was found to be negligible except in the range from 97 to 100% sulfuric acid. In this range the cell shown in Fig. 1 was used. The length of the enclosed column was determined by measure- ment with a scale, and was checked by colori- metric comparison of two solutions of a dye of known concentration ratio.
The scales of the Klett-Beaver colorime- ter,Y8 readable to 0.1 mm. were calibrated and
Its optically plane ends are fused on.
& found correct to 0.2 mm. In every deter- mination of color intensity the mean of nine independent settings of the instrument was Fig. 1. used. The average deviation of the result varies, according to the indicator, from 2 to 57,, at concentrations greater than about
Below this the precision of matching drops off rapidly as the color of a 30-mm. column of liquid becomes very faint.29 By dilution esperiments in a constant medium it was found that within the precision of the color balance: Beer’s law applies to the colored form of all the indicators used; the optical system of the colorimeter is accurate; the concentrations of indicator used, never greater than 0.005 molar, do not change the acidity of the sulfuric acid-water mixtures.
The colorimetric purity of the indicators was established in most cases by one or both of the following methods.
A. Constant Specific Color Intensity.-Recrystallization or other purification until the specific color intensity in water or in 96% sulfuric acid was unaffected by a rcpctition.
B. Congruent Intensity Curves.-The purification process was repeated until rcpetition produced no change in the inteiisity composition curves. This test should be very sensitive to an impurity of different base strength or charge type.
molar.
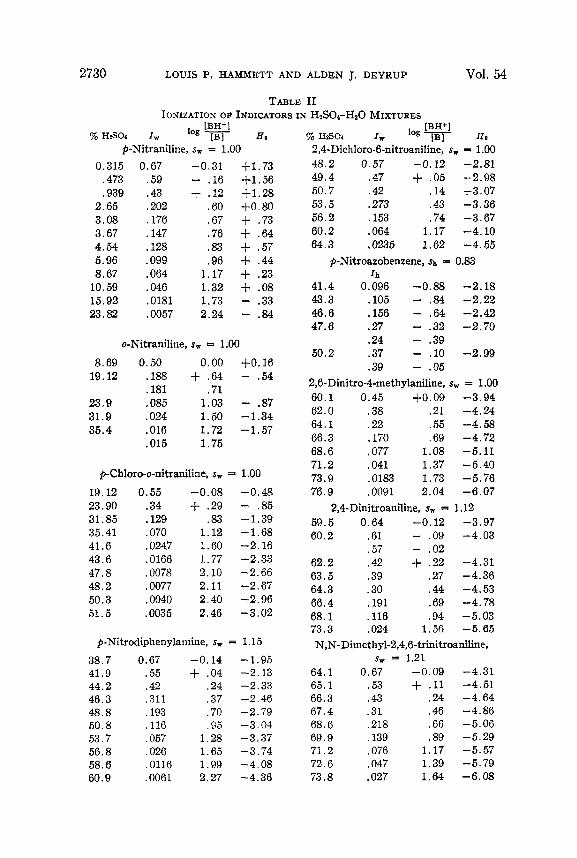
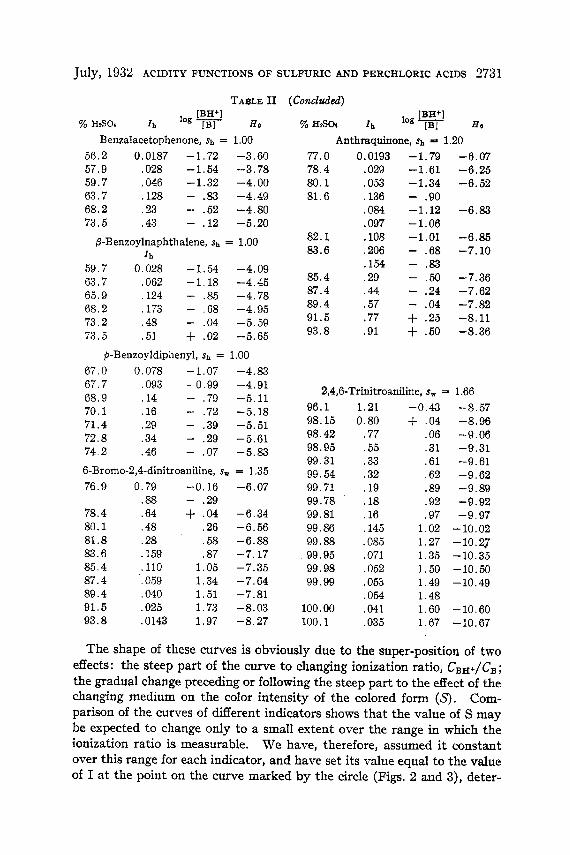
Discussion of Results Table I1 contains the values of I , for the series of indicators in sul-
furic acid-water mixtures, and Table I11 those for perchloric acid-water The values for the sulfuric acid series are plotted in Figs.
2 and 3. Beaver, J . Optical Soc. A m . , 18, 41 (1929).
29 This is in accord with Wrber’s law of optical sensitivity. Peddic, “Colour [‘ision,” London, 1922, p. 43.
30 We did not consider it safe to work with solutions of organic compounds in per- chloric acid of greater strength than this because of the explosion danger. Even in the range of acidities studied two indicators of our series were found inapplicable to per- chloric acid solutions. p-Nitrodiphenylamine reacts with the formation of a violet color and a brown flocculent precipitate. Benzalacetophenone appears to be perfectly stable in solutions containing less than 65% acid; above this a fairly rapid decoloriza- tion takes place which is not reversed on dilution with water to a composition of 00% acid
2730 LOUIS P. HAMMETT AND ALDEN J. DEYRUP
TABLE I1
V O l . 54
+Nitraniline, sw = 1.00 0.315 0.67 -0.31 +1.73
.473 .59 - . I 6 4-1.56
.939 .43 + .12 4-1.28 2.65 ,202 .60 $0.80 3.08 .176 .67 + .73 3.67 .I47 .76 + .64 4.54 .I28 -83 + .57 5.96 .099 .96 + .44 8.67 .064 1.17 + .23
10.59 .046 1.32 + .08 15.92 .0181 1.73 - .33 23.82 .0057 2.24 - .84
o-Nitraniline,
8.69 0.50 19.12 .I88
.I81 23.9 ,085 31.9 .024 35.4 ,016
.015
sw = 1.00
0.00 +0.16 + .64 - .54
1.03 - .87 1.50 -1.34 1.72 -1.57 1.75
.71
p-Chloro-o-nitraniline, sv = 1.00
19.12 23.90 31.85 35.41 41.6 43.6 47.8 48.2 50.3 51.5
0.55 .34 .129 .070 .0247 .0166 .0078 .0077 .0040 .0035
-0.08 + .29 .83
1.12 1.60 1.77 2.10 2.11 2.40 2.46
-0.48 - .85 -1.39 -1.68 -2.16 -2.33 -2.66 -2.67 -2.96 -3.02
p-Nitrodiphenylamine, sw = 1.15
38.7 0.67 -0.14 -1.95 41.9 .55 + .04 -2.13 44.2 .42 .24 -2.33 46.3 .811 .37 -2.46 48.8 ,193 .70 -2.79 50.8 .116 .95 -3.04 53.7 ,057 1 .28 -3.37 56.8 ,026 1.65 -3.74 58.6 ,0116 1.99 -4.08 60.9 ,0061 2.27 -4.36
. .
2,4-Dichloro-6-nitroaniline, s, = 1.00 48.2 0.57 -0.12 -2.81 49.3 .47 + .05 -2.98 50.7 .42 .14 73 .07 53.5 .273 .43 -3.36 56.2 .153 -74 -3.67 60.2 .064 1.17 -4.10 64 .3 ,0235 1.62 -4.55
p-Nitroazobenzene, sh = 0.83 I h
41.4 0.096 -0.88 -2.18 43.3 .IO5 - .84 -2.22 46.6 ,156 - .64 -2.42 47.6 .27 - .32 -2.70
.24 - .39 50.2 .37 - .IO -2.99
.39 - .05 2,6-Dinitro-4-methylaniline, sw = 1.00 60.1 0.45 +0.09 -3.94 62.0 .38 .21 -4.24 64.1 .22 .55 -4.58 66.3 .I70 .69 -4.72 68.6 .077 1.08 -5.11 71.2 ,041 1.37 -5.40 73.9 . O B 3 1.73 -5.76 76.9 ,0091 2.04 -6.07
2,4-Dinitroaniline, sw = 1.12 59.5 0.64 -0.12 -3.97 60.2 .61 - .09 -4.03
.57 - .02 62.2 .42 + .22 -4.31 63.5 .39 .27 -4.36 64.3 .30 .44 -4.53 66.4 .I91 .69 -4.78 68.1 .I16 .94 -5.03 73.3 .024 1.56 -5.65
sw = 1.21 64.1 0.67 -0.09 -4.31 65.1 .53 + .11 -4.51 66.3 .43 .24 -4.64 67.4 .31 .46 -4.86 68.6 .218 .66 -5.06 69.9 ,139 .89 -5.29 71.2 .076 1.17 -5.57 72.6 .047 1.39 -5.79 73.8 .027 1.64 -6.08
N,N-Dimethyl-2,4,6-trinitroaniline,
July, 1932 ACIDITY FUNCTIONS OF SULFURIC AND PERCHLORIC ACIDS 2731
TABLE I1 (Concluded)
Benzalacetophenone, sh = 1.00 56.2 0.0187 -1.72 -3.60 57.9 .028 -1.54 -3.78 59.7 ,046 -1.32 -4.00 63.7 .128 - .83 -4.49 68.2 .23 - .52 -4.80 73.5 .43 - .12 -5.20
p-Benzoylnaphthalene, Sh = 1.00 I h
59.7 0.028 -1.54 -4.09 63.7 .062 -1.18 -4.45 65.9 ,124 - .85 -4.78 68.2 .173 - .68 -4.95 73.2 $48 - .04 -5.59 73 .5 .51 + .02 -5.65
p-Benzoyldiphenyl, sh = 1.00 67.0 0.078 -1.07 -4.83 67.7 .093 -0.99 -4.91 68.9 .14 - .79 -5.11 70.1 .16 - .72 -5.18 71.4 .29 - $39 -5.51 72.8 .34 - .29 -5.61 74.2 .46 - .07 -5.83
6-Bromo-2,4-dinitroaniline, sw = 1.35 76.9 0.79 -0.16 -6.07
.88 - .29 78.4 .64 + .04 -6.34 80.1 .48 .26 -6.56 81.8 .28 .58 -6.88 83.6 .159 .87 -7.17 85.4 .110 1 .05 -7.35 87.4 ,059 1.34 -7.64 89.4 ,040 1.51 -7.81 91.5 .025 1.73 -8.03 93.8 .0143 1.97 -8.27
% HBOt
Anthraquinone, a = 1.20 77.0 0.0193 -1.79 -6.07 78.4 .029 -1.61 -6.25 80 .1 ,053 -1.34 -6.52 81.6 .136 - .90
,084 -1.12 -6.83 .097 -1.06
82.1 .lo8 -1.01 -6.85 83.6 .206 - .68 -7.10
85.4 .29 - .50 -7.36 87.4 .44 - .24 -7.62 89.4 .57 - .04 -7.82 91.5 .77 + .25 -8.11 93.8 .91 + .50 -8.36
.154 - .83
2,4,6-Trinitroaniline, s, = 1.66 96.1 1.21 -0.43 -8.57 98.15 0.80 + .04 -8.96 98.42 .77 .06 -9.06 98.95 .55 .31 -9.31 99.31 .33 .61 -9.61 99.54 .32 .62 -9.62 99.71 .19 .89 -9.89 99.78 .18 .92 -9.92 99.81 .16 .97 -9.97 99.86 ,145 1.02 -10.02 99.88 .085 1.27 -10.27 99.95 .071 1.35 -10.35 99.98 .052 1.50 -10.50 99.99 .053 1.49 -10.49
100.00 .041 1.60 -10.60 100.1 ,035 1.67 -10.67
.054 1.48
The shape of these curves is obviously due to the super-position of two effects: the steep part of the curve to changing ionization ratio, CBHt/CB; the gradual change preceding or following the steep part to the effect of the changing medium on the color intensity of the colored form (a. Com- parison of the curves of different indicators shows that the value of S may be expected to change only to a small extent over the range in which the ionization ratio is measurable. We have, therefore, assumed it constant over this range for each indicator, and have set its value equal to the value of I a t the point on the curve marked by the circle (Figs. 2 and 3), deter-
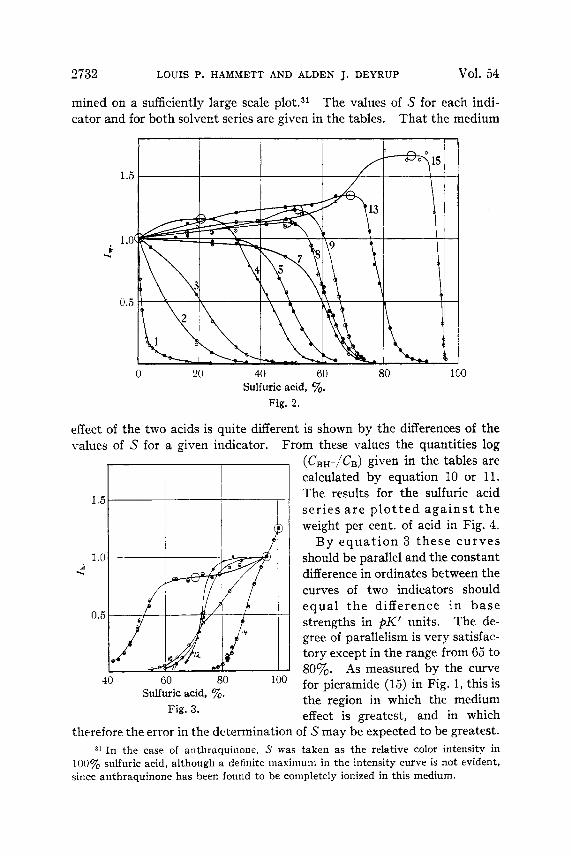
2732 LOUIS P. HAMMETT AND ALDEN J. DEYRUP VOl. 54
mined on a sufficiently large scale cator and for both solvent series are given in the tables.
The values of S for each indi- That the medium
1.5
, 1.0 $
0.5
0 20 40 60 80 100 Sulfuric acid, yo.
Fig. 2.
effect of the two acids is quite different is shown by the differences of the values of S for a given indicator. From these values the quantities log
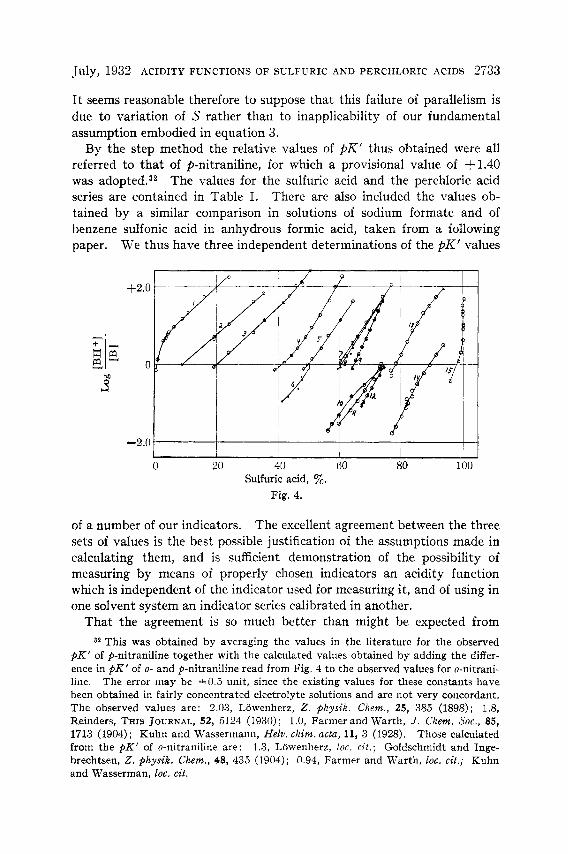
(CBH+/CB) given in the tables are calculated by equation 10 or 11. The results for the sulfuric acid ser ies a re p lo t t ed aga ins t t h e weight per cent. of acid in Fig. 4.
By equa t ion 3 these curves should be parallel and the constant difference in ordinates between the curves of two indicators should equal t h e difference i n base strengths in #K' units. The de- gree of parallelism is very satisfac- tory except in the range from 65 to 80%. As measured by the curve for picramide (15) in Fig. 1, this is the region in which the medium effect is greatest, and in which
therefore the error in the determination of S may be expected to be greatest. 31 In the case of anthraquinone, S was taken as the relative color intensity in
100% sulfuric acid, although a definite maximum in the intensity curve is not evident, since anthraquinone has been found to be completely ionized in this medium.
July, 1932 ACIDITY FUNCTIONS OF SULFURIC AND PERCHLORIC ACIDS 2733
It seems reasonable therefore to suppose that this failure of parallelism is due to variation of S rather than to inapplicability of our fundamental assumption embodied in equation 3.
By the step method the relative values of +K’ thus obtained were all referred to that of p-nitraniline, for which a provisional value of +1.40 was adopted.32 The values for the sulfuric acid and the perchloric acid series are contained in Table I. There are also included the values ob- tained by a similar comparison in solutions of sodium formate and of benzene sulfonic acid in anhydrous formic acid, taken from a following paper. We thus have three independent determinations of the PK’ values
I I I I I I
0 20 40 GO 80 100 Sulfuric acid, %.
Fig. 4.
of a number of our indicators. The excellent agreement between the three sets of values is the best possible justification of the assumptions made in calculating them, and is sufficient demonstration of the possibility of measuring by means of properly chosen indicators an acidity function which is independent of the indicator used for measuring it, and of using in one solvent system an indicator series calibrated in another.
That the agreement is so much better than might be expected from 32 This was obtained by averaging the values in the literature for the observed
pK’ of $-nitraniline together with the calculated values obtained by adding the differ- ence in pK’ of 0- and p-nitraniline read from Fig. 4 to the observed values for o-nitrani- line. The error may be *0.5 unit, since the existing values for these constants have been obtained in fairly concentrated electrolyte solutions and are not very concordant, The observed values are: 2.03, Lowenherz, 2. physik. Chem., 25, 385 (1898); 1.8, Reinders, THIS JOURNAL, 52, 5124 (1930); 1.0, Farmer and Warth, J . Chem. Soc., 85, 1713 (1904); Kuhn and Wassermann, Helv. chim. acta, 11, 3 (1928). Those calculated from the pK‘ of o-nitraniline are: 1.3, Lowenherz, loc. cit.; Goldschmidt and Inge- brechtsen, 2. physik. Chem., 48, 435 (1904); 0.94, Farmer and Warth, loc. cit.; Kuhn and Wasserman. loc. cit.
2734 LOUIS P. HAMMETT AND ALDEN J. D E m U P VOl. 54
previous workaa may perhaps be due to some extent to the choice of media. Nevertheless, the deforming action upon the molecules of the indicator of the two acid-water mixtures is quite different, as is shown by the differences in the S values for a given indicator. And with formic acid we are dealing with anhydrous solutions of low total ion concentration, even though in a good ionic solvent; with the aqueous mixtures we have extremely large ionic concentrations, There is, however, good reason to expect that the agreement of these colorimetric values should be better than is the case with existing results from electrometric or conductivity data. The relative ionizations of two indicators may be compared in what is practically a single medium, because the concentration of the indicator is too small to affect the medium properties. In the electrometric and conductivity data
TABLE I11 IONIZATION OF INDICATORS IN HClOd-HzO MIXTURES
#-Nitraniline, s, = 1.00 5.96 0.105 $0.93 +0.47 7 . 5 .089 1.01 + -39 9.9 .054 1.24 + .16
11.9 .034 1.45 - .02 ,038 1 .40
14.9 .024 1.61 - .21 17.0 .019 1.71 - .29
.021 1.67
o-Nitraniline, s, = 1 .OO 11.9 0.46 $0.07 $0.03 14.9 .33 .31 - .21 16.8 .284 .40 - .30 19.8 .210 .58 - .48 19.9 .211 .57 - .47 22.1 .168 .69 - .69 23.8 ,131 .82 - .66
.149 .76 25.9 ,119 .87 - .77 29.8 ,058 1.21 -1.11 33.1 ,0360 1.43 -1.33 35.0 .0264 1.57 -1.47 37.2 ,0174 1.75 -1.65
9-Chloro-o-nitranilie, sa = 1.00 23.8 0.45 +0.09 -0.71 29.8 .249 .48 -1.10 33.1 .170 .69 -1.31 35.0 ,124 .85 -1.47
P H + I *% HCIOd I, log - P I H o
37.2 .OS6 1.03 -1.65 39.7 ,057 1.22 -1.84 42.5 ,0277 1.55 -2.17 45.8 .0130 1.88 -2.50 46.3 ,0096 2.01 -2.63 46.5 .0096 2.01 -2.63
2,4-Dichloro-6-nitroaniline, s, = 0.79 46.9 0.49 -0.21 -2.68 48.4 .41 - .04 -2.85 50.2 .270 + .29 -3.18 52.1 .169 .56 -3.45 54.1 ,091 .89 -3.78 56.2 .049 1.18 -4.07 57.4 .030 1.40 -4.29 58.6 ,019 1.61 -4.50
2,4-Dinitroaniline, s, = 1.00 56.2 0.57 -0.13 -4.01 58.6 .28 + .41 -4.55 61.1 .117 .88 - 5 . 0 2 63.9 ,047 1.31 -5.45
p-Nitroazobenzene, sh = 1 .OO I h
41.7 0.116 -0.88 -2.18 42.5 .136 - .SO -2.26 44.3 .14 - .79 -2.27 47.3 .25 - .48 -2.58 50.6 .44 - .ll -2.95
(8 According to Halford, THIS JOURNAL, 53, 2944 (1931), the difference between the pK’ values for two bases may vary by as much as one unit from solvent to solvent.
July, 1932 ACIDITY FUNCTIONS OF SULFURIC AND PERCHLORIC ACIDS 2735
the substance whose basicity is being measured changes the nature of the medium to an extent which may be large and specific in solvents of low dielectric constant.34
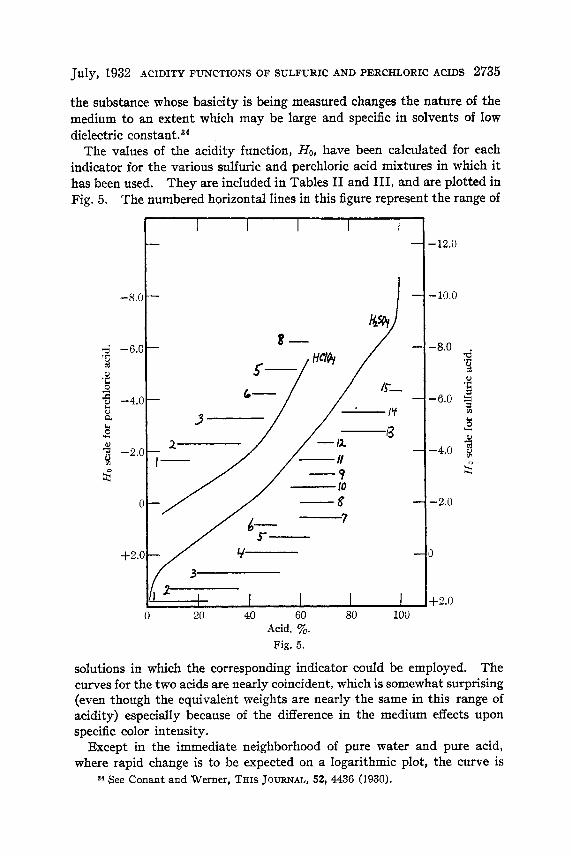
The values of the acidity function, Ho, have been calculated for each indicator for the various sulfuric and perchloric acid mixtures in which it has been used. They are included in Tables I1 and 111, and are plotted in Fig. 5. The numbered horizontal lines in this figure represent the range of
I I I I I I
I
-j -6.0
.- 8 2 -4.0
8-
6- 7
I I I I I I I I I I
0 20 40 60 80 100
-12.0
-10.0
-8.0 . 3 *$
-6.0 % 1, 8 +
3 -4.0 g
2
-2.0
1
f2.0
Acid, %. Fig. 5.
solutions in which the corresponding indicator could be employed. The curves for the two acids are nearly coincident, which is somewhat surprising (even though the equivalent weights are nearly the same in this range of acidity) especially because of the difference in the medium effects upon specific color intensity.
Except in the immediate neighborhood of pure water and pure acid, where rapid change is to be expected on a logarithmic plot, the curve is
a4 See Conant and Werner, THIS JOURNAL, 52, 4436 (1930).
2736 LOUIS P. HAMMETT AND ALDEN J. DEYRUP VOl. 54
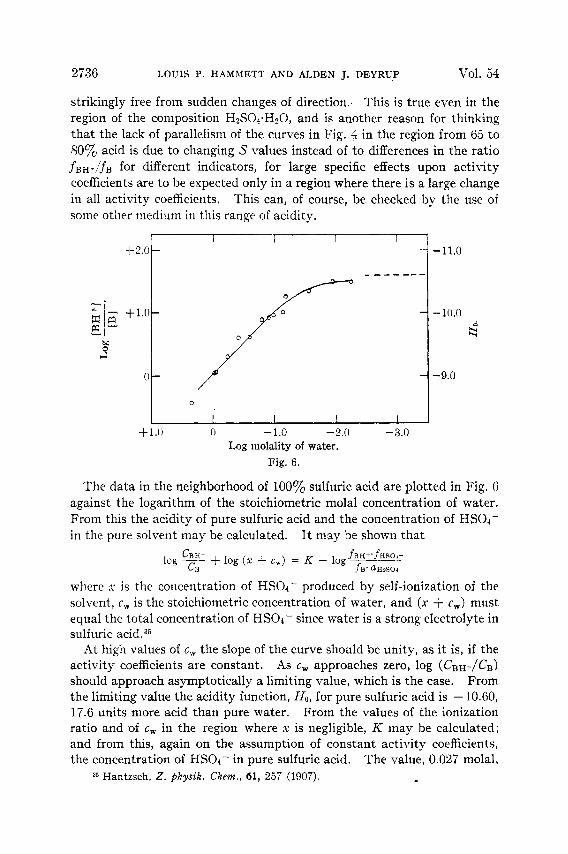
strikingly free from sudden changes of direction.. This is true even in the region of the composition H2SO4.Hz0, and is another reason for thinking that the lack of parallelism of the curves in Fig. 4 in the region from 65 to 80% acid is due to changing S values instead of to differences in the ratio fBH+/fB for different indicators, for large specific effects upon activity coefficients are to be expected only in a region where there is a large change in all activity coefficients. This can, of course, be checked by the use of some other medium in this range of acidity.
- + - $1.0 Y 1%
M
3 0
- 10.0
6
-9.0
+l.O 0 -1.0 -2.0 -3.0 Log molality of water.
Fig. 6.
The data in the neighborhood of 1 0 0 ~ o sulfuric acid are plotted in Fig. 6 against the logarithm of the stoichiometric molal concentration of water. From this the acidity of pure sulfuric acid and the concentration of HSO4- in the pure solvent may be calculated.
log ~ + log (x + 6,") = K - logfBH+.fHSOi-
where x is the concentration of HS04- produced by self-ionization of the solvent, c, is the stoichiometric concentration of water, and (x + c,) must equal the total concentration of HSOI- since water is a strong electrolyte in sulfuric acid.35
At high values of c, the slope of the curve should be unity, as it is, if the activity coefficients are constant. As c, approaches zero, log (CBH+,/CB) should approach asymptotically a limiting value, which is the case. From the limiting value the acidity function, H,, for pure sulfuric acid is - 10.60, 17.6 units more acid than pure water. From the values of the ionization ratio and of c , in the region where x is negligible, K may be calculated; and from this, again on the assumption of constant activity coefficients, the concentration of HS04- in pure sulfuric acid. The value, 0.027 molal,
36 Hantzsch, 2. 9hysik. Chem., 61, 257 (1907).
I t may be shown that CBH'
C B fB ' aHzSO4
July, 1932 ACIDITY FUNCTIONS OF SULFURIC AND PERCHLORIC ACIDS 273'7
is in agreement with cryoscopic and conductivity evidence of the high self-ionization of sulfuric acid.
Some Kinetic Applications There are two chief ways in which such a series of indicators as this may
he expected to be useful. One is the determination of the strengths of bases and of acids too weak and too strong, respectively, to permit measure- ment in aqueous solutions; some examples of this are given in the following paper on formic acid solutions. The other is in the interpretation of re-
TABLE IV A. Condensation of benzoyl benzoic acid, Gleason and Dougherty, THIS
JOURNAL, 51,310 (1929) % H2S01 log) H ; log k + Ha
75 25
90 -2.29 -7.85 -10 14 86 -2.75 -7.32 -10.07 83 -2.89 -6.92 - 9.81 81 -3.23 -6.65 - 9.88 79 -3.53 -6.35 - 9.88 76 -4.06 -5.94 -10.00
C. Decomposition of malic acid, Whit- ford, THIS JOURNAL, 47, 953 (1925);
Dittmar, ibid. , 52,2746 (1930) log k f Ho
2% m H10 log:
40
0 335 -1.22 -9 50 -10.72 600 -1.39 -9.25 -10.64
,932 -1.64 -9.07 -10.71 1.59 -1.98 -8.92 -10.90
E. Decomposition of oxalic acid, Lichty and Bredig, Z . Elektrochem., 12, 450 (1906). Lichty, J . Phys. Chem., 11, 225
(1907) %
0.60 . 70 .80
1.00 1.20 1.50 2.00 3.00
. I
log k + Ha 2'3 log ,k 70
-1.74 -9.51 -11.25 -1.88 -9.42 -11.30 -1.99 -9.38 -11.37 -2.17 -9.29 -11.46 -2.31 -9.20 -11.51 -2.50 -9.12 -11.62 -2.70 -8.99 -11.69 -3.03 -8.82 -11.85
B. Beckmann transformation of aceto- phenone oxime, Lobry de Bruyn and Sluiter, Kgl. akad. wetenschappen, ajdeling der wis- en naturkund, 13, 813 (1904)
log k + Hu 20 % H2S04 60
93.6 -2.96 -8.36 -11.32 94.6 -2.89 -8.48 -11.37 97.2 -2.42 -8.81 -11.26 98.7 -2.15 -9.18 -11.33
D. Decomposition of formic acid, Schierz, ibid., 45, 447 (1923)
20 log + H o % HrSOd log)
25
85 -0.12 -7.20 -7.32
91.8 +1.02 -8.11 -7.09 94.5 +1.50 -8.47 -6.97 97.6 $2.03 -8.89 -6.86 98.9 $2.51 -9.25 -6.74
89.2 $ .38 -7.75 -7.37
F. Decomposition of triphenylacetic acid, Dittmar, ibid., 33, 533 (1929) m H20 log)
2% log + H a 12 1.77 -0.87 -8.75 1.90 - .95 -8.68 2.11 -1.09 -8.66 2.37 -1.22 -8.63 2.93 -1.49 -8.56 2.94 -1.50 -8.55 3.54 -1.80 -8.40 4.18 -2.18 -8.26
- 9.62 - 9.63 - 9.75 - 9.85 -10.05 -10.05 -10.20 -10.44
G. Decomposition of citric acid, Wiig, THIS JOURNAL, 52, 4729 (1930) % Ha0 zo log k + Ha 20 log + Ho
% HmO log! 25
1 0 0 -0 61 -9 28 - 9.89 2 97 -1 60 -8.76 -10 36 1 27 - 81 -9 18 - 9 99 3 54 -1 81 -8 63 -10 44 1 8 4 -1 11 -9 02 -10 13 4 44 -2 14 -8.59 -10 73 2 41 -1 38 -8 88 -10 26 5 23 -2 38 -8.52 -10 90
2738 LOUIS P. HAMMETT AND ALDEN J. DEYRUP VOl. 54
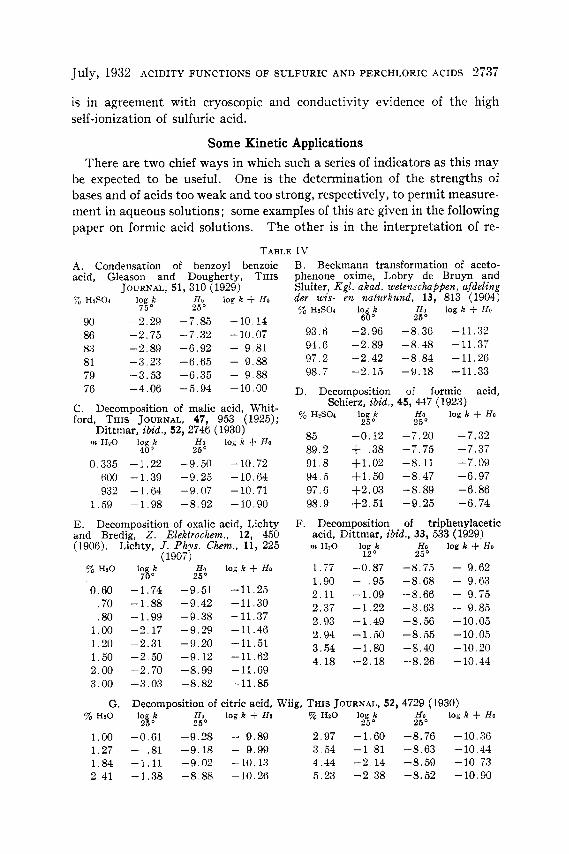
action velocity data. For a preliminary survey we may use the consider- able amount of data on reaction velocities in sulfuric acid-water mixtures, which are summarized in Table IV. In the light of our determination of the acidity of these solutions the reactions may all be considered to be acid catalyzed, since they are reactions whose velocity increases with increase in acidity.36
An exact parallelism between the reaction velocity and the acidity can only be expected if the velocity is proportional to the concentration of the ion formed by the addition of one hydrogen ion to one molecule of the neutral substrate, if the ratio of the concentration of this ion to the total concen- tration of substrate is small, and if there is no further ionization by addition of another hydrogen ion. If these conditions are fulfilled, the equation
HO + log k = constant
where k is the velocity constant, should hold. From the fact that the equation does hold in three of these cases, the
decomposition of malic acid, the condensation of o-benzoylbenzoic acid and the Beckmann transformation of acetophenone oxime, i t may be con- cluded that the necessary conditions are fulfilled for these reactions. The significance for studies of acid catalysis of measurements of acidity with basic indicators is thus dem~nstrated.~’
We wish to acknowledge assistance in this investigation made possible by the generosity of Mr. and Mrs. Reginald Auchincloss.
Summary It is shown that a significant measure of differences in acidity in one
solvent or between solvents may be obtained by means of a properly chosen series of indicators of the same charge type.
The conditions both experimental and in principle for the precise meas- urement of acidity by indicators are defined.
A series of simple basic indicators is developed by means of which any acidity lying in the range between that of dilute aqueous solutions and that of pure sulfuric acid and in any solvent may be determined.
The acidities of mixtures of sulfuric acid and water from 0 to 100% acid and of perchloric acid and water from 0 to 70% acid are determined and some applications of the results discussed.
se This may be considered a more specific statement of Wiig’s conclusion ( L O G . cit.) on the basis of Taylor’s theory of negative catalysis, J . Phys. Chem., 27, 322 (1923), that the substrate forms an addition compound with the sulfuric acid, and that water inhibits the reaction by decreasing the concentration of this compound.
8 We justify this preliminary comparison of reaction velocities determined a t one temperature with acidities determined at another by the probability that both relative reaction velocity and relative acidity are little influenced by temperature. Whitford (loc. cil.) found the temperature coefficient of the reaction in the malic acid case independent of the composition of the solution.
July, 1932 REACTION KINETICS 2739
Because of a parallelism between the acidity and the rates of certain reactions in strong sulfuric acid-water mixtures, these reactions are charac- terized as acid-catalyzed; the “inhibition” produced by water is ascribed to its basic character.
NEW YORK CITY
[CONTRIBUTION FROM THE DEPARTMENT OF CHEMISTRY, COLUMBIA UNIVERSITY ]
THE KINETICS OF THE THIOCYANATE-BROMINATED FATTY ACID REACTIONS
BY VICTOR K. LA MER AND JOSEPH GREENSPAN RECEIVED MARCH 11, 1932 PUBLISHED JULY 6, 1932
In their study of the kinetics of the replacement of bromine in brominated propionic ions by thiosulfate ion, La Mer and Kamner‘ found a greater ve- locity constant when the bromine was in the beta position than when i t was in the alpha position, whereas the customary greater reactivity of the alpha position over the beta position was exhibited when the uncharged fatty acid esters were used instead of the sodium salts. This reversal in reactivity was predicted on the basis of the effect of electrostatic repulsions between the ions of the same sign upon the frequency of collisions.2
The analogous reactions in which thiocyanate ion3 is employed as the replacing ion instead of thiosulfate ion appeared to be well adapted for extending the study, particularly since the analytical method for the deter- mination of thiocyanate published recently by Pagel and Ames4 possesses the advantages of precision and speed over the tedious method employed by Holmberg.
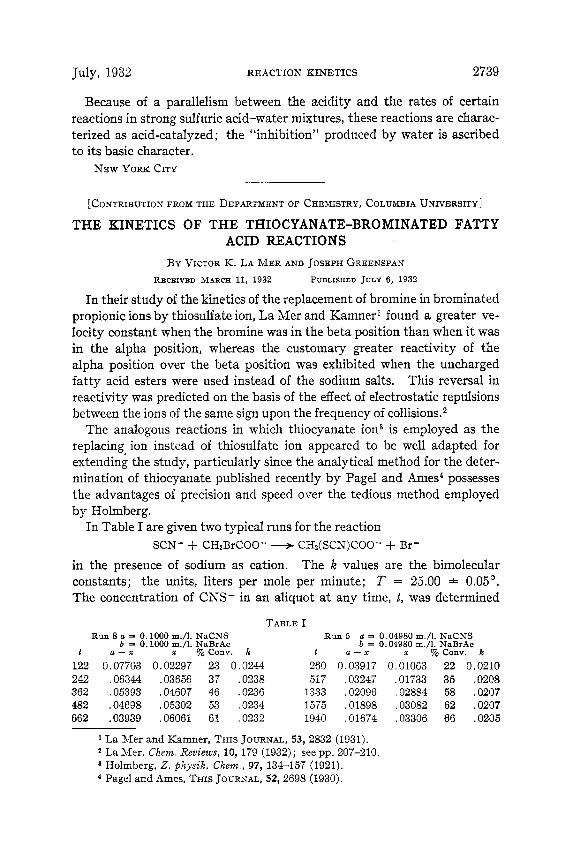
In Table I are given two typical runs for the reaction SCN- + CHzBrCOO- ---+ CH2(SCN)COO- f Br-
in the presence of sodium as cation. The k values are the bimolecular constants; the units, liters per mole per minute; T = 25.00 * 0.05’. The concentration of CNS- in an aliquot a t any time, t, was determined
TABLE I Run 8 a - 0.1000 m./l. NaCNS
b = 0.1000 m./l. NaBrAc Run 5 a = 0.04980 mJ1. NaCNS
b = 0.04980 mJ1. NaBrAc I a - x x % Conv. k 1 a - - x x % C o w . k
122 0.07703 0.02297 23 0.0244 260 0.03917 0.01063 22 0.0210 242 ,06344 ,03656 37 .0238 517 ,03247 ,01733 35 .0208 362 .05393 .04607 46 .0236 1333 ,02096 ,02884 58 .0207 482 .04698 .05302 53 .0234 1575 ,01898 ,03082 62 .0207 662 .03939 ,06061 61 .0232 1940 ,01674 ,03306 66 .0205
La Mer and Kamner, THIS JOURNAL, 53,2832 (1931). La Mer, Chem. Reviews, 10,179 (1932); see pp. 207-210. Holmberg, 2. physik. Chem., 97, 134-157 (1921). Pagel and Ames, THIS JOURNAL, 52,2698 (1930).