Embed Size (px)
Citation preview


1
Acknowledgements
The results submitted have only been made possible by cooperation of many companies and institutions who themselves spent considerable amounts of time, money and effort in general. Therefore, we would like to point out the help of the following:
The General Union of Employers Liability Insurance Ass.(HVBG) for their financial support of this research project,
all the manufacturers united in the German Electrical and Electronic Manufacturers Ass.(ZVEI) for providing their power tool systems free of charge and the open-minded, positive and constructive cooperation,
the Institute for Work Safety belonging to professional associations (BGIA), for prepa-ration and analysis of samples and for their outstanding practical and skilled compan-ionship alongside the work,
all members of the Associated Measurement System for Hazardous Substances (BGMG) participating the project, especially members of the central referee of me-trology, measuring procedure and strategy of Professional Association of Construc-tion (BG BAU) for their work performed in Feuchtwangen, which was often a far cry from merely taking samples,
the members of the Professional Association of Precision Mechanics and Electronics (BGFE), also the members of the Professional Association of Quarry (StBG) for con-structive and pleasant cooperation,
the Bavarian Academy of Construction for their excellent technical support while studies in Feuchtwangen were carried out.
Apart from this, we would like to thank all members of the work alliance called „Promotion of low-dust machines and tools“. Without their continuous, very pleasant collaboration the analysis in front of you would certainly not have been possible.
The authors

2
Final report
Research project
Evaluation of dust emission properties for
hand-operated power tools and devices used for work on
mineral materials
The research project was supported with funds from the research fund of the General Un-ion of employer’s liability insurance associations (HVBG).
Support mark: 617.0-FF 241
Authors: Dipl.-Geogr. Norbert Kluger
Dipl.-Ing. Josef Kraus
Dipl.- Ing. Rosemarie Woelke-Klopsch
Dr. Uwe Musanke
Dieter Höber
- March 2006 -
www.gisbau.de

3
Kurzfassung
In vielen Branchen werden handgeführte Maschinen und Geräte eingesetzt, um minerali-sche Werkstoffe wie Beton- oder Kalksandstein zu bearbeiten. Diese Tätigkeiten können mit der Freisetzung von mineralischem Staub verbunden sein. Die Beschäftigten sind teil-weise hohen Staubbelastungen ausgesetzt.
Allerdings gibt es am Markt längst Bearbeitungssysteme (Maschine und Mobilentstauber), die die Staubemission vermindern. Doch deren tatsächliche Wirksamkeit ist in der Praxis bisher wenig bekannt; verlässliche Informationen sind also dringend erforderlich.
Um die Frage zu klären, wie wirksam die heute am Markt erhältlichen Bearbeitungssyste-me hinsichtlich der Stauberfassung sind, wurde ein vom HVBG gefördertes gemeinsames praxisorientiertes Forschungsprojekt (ZVEI und Berufsgenossenschaften) durchgeführt. Untersucht wurden rund 100 am Markt verfügbare Bearbeitungssysteme.
Alle Bearbeitungssysteme wurden unterschiedlichen „Maschinenkategorien“ wie Trenn-schleifer, Mauernutfräsen, Exzenterschleifer oder Putzfräsen zugeordnet und innerhalb der Gruppe nach den gleichen Kriterien untersucht. In einem speziell hergerichteten Prüf-raum wurden die einzelnen Bearbeitungssysteme unter praxisnahen Bedingungen unter-sucht.
Die Untersuchungen im Prüfraum haben gezeigt, dass bei vielen Maschinenkategorien deutlich niedrigere Staubemissionen in der Praxis erreichbar sind, als sie derzeit beobach-tet werden. In keinem Fall wurden bei den abgestimmten Systemen auch nur annähernd so hohe Konzentrationen ermittelt, wie sie bei Arbeitsplatzmessungen auf Baustellen mit nicht abgestimmten oder nicht abgesaugten Systemen beobachtet wurden.
Als Ergebnis des Forschungsprojektes liegen nun Informationen zu den untersuchten Be-arbeitungssystemen als Hilfen zur Gefährdungsbeurteilung vor und sind frei zugänglich im Internet veröffentlicht (www.gisbau.de).

4
Abstract
In many sectors of the industry hand-operated power tools and equipment is used for working on mineral materials such as concrete or lime sandstone. These activities may in-volve the release of mineral dusts. Employees are sometimes exposed to high levels of dust.
However, power tool systems (machine and mobile dust collector) that reduce the emis-sions of dusts have been on the market for a long time. Nevertheless, their real effective-ness is not yet fully recognised in practice; authoritative information is urgently required.
To clarify the question as to how effective the power tool systems currently available on the market are in collecting dust, a joint, practice-orientated research project supported by the HVBG was implemented (ZVEI and Professional Associations). Around 100 commer-cially available processing systems were investigated.
All the systems were assigned to different “machine categories”, such as abrasive cutters, wall chasers, eccentric sanders or plaster milling machines. Within each group the same criteria were used for investigating each system. The power tool systems were tested un-der practical conditions in a specially arranged test room.
Investigations in the test room showed that, for many machine categories, significantly lower dust emissions are achievable in practice compared to those currently observed. There were no instances of concentrations from harmonized systems even approaching the high levels observed from workplace measurements on sites using non-matched or non-extracted systems.
As a result of the research project, information on the power tool systems that were inves-tigated is now available as an aid to risk assessment. This information is available free of charge on the Internet (www.gisbau.de).

5
Résumé
Dans de nombreuses branches, on utilise des machines et appareils électroportatifs pour usiner des matériaux minéraux comme le grès artificiel ou silico-calcaire. Ces opérations peuvent dégager des poussières minérales. Les employés sont en partie exposés à de fortes émissions.
Alors que le marché propose depuis longtemps des systèmes d'usinage (dispositifs de dépoussiérage de machines et dépoussiéreurs mobiles) réduisant l'émission de poussiè-res, l'efficacité réelle de ces équipements dans la pratique reste peu connue. Aussi est-il urgent d'obtenir des informations fiables à ce sujet.
Pour déterminer le degré d'efficacité en matière d'absorption de poussières des systèmes d'usinage commercialisés aujourd'hui, un projet de recherche axé sur la pratique et pa-tronné par la confédération allemande des caisses de prévoyance contre les accidents (HVBG) a été mené en commun (fédération allemande de l'industrie électrotechnique et électronique (ZVEI) et caisses de prévoyance contre les accidents). Cette étude a porté sur environ 100 systèmes disponibles sur le marché.
Les systèmes ont été classés dans diverses catégories de machines, comme par exemple les tronçonneuses, fraises à entailler les murs, ponceuses excentriques ou fraiseuses de crépis, et examinés à l'appui de critères identiques au sein d'un groupe. A l'intérieur d'une chambre d'essai spéciale, les équipements d'usinage ont été testés dans des conditions d'utilisation proches de la pratique.
Les essais accomplis dans cette chambre ont montré qu'il est possible d'atteindre dans la pratique des niveaux d'émission de poussières nettement inférieurs à ceux observés au-jourd'hui et ce, pour de nombreuses catégories de machines. Dans aucun cas, le matériel ajusté n'a fait apparaître des concentrations du même ordre de grandeur, ni même ap-proximativement aussi fortes, que celles relevées lors de mesures sur des chantiers où l'on utilise des systèmes non adaptés ou sans aspiration.
Des informations sur les systèmes d'usinage étudiés dans le cadre du projet de recherche sont à présent disponibles comme aide à l'évaluation des risques et peuvent être consul-tées librement sur le site Internet www.gisbau.de.
6
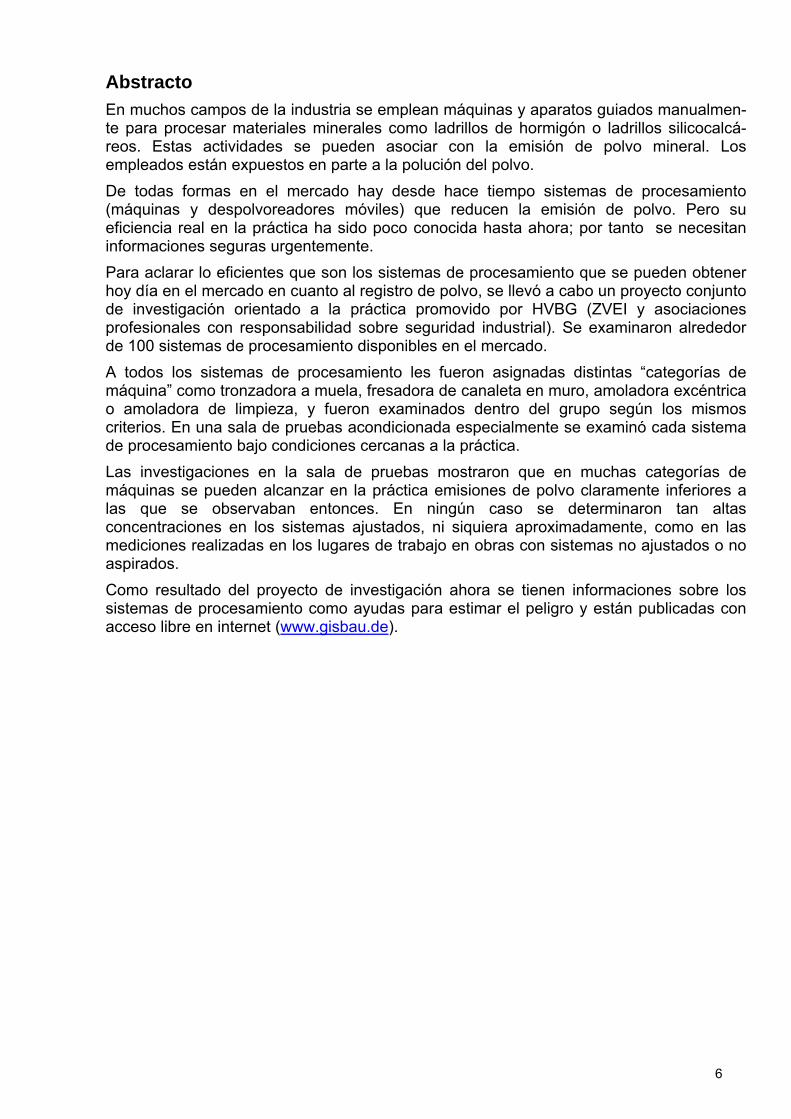
Abstracto
En muchos campos de la industria se emplean máquinas y aparatos guiados manualmen-te para procesar materiales minerales como ladrillos de hormigón o ladrillos silicocalcá-reos. Estas actividades se pueden asociar con la emisión de polvo mineral. Los empleados están expuestos en parte a la polución del polvo.
De todas formas en el mercado hay desde hace tiempo sistemas de procesamiento (máquinas y despolvoreadores móviles) que reducen la emisión de polvo. Pero su eficiencia real en la práctica ha sido poco conocida hasta ahora; por tanto se necesitan informaciones seguras urgentemente.
Para aclarar lo eficientes que son los sistemas de procesamiento que se pueden obtener hoy día en el mercado en cuanto al registro de polvo, se llevó a cabo un proyecto conjunto de investigación orientado a la práctica promovido por HVBG (ZVEI y asociaciones profesionales con responsabilidad sobre seguridad industrial). Se examinaron alrededor de 100 sistemas de procesamiento disponibles en el mercado.
A todos los sistemas de procesamiento les fueron asignadas distintas “categorías de máquina” como tronzadora a muela, fresadora de canaleta en muro, amoladora excéntrica o amoladora de limpieza, y fueron examinados dentro del grupo según los mismos criterios. En una sala de pruebas acondicionada especialmente se examinó cada sistema de procesamiento bajo condiciones cercanas a la práctica.
Las investigaciones en la sala de pruebas mostraron que en muchas categorías de máquinas se pueden alcanzar en la práctica emisiones de polvo claramente inferiores a las que se observaban entonces. En ningún caso se determinaron tan altas concentraciones en los sistemas ajustados, ni siquiera aproximadamente, como en las mediciones realizadas en los lugares de trabajo en obras con sistemas no ajustados o no aspirados.
Como resultado del proyecto de investigación ahora se tienen informaciones sobre los sistemas de procesamiento como ayudas para estimar el peligro y están publicadas con acceso libre en internet (www.gisbau.de).

7
Index
Acknowledgements..........................................................................................................................................1
Kurzfassung......................................................................................................................................................3
Abstract .............................................................................................................................................................4
Résumé..............................................................................................................................................................5
Abstracto...........................................................................................................................................................6
Abbreviations and denominations ...............................................................................................................10
1. INTRODUCTION ....................................................................................................... 12
2. PROBLEMS – TARGETS ......................................................................................... 12
3. LEGAL SITUATION .................................................................................................. 13
3.1 Mineral dust .......................................................................................................................................13
3.2 A-dust and E-dust..............................................................................................................................13
3.3 Silica dust...........................................................................................................................................13
3.4 Ordinance of Hazardous Substances..............................................................................................13
3.5 Tracing background information and hazard evaluation ..............................................................14
3.6 BGR 217 – Mineral dust ....................................................................................................................14
4. APPROACH AND IDEA OF PROJECT .................................................................... 15
4.1 State of knowledge before starting the project ..............................................................................15
4.2 Idea of project ....................................................................................................................................15
4.3 Pre-testing for feasibility ..................................................................................................................15
5. CARRYING OUT THE TEST..................................................................................... 16
5.1 Test methods .....................................................................................................................................16
5.2 Test bench setup ...............................................................................................................................16
5.3 Test room ...........................................................................................................................................16
5.4 Sampling devices ..............................................................................................................................20 5.4.1 Sampling adherent on person.............................................................................................................20 5.4.2 Stationary sampling.............................................................................................................................22 5.4.3 Accompanying of measurements by PIMEX-recording ......................................................................23 5.4.4 Detection limits....................................................................................................................................26
5.5. Measuring uncertainties in the systems.........................................................................................27
5.6 Duration of exposures during test and in practice........................................................................27
5.7 Test criteria ........................................................................................................................................27

8
5.8 Operation guidelines........................................................................................................................27
5.9 Stock listing of all power tool systems and accessories..............................................................27
5.10 Determination of seized resp. cut mass .........................................................................................28
6. RESULTS OF RESEARCHES .................................................................................. 29
6.0 General concept about presentation and evaluation of measured values..................................29
6.1 Wall chasers.......................................................................................................................................30 6.1.1 Test criteria .........................................................................................................................................31 6.1.2 Carrying out the test............................................................................................................................33 6.1.3 Measured data analysis and evaluation of wall chasers.....................................................................34 6.1.4 Additional tests....................................................................................................................................45 6.1.5 Conclusion ..........................................................................................................................................47
6.2 Concrete grinders .............................................................................................................................47 6.2.1 Test criteria .........................................................................................................................................47 6.2.2 Carrying out the test............................................................................................................................48 6.2.3 Analysis of measured values and evaluation of concrete grinders.....................................................49 6.2.4 Additional tests....................................................................................................................................55 6.2.5 Conclusion ..........................................................................................................................................56
6.3 Diamond cutters ................................................................................................................................57 6.3.1 Test criteria .........................................................................................................................................57 6.3.2 Carrying out the test............................................................................................................................58 6.3.3 Analysis of measured values and evaluation of diamond cutters.......................................................59 6.3.4 Additional tests....................................................................................................................................66 6.3.5 Conclusion ..........................................................................................................................................68
6.4 Plaster milling machines ..................................................................................................................69 6.4.1 Test criteria .........................................................................................................................................69 6.4.2 Carrying out the test............................................................................................................................70 6.4.3 Analysis of measured values and evaluation of plaster milling machines ..........................................70 6.4.4 Additional tests....................................................................................................................................76 6.4.5 Conclusion ..........................................................................................................................................77
6.5 Orbital and eccentric sanders..........................................................................................................78 6.5.1 Test criteria..........................................................................................................................................78 6.5.2 Carrying out the test............................................................................................................................79 6.5.3 Analysis of measured values and evaluation of orbital and eccentric sanders ..................................80 6.5.4 Additional tests with orbital and eccentric sanders .............................................................................91 6.5.5 Conclusion ..........................................................................................................................................92
6.6 Other tools used on building sites ..................................................................................................93 6.6.1 Concrete milling cutter and bush hammers ........................................................................................93 6.6.2 Rotary hammer and diamond drill (dry process).................................................................................94
7. EVALUATION OF RESULTS.................................................................................... 98
7.1 General evaluation of all examined categories ..............................................................................98 7.1.1 Scatter range of individual measured values......................................................................................98
7.2 Measurements in practice at building sites..................................................................................100
7.3 Influencing factors on dust emission ...........................................................................................102 7.3.1 Seizing element (style and size of extraction hood etc.)...................................................................104 7.3.2 Mobile dust removing unit .................................................................................................................106 7.3.3 PIMEX-records (observations)..........................................................................................................107
7.4 Comparing different machine categories .....................................................................................109

9
8 CONCLUSION AND OUTLOOK ............................................................................. 113
9. LITERATURE (GERMAN)....................................................................................... 115
Appendix .......................................................................................................................................................116 Chart A 1: overview of all measured values...............................................................................................117 Support for the hazard evaluation Type I and II using the example of wall chasers .................................122 figures 7.1.2 - 1 up to 7.1.2 - 3 for differences of samples adherent on person and stationary sampling.124 figures 7.4 – 5 up to 7.4 – 7 for scatter ranges of values...........................................................................127
Figure index ..................................................................................................................................................129
Chart index....................................................................................................................................................131

10
Abbreviations and denominations
Formula symbols unit Description
b m Breadth, width
C mg m-3 Concentration
E - Emission rate
h m Height
l m Length
s m Distance
E - Capturing rate
σ % Standard deviation
Indices
E Emission, emitted
E Adjusted
ER Covered
ges Overall
max Maximum
min Minimum
mind At least
mittl Average
rel Relative
zus Altogether
Abbreviations, definitions
AGS Hazardous substances committee
AGW Workplace limit
A-dust Respirable dust fraction
app. approximately
Power tool system Combination of hand-operated tool and mobile dust removing unit
Detection limit Minimal concentration for analytical determination of a substanceusing a certain procedure (quantitative assay), see also NWG
BG BAU Professional Association of Construction
BG FE Professional Association of Precision Mechanics and Electronics
BGIA Institute of Works Safety belonging to Germanys‘ professional as-sociations center
BGMG Measuring system for hazardous substances, run by Germanys‘Professional Associations Center

11
BGR Professional Society Regulations for Health and Safety at Work
resp. Respectively
E-dust inhalable dust fraction
Kat/cat Category, on some charts spelt KAT (German layout)
poss possibly
GefStoffV Ordinance of Hazardous Substances
GISBAU Information System of Hazardous Substances, given by Profes-sional Society of Construction Industry
Detection limit Minimal concentration for detecting (analytically)
NWG Detection limit, used as abbreviation
Tab. Chart
TRGS Technical Regulation for Hazardous Substances
e.g. for example
ZVEI German Electrical and Electronic Manufacturers Association

12
1. Introduction
In many areas and industry branches, the use of hand-operated power tools and devices for work on mineral-based materials is of major importance. On these jobs, dust emissions are unwanted but hard-to-avoid side effects.
The use of these power tool systems might cause stress to the airways by released dust. Especially the construction industry is traditionally affected by these means of stress.
With dust release there is a difference between dust-creating procedures (e.g. creating of abrasive dust) and dust-whirling procedures (e. g. whirling dust-layers). Both ways of dust-releasing are important and tightly connected (as far as this study is concerned).
Every kind of dust created at work and not instantly taken away from its place of origin might cause stress to employees if whirled around as a layer of dust, even if the work car-ried out is not dust-creating itself.
Therefore, efficient dust-seizing reduces stress on employees in two ways: Firstly, directly by lowering emissions while working with materials; secondly, by reducing or generally stopping dust-layers from getting whirled around, a basic form of stress mostly present on building sites.
2. Problems – targets
In the course of setting a general dust limit and during a discussion about evaluation of sil-ica dust it was considered as a fact that hand-operated machines for work on mineral ma-terials are rarely used as complete systems (e.g. they are used without mobile dust remov-ing units offered by the manufacturer). Therefore employees are partially exposed to high dust emissions.
The problem itself has been renowned for years without any decent improvements having been made in practice. The cause is not a lack of will from the manufacturers, who, in fact, have already made efforts concerning this matter. Power tool systems already on the mar-ket were rarely used in practice as the noxious danger from the dust was underestimated and any kind of consciousness from the users concerning this matter did not exist.
Up to the end of 2004, Germany was lacking any kind of legal target for machines and tool users as far as dust seizing was concerned. From January 1st 2005 onwards, a new Ordi-nance of Hazardous Substances became valid (GefStoffV [1]). Apart from the compulsory hazard evaluation (for work with hazardous substances) requested by the Labour Protec-tion Act, appendix III no. 2 „particulate hazardous substances“ put the requirements for works with exposure to dust in concrete terms.
This means, the employer has to issue a hazard evaluation before hand-operated ma-chines for work on mineral material may be used. Apart from this, according to appendix III, No 2 (Ordinance of Hazardous Substances) only machines and tools equipped with ef-fective dust extraction, according to state-of-the-art technology, may be used.
In order to specify appropriate and effective means of protections within the framework of the hazard evaluation, the contractor, in fact the true recipient of the ordinance, needs in-formation about the quantity of dust exposure at the workplace. Usually, this information do not exist in firms and companies.
On the other hand, there hardly existed studies about the efficiency of dust extraction on current hand-operated systems for working on mineral materials. Also, there was no sys-tematic overview on dust emissions from hand-operated systems to give any idea about present emissions.

13
The present survey forms the basis to improve this situation.
On the basis of determined data essential information about expected exposures for employers can be worked out. This information is important to figure out expected dust exposure for hazard evaluations.
Simultaneously, results of this study record the entire compilation of today’s dust emissions with a range of current hand-operated power tool systems.
3. Legal Situation
3.1 Mineral dust
Mineral dust is a dust or a mixture of dust, generated from treatment of naturally-occurring minerals and rocks or during work with certain substances or products made of the former.
Mineral dust is released during work on mineral substances and is usually present as a mixture of different grain sizes. If the source material contains crystalline silicon dioxide, even respirable quartz fine dust may emerge.
3.2 A-dust and E-dust
Dust itself is a dispensed distribution of solid substances in air, arising from mechanical actions or by raising dust in the air. There are differences between respirable (A-fraction, A-dust; formerly: fine dust) and inhalable (E-fraction; E-dust; formerly: comprehensive dust) dust fractions. Inhalable defines the part of dust within breathing region which can be absorbed by respiratory tracts. The respirable dust fraction consists of dust particles which may reach alveoli and bronchioles.
However, the general dust limit still applies to dust showing no cancer-, allergy-producing or toxic effect: It is 3 mg/m³ (A-dust) and 10 mg/m³ (E-dust) with exceed-ing factor 2 according to TRGS 900/date January /2006 [2].
3.3 Silica dust
Silica dust is the respirable dust fraction of crystalline silicon dioxide. For a long time, the annual average rate of 0.15 mg/m³ was considered as limit for air at work places.
In July 2005, a re-evaluation of work and processes at which employees are exposed to respirable silica dust to cancer-producing category 1 has been made for the TRGS 906 di-rectory of cancer-generating occupations or processes [3]. In consequence and referring to the new Ordinance of Hazardous Substances 2005 the former limit was then rejected.
3.4 Ordinance of Hazardous Substances
On January 1st, 2005, the new Ordinance of Hazardous Substances incorporating sub-stantial changes in practice became valid. Apart from general regulations for work with hazardous substances the Ordinance contains in appendix III No. 2 "particle-shaped ha-zardous substances“ special regulations for operations with exposure to any kind of res-pirable dust.
In fact, these supplementary precautions outline a tightening of all former requirements for work with dust and represent considerable effects for daily work. Especially for treatment of mineral material requirements yet unfamiliar to basic regulations now have to be met.

14
According to the Ordinance of Hazardous Substances, appendix III, No. 2.3, all power tools and devices have to be chosen and used in way to produce as little dust as possible. Dust-emitting equipment, power tools and devices have to be provided with an efficient, state-of-the-art extraction if dust release is not prevented by any other means.
These and any further liabilities cannot be put into practice without using effectively ex-tracted power tool systems. Apart from this, the ordinance requires evidence of sufficient effectiveness for all dust-eliminating or seizing devices during initial use.
However, there are no real prescriptions from ordinance authorities about any outlines of these proofs nor do any decent requirement exist. Due to this no evidences could yet be given for use of systems for work on mineral materials.
This is where the research project begins. Amongst other things it does its best to exem-plarily provide necessary evidence for selected systems.
3.5 Tracing background information and hazard evaluation
During work with mineral material it is almost certain that noxious mineral dust will appear in the air of the work place. Therefore employees fulfill tasks according to Ordinance of Hazardous Substances (GefStoffV), par 7, subpar. 1.
The employer has to ascertain all health and safety risks for employees by making a ha-zard evaluation.
Within this hazard evaluation for work with mineral material using power tool systems the employer has to judge the dust risks and needs to take the following aspects into account:
The dangerous characteristics of released hazardous substances (A-dust, E-dust, si-lica dust (if applicable)
Particularly extent, kind and duration of exposure
Working conditions and procedures, including means of production and hazardous substances including dust layers
Limit values at workplace
Efficiency of precautionary measures already carried out or still to be adopted
The employer must not start work (treating mineral material) until the hazard evaluation has been carried out and the required protective measures have been taken.
Before work on mineral construction materials may commence it needs to be examined if a change of working procedure or the use of a low-emission power tool system may prevent or reduce the appearance of dust.
Therefore, power tool systems have to be chosen by the designated practice and to be handled according to the manufacturers‘ guidelines in a way to release as little dust as possible. This requires beforehand the proper evaluation of the dust emission properties of the power tool systems used and their careful handling during operation. Only systems with an efficient extraction are allowed to be operated.
3.6 BGR 217 – Mineral dust
The professional society’s' regulations for security and health at work are first and fore-most aimed at the employer. These shall help him execute his responsibilities like occupa-tional safety regulations and/or accident prevention rules. Furthermore, they act as a guideline to prevent accidents, occupational diseases and work-related health dangers.
15
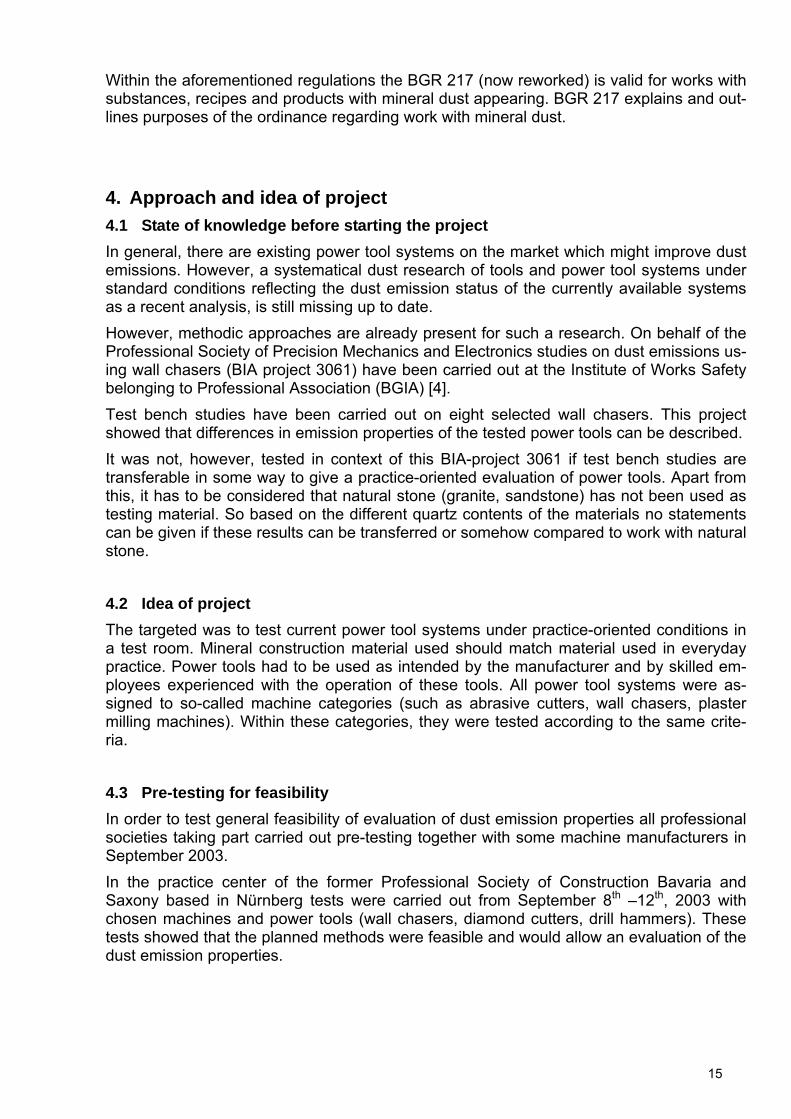
Within the aforementioned regulations the BGR 217 (now reworked) is valid for works with substances, recipes and products with mineral dust appearing. BGR 217 explains and out-lines purposes of the ordinance regarding work with mineral dust.
4. Approach and idea of project
4.1 State of knowledge before starting the project
In general, there are existing power tool systems on the market which might improve dust emissions. However, a systematical dust research of tools and power tool systems under standard conditions reflecting the dust emission status of the currently available systems as a recent analysis, is still missing up to date.
However, methodic approaches are already present for such a research. On behalf of the Professional Society of Precision Mechanics and Electronics studies on dust emissions us-ing wall chasers (BIA project 3061) have been carried out at the Institute of Works Safety belonging to Professional Association (BGIA) [4].
Test bench studies have been carried out on eight selected wall chasers. This project showed that differences in emission properties of the tested power tools can be described.
It was not, however, tested in context of this BIA-project 3061 if test bench studies are transferable in some way to give a practice-oriented evaluation of power tools. Apart from this, it has to be considered that natural stone (granite, sandstone) has not been used as testing material. So based on the different quartz contents of the materials no statements can be given if these results can be transferred or somehow compared to work with natural stone.
4.2 Idea of project
The targeted was to test current power tool systems under practice-oriented conditions in a test room. Mineral construction material used should match material used in everyday practice. Power tools had to be used as intended by the manufacturer and by skilled em-ployees experienced with the operation of these tools. All power tool systems were as-signed to so-called machine categories (such as abrasive cutters, wall chasers, plaster milling machines). Within these categories, they were tested according to the same crite-ria.
4.3 Pre-testing for feasibility
In order to test general feasibility of evaluation of dust emission properties all professional societies taking part carried out pre-testing together with some machine manufacturers in September 2003.
In the practice center of the former Professional Society of Construction Bavaria and Saxony based in Nürnberg tests were carried out from September 8th –12th, 2003 with chosen machines and power tools (wall chasers, diamond cutters, drill hammers). These tests showed that the planned methods were feasible and would allow an evaluation of the dust emission properties.

16
5. Carrying out the test
5.1 Test methods
Power tool systems provided by the manufacturers are used under conditions of practice in a test room and are operated as intended. At the same time dust emission is measured indirectly as dust concentration in the air at the workplace. Three measurements are car-ried out for statistic validation.
A purpose-built room inside of the Bavarian Bau Akademie at Feuchtwangen is used as test room. For operating the machines and devices employees familiar with the application of the particular machine (i.e. an electrician for testing wall chasers) were appointed.
Sampling (measurement and assessment) was carried out by measurement engineers of the Associated Measurement Systems for Hazardous Substances (BGMG)[5]. Before-hand, they were made thoroughly familiar with conditions and circumstances to prevent mistakes or unequal fringe conditions during sampling. The process of dust sampling is done according to a standard BGIA-defined process.
Analysis of samples is carried out by BGIA, evaluation is also carried out according to standard methods at the BGIA. Score and interpretation of particular measurements are based on the BGIA analysis report.
5.2 Test bench setup
Significant basis of this dust survey is the fact that all tests were carried out under compa-rable conditions. In order to obtain reproducible results to compare power tools and/or sys-tems only a survey on a test bench or in a test room was taken into consideration. With measurements taken at a workplace environmental impacts like air change rates, room sizes or changes in material mixtures can seldom be eliminated sufficiently.
However, conditions of use have to be as close as possible to those in practice. Therefore a special test room was prepared and used for all tests inside the Bavarian BauAkademie at Feuchtwangen. Inside this test room all the different power tool systems were tested with materials under practice-like conditions.
5.3 Test room
The facility of the test room is an existent hall (works hall 17; formerly wash hall; length/width/height: 14 m/6.7 m/4.3 m) ini-tially divided with a separating wall into the basic test room itself and a vestibule (ac-commodation of metrology / storage room).
A double-winged (Hörmann MZ-door D45-2; 2250 x 2250 mm) door acts as entrance into the test room (length/width/height: 6.9 m/6.7 m/4.3 m). Two windows (650 x 750 mm) situated on either side of the door give enough visibility between test room and vestibule. Existing heater tubes have been rearranged or covered up to minimize the area of possible dust layers and to guarantee quick cleaning of the room.
fig. 5.3 - 1 Hall 17 before its transformation into
test room

17
fig. 5.3 - 2 Hall 17 before transformation
fig. 5.3 - 3 Hall 17 after its transformation with vestibule in the front, test room in the back
Material contact area
The typical construction material for treatment (lime sandstone shaped bodies, concrete blocks, dry construction boards etc.) were either vertically (A-support) or horizontally (rack) mounted.
For holding the material for ver-tical treatment (e.g. wall chaser: grinding down dry construction boards) an A-support (sloping rack) in size (H= 2000 mm; L= 4000 mm; B= 1000 mm); manu-facturer: Max Bögl. Stahl -und Anlagenbau GmbH & Co) was used.
fig. 5.3 - 4 A-support for material reception in test room

18
fig. 5.3 - 5 sketch of the A-support
fig. 5.3 - 6 sketch of the A-support
For storing and supporting of pur-pose-made blocks and casts weighing up to 75 kg a pole-mounted slewing-drive GEWA-TYP US with chain pulley block was in-stalled in the test room.
For vertical treatment of material (e.g. cutting concrete blocks) a rack with support in an ergonomic work height (900 mm) was neces-sary.
fig. 5.3 - 7 rack with support for material treatment

19
Test room ventilation
During dust emission measurements all doors and windows were basically kept shut and air cleaning switched off. Ventilation from windows and doors was not possible during the tests.
For precautional reasons the machine-operator consequently wore breathing pro-tection during tests although this had not been necessary in many cases, as was found out later.
After each test the room was thoroughly ven-tilated. For this, next to the windows already in existence two extra windows were fitted in the upper part of the hall.
By mounting two high-performance ERMA-TOR A 100-ventilators on each side quick air cleaning could be obtained even with the door fully closed except for background air concentration.
Air sucked in with the window open and the door closed was redirected outside by using air hoses (d = 160 mm).
fig. 5.3 - 8 One of the two high-performance
ventilators
For determination of the background air concentration (e. g. runtime of ventilation) a stray light measuring device (TM digital, made by Hund) was used. Ventilators were switched off as soon as the stray light measuring device read normal background concentration/outer air rate (rate app. 0.01-0.02 units).
fig. 5.3 - 9 TM-Digital mounted on pole fig. 5.3 - 10 TM-Digital

20
Data given by the digital TM were addi-tionally recorded as concentration run during the complete test by a curve plot-ter (Philips PM 8110 x-/t-recorder; print-ing rate 0.5 cm/minute) on paper.
In order to measure the basic concentra-tion inside the room the TM digital was placed on a stand in a corner of the test room, far away from the workplace.
fig. 5.3 - 11 Philips PM 8118 curve plotter
5.4 Sampling devices
During works with different power tools concentration of respirable (A-dust) and inhalable (E-dust) dust fractions were determined. Additionally silica dust concentration was defined from the respirable dust remnants inside the filter.
Measurements were carried out stationary as well as adherent on person. The position of the stationary sampling unit has been marked in the room and was kept throughout the tests with each machine category. The distance to the workplace itself was app. 1.50 me-tres. Chart 5.4 – 1 gives a summary of all the applied sampling- and analysis procedures of the BGIA.
Chart 5.4 - 1 Key figures of sampling- and analysis procedures from BGIA, taken from BGIA-workfile[6]
Sampling system Type of sampling base
Analysis key figure
Adherent on person
E-dust 235 305 7284
A-dust | silica dust 234 210 6068 | 8522
Respicon: E- | A- | silica dust
796
280
7284 | 6068 | 8522
Stationary
E-dust 228 214 7284
A-dust | silica dust 227 214 6068 | 8522
5.4.1 Sampling adherent on person
A-dust and quartz (crystalline silicon dioxide)
The respirable dust fraction was measured adherent on person with the PAS-pump FSP-10 sampling system.
With the FSP-10 sampling system a definite air volume of 10 l/min is drawn by a pre-separator (cyclone). The respirable dust fraction is then deposited on a cellulose nitrate membrane filter (Pw 8 µm; 37 mm).
Dust weight is then defined by difference weighing (resolution of scale: 0.3 mg). Analysis of samples is taken at BGIA by weighing. Mass fraction of silica dust is determined at the BGIA by infrared spectroscopy (IRS) and X-ray diffraction (XRD).

21
E-dust
The inhalable dust fraction was seized adherent on person with the PAS-pump GSP-10 sampling system.
With the GSP-10 sampling system a definite air volume of 10 l/min is drawn. The inhalable dust fraction is deposited on a fiber glass filter (Binderfrei BF, 37 mm). Dust weight is then defined by difference weighing. For weighing of fiber glass filters with a diameter of 37 mm a reproducibility of 0.3 mg is necessary. Analysis of samples was made at BGIA by weigh-ing.
RESPICON TM: Dust collection- and dust measuring instrument
The dust collection instrument RESPICON TM allows gathering of respirable (A-dust), tho-racic (not considered) and inhalable fractions (E-dust). It also reads and displays the con-centration size of each fraction.
The procedure used by the measuring instrument is a combination from inertia classifica-tion and accumulation of coarse particles by virtual implication, filter collection and stray light photometry.
Using a two-step, virtual impactor an aerodynamic division of the drawn dust into three size fractions can be obtained. In RESPICON TM there are two division- and enhance-ment steps connected in series. The accompanying dust fractions are deposited on filters and then send to BGIA for weighing.
fig. 5.4.1 - 1 RESPICON and its three stepped collection system
Three identical stray light photometers also seize each relevant progress of the concentra-tion. This can be recorded by data logger or it can be made visible directly (e.g. using the PIMEX system).

22
fig. 5.4.1 - 2 GSP and 2x FSP-10 as well as RESPICON adherent on person
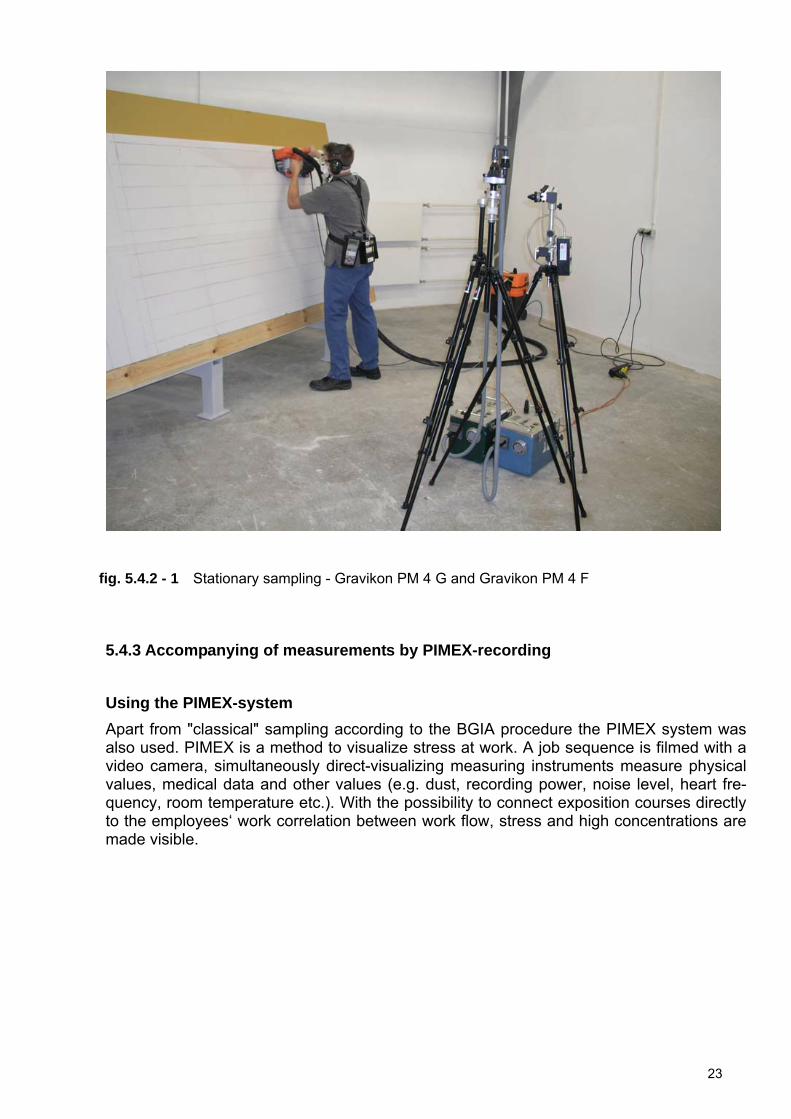
5.4.2 Stationary sampling
A-dust and quartz (crystalline silicon dioxide)
The respirable dust fraction was measured stationary inside the test room with the Gravikon PM 4 F sampling system. With the PM 4 F sampling system a definite air volume of 4 m³/h is drawn by a pre-separator (cyclone). The respirable dust fraction is then depos-ited on a cellulose nitrate membrane filter (Pw 8 µm; 70 mm).
Dust weight is then defined by difference weighing (reproducibility of scale: 0.6 mg). Analysis of samples is taken at BGIA by weighing. Mass fraction of silica dust is deter-mined at BGIA by infrared spectroscopy (IRS) and X-ray diffraction (XRD).
E-dust
The inhalable dust fraction was measured stationary with the Gravikon PM 4 G sampling system.
With the PM 4 G sampling system a definite air volume of 4 m³/h is drawn. The inhalable dust fraction is deposited on a fiber glass filter (Binderfrei BF 70mm). Dust weight is then defined by difference weighing. For weighing of fiber glass filters (70mm in diameter) a re-producibility of 0.3 mg is necessary. Analysis of samples was taken at BGIA by weighing.
23
fig. 5.4.2 - 1 Stationary sampling - Gravikon PM 4 G and Gravikon PM 4 F
5.4.3 Accompanying of measurements by PIMEX-recording
Using the PIMEX-system
Apart from "classical" sampling according to the BGIA procedure the PIMEX system was also used. PIMEX is a method to visualize stress at work. A job sequence is filmed with a video camera, simultaneously direct-visualizing measuring instruments measure physical values, medical data and other values (e.g. dust, recording power, noise level, heart fre-quency, room temperature etc.). With the possibility to connect exposition courses directly to the employees‘ work correlation between work flow, stress and high concentrations are made visible.

24
fig. 5.4.3 - 1 principle of PIMEX-measurement (observation)
The PIMEX-method itself was developed in Sweden nearly three decades ago by Prof. Gunnar Rosén and Ing. Marie Andersson. Used for a research project it was further devel-oped by the „Allgemeine Unfallversicherungsanstalt“ (AUVA) in Vienna cooperating with the KOHS company and finally reached the market in the past few years. The use of the system by AUVA in Austria is well set up, a few systems are used in Germany, too.
The PIMEX system represents an effective and very helpful method for visualizing and documentating researches carried out on machinery.
This way any weak points on a power tool system (machine and mobile dust removing unit) may easily and clearly be reproduced later on. This again forms the basis for a later target-oriented evaluation. Apart from this, the visualization provides valuable hints for a dust optimization of systems by the manufacturer.
The transmission of picture information to the PIMEX-notebook necessitates the place-ment of a digital camera (Sony DCR-HC85E) on a tripod in the test room. Using a wide-angle lens (SONY VCL-MHGO7A) enables showing the complete workplace.
During the work inside the test room a partly high dust exposure in the air was expected. In order to secure permanent service of the electronical devices, especially the optical equipment, various measures were required. Using a rain cover (Ewa-Marine Regencape VC-M) proved to be an effective means of dust protection for the camera.

25
Due to a high data rate transmission of the video signal was carried out by firewire con-nection (IEEE1394). The necessary cable length of 10 m to reach the notebook outside the test room made a signal amplifier indis-pensable. Two cable parts, each with a length of 4.5 m, were used.
fig. 5.4.3 - 2 camera fitted with rain cover
For detection of mineral dust adherent on person a directly reading measuring instru-ment RESPICON made by Hund was used.
This device is a personal dust measuring system. It enables home-control and a direct judgment of the dust situation and emissions in the test room. Furthermore, it enables de-termination of three physiologic relevant dust fractions, according to DIN/EN 481 (e.g. res-pirable, thoracic and inhalable particles). During our project the thoracic fraction was not considered, as the industrial health and safety regulations only considers A- and E-dust.
fig. 5.4.3 - 3 Signal amplifier
Data transmission to the notebook was first carried out via cable (serial cable, length 15m), later a radio-controlled device (Bluetooth-technology) was used.
fig. 5.4.3 - 4 Bluetooth data logger and receiver on notebook
With the test-setup as described work inside the test room could be carried out at the same time as measurement (dust measurements) data were visualized and recorded. The test sequence of each machine or power tool was filmed while dust concentrations (A- and E-dust) were measured by direct-display measuring instruments. The complete test proce-dure is reproducible at any time and was recorded on CD or DVD. Direct identification of peak values during work can also be identified later on.
26
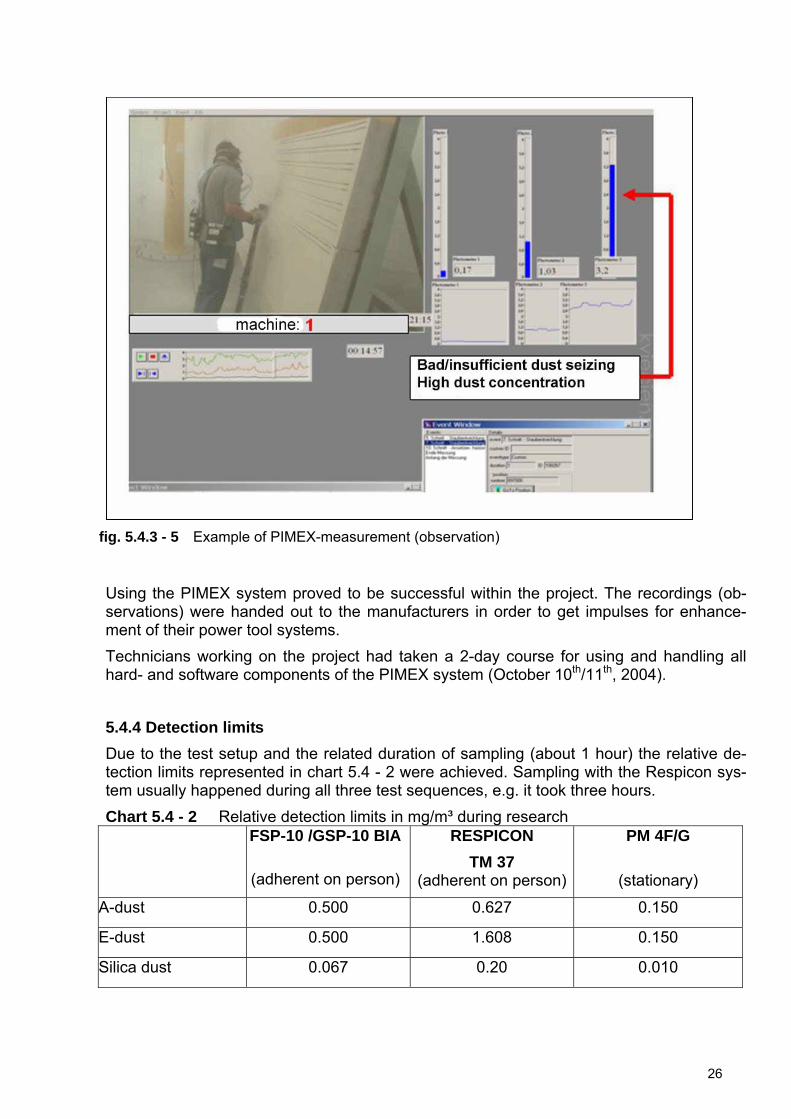
fig. 5.4.3 - 5 Example of PIMEX-measurement (observation)
Using the PIMEX system proved to be successful within the project. The recordings (ob-servations) were handed out to the manufacturers in order to get impulses for enhance-ment of their power tool systems.
Technicians working on the project had taken a 2-day course for using and handling all hard- and software components of the PIMEX system (October 10th/11th, 2004).
5.4.4 Detection limits
Due to the test setup and the related duration of sampling (about 1 hour) the relative de-tection limits represented in chart 5.4 - 2 were achieved. Sampling with the Respicon sys-tem usually happened during all three test sequences, e.g. it took three hours.
Chart 5.4 - 2 Relative detection limits in mg/m³ during research FSP-10 /GSP-10 BIA
(adherent on person)
RESPICON
TM 37 (adherent on person)
PM 4F/G
(stationary)
A-dust 0.500 0.627 0.150
E-dust 0.500 1.608 0.150
Silica dust 0.067 0.20 0.010

27
5.5. Measuring uncertainties in the systems
When measured values are presented it has to be considered that measuring uncertainties may, as integral faults summing up all possible systematic and accidental faults, may be up to 30 percent according to TRGS 402 No 3.7, par. 6. [7]
5.6 Duration of exposures during test and in practice
Due to the test setup the duration of exposure on employees (machine operator) during test sequences always is distinctively shorter than a usual 8 hour-shift. On average, dura-tion of tests was app. 60 minutes.
However, in practice the power tool systems are often used for a shorter time span, again depending on the machine category.
With this end in mind and the special determining factors of the test room (e.g. windows and doors closed, poor air change rate) the situation of exposure very often will match "worst-case" conditions.
As a result of the aforementioned shortened duration of exposure (distinctively shorter than an 8-hour shift) additional difficulties arise in respect of the dust samples.
Especially on power tool systems with low dust emission there are only very few dust lay-ers on the sample cover slip (membrane filter). These were partly close to the detection limit or even below.
5.7 Test criteria
Tests were carried out under condition as close as possible to practice. The choice of use-ful building material and criteria for each machine category was therefore a very important basic requirement within the project work. Only with due care for these basics realistic statements about dust emissions in practice may be gained.
Working out those criteria was carried out in teams with a view to stay as close to real ma-chine operating conditions as possible bearing in mind the practical possibilities in the test room. Criteria for each machine category are documented and part of the operational guidelines for the technicians in charge of control.
5.8 Operation guidelines
With the project size in mind technical care and control was distributed between few peo-ple taking samples. On site there were at least two employees working in technical ser-vices from various professional societies (BG BAU, BGFE) and the Institute for Works Safety belonging to the Professional Associations (BGIA). To make sure the „modus oper-andi“ (M.O.) was unified while performing tests and sampling for an operation guideline was issued for each machine category.
This operation guideline describes test performance (test criteria) and approach of sam-pling and measurements (tools, sample cover slip) within the project. It is compulsory for every technician working on the project.
5.9 Stock listing of all power tool systems and accessories
The success of testing power tool systems was significantly supported as the manufac-turer were prepared to give out their products and systems free of charge.

28
Collaboration and duties were fixed and made compulsory with a written cooperation agreement between the German Electrical and Electronics Manufacturers Association (ZVEI) and the Professional Society of Construction (BG BAU).
Choice of typical sought-after machines with high market value was carried out in close cooperation with the manufacturers and the ZVEI. Machines and systems were sent to GISBAU, Frankfurt am Main.
With the enormous number of systems and machines send in, the partly rough conditions of use and often compulsorily changing users (machine operators and technicians) a doubtless and thorough identification beforehand was pure necessity. This way accidental mix-ups of partly very similar and at a glance look-alike systems could be avoided.
Stock-listing of the systems (machine and mobile dust removing unit) including the acces-sories was first duty after reception. Data (Stock list/ser. No, manufacturer, machine type, name etc.) as well as (digital) images of machine and mobile dust removing unit were filed electronically. An ID-card was printed for each stock-listed part fitted into a laminated fob which itself was cable-tied to each relevant part of the power tool system.
Anonymized coding of power tool systems
Within the survey also prototypes were tested, which were still under development at the time these researches were carried out.
Therefore, survey results (measured values and evaluation) for each system are repre-sented in an anonymized way. Coding the machines was done by a combination of letters and numbers with the letter being a reference for the machine category (e.g. MF02 for wall chasers; ES03 for eccentric sanders etc.).
Analogically, mobile dust removing units provided or recommended by the machine manu-facturer were coded using letter/number combinations (e.g. E03). Nine times out of ten the manufacturer provided only a single dust removing unit per machine, which in terms was used and fitted to different machines. By this means anonymous codings for the tested systems are given, e.g. ES04-E03 or MF02a-E03. (If a machine or power tool was tested under different conditions, it was marked by additional small letters).
5.10 Determination of seized resp. cut mass
Right after testing the mass seized resp. cut mass was determined. This happened by cal-culation (e.g. with wall chasers using disc diameter, depth of immersion and cutting length).
In other cases seized mass was determined by differential weighing of treated material. Weighing the entire mobile dust removing unit proved to be a simple, practical procedure (as described in working guideline for technicians, after vacuum-cleaning dust layers from floor and material).
Weighing the workpieces and the mobile dust removing units was carried out with an elec-tronic precision scale (type: KERN DS 65 K1 – gram-precise up to 65 kg).

29
fig. 5.10 - 1 Kern DS 65 precision scale
fig. 5.10 - 2 weighing the mobile dust remov-ing unit
6. Results of researches 6.0 General concept about presentation and evaluation of measured values
This survey aimed for an up-to-date stock taking on dust emission conditions of current power tool systems.
On the one hand, the conclusion from the measurements should be provided to associated manufacturing companies via media from GISBAU (CD-ROM, Internet, brochures, etc.) as help- and guideline for optimized use. On the other hand manufacturers of the systems ob-tain valuable hints for development and improvement.
As an approach to transform the results into effective help for companies, coordinated guidelines were developed for hazard evaluation on work with the tested system.
Hazard evaluation is a requirement of the Labour Protection Act. It is put into terms in the Ordinance of Hazardous Substances relating to work with hazardous material. It has to be carried out by the employer (as general recipient of the ordinance). Due to the released dust during use of the tested power tool systems a hazard evaluation is necessary.
Within his own hazard evaluation the employer needs to ascertain the hazards at work and specify the means of protection. Without knowledge of the estimated exposure these measures cannot be determined appropriately, particularly if this incorporates extensive decisions such as wearing stressful breathing protection or carrying out preventive medical examination on employees.
According to the Ordinance of Hazardous Substances these measures, as a general rule, have to be carried out if the workplace limit (AGW) is exceeded. In Germany, there are lim-its regarding air at workplace for A-dust and E-dust fractions. However, for silica dust no

30
limit has been specified yet. Therefore, within this survey no evaluation of silica dust val-ues takes place.
As a criterion for operational-oriented evaluation of dust emitted by power tool systems the workplace limits (AGW) for A-dust and E-dust fraction amounting to 3 mg/m³ and 10 mg/m³ respectively were used.
For this it has to be considered measurements were taken under worst-case condi-tions in a single test room without natural ventilation. On building sites, these works are generally not carried out throughout the complete shift nor in the same room, at least not in (our current) test room size.
Duration of measurements is about 1 hour. In practice, these power tool systems are used for shorter intervals according to measurements taken on building sites. There-fore, short-term high pollution may be compensated with longer, non-polluted time spans in order to keep to the workplace limit.
There might still be a compliance with the limits for cases in which the systems measured values are close to the limit.
For each power tool system, initially a time-weighted average value for samples ad-herent on person was calculated for the usual three test sequences. This calculation was carried out for A-dust and E-dust dust fractions. The time-weighted average value was then compared to the workplace limit of the relevant dust fraction.
Exceedances (red) or compliances (green) of the workplace limit are presented in color for each power tool system within the relevant chart (evaluation of commercially available sys-tems) and their relevant chapters including the appendix.
In the next few chapters dealing with different device categories the measuring results are presented in diagrams for visualization.
Structured by serial numbers (lfd. Nr.) the measurements were assorted according to „as-cending numbers“, and that is how they appear in files. A-dust and E-dust fractions as well as silica dust are summarized under the collective term „dust types“.
According to the results (i.e. compliance of the limit value (AGW) of both dust fractions or if at least one fraction exceeds the limit a scheme for the hazard evaluation will follow suit.
These schemes for hazard evaluation provide substantial precautions for work with this machine operating system. If the limit is met type I of the schemes for hazard evaluation is used. Type II, on the other hand, is used if at least one of the time-weighted average val-ues exceeds the limit. It proved to be true that dust emission of the power tool system de-pend on the general conditions during work on the material.
With wall chasers and diamond grinders the setting of cutting depth is of vital importance. As cutting depth increases released dust mass also increases so requirements on dust removal subsequently rise. Therefore, in these cases different schemes of hazard evalua-tion were developed for each cutting depth category (type I and II).
6.1 Wall chasers
Wall chasers are hand-operated power tools used for heating and water installations to cut slots and grooves for laying electrical cables and pipes. These are devices with quick-rotating discs for cutting parallel grooves into masonry, or grooves are cleared by milling. In the process large amounts of dust are generated. Health hazards may occur due to the release of mineral dust which may, depending on the subsurface, incorporate quartz parti-cles.
31
Therefore, wall chasers are equipped with seizing elements and are generally used in combination with mobile dust removing units. Unfortunately, even today systems tuned by manufacturers are rarely used. Instead, often simply in-stock vacuum-cleaners are utilized.
6.1.1 Test criteria
Criteria for the dust test of wall chasers were worked out by a team on Jan. 1st, 2004 in Frankfurt/Main. Especially knowledge gained from BGIA-project 3061 (dust emission using wall chasers) as well as experiences during pre-testing in Nürnberg (Sep. 2003) were of great value for the team.
Classification of machines
Depending on machine output different cutting depths can be obtained. Tests with the power tool systems, 41 all in all (including revision tests), were divided into 4 cutting depth categories all listed in chart 6.1 – 1. Within the project, a machine working system stands for the combination of tool and the related mobile dust removing unit, both provided by the manufacturers. Power tool and dust removing unit are connected by an extraction tube.
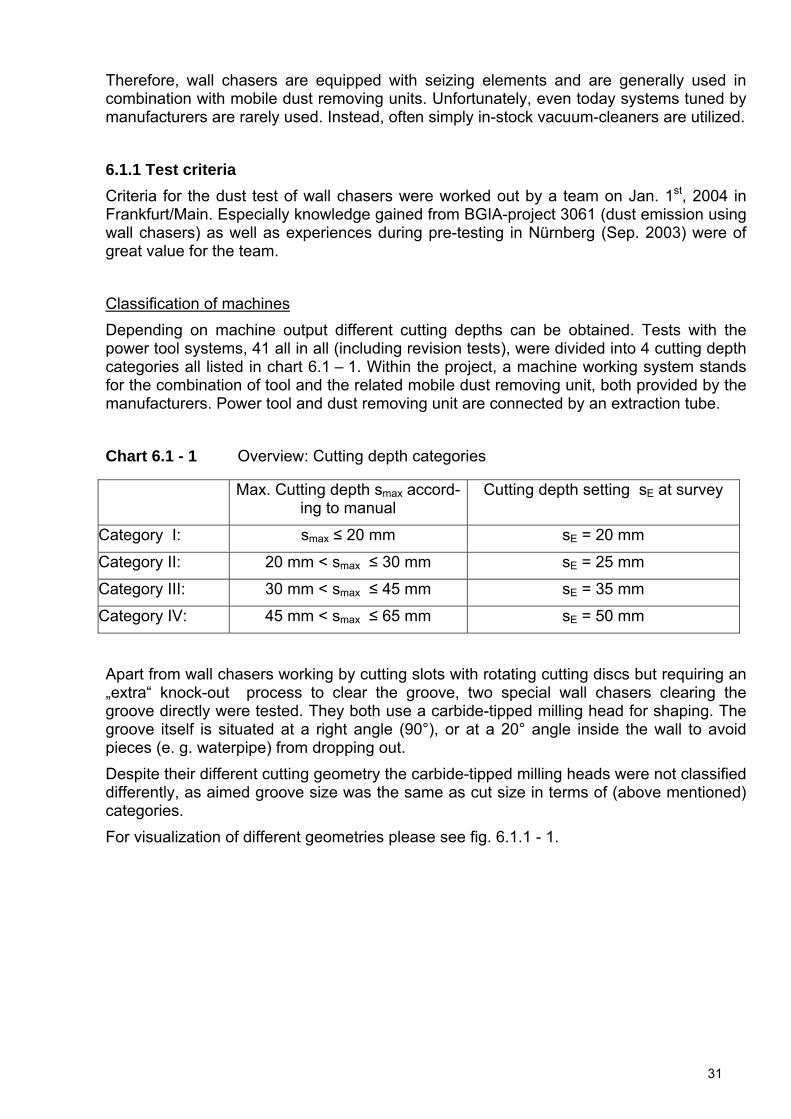
Chart 6.1 - 1 Overview: Cutting depth categories
Apart from wall chasers working by cutting slots with rotating cutting discs but requiring an „extra“ knock-out process to clear the groove, two special wall chasers clearing the groove directly were tested. They both use a carbide-tipped milling head for shaping. The groove itself is situated at a right angle (90°), or at a 20° angle inside the wall to avoid pieces (e. g. waterpipe) from dropping out.
Despite their different cutting geometry the carbide-tipped milling heads were not classified differently, as aimed groove size was the same as cut size in terms of (above mentioned) categories.
For visualization of different geometries please see fig. 6.1.1 - 1.
Max. Cutting depth smax accord-ing to manual
Cutting depth setting sE at survey
Category I: smax ≤ 20 mm sE = 20 mm
Category II: 20 mm < smax ≤ 30 mm sE = 25 mm
Category III: 30 mm < smax ≤ 45 mm sE = 35 mm
Category IV: 45 mm < smax ≤ 65 mm sE = 50 mm

32
fig. 6.1.1 - 1 Carbide tipped milling head for 20° groove (characteristic) and cutaway view of dia-
mond cutting discs
Power tool testing was carried out considering both cutting and milling depth divided in categories. A unified test depth was set for all machines of one category. It was recorded if cutting or milling process was carried out by pushing ("power tool operating = pushing") or pulling ("power tool operating = pulling ") of the relevant power tool.
Cutting/milling width (Distance of discs)
Due to technical reasons it was not possible to specify the distance of discs to an exact size for all machines. For that reason the cutting width of each machine was set slightly smaller than the actual test depth.
On groove-clearing machines the groove width was specified by the milling head geome-try.
Cutting discs and milling heads
Cutting discs optimized for the test material were provided by the manufacturers. As for the milling head masonry slut cutters, heads suitable for lime sand bricks were provided.
Cutting direction at test bench
In order to carry out the test sequence as close as possible to real-life conditions the slots were cut with changing cutting directions. Also common „building site“ conditions were considered. According to experience one third of the cuts are made in vertical and two thirds in horizontal direction.
Transferred to the test setup this means a test sequence consists of a combination of both cutting directions. Alongside a supporting stand (l = 4 m) cutting is first of all carried out horizontally for app. 2.5 m per cut. After this the cutting direction is changed, vertical cuts are made for 1.5 m per cut. The overall number of cuts then sums up to 1/3 vertical and 2/3 horizontal cuts.

33
Changing cutting direction
Changing over from horizontal to vertical cutting direction was carried out during sampling i.e. the measuring instruments and dust collecting unit stayed switched on, the employee stayed inside the test room.
Cutting width
To avoid suction of leakage air the side housing of the power tool must not protrude above already cut slot areas. Distances between the cuts are 100 mm (according to maximum width of the machines in use, as a complete covering of the cutting area must be guaran-teed.
Mineral material
Large-format (623x115x998 mm) lime stone slabs (KS-XL-PE 20-2,0) were chosen as suitable mineral testing material for testing the wall chasers.
Gross density of lime stone is 2,0 kg/dm³. Quartz contents of the material was app. 21 percent. 8 slabs were delivered on pallets and stored in a dry place. Usually 8 slabs of one pallet were used per test.
The groove-clearing wall chasers were tested on the above mentioned lime stone material and on cellular concrete on the second test day. Cellular concrete slabs represent the ma-terial on which the groove-clearing machines are commonly used. Therefore, the test wall was build up from small-format cellular concrete slabs (PPpl-06 (0,16) NF) (624 x 115 x 499 mm). Bulk density of these was 0.6 kg/dm³. These slabs were also delivered on pano-plies and stored in a dry place. 16 slabs of one pallet were used per test.
6.1.2 Carrying out the test
Working method For the test, the oblique A-support was equipped with 8 lime stone slabs forming a test wall (L = 4000 mm; H = 1300 mm) in the test room. Cutting distance and directions were marked with a pencil.
Prior to testing the machine operator acquaints himself with the power tool system (this of-ten happened on the day before testing, in the test room still to be cleaned).
Milling work was carried out alongside a previously marked line.
As a matter of routine the dust bag of the mobile dust removing unit was changed between the two milling sections. This was done by the technicians outdoors. During the change measuring instruments and dust removing units stay switched on i.e. the employee stays inside the test room.
After finishing the milling work the sampling instruments are switched off and their filters were removed. Sampling with RESPICON is carried out throughout all test sequences of one day.

34
fig. 6.1.2 - 1 Arrangement of the lime stone slabs on the A-support
As the lime stone slabs can be used from both sides, they were turned over after the first series of measurements. Later the test room floor, the seatings of the stand as well as all gaps and slots on the line stone were vacuum-cleaned.
During this time the test room is thoroughly ventilated. Purity of test room air is determined by the TM digital stray light measuring instrument, manufactured by Hund. The value measured has to match the value of the outside air (app. 0.01- 0.02 scale units).
Duration of sampling took at least one hour. Apart from the number of the cut-up stones, test setup and test run for the groove-clearing wall chasers were equivalent to the tests of those power tools equipped with cutting discs.
6.1.3 Measured data analysis and evaluation of wall chasers
Target of the wall chaser survey was a current stocktaking of dust emission properties of current power tool systems.
For the machine range of wall chasers 41 tests with different combinations (tool plus mo-bile dust removing unit) including test revisions were carried out. In general, the combina-tion of machine and dust removing unit recommended by the manufacturer was used. In individual cases some machines were tested under different conditions e.g. equipped with different dust removing units or at different cutting depths.
The overview (fig. 6.1.3 - 1 to 6.1.3 - 3) only presents current systems with combinations recommended by the manufacturers. (Date: 2004/2005).
Systems no longer or not yet available in the tested combination are specially marked in chart 6.1.3 - 2 (current = No). These systems were e.g. prototypes, derivatives from stock machines or changes in combination such as different dust removing units, the use of col-
35
lecting bags or different tube diameters. Test results for those non-current systems are partly presented in their own overview charts. With this approach the description of dust emission gets focused on those systems currently on the market and on their techniques.
Chart 6.1.3 - 1 presents an overview of overall number of measured values for dust types E-dust, A-dust and silica dust. It also gives a clue about the part of values which actually could be determined ("MW="), and those below detection limits ("<NWG"), subdivided in samples adherent on person or stationary samples.
The dimension of each detection limit is presented in the last two columns if values <NWG are present. With different sampling durations detection limits vary slightly. Each individual value is presented in the appendix, chart A1.
An explanation for the obvious discrepancy between shown values and those theoretically expected 123 (41 * 3) per dust type has to be given: The fact that not in all cases three in-dividual tests runs were carried out (e.g. due to extreme dust emission), also due to a bro-ken sample clip cover (in one case A-dust and silica dust were impossible to determine). With values below detection limit half of the limit was rated as measuring result.
It is noticeable that some test sequences (power tool systems MF05b-E02, MF19-E12, MF10-E04, MF06-E02, MF05a-E02 and MF20-E11) show remarkably high values. There-fore logarithmic scales are used. For comments to these extreme values please see be-low.
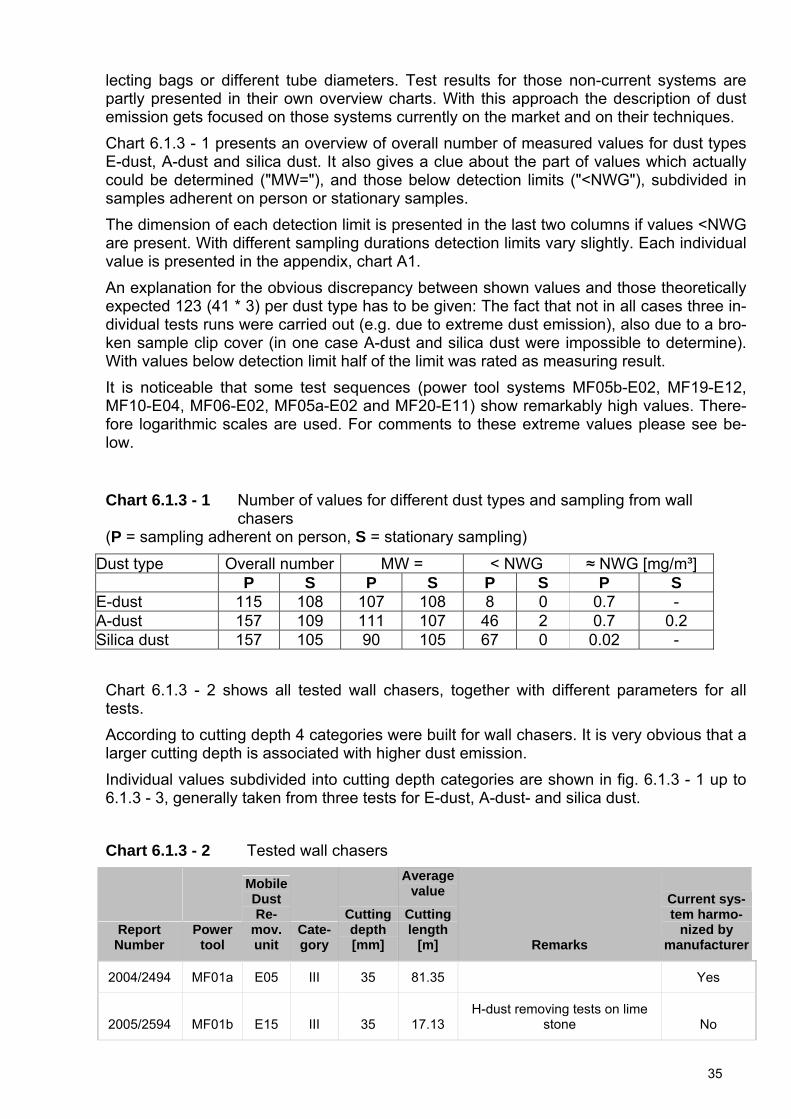
Chart 6.1.3 - 1 Number of values for different dust types and sampling from wall chasers (P = sampling adherent on person, S = stationary sampling)
Dust type Overall number MW = < NWG ≈ NWG [mg/m³] P S P S P S P S E-dust 115 108 107 108 8 0 0.7 - A-dust 157 109 111 107 46 2 0.7 0.2 Silica dust 157 105 90 105 67 0 0.02 -
Chart 6.1.3 - 2 shows all tested wall chasers, together with different parameters for all tests.
According to cutting depth 4 categories were built for wall chasers. It is very obvious that a larger cutting depth is associated with higher dust emission.
Individual values subdivided into cutting depth categories are shown in fig. 6.1.3 - 1 up to 6.1.3 - 3, generally taken from three tests for E-dust, A-dust- and silica dust.
Chart 6.1.3 - 2 Tested wall chasers
Report Number
Power tool
Mobile Dust Re-
mov. unit
Cate-gory
Cutting depth [mm]
Average value
Cutting length
[m] Remarks
Current sys-tem harmo-
nized by manufacturer
2004/2494 MF01a E05 III 35 81.35 Yes
2005/2594 MF01b E15 III 35 17.13 H-dust removing tests on lime
stone No

36
Report Number
Power tool
Mobile Dust Re-
mov. unit
Cate-gory
Cutting depth [mm]
Average value
Cutting length
[m] Remarks
Current sys-tem harmo-
nized by manufacturer
2004/2289 MF02a E06 IV 50 74.38 different cutting depth Yes
2004/2644 MF02b E06 II 22 81.87 different cutting depth Yes
2004/2650 MF02c E06 III 37 76.96 different cutting depth Yes
2004/2651 MF02d E06 II 27 82.66 different cutting depth Yes
2005/2261 MF02e E06 IV 50 73.8 Machine prototype with improved
extraction No
2005/2474 MF02f E06 IV 50 /35 36.31
Machine prototype with improved sealing, only 1 test carried out
with different cutting depth No
2004/2597 MF03 E04 II 25 91.26 Yes
2004/2495 MF04 E05 I 20 89.74 Yes
2004/2290 MF05a E02 III 33,5 85.79 Conventional configuration with
dust collection bag Yes
2004/2492A MF05b E02 III 32 62.68
Conventional configuration with-out dust collection bag, only 1 test
carried out No
2004/2996 MF05c E06 III 32 85.37
Wall chaser was tested with
different dust removing unit No
2005/2462 MF05d E02 III 33 73.8 Prototype of hood with modified
machine No
2005/2463 MF05e E02 III 35 65.05 Test with new dust collection bag Yes
2005/2464 MF05f E02 III 35 73.8 Dust removing unit without bag,
optimized adjustment No
2004/2492B MF05g E02 III 32 91.72
Conventional configuration with-out dust collection bag, only 1 test
carried out Yes
2004/2291 MF06 E02 II 25 93.14 Conventional configuration with
dust collection bag Yes
2005/1133 MF07a E16 III 35 35.01 H-dust removing tests with E 16
on lime stone No
2005/569 MF07b E14 III 31 80 H-dust removing tests with E 14
on lime stone No
2004/2491 MF07c E01 III 34 76.96 Yes
2004/2538 MF08 E09 II 25 90.56 Yes
2004/2517 MF09a E09 III 35 83.07 Conventional tube, d=27 mm Yes

37
Report Number
Power tool
Mobile Dust Re-
mov. unit
Cate-gory
Cutting depth [mm]
Average value
Cutting length
[m] Remarks
Current sys-tem harmo-
nized by manufacturer
2004/2906 MF09b E09 III 35 79.35 Large tube, d=35 mm Yes
2004/2596 MF10 E04 IV 51 69.49 Yes
2004/2512 MF11a E03 III 34,5 80.8 Yes
2005/2473 MF11b E03 III 35 76.89 Measuring repeated Yes
2004/2539 MF12 E03 II 24,5 92.2 Yes
2004/2995 MF13 E06 III 40 45.16
Different type of machine: ma-sonry groove is cleared com-
pletely, tested on cellular concrete Yes
2004/2595 MF14a E08 III 35 21.03
Different type of machine: ma-sonry groove is cleared com-pletely, tested on lime stone Yes
2004/2911 MF14b E08 III 33 44.92
Different type of machine: ma-sonry groove is cleared com-
pletely, tested on cellular concrete Yes
2004/2598 MF15a E07 III 36 80.77
Problem evolved on dust remov-ing unit during measuring. Solved
prior to 3rd test No
2005/2472 MF15b E07 III 36 67.89 Measuring repeated Yes
2005/2600 MF15c E15 III 35 16.63 H-dust removing unit tests on lime
stone, No
2004/2905 MF16 E07 III 36 77.67
Prototype/development of current machine, launch planned for end
of 2006 No
2004/2998 MF17 E12 II 24 91.96 Yes
2004/2997 MF18 E12 III 35 85.38 Yes
2004/2994 MF19 E12 IV 49 48.42 Due to high dust emission only 1
test was carried out Yes
2005/165 MF20 E11 III 35 83.2 Machine prototype No
2005/2601 MF21 E01 II 25 90 Machine modification: from abra-
sive cutter to wall chaser Yes
2005/2595 MF22 E20 III 35 19.17 Prototype of dust removing unit No

38
fig. 6.1.3 - 1 E-dust individual measured values for current wall chasers
fig. 6.1.3 - 2 A-dust individual measured values for current wall chasers

39
fig. 6.1.3 - 3 Silica dust-individual measured values for current wall chasers
fig. 6.1.3 - 4 Overview of E-dust, A-dust and silica dust. Average values for current wall chasers
Time-weighted average values of samples adherent on person (pers.) and stationary (stat.), with their scatter range are presented here

40
fig. 6.1.3 - 5 Influence of cutting depth on dust concentration for wall chaser MF02-E06 Individual measured values of samples for E-dust, A-dust and silica dust are presented here.
fig. 6.1.3 - 6 Optimization approaches for wall chaser MF05 Individual measured values of samples adherent on person for E-dust with different variations are presentedhere in color. Other current power tool systems are presented as open circles.

41
fig. 6.1.3 - 7 H-dust removing unit-tests of wall chasers Average measured values of samples adherent on person (pers.) and stationary (stat.), with their scatterrange are shown here. For the comparison with H-dust removing unit-tests the conventional power tool sys-tems are always presented in the same color as circles. Other current power tool systems are presented asopen circles.
fig. 6.1.3 - 8 Prototype-tests of wall chasers Average measured values of samples adherent on person (pers.) for E-dust with their scatter range are shownhere. For comparison with prototypes the conventional power tool systems are always presented in the samecolor as circles. For system MF20-E11 there is no comparison so it is called ‚singular prototype’. Other currentpower tool systems are presented as open circles.

42
Evaluation of the power tool system (wall chasers and mobile dust removing unit) was car-ried out as described in chapter 6.0. First or all, the time-weighted average value of sam-ples adherent on person, which normally took three tests, was calculated. This calculation was carried for the A-dust and E-dust dust fractions. The time-weighted average value is compared to the workplace limit (AGW) for each dust fraction. In chart 6.1.3 - 3 ex-ceedances (red) and compliances (green) of AGW are presented in color.
Chart 6.1.3 - 3 Evaluation of current power tool systems: wall chasers Report number Power tool system E-dust
[mg/m³] A-dust [mg/m³]
2004/2494 MF01a – E05 3.29 0.63
2004/2289 MF02a – E06 10.75 4.51
2004/2644 MF02b – E06 2.3 0.87
2004/2650 MF02c – E06 9.98 4.65
2004/2651 MF02d – E06 5.19 2.43
2004/2597 MF03 – E04 0.83 0.19
2004/2495 MF04 – E05 0.61 0.44
2004/2290 MF05a – E02 30.77 12.74
2005/2463 MF05e – E02 18.08 4.00
2004/2492B MF05g – E02 98.8
2004/2291 MF06 – E02 97.36 21.92
2004/2491 MF07c – E01 0.54 0.36
2004/2538 MF08 – E09 0.67 0.29
2004/2517 MF09a – E09 7.22 2.69
2004/2906 MF09b – E09 9.6 2.44
2004/2596 MF10 – E04 145.56 26.56
2004/2512 MF11a – E03 19.47 3.61
2005/2473 MF11b – E03 30.35 6.65
2004/2539 MF12 – E03 2.96 0.65
2004/2995 MF13 – E06 2.95 0.48
2004/2595 MF14a – E08 3.48 0.54
2004/2911 MF14b – E08 1.16 0.45
2005/2472 MF15b – E07 3.32 0.67
2004/2998 MF17 – E12 1.7 0.26
2004/2997 MF18 – E12 3.14 0.73
2004/2994 MF19 – E12 2334 82.70
2005/2601 MF21 – E01 4.54 0.59
Based on the results (e.g. compliance of the workplace limit (AGW) for both dust types or exceedances of at least one dust type) a correlation of the power tool system to the

43
scheme for hazard evaluation takes place. If limits are satisfied type I of the scheme of hazard evaluation is used. Type II of the scheme of hazard evaluation is chosen if a time-weighted average value exceeds the limit. For that reason an individual scheme of hazard evaluation was developed for each cutting depth. With this classification the following fig-ure appears:
Category I
In category I up to 20 mm cutting depth there was only one power tool (MF04-E05). Dust emission here is very low, for E- and A-dust the limit was complied. Only during one test for E- and A-dust a measured value above detection limit was obtained, all other values were below the detection limit (<NWG).
Evaluation:
The only existing power tool system in category I (smax < 20 mm) MF04-E05 does not ex-ceed the mentioned limits. Classification into type I of the hazard evaluation scheme is possible.
Category II
Eight tests were carried out in category II (>20 - ≤ 30 mm cutting depth). Five wall chasers (MF03-E04, MF08-E09, MF12-E03, MF17-E12, MF21-E01) showed low dust emission: All E-dust values of these five systems are below the limit. Nearly all A-dust and silica dust values are <NWG.
Wall chaser (MF02-E06) increasingly shows values below the limit. MF02d-E06 (27 mm cutting depth) shows distinctively higher values than MF02b-E06 (22 mm cutting depth).
These higher values of system MF06-E02 are the result of a mismatched mobile dust re-moving unit. However, it was offered as a current system in this configuration at the time of the survey.
Evaluation:
Even in category II (20 mm < smax ≤ 30 mm) nearly all power tool systems showed low dust emission so all could be classified for hazard evaluation type I. Only system MF06-EO6 had to be classified as type II due to exceedance of the limits up to a tenfold.
Category III
With 23 tests, most of the measurements were carried out in category III (>30 - ≤ 45 mm cutting depth). A close look at the individual value-chart reveals three groups presenting different dust concentrations.
Within the category there is one group of 7 power tool systems emitting very little dust: MF01-E05, MF07c-E01, MF13-E06, MF14a-E08, MF14b-E08, MF15b-E07, and MF18-E12. In many cases, the measured value for A-dust and silica dust was <NWG.
Two systems of a second group presented somewhat higher dust emission: MF09a-E09 and MF09b-E09.
Exeedances of the limit were noticed on 5 power tool systems MF02c-E06, MF05a-E02, MF05e-E02, MF11a-E03, MF11b-E03.
Evaluation:
After a rather unified appearance of systems in category II the image changes for category III (30 mm < smax ≤ 45 mm). Apart from well-tuned power tool systems there are obviously

44
systems with high dust emission. There are systems which show values significantly below the limits (among others MF07-E01, MF14-E08, MF18-E012; MF13-E06, MF01-E05 …) and can clearly be classified as type I, but there are also systems exceeding the limits. Here a classification to type II (MF05-E02, MF11-E03, MF20-E011) has to follow suit.
In this category also groove-clearing wall chasers (MF13-E06 und MF 14-E08) were tested on lime stone as well as on cellular concrete. On one machine the first test on lime stone had to be stopped. The milling head did not mesh on the lime stone so no groove could be milled. However, the other wall chaser cleared grooves completely but only a small cutting length could be obtained.
The tests on cellular concrete proceeded trouble-free. Despite the larger amount of col-lected mass both these special wall chasers have, in terms of dust emission, proved to be considerably below the claimed limit. As far as the cutting depth category is concerned, they do even better than many normal slot cutters. The two groove-clearing systems MF13-E06 and MF 14-E08 may clearly be added to type I.
During the analysis of the measured values it showed that in category III two structurally identical machines (MF09 and MF15) were tested with other, manufacturer-specific mobile dust removing units (MF09-E09 and MF15-E07). The results of both machines were mar-ginal for their category, but the wall chaser MF15 gave values only half the size of those from MF09. As the seizing hood on both machines is absolutely identical, data may refer to an improved extraction or an optimized mobile dust removing unit (E07) of wall chaser MF15.
Category IV
On the largest cutting depth category IV (>45 - ≤ 65 mm) the system MF02a-E06 revealed mainly exceedances of the limit. The two systems MF10-E04 and MF19-E12 gave exceed-ing values in all measurements.
Evaluation:
All three tested system MF10-E04, MF02a-E06 and MF19-E12 of the largest cutting depth category IV (45 mm < smax ≤ 65 mm) exceed the limit significantly. For all these systems type II of the scheme for hazard evaluation has to be used.
Comparing the dust types
Fig. 6.1.3 - 4 presents for wall chasers an overview of individual values with their scatter range for all dust types. Here values for time-weighted average values, generally three each for E-dust, A-dust and silica dust are presented.
On examination of wall chasers it is also obvious that limit exceedances primarily concern E-dust values (about a third of a tests) while those of A-dust affect only a quarter of all test cases.
Influence of cutting depth
The influence of the cutting depth on dust formation may on the one hand be recognized from the distributions of values in each category (see fig. 6.1.3 - 1 up to fig.6.1.3 - 3).
On the other hand fig. 6.1.3 - 5 shows how dust emission increases with rising cutting depth (system MF02-E06). This system was the only one tested in all four cutting depth categories. Values rise significantly for three dust types (A-dust; E-dust and silica dust) as cutting depth increases from 22 to 50 mm.

45
6.1.4 Additional tests
Apart from current systems matched by the manufacturers themselves further combina-tions of wall chasers with different mobile dust removing units as well as some prototypes were examined. These power tool systems were at the time of survey not offered in this combination nor recommended by the manufacturers (see chart. 6.1.4 - 1).
Chart 6.1.4 - 1 Additional tests – wall chasers
Time-weighted average values exceeding the limits are marked red.
Report number
Power tool system
E-dust [mg/m³]
A-dust [mg/m³] Remarks
2005/2594 MF01b - E15 2.26 0.65 H-dust removing test on lime stone
2005/2261 MF02e - E06 5.46 1.92 Machine prototype with improved extraction
2005/2474 MF02f - E06 3.6 1.30 Machine prototype with improved sealing, only 1 test carried out
2004/2492A MF05b - E02 499 118.00 conventional configuration without dust bag, only 1 test carried out
2004/2996 MF05c - E06 4.51 0.53 Wall chaser was tested with different mobile dust re-moving unit
2005/2462 MF05d - E02 12.22 3.53 Hood prototype with modified machine
2005/2464 MF05f - E02 10.46 3.49 Dust removing unit without dust bay, optimized ad-justment
2005/1133 MF07a - E16 4.09 0.76 H-dust removing test on lime stone
2005/569 MF07b - E14 4.01 0.97 H-dust removing test on lime stone
2004/2598 MF15a - E07 7.46 2.65 Dust removing unit faulty
2005/2600 MF15c - E15 0.77 0.54 H-dust removing test on lime stone, plaster milling machine with pointed tooth cutter wheel
2004/2905 MF16 - E07 1.19 0.28 Prototype /improvement of conventional machine, launch planned for the end of 2006
2005/165 MF20 - E11 33.76 8.16 Machine prototype
2005/2595 MF22 - E20 6.5 2.15 Prototype of mobile dust removing unit
With this additional research it was possible to show that at least in one case increased values can be traced back to mismatching machine and mobile dust removing unit (MF05a-E02 and MF05c-E06, see fig. 6.1.3 - 6). After only a short time span the mobile dust removing unit obviously cannot cope with the seized dust masses typical for wall chasers. Simply changing the mobile dust removing unit (MF 05-E06) already results in a drastic improvement.
On other systems (F11-E03, MF07-E01) it was noticeable that during milling only very little dust emission occurred due to a nearly closed hood. However, inside the hood a large

46
quantity of dust had gathered. Dust layers fell off the wall or dropped out of the machine housing as cutting direction was changed so the air inside the test room was heavily strained. This effect can be noticed well in the PIMEX-observations, it surely affected the result for these machines in a negative way.
A few additional measurements were carried out in category III. A manufacturer provided his mobile dust removing unit with two different-sized (27 mm and 35 mm in diameter) tubes. Both tubes are currently used. Due to the scatter range of measured values there was no convincing tendency noticeable, nor for A-dust neither for E-dust, which diameter may give an improvement.
Within the project also prototypes of modified current systems were examined. The current system MF02a-E06 was tested equipped with improved seizing (MF02e-E06) and im-proved sealing of the hood (MF02f-E06).
Improved seizing
The improved seizing of the power tool (MF02e-E06) showed a significantly lowered dust emission. With this modification the limits were complied, as opposed to all other systems from category IV. The manufacturer intends to market an improved power tool in 2006.
Improved sealing
The improved, well-finished sealing of the hood (MF02f-E06) itself also resulted in lower dust emission at first. Due to the modification the good extraction power of the mobile dust removing unit was lowered tremendously (probably because the vacuum on the machine was too high). Due to overload of the dust removing unit this test had to be terminated af-ter the first attempt.
Modifications of mobile dust removing unit
Further modified configurations were examined on wall chaser MF05. First of all, the cur-rent configuration, i.e. wall chaser MF05 equipped with mobile dust remover E02, fitted with paper filter of category M. Soon it was obvious that extraction power of the mobile dust removing unit was reduced by the paper filter. Therefore, an extra test sequence was performed without a filter (MF05b-E02). During the first attempt dust emissions increased so heavily that the test had to be terminated. After this another test was carried out, again with the paper filter fitted (MF05g-E02). Values corresponded to the one from the first test result.
After an additional test sequence with another, obviously more efficient mobile dust remov-ing unit the possible reason for the poor extraction power was traced. So efficiency of changes in operation (optimizing and manual shaking of main filter element, MF05f-E02) was tried and tested on the unit without using the paper filter. These modifications resulted in decreased values to app. 1/4 of the original values (MF05f-E02). However, the neces-sary shaking frequency for cleaning seems rather impractical for a use on building sites.
A filter prototype made from another material instead of the aforementioned paper element was examined in order to gain a possible improvement (MF05e-E02). A substantial im-provement of lowering the dust emissions was again noticeable. Still, A- as well as E-dust values are still slightly on top of those from test MF05f-E02.
A substantial matter with dust emission was the insufficient dust seizing by the hood which did not lay flat on the surface but built a gap so dust could escape. Therefore the manufac-turer tested a prototype hood, improved on the basis of the first knowledge without paper filter bag but with raised shaking frequency (MF05d-E05). Optimizing the hood construc-tion and mobile dust removing unit also resulted in decreasing the dust concentration to 1/4 of the first (poor) results.
During examination of wall chasers (MF07) fitted with the mobile dust removing unit pro-vided by the manufacturer as system component category M (E01) far better results (low

47
emission) could be obtained than using two different alternative dust category H, mobile dust removing units (E16; E14). However, this effect was also noticeable on wall chaser MF15. Regarding dust emission, the combination (MF15-E07) recommended by the manu-facturer presents a nearly identical result as a change to a mismatched mobile dust remov-ing unit of the higher dust category H (MF15-E15) (see fig. 6.1.3 - 7).
6.1.5 Conclusion
The use of a wall chasers without fitted mobile dust removing units is unacceptable regard-ing the released dust masses, as exceedances of the limits of up to 1000 times and higher are possible.
Examinations in the test room and practical measurement on building sites (see chapter 7.2), reveal that the currently available power tool systems matched by manufacturers fea-ture drastically lowered dust emission.
In 21 out of 41 test sequences carried out with these power tool systems the limits could be complied. In order to gain meaningful results measuring runtime hours were expanded far beyond usual service hours. This in mind, values in normal practice are again lower than those determined in this survey.
6.2 Concrete grinders
Concrete grinders are hand-operated power tools mostly used for building work and for stone machining. The power tool is used for deburring and smoothening concrete sur-faces, to remove wrinkles and seams but also primarily to take off protective coatings or remnants of glue. Diamond cup wheels are used as removable inserts. The hard-face cup wheel rotates on the front side.
In fact, concrete grinders are devices with quick-rotating abrasive inserts to grind off mate-rial from the (concrete) surface. Hereby large amounts of dust are generated. Health haz-ards may occur with mineral dust released, which may, depending on the surface, contains quartz particles. Therefore, state-of-the-art concrete grinders are now equipped with dust seizing elements and may be operated together with mobile dust removing units, a prac-tice still little used on building sites nowadays.
6.2.1 Test criteria
Criteria for dust examination of concrete grinders were developed by a team on July 12th, 2004 in Feuchtwangen.
The power tool systems were not divided into categories. In order to guarantee a compa-rability of system the following general conditions were specified:
Only Diamond cup wheels with diameter of 125-150-180 mm are used.
During testing the power tools are always run on maximum rotation speed (if adjust-able).
Working surface is specified as 2.4 m2.
To keep comparability between machines the seized material must be determined for each test. Hereby the mass seized by the concrete grinders has to be determined by weighing.

48
Mineral material
The operating surface is assembled from 10 single concrete slabs (sidewalk slabs 40x60x5 cm) fixed in a frame on the A-support. The frame also acts as boundary giving a constant distance to the edge of the testing area.
Weight of the concrete slabs is 28 to 29 kg. The material for treatment (sidewalk slabs) has to feature a certain concrete category (B 35; CEM I; 42,5 R;). Slabs were provided on pallets and were stored in a dry place. For each test 10 slabs were used.
fig. 6.2.1 - 1 Concrete slabs on A-support
6.2.2 Carrying out the test
The machine for test was set to maximum rotating speed (max rpm) according to data supplied by the manufacturer.
The slabs were fixed to the test wall as described above (see test setup on fig. 6.2.2.-1 be-low). Slabs may only be treated on the front and must not be grinded beyond edges. Therefore the A-support was separated by a frame construction.
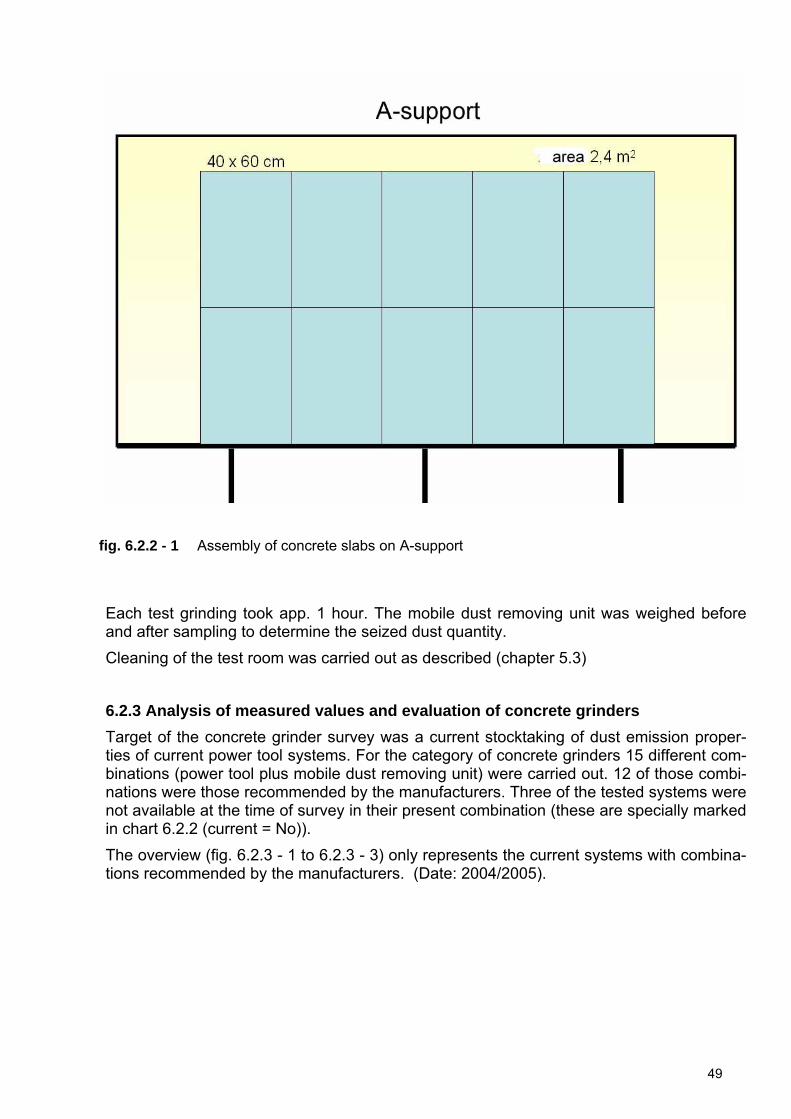
49
fig. 6.2.2 - 1 Assembly of concrete slabs on A-support
Each test grinding took app. 1 hour. The mobile dust removing unit was weighed before and after sampling to determine the seized dust quantity.
Cleaning of the test room was carried out as described (chapter 5.3)
6.2.3 Analysis of measured values and evaluation of concrete grinders
Target of the concrete grinder survey was a current stocktaking of dust emission proper-ties of current power tool systems. For the category of concrete grinders 15 different com-binations (power tool plus mobile dust removing unit) were carried out. 12 of those combi-nations were those recommended by the manufacturers. Three of the tested systems were not available at the time of survey in their present combination (these are specially marked in chart 6.2.2 (current = No)).
The overview (fig. 6.2.3 - 1 to 6.2.3 - 3) only represents the current systems with combina-tions recommended by the manufacturers. (Date: 2004/2005).

50
fig. 6.2.3 - 1 E-dust-individual measured values for current concrete grinders
fig. 6.2.3 - 2 A-dust individual measured values for current concrete grinders

51
fig. 6.2.3 - 3 Silica dust- individual measured values for current concrete grinders
fig. 6.2.3 - 4 Overview of E-dust, A-dust and silica dust-average measured values for current
concrete grinders Time-weighted average values for samples adherent on person (pers.) and stationary samples with their scat-ter range are presented.
Chart 6.2.3 - 1 shows an overview of overall number of measured values for E-dust, A-dust and silica dust types. Also is gives a clue about the part of values which actually could be determined ("MW="), and those below detection limits ("<NWG"), subdivided into sam-ples adherent on person or stationary samples. The dimension of each detection limit is

52
presented in the last two columns if values <NWG are present. With different sampling du-rations detection limits vary slightly. Each individual value is presented in the appendix, chart A1.
An explanation for the obvious discrepancy between shown values and those theoretically expected 45 (15 * 3) values per dust type was a broken sample clip cover (in one case A-dust and silica dust were impossible to determine). On values below the detection limit half of the limit was used as measurement result.
Chart 6.2.3 - 1 Number of measured values for different dust types and sampling from concrete grinders
(P = sampling adherent on person, S = stationary sampling)
Dust type Overall number MW = < NWG ≈ NWG [mg/m³] P S P S P S P S E-dust 45 45 35 44 10 1 0.6 0.16 A-dust 54 44 17 37 37 7 0.6 0.2 Silica dust 54 44 7 43 47 1 0.02 0.04
Chart 6.2.3 - 2 shows all tested concrete grinders in context with different parameters of examinations.

53
Chart 6.2.3 - 2 Tested concrete grinders
Test report Power tool
Mobile dust removing
unit
Average value of seized mass
[kg] Remarks
Current system harmonized by manufacturer
2005/2262 BS01 E17 1.30 Yes
2004/3652 BS02 E02 0.79 Yes
2004/3653 BS03 E05 0.90 Yes
2004/3679 BS04 E10 0,94 Yes
2004/3680 BS05 E11 1.70 Yes
2004/3647 BS06 E01 1.13 Yes
2004/3651 BS07 E02 4.03 Yes
2004/3648 BS08 E06 0.95 Yes
2004/3935 BS09 E09 0.67 Yes
2004/3654 BS10 E13 0.68 Yes
2004/3936 BS11 E13 0.90
Prototype of hood/improved hood fitted to conventional machine, launch scheduled
for summer 2006
No
2004/3934 BS12 E03 1.17 Prototype, currently not
available No
2004/3933 BS13 * E00 1.10
Machine prototype without active extraction, only dust
bag fitted
No
2005/2263 BS14 E17 0.95 Yes
2005/2264 BS15 E17 1.62 Yes
* = not available on the market at the time of survey
Scatter range of seized mass ranged from 0.44 kg up to 4.79 kg. Power tool BS07-E02 definitely reached the highest average amount of mass, app. 4 kg. All other measured mass values ranged from 0.44 to 2.32 kg; average was 1.06 kg.
Evaluation of the power tool system (concrete grinder and mobile dust removing unit) was carried out as described in chapter 6.0. First or all, the time-weighted average value of samples adherent on person, which normally took three tests, was calculated. This calcu-lation was carried out for the dust fractions A-dust and E-dust. The time-weighted average value was then compared to the workplace limit (AGW) for each dust fraction. In chart 6.2.3 - 3 exceedances (red) and compliances (green) of AGW are presented in color.

54
Chart 6.2.3 - 3 Evaluation of current power tool systems: concrete grinders Report number Power tool system E-dust
[mg/m³] A-dust [mg/m³]
2005/2262 BS01 - E17 3.09 0.83
2004/3652 BS02 - E02 0.38 0.26
2004/3653 BS03 - E05 0.85 0.27
2004/3679 BS04 - E10 0.62 0.27
2004/3680 BS05 - E11 0.49 0.27
2004/3647 BS06 - E01 1.37 0.27
2004/3651 BS07 - E02 10.17 1.90
2004/3648 BS08 - E06 0.27 0.27
2004/3935 BS09 - E09 3.03 0.39
2004/3654 BS10 - E13 1.22 0.29
2005/2263 BS14 - E17 1.53 0.43
2005/2264 BS15 - E17 3.13 1.08
Based on the results (e.g. compliance of the workplace limit (AGW) for both dust types or exeedances of at least one dust type) a correlation of the power tool system to the scheme for hazard evaluation takes place. If limits are kept type I of the scheme of hazard evalua-tion is used. Type II of the scheme of hazard evaluation is chosen if limits are exceeded.
For concrete grinders no categories were formed even if the seized mass presents a wide-spread range. It is noticeable that power tool BS07-E02, generating the largest amount of mass removed for all three dust types (E-, A- and silica dust) also shows the largest amount of dust emission. Power tool BS13-E00 (prototype) operating without mobile dust removing unit blowing dust directly into a filter bag, presents comparatively high measured values.
Power tools BS01-E17 and BS15-E17 show average values for A- and E-dust. Also, ma-chine BS09-E09 and BS12-E03 show average values for E-dust.
The two structurally identical devices BS05 and BS08 gave similar measurement results, differences in their mobile dust removing units didn’t seem to be an issue.
Concrete grinder BS15 presented a specialty, as it was operated by a special rod system. So grinding off material from a distance of up to 1.5 m from the operator was possible. Looking at the values the distance obviously does not influence the adherent values for ei-ther A- and E-dust.
All other concrete grinders consistently showed low dust emission, all of which below the relevant limits. Figures 6.2.3 - 1 up to 6.2.3 - 3 show individual values for (generally 3 each) E-, A- and silica dust measurements of all concrete grinder tests carried out.
Evaluation:
Concrete grinders BS02-E02, BS05-E11, BS03-E05, BS08-E06, BS04-E10 create that lit-tle dust during operation that at least a single value for all dust types was definitely below the detection limit (< NWG). For these power tool systems a classification as type I of hazard evaluation is possible. Also the concrete grinder types BS09-E09, BS 14-E17 and BS 15-E17 showed values often considerably below A- and E-dust limits. Without any doubt they can be classified as type I. Only concrete grinder BS07-E02 which also
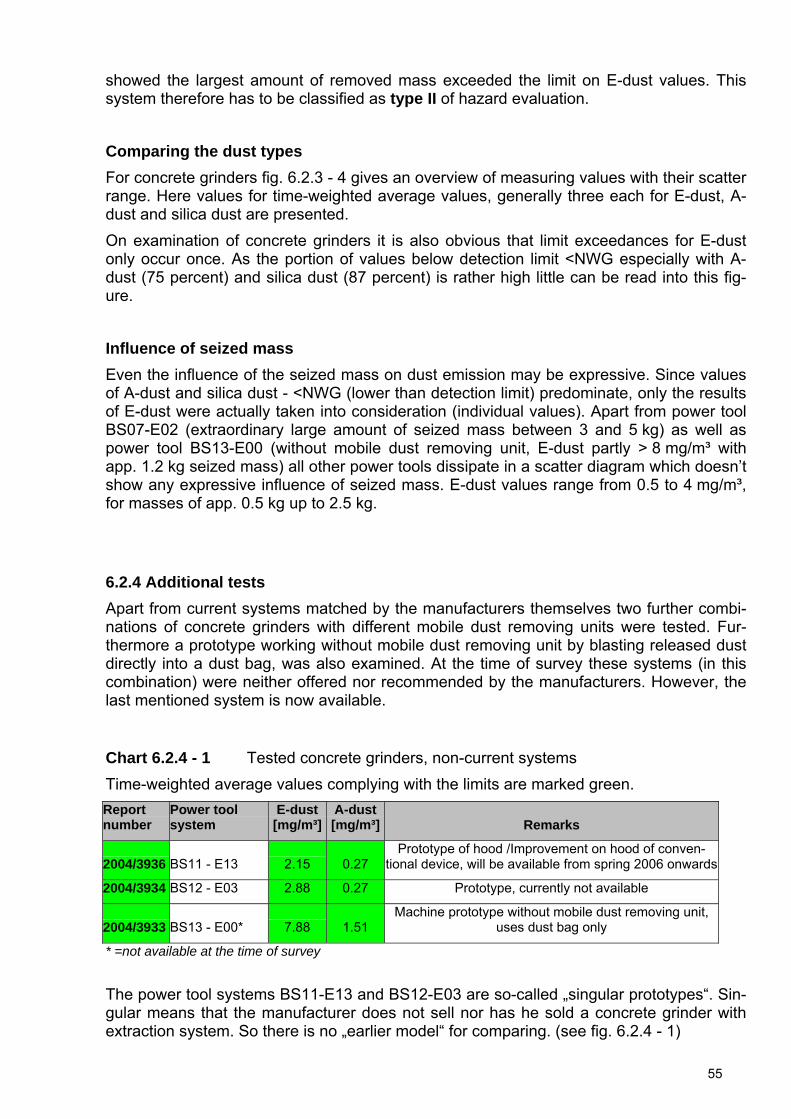
55
showed the largest amount of removed mass exceeded the limit on E-dust values. This system therefore has to be classified as type II of hazard evaluation.
Comparing the dust types
For concrete grinders fig. 6.2.3 - 4 gives an overview of measuring values with their scatter range. Here values for time-weighted average values, generally three each for E-dust, A-dust and silica dust are presented.
On examination of concrete grinders it is also obvious that limit exceedances for E-dust only occur once. As the portion of values below detection limit <NWG especially with A-dust (75 percent) and silica dust (87 percent) is rather high little can be read into this fig-ure.
Influence of seized mass
Even the influence of the seized mass on dust emission may be expressive. Since values of A-dust and silica dust - <NWG (lower than detection limit) predominate, only the results of E-dust were actually taken into consideration (individual values). Apart from power tool BS07-E02 (extraordinary large amount of seized mass between 3 and 5 kg) as well as power tool BS13-E00 (without mobile dust removing unit, E-dust partly > 8 mg/m³ with app. 1.2 kg seized mass) all other power tools dissipate in a scatter diagram which doesn’t show any expressive influence of seized mass. E-dust values range from 0.5 to 4 mg/m³, for masses of app. 0.5 kg up to 2.5 kg.
6.2.4 Additional tests
Apart from current systems matched by the manufacturers themselves two further combi-nations of concrete grinders with different mobile dust removing units were tested. Fur-thermore a prototype working without mobile dust removing unit by blasting released dust directly into a dust bag, was also examined. At the time of survey these systems (in this combination) were neither offered nor recommended by the manufacturers. However, the last mentioned system is now available.
Chart 6.2.4 - 1 Tested concrete grinders, non-current systems
Time-weighted average values complying with the limits are marked green.
Report number
Power tool system
E-dust [mg/m³]
A-dust [mg/m³] Remarks
2004/3936 BS11 - E13 2.15 0.27 Prototype of hood /Improvement on hood of conven-
tional device, will be available from spring 2006 onwards
2004/3934 BS12 - E03 2.88 0.27 Prototype, currently not available
2004/3933 BS13 - E00* 7.88 1.51 Machine prototype without mobile dust removing unit,
uses dust bag only
* =not available at the time of survey
The power tool systems BS11-E13 and BS12-E03 are so-called „singular prototypes“. Sin-gular means that the manufacturer does not sell nor has he sold a concrete grinder with extraction system. So there is no „earlier model“ for comparing. (see fig. 6.2.4 - 1)

56
fig. 6.2.4 - 1 Prototype tests for concrete grinders Average values of samples adherent on person (pers.) for E-dust with their scatter range are presented here.For comparison with prototypes the conventional power tool systems are always presented in the same coloras circles. For system MF20-E11 there is no comparison so it is called ‚singular prototype’. Other currentpower tool systems are presented as open circles.
Power tool BS13 represents an interesting unit. It works without mobile dust removing unit but in return forwards released dust straight into a dust bag. The process is supported by a turbo blower additionally fixed to the engine‘s output shaft. Compared to systems with mo-bile dust removing units this system revealed relatively poor values for E-dust which are barely below the limit (see fig. 6.2.4 - 1). However results of this system are still below the worst (highest!) values of systems working with mobile dust removing units. It is also re-markable that concrete grinder (BS12-E03), apart from the extra turbocharger, is virtually identical to concrete grinder BS13. If directly compared the power tool system BS12-E03 still offers far better results than the system without an active extraction unit.
6.2.5 Conclusion
Working with currently available concrete grinders using harmonized mobile dust removing unit is a relatively low-dust operation.
Within this survey only one power tool system gives values above the limit. However, this system removes a lot of material compared to other machines.
As above mentioned, system BS12-E03 fitted with a mobile dust removing unit offered far superior results compared to machine BS13 with dust bag. That implies that optimized ex-traction by a mobile dust removing unit presents the best method of dust minimizing for ex-tensive work. However, thanks to little weight and size the configuration of concrete grinder and dust bag may be helpful for minor work at hard-to-reach or narrow workplaces.
Examinations in the test room show that today current systems harmonized by the manu-facturers offer drastically lowered dust emissions. 11 of our 12 tested current systems de-
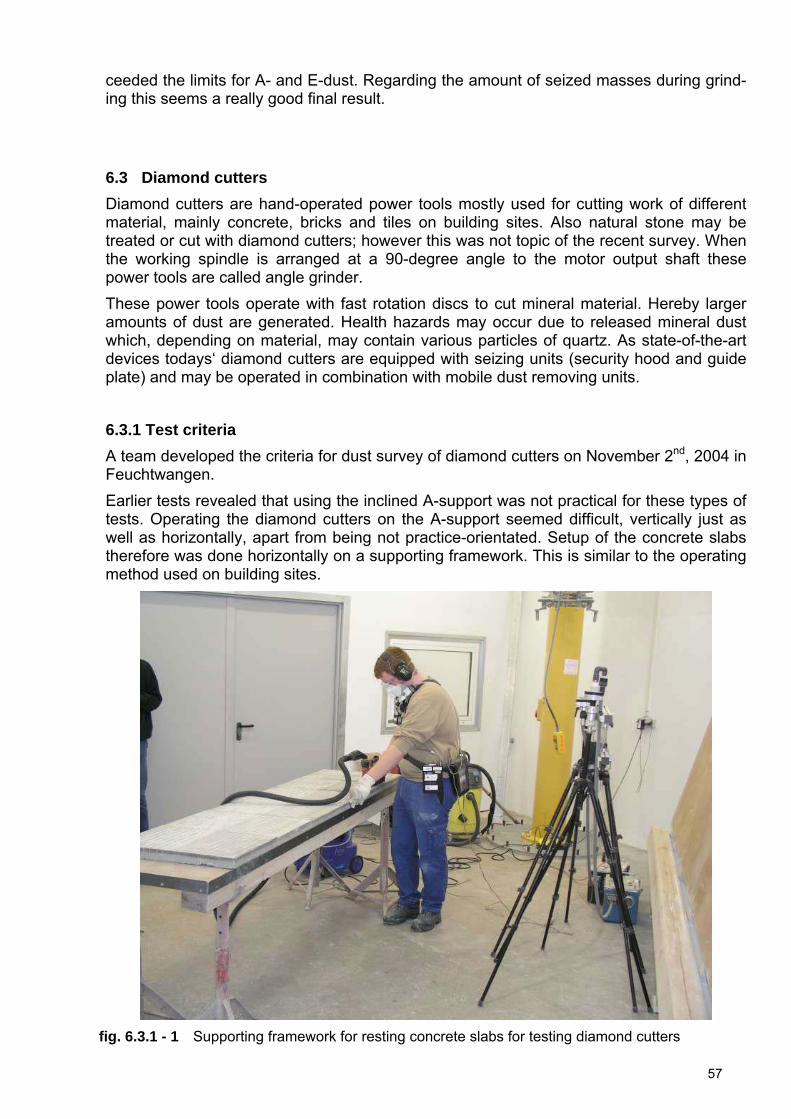
57
ceeded the limits for A- and E-dust. Regarding the amount of seized masses during grind-ing this seems a really good final result.
6.3 Diamond cutters
Diamond cutters are hand-operated power tools mostly used for cutting work of different material, mainly concrete, bricks and tiles on building sites. Also natural stone may be treated or cut with diamond cutters; however this was not topic of the recent survey. When the working spindle is arranged at a 90-degree angle to the motor output shaft these power tools are called angle grinder.
These power tools operate with fast rotation discs to cut mineral material. Hereby larger amounts of dust are generated. Health hazards may occur due to released mineral dust which, depending on material, may contain various particles of quartz. As state-of-the-art devices todays‘ diamond cutters are equipped with seizing units (security hood and guide plate) and may be operated in combination with mobile dust removing units.
6.3.1 Test criteria
A team developed the criteria for dust survey of diamond cutters on November 2nd, 2004 in Feuchtwangen.
Earlier tests revealed that using the inclined A-support was not practical for these types of tests. Operating the diamond cutters on the A-support seemed difficult, vertically just as well as horizontally, apart from being not practice-orientated. Setup of the concrete slabs therefore was done horizontally on a supporting framework. This is similar to the operating method used on building sites.
fig. 6.3.1 - 1 Supporting framework for resting concrete slabs for testing diamond cutters

58
Discussing the results of the pre-tests revealed the following criteria for test sequences of the diamond cutters:
Only machines entirely used for separating mineral material will be tested.
For these work operations the cutters are equipped with commonly used diamond discs. Corundum or artificial resin-bound discs will not be used for testing.
Concrete slabs of the same quality (category) as the ones utilized for testing con-crete grinders are used.
Test surface is one slab length (app. 0. 6 m) in width and app. 2.4 m in length. For this 6 concrete slabs 0,6 m x 0,4 m in size are positioned one after the other, on the framework.
Test cuts are started without an immersing procedure before the disc touches the material. The cut ends app. 10 cm before the end of the testing surface; therefore cutting length is about 2.3 metres.
The power tool is switched off before taken out of the cutting line end.
Cutting distance is specified to 3 cm; distance to lower edge will be straightened with the aid of the guide plate.
Testing time is specified at 45 minutes.
For the cutting depth two test categories are specified:
o 2 cm cutting depth for diamond cutting discs with a size of 125 mm to 180 mm (in diameter).
o 4 cm cutting depth for diamond cutting discs with a size of 230 mm, 400 mm and more (in diameter).
Machined mass is determined by weighing the complete mobile dust removing unit. Material not seized by the dust removing unit (e.g. remnants on slabs and in gaps) is vacuumed.
Disc thickness has to be determined before and after the test (by using a calliper)
Rotating speed (rpm) is predefined and has to be determined
Electrical power consumption of the power tool in use is monitored during test and determined by the PIMEX system. So any overload (thermal or electrical) is avoided and the excessive disc wear can be detected. For monitoring the power consump-tions a measuring module provided by AHLBORN is integrated into the PIMEX pe-riphery using the Almemo-System.
Mineral material
Work surface is arranged as 6 single concrete slabs (sidewalk slabs 40x60x5 cm) fixed to the supporting frame. Weight ranges from 28 to 29 kg. Test material must feature a certain concrete strength category (B 35; CEM I; 42,5 R;).
6.3.2 Carrying out the test
The power tools used for testing were set to the scheduled test depth (2.0 cm/4.0 cm resp.), according to the manufacturer’s data.
Concrete slabs were arranged as described in chapter „test criteria“ on the framework to form the test surface.

59
fig. 6.3.2 - 1 Arrangement of concrete slabs on framework.
Cuts are performed alongside pre-set lines drawn by pencil on the slab surface. Distance to lower edge (for the first cut performed) is dependent on the guide plate width of the diamond cutter (see chapter test criteria)
Test cuts are carried out according to the test criteria, the power tool is switched off before taken out of the slab.
After each second cut a 3 minute break follows used for changing or for sharpening the disc if required. These duties are carried out by the technician outside the test room.
During these duties the power tool operator stays inside the test room, all measuring in-struments stay switched on.
The mobile dust removing unit is weighed before and after the sampling. After finishing a test sequence the slabs are taken from the framework and disposed of as construction waste. Afterwards the floor is thoroughly vacuumed; in the mean time the test room is ven-tilated for the next test (see chapter 5.3)
6.3.3 Analysis of measured values and evaluation of diamond cutters
Target of the diamond cutter survey was a current stocktaking for dust emission properties of current power tool systems. For the range of diamond cutters 22 differed combinations (tool including mobile dust removing unit) were carried out. 17 of these combinations (ma-chine and dust removing unit) were those recommended by the manufacturers.
The overview (fig. 6.3.3 - 1 up to 6.3.3 - 3) only shows the current power tool systems as combinations recommended by the manufacturers. (Date: 2004/2005).

60
fig. 6.3.3 - 1 E-dust individual measured values for current diamond cutters
fig. 6.3.3 - 2 A-dust individual measured values for current diamond cutters

61
fig. 6.3.3 - 3 Silica dust-individual measured values for current diamond cutters
Chart 6.3.3 - 1 reveals an overview of the total number of measured values for E-dust, A-dust and silica dust types. Also, it shows the number of values which actually could be de-termined ("MW =") and, again, the part of values below detection limit ("<NWG"), classified into samples adherent on person or taken stationary. Dimension of each detection limit is given in the last two columns of the chart if values <NWG are present. Due to duration dif-ferences of sampling slightly different detection limits may occur. The individual values are given in chart A1 of the appendix.
As earlier tests showed that the fixing direction of the sample cover slip (either left or right in breathing area of the power tool operator) might have an influence on measured value, sampling of E-dust adherent on person was carried out twice. As silica dust value is also taken from the same sample cover slip, the number of values theoretically expected are 66 (22*3) for E-dust and 132 (22*2*3) values for A-dust and silica dust. Deviations from the number can be explained with tests not carried out on certain examinations. On measured values below the detection limit half of the actual limit was used as measuring result.
Chart 6.3.3 - 1 Number of measured values for different dust types and samples with diamond cutters
(P = sampling adherent on person, S = stationary sampling)
Dust type Overall number MW = < NWG ≈ NWG [mg/m³] P S P S P S P S E-dust 70 66 70 66 0 0 - - A-dust 142 68 134 68 8 0 0.6 - Silica dust 141 68 130 68 11 0 0.02 -

62
Chart 6.3.3 - 2 shows the tested diamond cutters, together with different parameters of the tests
Chart 6.3.3 - 2 Tested diamond cutters
Test report Power
tool
Mobile dust re-moving
unit
Cate-gory
Cutting depth in
mm
Average value cut-ting length
in m
Average value seized
mass [kg] Remarks
Current system harmonized by manufacturer
2005/305 TS01 E05 II 40 7.90 2.37 Yes
2005/507 TS02 E09 I 20 18.54 2.59 Yes
2005/510 TS03 E09 I 20 18.4 2.23 Yes
2005/508 TS04 E09 II 40 9.27 2,47 Yes
2005/286 TS05 E03 II 40 18.40 2.59 Yes
2005/287 TS06 E02 I 20 18.42 2.23 Yes
2005/288 TS07 E02 II 40 9.20 2.47 Yes
2005/570 TS08a E14 I 20 18.40 4.89 H-dust removing tests on concrete
No
2005/167 TS08b E04 I 20 18.56 2.49 Yes
2005/168 TS09 E04 II 40 11.50 2.54 Yes
2005/166 TS10 E10 I 20 15.91 2.05 Yes
2005/568 TS11a E14 I 20 18.40 2.05 H-dust removing tests on concrete
No
2005/296 TS11b E01 I 20 18.47 3.43 Yes
2005/307 TS11c E01 I 20 18.40 1.84 Yes
2005/1134 TS11d E16 I 18 17.70 2.5 H-dust removing tests on concrete
No
2005/2602 TS11e E01 I 25 18.80 2.46 Yes
2005/509 TS12 E01 II 40 9.26 2.60 Yes
2005/306 TS13 E05 I 20 17.93 2.19 Yes
2005/289 TS14 * E00 I 20 18.40 3,06
Machine proto-type, no mobile dust removing
unit but dust bag
No
2005/767 TS15 E09 II 40 9.19 2.74 Yes
2005/768 TS16 E15 I 28 12.27 2.83
Assembled con-figuration, differ-ent manufactur-ers, but currently available on the
Yes

63
Test report Power
tool
Mobile dust re-moving
unit
Cate-gory
Cutting depth in
mm
Average value cut-ting length
in m
Average value seized
mass [kg] Remarks
Current system harmonized by manufacturer
market
2005/2465 TS17 E18 I 22 2.60 2.13
Special machine, tested as dia-
mond grinder on concrete, hood
seems unsuitable for dust seizure
No
2005/1518 TS18a E19 I 20 60.0 -
Concrete dia-mond cutter self-build assortment of units, no mo-bile dust remov-ing unit but dust seizing by water
No
2005/1519 TS18b E19 I 20 60.0 -
Diamond crack chaser, no mobile dust removing unit but dust seiz-ing by water
No
* = at the time of survey not available on the market
According to the cutting depth 2 categories were formed for diamond cutters.
Individual values for the usual 3 resp. 6 E-dust as well as A-dust and silica dust measure-ments of all tests with diamond cutters are shown in fig. 6.3.1 - 1 to 6.3.1 – 3, separated into cutting depth categories.
Removed and seized mass ranged from 0.34 kg up to 5.0 kg. Average value of cutting depth category I is 2.4 kg, in cutting depth category II the average is 2.8 kg. Average cut-ting length for category I comes to 17.7 m, nearly twice the value of category II (10.0 m).
Evaluation of the power tool system (diamond cutter and mobile dust removing unit) was carried out as specified in chapter 6.0. First of all, for each power tool system the time-weighted average value of samples adherent on person (usually three tests carried out) was calculated. This calculation was also made for A- and E-dust. This time-weighted av-erage value was then compared with the workplace limit (AGW) of the relevant dust frac-tion. In chart 6.3.3 - 3 exceedances (red) and compliances (green) of AGW are presented in color.

64
Chart 6.3.3 - 3 Evaluation of current systems: diamond cutters Report number Power tool system E-dust
[mg/m³] A-dust [mg/m³]
2005/305 Cat. 2 TS01 - E05 33.64 14.48
2005/507 Cat. 1 TS02 - E09 9.76 1.62
2005/510 Cat. 1 TS03 - E09 17.6 3.82
2005/508 Cat 2 TS04 - E09 71.97 17.21
2005/286 Cat. 2 TS05 - E03 55.93 24.18
2005/287 Cat. 1 TS06 - E02 26.94 5.40
2005/288 Cat. 2 TS07 - E02 45.64 19.08
2005/167 Cat. 1 TS08b - E04 2.29 0.67
2005/168 Cat. 2 TS09 - E04 32.17 11.99
2005/166 Cat. 1 TS10 - E10 2.01 0.70
2005/296 Cat.1 TS11b - E01 3.56 1.27
2005/307 Cat. 1 TS11c - E01 2.21 0.73
2005/2602 Cat 1 TS11e - E01 1.46 0.43
2005/509 Cat. 2 TS12 - E01 5.32 2.08
2005/306 Cat. 1 TS13 - E05 30.02 10.71
2005/767 Cat. 2 TS15 - E09 50.86 17.44
2005/768 Cat. 1 TS16 - E15 6.29 1.71
Based on the results (e.g. compliance of the workplace limit (AGW) for both dust types or exceedances of at least one dust type) a correlation of the power tool system to the scheme for hazard evaluation takes place. If limits are kept type I of the scheme of hazard evaluation is used. Type II of the scheme of hazard evaluation is used if the limits are ex-ceeded.
Category I
For cutting depth category I (20 mm) 10 diamond cutters with disc diameters from 125 to 180 mm were tested. The machines TS03-E09, TS06-E02 and TS09-E04 revealed values distinctively above the limits for E- and A-dust. For E-dust, the system TS02-E09 gave val-ues close to the limit but showed improved results with values for A-dust.
The power tool systems TS11b-E01, TS11c-E01, TS11e-E01, are, in fact, identical power tools but using three different hood configurations. The power tools gave good results all the way through, e.g. below the limits for E- and A-dust. Also, the system TS10-E10 did not exceed the limit in any case.
Evaluation:
Without doubt, diamond cutters TS03-E09, TS06-E02 and TS09-E04 have to be classified as type II. The systems TS11b-E01, TS11c-E01, TS11e-E01 as well as TS10-E10, and with limitations also TS02-E09 can be classified as type I.

65
Category II
For cutting depth category II (40 mm) 7 diamond cutters featuring disc diameters from 230 to 305 mm were examined. The power tools TS01-E05, TS04-E09, TS05-E03, TS07-E02, TS09-E04 and TS15-E09 revealed poor (high) values for all dust types exceeding the lim-its for E- and A-dust significantly.
In this category only diamond cutter TS12-E01 gave values below limits for E-and A-dust.
Evaluation:
Beyond question diamond cutters with discs diameters from 230 mm and more are the machines that reveal the highest dust emissions within this survey. So it is very obvious that due to these results diamond cutters TS01-E05, TS04-E09, TS05-E03, TS07-E02, TS09-E04 and TS15-E09 need to be classified as type II of the hazard evaluation. Only one single system is doubtlessly classified as type I.
Comparing the dust types
For diamond cutters, fig. 6.3.3 – 4 shows an overview of individual values. Here time-weighted average values, generally three each for E-dust, A-dust and silica dust are pre-sented, together with their scatter range. If an exceedance of the limit occurs it always in-cludes both dust fractions (A- and E-dust)
fig. 6.3.3 - 4 Overview of E-, A- and silica dust. Average measured values for current diamond cut-
ters
Time-weighted average values for samples adherent on person (pers.) and stationary (stat.) samples includingtheir scatter range.

66
6.3.4 Additional tests
Apart from current systems matched by the manufacturer additional tests on diamond cut-ters were carried out (prototypes (TS16), special machines (TS17) and a dust seizing sys-tem with water as well as power tool systems with different mobile dust removing units (TS18). A list of these different configurations can be found in chart 6.3.4 - 1.
Chart 6.3.4 - 1 Tested diamond cutters, non-current units
Time-weighted average values exceeding the limits are marked red.
Report number Power tool system
E-dust [mg/m³]
A-dust [mg/m³] Remarks
2005/570 Cat. 1 TS08a - E14 1.69 0.46 H-dust removing tests on concrete
2005/568 Cat. 1 TS11a - E14 3.28 1.40 H-dust removing tests on concrete, flexible hood
2005/1134 Cat. 1 TS11d - E16 9.58 2.04 H-dust removing tests on concrete, flexible hood, does not seal completely
2005/289 Cat. 1 TS14 - E00 17.02 6.40 Prototype without mobile dust removing unit, only dust bag
2005/2465 Cat. 2 TS17 - E18 90.99 17.04 Special item, tested as diamond cutter on con-crete, hood seems unsuitable for dust seizing
2005/1518 Cat. 1 TS18a - E19 131 22.05
Concrete diamond cutter, DIY-machine configu-ration, not dust removing unit, but dust seizing system with water
2005/1519 Cat. 1 TS18b - E19 226.7 49.48
Chalk chaser, DIY- power tool configuration, not dust removing unit, but dust seizing system with water
* = at the time of survey not available on the market
H-Dust removing units
Apart from harmonized systems three combinations of diamond cutters fitted with different mobile dust removing units were tested (see fig. 6.3.4 - 1). The diagram compares the original configuration diamond cutter and mobile dust removing unit with the „new“ configu-ration.
While the power tool system TS08a-E14 (with H-Dust removing unit) presents slightly bet-ter (e.g. lower) values within the scatter range, than the current system TS08b-E04, the use of an H-dust removing unit does not show any improvement on the two other cases. Both systems, TS11a-E14 and TS11d-E16, reveal significantly more released dust than current systems.

67
fig. 6.3.4 - 1 H-Dust removing units and examinations of current diamond cutters
Average values of samples adherent on person (pers.) for E-dust with their scatter range are presented here. For comparison with H-dust removing units the conventional power tool systems are always presented in the same color as circles. Other current power tool systems are presented as open circles.
Prototypes
Furthermore three prototypes operating partly with special techniques were tested for dust emission during use. The special technique already described on machine BS 13 also came into use for cutting depth category I. Diamond cutter TS14 is not connected to a mo-bile dust removing unit. A turbo blower additionally fixed to the motor shaft supports dust extraction and guides seized dust into a special dust bag. Compared to systems operating with mobile dust removing units this dust seizing system reveals relatively high values for E-dust which are above the limit (see fig. 6.3.4 - 2). However, these results still are below those values of the three „worst“ systems of cutting depth category I equipped with mobile dust removing units.
A reduced-weight power tool version of a hand-held diamond cutter with high-frequency-type motor (TS17-E18) represented another peculiar machine. However, this system showed one of the highest dust emission compared to other diamond cutters of both cut-ting depth categories. Unfortunately, the system had a mismatched and poor dust seizing. Apart from a only halfway-closed hood the mobile dust removing unit from another manu-facturer did not match the machine.
Within cutting depth category I another exception, power tool TS 18, was tested for the machine category of diamond cutters. This power tool system seized dust with a water flushing system, here called dust removing unit E19. The diamond cutter was tested, as described in chapter 6.3.2 "performance", on concrete. Due to safety reasons only one test was carried out.

68
fig. 6.3.4 - 2 Prototypes and tests for current diamond cutters
Average values of samples adherent on person (pers.) for E-dust with their scatter range are presented here.For easy comparison with prototypes the conventional power tool systems are always presented in the samecolor as circles. For system MF20-E11 there is no comparison so it is called ‚singular prototype’. Other currentpower tool systems are presented as open circles.
In another test a simulation of cutting sand-lime bricks was carried out with the machine equipped with a so-called mortar reamer diamond disc, 7.5 mm in thickness. For this, the image of a wall made from bricks (same sizes as current clinker bricks) was pencil-drawn on sand-lime and fictional joints, 1.5 cm in depth, were cut. 3 tests of 30 minutes each, with a cutting length of 60 m per test, were carried out. Consistently this water flushing system revealed the largest dust emission of all tested diamond cutters.
The systems described here were not available from manufacturers at the time of the sur-vey.
6.3.5 Conclusion
Work with harmonized systems for diamond cutters currently on the market can be carried out with relatively little dust emission compared to work with a non-extraction system. However, only half of all systems belonging to cutting dept category I (20 mm) as well as only a single system from category II (40 mm) complied to the limits. So the amount of dust emission mostly depends on the cutting depth. Obviously the dust amounts generated with these operations are enormous and still present a challenge for optimizing many power tool systems. Optimized matching of dust seizing units to the power tools are there-fore inevitable.
Hopefully further developments of these systems will follow in near future so limits are complied even with larger cutting depth.

69
Generally it must be stated that using diamond cutters without mobile dust removing units, especially on longer lasting work operations, is not acceptable due to the large amounts of dust generated.
6.4 Plaster milling machines
Plaster milling machines are motorized power tools generally used for smoothening con-crete surfaces, aligning form-board joints, roughening or removing adhesive plaster or for removing remnants of glue or old coatings.
Several rotating hard-metal gear wheel cutters fitted to different milling shafts are driven by the engine main shaft and provide high material removal. Using milling machines large amounts of dust are generated. Health hazards may occur with released mineral dust which, dependent on base, may contain quartz particles. Therefore plaster milling ma-chines are equipped with seizing elements (extraction manifolds) and are used in combi-nation with mobile dust removing units. Unfortunately systems matched by manufacturers are even today rarely used on building sites.
6.4.1 Test criteria
The following test criteria for plaster milling machines were discussed and specified during a meeting on September 16th, 2004 in Feuchtwangen:
Machines for testing are current plaster milling machines but also concrete grinders equipped with gear wheel heads so they can also be used for removing coats and plaster.
According to current removal depth two test milling depth are specified.
Lime-sand bricks with a gross density adequate to average plaster coat shall be used.
Due to enormous removal output of the machine the test surface must at least be 2.4m2 .To avoid over grinding of the edges a frame must be fixed to the stones.
Measuring time for all machines is at least 45 minutes.
The seized mass is determined by weighing the complete mobile dust removing unit.
Classification of machines
Depending on the machine output different milling depth can be reached. All power tool systems (except for system PF05-E11) were examined in two categories. For category I test-milling depth is specified at 3 mm, for category II specification is 5 mm. Testing depth is firmly adjusted on each machine.
Mineral material
For mineral material used for testing plaster milling machines small-format lime-sand hol-low blocks (KSL-R (P)8 - 1,2 - 8DF/115) (498x115x248 mm) were chosen. Gross density of lime-sand blocks must be matched to a current rendering and is 1.2 kg/dm³. 8 hollow blocks were delivered on pallets and stored in a dry place. Usually 20 blocks per test day (three tests each) were worked on one side.

70
fig. 6.4.2 - 1 Arrangement of lime-sand hollow blocks on A-support
6.4.2 Carrying out the test
Working method
The machines due for testing and the mobile dust removing unit were adjusted according to the manufacturer‘s data. The test wall contains 20 sand-lime hollow blocks (sizes as above). This is equivalent to an area of app. 2.5 m². The stones/hollow blocks are ar-ranged as described in fig.6.4.2 - 1 and must not be worked beyond the edge.
Milling operation lasts app. 1 hour. The mobile dust removing unit is weighed before and after the test, together with its tube to determine the complete seized mass. Material not seized on the A-support was thoroughly vacuumed using the dust removing unit (later to be weighed).
Test room cleaning was carried out between tests as described in chapter 5.3.
6.4.3 Analysis of measured values and evaluation of plaster milling machines
Target of the survey for plaster milling machines was a current stocktaking dust emission properties of current power tool systems. For the machine range of plaster milling ma-chines 14 differed combinations (machine including mobile dust removing unit) were tested.
The overview (fig. 6.4.3 - 1 up to fig. 6.4.3 - 3) only shows current systems with combina-tions recommended by the manufacturers. (Date: 2004/2005).

71
fig. 6.4.3 - 1 E-dust individual measured values for current plaster milling machines
fig. 6.4.3 - 2 A-dust individual measured values for current plaster milling machines

72
fig. 6.4.3 - 3 Silica dust-individual measured values for current plaster milling machines
Chart 6.4.3 - 1 reveals an overview of the total number of measured values for the dust types E-dust, A-dust and silica dust. Also, it shows the number of values which actually could be determined ("MW =") and, again, the part of values below the detection limit ("<NWG"), classified into samples adherent on person or taken stationary. Size of each detection limit is given in the last two columns of the chart if values <NWG are present. Due to duration differences of sampling slightly different detection limits occur. The indi-vidual values are given in chart A1 of the appendix.
For measured values below the detection limit half of the actual limit was used as measur-ing result.
Chart 6.4.3 - 1 Number of measured values for different dust types and samples on plaster milling machines
(P = sampling adherent on person, S = stationary sampling)
Dust type Overall number MW = < NWG ≈ NWG [mg/m³] P S P S P S P S E-dust 42 43 42 43 0 0 - - A-dust 47 43 36 42 11 1 1.0 0.3 Silica dust 48 43 10 40 38 3 0.05 0.01
In Chart 6.4.3 - 2 the tested plaster milling machines are shown together with different pa-rameters of the tests.

73
According to the removal depth of 3 mm and 5 mm resp. 2 categories were formed. The individual values (three E-dust, A-dust- and silica dust measurements) of all plaster milling machines are shown in charts 6.4.3 – 1 up to 6.4.3. - 3, subdivided into categories.
Seized mass ranges are from 9.9 kg up to 20.5 kg. The average value amounts to 11.9 kg (category I) and 16.6 kg (category II).
Chart 6.4.3 - 2 Tested plaster milling machines
Test report Power
tool
Mobile dust re-moving
unit
Cate-gory
Average seized mass
[kg] Remarks
Current system harmonized by manufacturer
2004/4086 PF01 E02 I 10.4 Same machine configuration,
different milling depth Yes
2004/4087 PF01 E02 II 16.92 Same machine configuration, different milling depth
Yes
2004/4036 PF02 E05 I 14.76
Concrete grinder with polish-ing disc, same machine con-
figuration, different milling depth
Yes
2004/4034 PF02 E05 II 16.17
Concrete grinder with polish-ing disc, same machine con-
figuration, different milling depth
Yes
2004/4173 PF03a E10 I 10.25
Plaster milling machine with pointed tooth cutter wheel,
Same machine configuration, different milling depth
Yes
2004/4174 PF03a E10 II 16.80
Plaster milling machine with pointed tooth cutter wheel,
Same machine configuration, different milling depth
Yes
2005/572 PF03b E14 I 10.55
H-dust removing test on lime-sand brick, plaster milling ma-chine with pointed tooth cutter
wheel
No
2005/1132 PF03c E16 II 15.67
H-dust removing test on lime-sand brick, plaster milling ma-chine with pointed tooth cutter
wheel
No
2004/4022 PF04a E13 I 11.45
Plaster milling machine with pointed tooth cutter wheel,
Same machine configuration, different milling depth
Yes
2004/4021 PF04a E13 II 17.90 Yes
2004/4078 PF04b E13 I 11.05 Plaster milling machine with flat tooth cutter wheel, milling
depth 3mm Yes

74
Test report Power
tool
Mobile dust re-moving
unit
Cate-gory
Average seized mass
[kg] Remarks
Current system harmonized by manufacturer
2004/4085 PF05 E11 I 16.12 Yes
2004/4171 PF06 E07 I 10.69 Same machine configuration,
different milling depth Yes
2004/4172 PF06 E07 II 15.51 Same machine configuration,
different milling depth Yes
Evaluation of the power tool system (plaster milling machine and mobile dust removing unit) was carried out as specified in chapter 6.0. First of all, for each power tool system the time-weighted average value of samples adherent on person (usually three tests were car-ried out) was calculated. This calculation was also made for A- and E-dust. This time-weighted average value was then compared with the workplace limit (AGW) of the relevant dust fraction. In chart 6.4.3 - 3 exceedances (red) and compliances (green) of AGW are presented in color.
Chart 6.4.3 - 3 Evaluation of current systems: plaster milling machines
Report number Power tool system E-dust [mg/m³]
A-dust [mg/m³]
2004/4086 Cat.1 PF01 – E02 39.95 6.51
2004/4087 Cat.2 PF01 – E02 22.19 4.89
2004/4036 Cat.1 PF02 – E05 6.89 1.26
2004/4034 Cat.2 PF02 – E05 4.51 1.45
2004/4173 Cat.1 PF03a – E10 16.19 1.01
2004/4174 Cat.2 PF03a – E10 15.74 1.81
2004/4022 Cat.1 PF04a – E13 6.42 0.98
2004/4021 Cat.2 PF04a – E13 17.25 3.86
2004/4078 Cat.1 PF04b – E13 4.94 1.07
2004/4085 Cat.1 PF05 – E11 226.26 35.74
2004/4171 Cat.1 PF06 – E07 5.58 0.65
2004/4172 Cat.2 PF06 – E07 4.92 0.68
Based on the results (e.g. compliance of the workplace limit (AGW) for both dust types or exeedances of at least one dust type) a correlation of the power tool system to the scheme for hazard evaluation takes place. If limits are kept type I of the scheme of hazard evalua-tion is used. Type II of the scheme of hazard evaluation is chosen if limits are exceeded.
Category I
In category I (milling depth 3 mm) 7 power tool systems were tested. Plaster milling ma-chines PF04b-E13, PF04a-E13, PF06-E07 and PF02b-E05 reveal values below the limit

75
for A- and E-dust. Without doubt these systems can be classified as type I of hazard evaluation.
In contrast to that some systems show drastically exceedances: plaster milling machines PF03a-E10, (on E-dust); PF01-E02 as well as PF05-E11 show values far beyond the A- and E-dust limit. Again, these plaster milling machines definitely have to be classified as type II of the hazard evaluation scheme.
Category II
In category II (milling depth 5 mm), with only 5 tested power tool systems, only the plaster milling machines PF02b-E05 and PF06-E07 revealed measured values below A- and E-dust limits. Therefore, these systems can be classified as type I of hazard evaluation.
However, the plaster milling machines PF03a-E10, PF04a-E13 and PF01-E01 partly ex-ceeded A- and E-dust limits. These power tool systems are to be classified as type II of the hazard evaluation.
Comparing the dust types
Fig. 6.4.3 - 4 presents an overview of the individual values for plaster milling machines. Here time-weighted average values, generally three each for E-dust, A-dust and silica dust are shown, together with their scatter range.
fig. 6.4.3 - 4 Overview of E-, A- and silica dust. Average values for current plaster milling machines Time-weighted average values for samples adherent on person (pers.) and stationary (stat.) samples including their scatter range are shown.
It is noticeable that the largest amount of pollution (compared to the limit) is obviously generated by E-dust. Either limit for E-dust is exceeded or both dust fractions (A- and E-

76
dust) are over the limit, never the A-dust value on its own. Silica dust values are mostly < NWG.
Influence of seized mass
Influence of seized mass on E-dust values is evaluated separately according to the cutting depth categories. Apart from the power tools PF02-E05 (relatively large mass of 14/19 kg resp., revealing low values of app. 6 or 9 mg/m³ resp.) as well as PF05-E11 (seized mass between 15 and 17 kg, together with extremely high (e.g. poor) values), all other power tools are distributed each in a point cloud for each category. While there is no apparent in-fluence of seized mass discernible for category I. For category II a slight rise of the meas-ured values parallel to an increasing seized mass can definitely be noticed.
fig. 6.4.3 - 5 Dependency of E-dust concentration on seized mass with current plaster milling ma-
chines
Individual measured values for samples adherent on person are shown
6.4.4 Additional tests
Apart from the tests with current power tool systems tests with a plaster milling machine using different mobile dust removing units of dust category H were carried out. Results can be found in chart 6.4.4 - 1 and in fig. 6.4.4 - 1, in comparison to the current system. Ob-serving the results it is apparent that a slight improvement of E-dust emissions can be found for the power tool system PF03-E10, in category I and II by using the H-mobile dust removing unit. Results however are still exceeding the limit despite the use of the dust category H unit. For category II the change of dust removing units was more useful as an average value below the limit could be obtained. Considering the scatter range of the measured values this cannot be seen as a significant improvement of dust emission. This,

77
however, also applies to the results of category I, but it is also likely for those of category II.
fig. 6.4.4 - 1 Examinations of H-dust removing units for current plaster milling machines
Average values of samples adherent on person (pers.) for E-dust with their scatter range are presented here. For comparison with measured values of H-dust removing units the conventional power tool systems are al-ways presented in the same color as circles. Other current power tool systems are presented as open circles.
Chart 6.4.4 - 1 Tested plaster milling machines with different mobile dust removing units fitted
Report number Power tool system
E-dust [mg/m³]
A-dust [mg/m³] Remarks
2005/572 Cat. 1 PF03b - E14 12.38 1.11 H-dust removing unit tested on lime-sand brick, plas-ter milling machine with pointed tooth cutter wheel
2005/1132 Cat. 2 PF03c - E16 7.71 0.49 H-dust removing unit tested on lime-sand brick, plas-ter milling machine with pointed tooth cutter wheel
6.4.5 Conclusion
Milling work carried out in the test room with the current matching plaster milling systems present an apparent decrease of dust emission compared to machines using simpler non-extraction systems.
Despite dust seizing on the machine and using extraction only 4 systems from milling category I (3 mm) as well as only 2 systems from category II (5 mm) revealed dust emis-sions below the limits.

78
The tests indicate that plaster milling machines with optimized seizing and extraction emit remarkable less. Especially seizing units with a flexible surface fitted contribute to a far amount to the reduction of dust emission. There are still a lot of necessities for developing and optimizing current system configurations to meet the limits in future.
Work with plaster milling machines definitely belongs to the most dust-intensive operations on building sites. Facing this fact, only systems matched by the manufacturer with mobile dust removing units should be used for interior plaster removing work.
6.5 Orbital and eccentric sanders
Orbital- and eccentric sanders are motorized power tools used for smoothening different materials.
The orbital sander has usually a rectangular grinding plate orbital parallel to the work sur-face. Sand paper or abrasive cloth fixed tightly to the grinding plate is used as an abrasive.
A mostly round grinding disc is fixed eccentrically to the drive shaft of the eccentric sander and may rotate free or positively-driven (hand-operated) around its own shaft. Compared to the orbital sander removal output is usually higher so even coarse grinding work is pos-sible.
In the construction industry orbital- and eccentric sanders are used especially for grinding work in the field of drywall installation. Grinding down e.g. filled joints on plasterboard large amounts of dust are generated. Health hazards may occur by released mineral dust. Or-bital- and eccentric sanders mostly feature an integrated dust extraction within the grinding disc or grinding plate. They can be operated in combination with mobile dust removing units, but this is still a rare sight today on building sites.
6.5.1 Test criteria
A team developed criteria for the dust survey of orbital and eccentric sanders on February 4th, 2005 in Feuchtwangen.
From team discussions and after considerations of pre-test findings the following criteria for test sequences of orbital and eccentric sanders arose as a result:
Only orbital- and eccentric sanders commonly used for grinding work in drywall in-stallations are scheduled for testing
All orbital- and eccentric sanders are equipped with medium grain (grain 80) sandpa-per as routinely used for work on drywall and plasterboard.
Plaster fiberboard is used as material. Filling plasterboard (on joints) as usually done on building sites and the usual smoothening shall be simulated using fiberboard units. Grinding properties of the power tools when grinding filler have to be consid-ered equivalent to grinding untreated plaster fiberboard.
The test surface is made from plaster fiberboard placed side by side on the A-support and fixed. To avoid over grinding of the edges a supporting frame is mounted all across the whole surface of the A-support.
Measuring time for all power tools is at least 45 minutes with one scheduled change of sand paper per plate. Sand paper, however, shall be changed at least according to requirements and may be carried out more often.
Seized mass is determined by weighing the complete mobile dust removing unit.

79
The power consumption of the tested power tool is monitored and recorded during the test by the PIMEX system to avoid overload. For monitoring the power consump-tion a measuring module of AHLBORN is integrated into the PIMEX periphery using the Almemo-System.
fig. 6.5.1 - 1 Test setup for orbital- and eccentric sanders
Mineral material
The plaster fiberboard used for testing are made of app. 80 percent plaster and 20 percent paper fiber without any other binding material or additives. Dry-stored boards from Fer-macell, size 1500x1000 mm, thickness 12.5 mm, were used.
6.5.2 Carrying out the test
Power tools for testing and mobile dust removing units were set according to the manufac-turer‘s data and tested using maximum output according to the manufacturers. For test sequences sand paper, grain P 80, was used.
The test wall consists of 4 dry construction boards (Fermacell 1000 mm x 1500 mm). Ac-cording to fig. 6.5.2 - 1 the boards are placed flush with the lower edge of the A-support. The edges of the grinding surface (100 mm above, 200 mm below) are furnished with a wooden frame. The surface to be ground is 5.2 m² and is marked with a pencil (marks have to be ground off).

80
fig. 6.5.2 - 1 Arrangement of dry construction fiberboard on A-support
The surface of the board is ground for app. 15 minutes. After treating each board a change of sand paper is carried out. Generally, overall measuring time was 1 hour app.
After complete removal of the marked surface the dust is determined by weighing the mo-bile dust removing unit with its tube (before and after sampling).
Three scheduled tests per item are all carried out on the same side of the board.
6.5.3 Analysis of measured values and evaluation of orbital and eccentric sanders
Target of the survey for orbital and eccentric sanders was to get a current inventory of dust emission properties of current power tool systems. Due to the different dust exposures or-bital and eccentric sanders are described separately (particulars please see below).
Eccentric sanders
For the range of eccentric sanders 15 different combinations (eccentric sander with mobile dust removing unit) were carried out.
The overview (fig. 6.5.3 - 1 up to 6.5.3 - 3) only presents current systems with combina-tions recommended by the manufacturers. (Date: 2004/2005).

81
fig. 6.5.3 - 1 E-dust individual measured values for current eccentric grinders/sanders
fig. 6.5.3 - 2 A-dust individual measured values for current eccentric grinders/sanders

82
fig. 6.5.3 - 3 Silica dust- individual measured values for current eccentric grinders/sanders
Chart 6.5.3 - 1 reveals an overview of the total number of measured values for the E-dust, A-dust and silica dust types. Also, it shows the number of values which actually could be determined ("MW =") and, again, the part of values below the detection limit ("<NWG"), classified into samples adherent on person or taken stationary. The magnitude of each de-tection limit is given in the last two columns of the chart if values <NWG are present. Due to duration differences of sampling slightly different detection limits occur. The individual values are given in chart A1 of the appendix.
As earlier tests revealed that the fixing point of the sample cover slip (either left or right to breathing area of the machine operator) might have an influence on measured values, sampling of A-dust adherent on person was carried out twice. As the silica dust value is also taken from the same sample cover slip, the number of values theoretically to be ex-pected are 45 (15*3) for E-dust (as well as values from stationary samples) and 90 (15*2*3) values for samples adherent on person for A-dust and quartz fine dust. Deviations from the number can be explained with tests not carried out, or for some examinations a fourth test was added, as well as a few missing values, especially some from stationary samples. For measured values below detection limits half of the actual limits were used as measuring result.

83
Chart 6.5.3 - 1 Number of measured values for different dust types and sampling on eccentric sanders
(P = sampling adherent on person, S = stationary sampling)
Dust type Overall number MW = < NWG ≈ NWG [mg/m³] P S P S P S P S E-dust 43 35 37 35 6 0 0.6 - A-dust 86 37 52 37 34 0 0.6 - Silica dust 88 37 7 26 81 11 0.02 0.01
Chart 6.5.3 - 2 presents all tested eccentric sanders, together with different parameters of the tests.
Chart 6.5.3 - 2 Tested eccentric sanders
Test report Power tool
Mobile dust re-moving
unit
Average seized mass [kg]
Remarks Current system harmonized by manufacturer
2005/2597 ES01 E05 2.74 Yes
2005/1516 ES02 E01 1.66 Yes
2005/788 ES03 E02 0.74 Yes
2005/571 ES04 E02 1.07 Yes
2005/827 ES05 E09 1.76 Yes
2005/835 ES06 E09 2.45 Yes
2005/834 ES07 E09 0.47
Due to enormous dust re-lease the test was
stopped, only one test se-quence was carried out
Yes
2005/785 ES08 E03 1.03 Yes
2005/1135 ES09 E18 2.34 Yes
2005/1262 ES10a E09 1.88 Test of eccentric sander with different mobile dust
removing unit No
2005/1040 ES10b E10 1.83 Yes
2005/1041 ES11 E10 1.67 Yes
2005/1325 ES12 E10 2.17 Yes
2005/2599 ES13 E04 2.72 Yes
2005/2598 ES14 E11 1.37 Yes

84
Individual values of generally 3 resp. 6 E-dust as well as 6 A-dust and silica dust meas-urements with eccentric sanders are presented in fig. 6.5.3 - 1 to fig. 6.5.3.-3.
Seized mass ranges are from 0.47 kg up to 2.72 kg with an average value of 1.69 kg.
Evaluation of the power tool system (eccentric sander and mobile dust removing unit) was carried out as specified in chapter 6.0. First of all, for each power tool system the time-weighted average value of samples adherent on person (usually three tests carried out) was calculated. This calculation was also made for A- and E-dust. The time-weighted av-erage value was then compared with the workplace limit (AGW) of the relevant dust frac-tion. In chart 6.5.3 - 3 exceedances (red) and compliances (green) of the AGW are pre-sented in color.
Based on the results (e.g. compliance of the workplace limit (AGW) for both dust types or exceedances of at least one dust type) a correlation of the power tool system to the scheme for hazard evaluation takes place. If limits are kept type I of the scheme of hazard evaluation is used. Type II of the scheme of hazard evaluation is chosen if limits are ex-ceeded.
Most of the tested eccentric sanders (ES01-E05 up to ES14-E11, except for ES04-E02 and ES07-E09) had A- and E-dust values below the limit. Doubtlessly theses systems can be classified as type I of the hazard evaluation.
Regarding the results of the power tool systems ES04-E02 and ES07-E09, these reveal drastic exceedances of A- and E- dust limits. Therefore these eccentric sanders have to be classified as type II of the hazard evaluation scheme.
Chart 6.5.3 - 3 Evaluation of current systems: eccentric sanders
Report number Power tool system E-dust [mg/m³] A-dust [mg/m³]
2005/2597 ES01 – E05 4.88 0.64
2005/1516 ES02 – E01 8.18 1.05
2005/788 ES03 – E02 0.9 0.34
2005/571 ES04 – E02 236.62 48.33
2005/827 ES05 – E09 2.07 0.80
2005/835 ES06 – E09 1.12 0.67
2005/834 ES07 – E09 70.9 20.90
2005/785 ES08 – E03 4.29 0.87
2005/1135 ES09 – E18 7.76 2.88
2005/1040 ES10b – E10 0.54 0.26
2005/1041 ES11 – E10 0.25 0.41
2005/1325 ES12 – E10 2.65 1.42
2005/2599 ES13 – E04 1.8 1.43
2005/2598 ES14 – E11 0.76 0.40
Comparing dust types
Fig. 6.5.3 – 4 gives an overview of individual values for eccentric sanders. Here time-weighted average values, generally three each for E-dust, A-dust and silica dust are pre-sented, together with their scatter range.

85
fig. 6.5.3 - 4 Overview of E-, A- and silica dust. Average values for current eccentric grind-
ers/sanders Time-weighted average values for samples adherent on person (pers.) and stationary (stat.) samples including their scatter range are shown.
fig. 6.5.3 - 5 H-dust removing unit – examinations for current eccentric grinders/sanders
Average values of samples adherent on person (pers.) for E-dust with their scatter range are presented here. For comparison with the H-dust removing units the conventional power tool systems are always presented in the same color as circles. Other current power tool systems are presented as open circles.

86
With the exception of the power tools ES04-E02 and ES07-E09 (both exceeded the A- and E-dust limits) silica dust values only play a minor role with dust exposure.
A-dust values are partly higher than the E-dust values, a matter that does not have a physical explanation. However, due to inhomogeneous dust distribution within the breath-ing area it does happen. If compared to a parallel sample these cases again reveal that rather the A-dust values are too high, as values of parallel sample are much lower.
Orbital sanders
For the range of orbital sanders 15 measurements were carried out. One test was per-formed without using a mobile dust removing unit; instead, a special filter bag was fitted to the power tool (configuration scheduled for minor work only).
The overviews (fig. 6.5.3 - 6 up to fig. 6.5.3 - 8) only show current systems with combina-tions recommended by the manufacturers. (Date: 2004/2005).
fig. 6.5.3 - 6 E-dust individual measured values for current orbital sanders

87
fig. 6.5.3 - 7 A-dust individual measured values for current orbital sanders
fig. 6.5.3 - 8 Silica dust-individual measured values for current orbital sanders

88
Chart 6.5.3 - 4 reveals an overview of the total number of measured values for the E-dust, A-dust and silica dust types. Also, it shows the number of values which actually could be determined ("MW =") and, again, the part of values below the detection limit ("<NWG"), classified into samples adherent on person or taken stationary. The magnitude of each de-tection limit is given in the last two columns of the chart if values <NWG are present. Due to duration differences of sampling slightly different detection limits occur. The individual values are given in chart A1 of the appendix.
As earlier tests revealed that the fixing point of the sample cover slip (either left or right to the breathing area of the power tool operator) might have an influence on the measured value, sampling of A-dust adherent on person was carried out twice. As the silica dust value is also taken from the same sample cover slip, the number of values theoretically to be expected are 45 (15*3) for E-dust (as well as values from stationary samples) and 90 (15*2*3) values from samples adherent on person for A-dust and silica dust. Deviations from the number can be explained with additional fourth tests carried out as well as with a few missing values, especially some from stationary samples. For values below detection limits half of the actual limits were used as measuring result.
Chart 6.5.3 - 4 Number of measured values for different dust types and samples on or-bital sanders
(P = sampling adherent on person, S = stationary sampling)
Dust type Overall number MW = < NWG ≈ NWG [mg/m³] P S P S P S P S E-dust 48 45 48 44 0 1 - 0.15 A-dust 95 45 58 43 37 2 0.5 0.15 Silica dust 95 45 15 38 80 7 0.02 0.01
Chart 6.5.3 - 5 shows the tested orbital sanders together with different parameters of the tests

89
Chart 6.5.3 - 5 Tested orbital sanders
Test report Power
tool
Mobile dust re-moving
unit
Average seized mass
[kg] Remarks
Current system harmonized by manufacturer
2005/2260 SS01a - 0.48
No dust removing unit used, instead application of special filter bag
(category M), configuration for minor work only
No
2005/2603 SS01b E05 1.78 Configuration with mobile dust re-
moving unit Yes
2005/770 SS02 E01 2.17 Yes
2005/829 SS03 E09 1.14 Yes
2005/830 SS04 E09 1.71 Yes
2005/1038 SS05 E03 1.00 Yes
2005/1039 SS06 E03 0.83 Yes
2005/786 SS07a E12 1.01 Test with dust bag Yes
2005/769 SS07b E12 0.91 Test without dust bag Yes
2005/787 SS08 E02 1.14 Yes
2005/1322 SS09 E10 1.78 Yes
2005/1324 SS10 E04 1.11 Yes
2005/1517 SS11 E04 2.85 Yes
2005/1323 SS12 E12 0.86 Yes
2005/2475 SS13 E05 2.19 Yes
Evaluation of the power tool system (orbital sander and mobile dust removing unit) was carried out as specified in chapter 6.0. First of all, for each power tool system the time-weighted average value of samples adherent on person (usually three tests carried out) was calculated. This calculation was also made for A- and E-dust. This time-weighted av-erage value was then compared with the workplace limit (AGW) of the relevant dust frac-tion. In chart 6.5.3 - 6 exceedances (red) and compliances (green) of AGW are presented in color.
Based on the results (e.g. compliance of the workplace limit (AGW) for both dust types or exceedances of at least one dust type) a correlation of the power tool system to the scheme for hazard evaluation takes place. If limits are kept type I of the scheme of hazard evaluation is used. Type II of the scheme of hazard evaluation is chosen if limits are ex-ceeded.

90
Chart 6.5.3 - 6 Evaluation of current systems: orbital sanders
Report number Power tool system E-dust [mg/m³] A-dust [mg/m³]
2005/2603 SS01b – E05 1.02 0.32
2005/770 SS02 – E01 3.54 0.82
2005/829 SS03 – E09 1.34 0.29
2005/830 SS04 – E09 2.45 0.29
2005/1038 SS05 – E03 4.46 0.76
2005/1039 SS06 – E03 6.43 0.88
2005/786 SS07a – E12 2.3 0.65
2005/769 SS07b – E12 6.67 1.51
2005/787 SS08 – E02 1.5 0.50
2005/1322 SS09 – E10 6.6 0.78
2005/1324 SS10 – E04 9.19 1.88
2005/1517 SS11 – E04 10.72 1.22
2005/1323 SS12 – E12 3.32 1.09
2005/2475 SS13 – E05 2.69 1.19
Most of the tested orbital sanders (SS01-E05 up to SS13-E11, except for SS11-E024) had their A- dust and E-dust value below the relevant limits. Doubtlessly these systems can be classified as type I of hazard evaluation.
Inspecting E-dust results the only power tool system attracting attention is SS11-E04, due to (minor) exceedances of E- dust limits. Therefore this orbital sander has to be classified as type II of the hazard evaluation scheme.
Comparing dust types
Fig. 6.5.3 – 9 gives an overview of individual values for orbital sanders. Here time-weighted average values, generally three each for E-dust, A-dust and silica dust are pre-sented, together with their scatter range.

91
fig. 6.5.3 - 9 Overview of E-, A- and silica dust. Average values for current orbital sanders Time-weighted average values for samples adherent on person (pers.) and stationary (stat.) samples including their scatter range are shown.
In general, E-dust share of limit (substance index) is larger than the A-dust part. Silica dust only plays a minor role in dust exposure.
6.5.4 Additional tests with orbital and eccentric sanders
For orbital and eccentric sanders one additional test each was carried out, compare chart 6.5.4 -1.
Apart from conventional power tool systems a test with an orbital sander equipped with another mobile dust removing system was carried out. The reason for this was that ma-chine ES 10 was intended to be technically very similar to machine ES07, which had worse results. As dust emission was enormous only one test was carried out with the power tool system ES07-E09. The additional test was actually to examine the suction out-put of the mobile dust removing unit. As fig. 6.5.4 – 1 shows, combination ES10a-E09 was doing slightly worse than the matched system ES10b-E10, but not as bad as system ES07-E09. Obviously the large dust release of power tool ES07-E09 was not only a matter of the mobile dust removing unit.

92
Chart 6.5.4 - 1 Additional tests: orbital and eccentric sanders Time-weighted average values exceeding the limits are marked red.
Report number
Power tool system
E-dust [mg/m³]
A-dust [mg/m³] Remarks
2005/1262 ES10a - E09 1.3 0.30 Test of eccentric sander with different mobile dust removing unit
2005/2260 SS01a 64.77 6.53 No mobile dust removing unit used. Instead special filter bag fitted, configuration only for minor work
Some current orbital sanders are equipped with a dust bag. One company developed a bag which additionally was equipped with a filter unit. To test the pondage of the dust bag compared to an extraction system an additional test without the scheduled mobile dust removing unit was carried out. As evident from fig. 6.5.4 - 1, without using a mobile dust removing unit, but using a filter bag, the formation of dust is definitely higher, in terms of scales, than with all harmonized systems with mobile dust removing units. This power tool, however, is only suitable for small jobs (e.g. joints).
fig. 6.5.4 - 1 Orbital sander SS01 in a conventional configuration as well as with a special filter bag only
Average values of samples adherent on person (pers.) for E-dust with their scatter range are presented here.
6.5.5 Conclusion
Current harmonized power tool systems with orbital and eccentric sanders emit very little dust compared to machines without extraction systems. It is obvious that optimizing dust seizing and extraction systems show very good results.

93
Dust emissions of nearly all power tools tested are below the required limit. With the orbital sanders there is only one single system showing slight exceedances over the limit. Two eccentric sanders, on the other hand, showed dust exposures significantly over the limit.
Against the backdrop of the results from "worst case" conditions this definitely is a very good result for both types of sanders.
6.6 Other tools used on building sites
Apart from the machine categories specified by the team a few tests were carried out with the following machine types:
1 concrete milling cutter
2 bush hammers
1 rotary hammer with extraction system
1 diamond drill with extraction system (diamond socket cutter)
There were different reasons for classifying these power tools into this group. Only some manufacturers offer these special tools with dust extraction systems so only one or two units of this rather special machine type were available (concrete milling cutter, bush hammer). Or, on the other hand only one machine was taken for dust emission measure-ments (rotary hammer, diamond drill (diamond socket cutter)).
The individual values are shown in chart A1 of the appendix. The figures 6.2 - 1 up to 6.6.2 - 4 show the results of these „other machines“ as graphs. Evaluation of these power tools can be seen in chart 6.6.2 - 1.
6.6.1 Concrete milling cutter and bush hammers
The concrete milling cutter is used, just like the concrete grinder for working on concrete surfaces. For testing the power tool was equipped with suitable cutter wheels to work on concrete. By the shape and arrangement of the cutter wheels the concrete milling cutter treats the concrete and removes generally more and coarser material than a concrete grinder.
Bush hammers are used to serrate granite or other material, i. a. to make them skid-resistant. They operate with a rotating stocker unit equipped with carbide cutter wheels featuring pyramid-shaped tips. Coarser parts of the surface material than those removed by the concrete grinder are blasted off. Great amounts of dust may be generated during these operations, the released dust might cause health hazards as it may contain particles of quartz, depending on the base. Concrete grinders and bush hammers are therefore equipped with seizing elements and operated in combination with mobile dust removing units. Power tools and mobile dust removing units are connected by an extraction tube.
Carrying out the test
On July 12th, 2004 the team specified the same test criteria for stocker machines as the ones used for concrete grinders.
Treatment was carried out by milling or by so-called „bush hammering“ of slabs. Hereby the same test conditions were applied as with concrete grinders (see chapter 6.2.1 and 6.2.2). As the coarser material cannot be seized and extracted properly, the material not

94
seized at the A-support had to be vacuumed with the mobile dust removing unit (which had to be weighed) for determination of the actually seized mass.
Analysis of measured values
The tested concrete milling cutter in combination with the mobile dust removing unit (BF01-E10) had against all expectations only removed an average of 0.4 kg, e.g. less mass of concrete than the concrete grinder and bush hammers. A-dust values from sam-ples adherent on person are all below the detection limit; values for E-dust only came up to 1/5 of the limit (10 mg/m3).
For values below the detection limit half of the detection limit was rated as result. The bush hammers values for A-dust adherent on person were also below the detection limit (<NWG’). E-dust values taken from samples adherent on person, however, are even higher compared to those from the concrete grinder but on average reach only 50 percent of the limit.
Compared to smaller power tools, power tool SM02-E02 which is bigger in dimension, re-veals higher values for all dust fractions despite the fact that the seized mass has only slightly increased. As for both the bush hammers a definite increase of dust emission, test by test, is noticeable. This, however, could also possibly be a matter of the mobile dust removing units used.
6.6.2 Rotary hammer and diamond drill (dry process)
Usually rotary hammers are not equipped with an extraction system despite the fact that enormous dust exposures may emerge on extensive work and large drill holes, depending on the base. First and foremost, this applies to overhead work at which the operator possi-bly stands „in the line of fire“. For the tests a current extraction device has been provided for the power tool. It contains a drill hole sealing sleeve with fittings to connect the appro-priate mobile dust removing unit with an extraction tube.
Diamond drills are used for counter boring large-format holes for electric sockets, switches and other electrical installations in walls and masonry. Therefore different drill bits can be fitted to the machine. For centering a center drill is used. Apart from this, an extraction unit can be fitted. In most cases, however, these devices are operated without extraction. With a high drill hole rate this, of course, leads to a high dust emission. Depending on the con-struction material quartz dust exposures that are dangerous to health may occur. For test-ing a current diamond drill including an extraction unit and an appropriate tube for connect-ing to the mobile dust removing unit, was provided.
Carrying out the test
The rotary hammer was examined during three tests. The concrete slabs fitted to the A-support were used as material for treatment. 96 drill holes were drilled per test into the concrete slabs. A 14 mm (in diameter) masonry drill was used for drilling each hole 4 cm deep into the ground. The process took app. 30 minutes.
Seized dust was detected by weighing the mobile dust removing unit before and after the test sequence. Mass of the drill dust came to 1.4 kg.
All in all three tests were carried out. However, only test equipment for samples adherent on person was used. Parallel to this, A-dust was measured by a second sampling device (FSP10). No stationary samples were taken.

95
Test criteria for diamond drill with extraction systems were specified and carried out as fol-lowing:
Big-format lime-sand brick slabs (KS-XL-PE 20-2,0, size 998x115x623 mm) were chosen. Slabs were arranged one above the other on the A-support. A grid pattern (square of 10 x 10 cm) was drawn on their surface. Pencil crosses served as starting point for the center drill of the diamond socket cutter. With a diamond drill bit the operator drilled 99 drill holes per test sequence. Each hole was app. 4 cm in depth into the ground. At first, a pre-drill was carried out; then the socket was countersunk. This procedure took about 60 minutes per test sequence. Before changing to the second slab a 5 minute break followed.
Drill dust seized by the mobile dust removing unit was determined by weighing the mobile dust removing unit before and after the test. Drill dust mass came to an average of 5.84 kg per test sequence.
Analysis of measured values
For the hammer drill only values adherent on person were seized and evaluated. All measured values are below the detection limits (<NWG’), which are relatively high due to the short measuring duration of only 30 minutes.
As for the diamond socket cutter E-dust values were pretty poor (high) with app. 7 mg/m³ whereas A-dust values came to a mere 0.7 mg/m³.
Chart 6.6.2 - 1 Evaluation of current systems: other tools Report number Power tool system Machine type E-dust
[mg/m³] A-dust [mg/m³]
2004/3699 BF01 - E10 Concrete milling cutter
2.23 0.28
2005/2604 BM01 - E05 Rotary hammer 0.55 0.55
2005/2596 DS01 – E03 Diamond socket cutter
7.23 0.65
2004/3700 SM01 - E02 Bush hammer, small
4.96 0.27
2004/3698 SM02 - E02 Bush hammer, big
7.21 1.01

96
fig. 6.6.2 - 1 E-dust- individual measured values for current other machines
fig. 6.6.2 - 2 A-dust-individual measured values for current other machines

97
fig. 6.6.2 - 3 Silica dust-individual measured values for current other machines
fig. 6.6.2 - 4 Overview of E-, A- and silica dust. Average values for current other machines Time-weighted average values for samples adherent on person (pers.) and stationary (stat.) samples including their scatter range are shown.

98
7. Evaluation of results
7.1 General evaluation of all examined categories
As far as known this survey represents the first ever systematic summary of dust emis-sions of power tool systems for work on mineral material. The tested systems give a rep-resentative selection of current machines available on the market.
Important new knowledge was gained during the survey. Now this knowledge needs to be put into practice. Up until the start of this survey comprehensive data on dust emission of hand-operated machines were not present. Observations in practice, especially on building sites, showed that harmonized power tool systems as tested within the project are seldom to be found. Workplace measurements of dust-intensive work with hand-operated ma-chines on building sites are mostly carried out without efficient extraction systems.
Despite the fact that extraction systems are available on the market, knowledge about their actual efficiency was non-existent. In order to promote the use of low-dust power tool sys-tems dependable information about their effectiveness are indispensable from the view-point of prevention. However, this information is now available for the tested machines and they are going to be published on the Internet free of charge to aid further hazard evalua-tion (www.gisbau.de).
Manufacturers associated in ZVEI provided the power tool systems as currently available on the market. In other words the tests also represent state-of-the-art technology of differ-ent power tool systems.
Fortunately results from test room tests showed significantly lower dust emission for many machine categories if the power tools were used according to the manufacturer’s advices. In fact, emissions were much lower than expected from results given by former surveys on building sites [8]. With harmonized systems there was not a single case when dust con-centrations were as high as measured during workplace measurements on building sites without efficient extraction.
7.1.1 Scatter range of individual measured values
It is common knowledge that measuring results always include measuring uncertainties [9]. To determination of dust concentration in the air adds the fact that particles do not dis-pense equally in air like gases or steam do. Depending on density and aerodynamic prop-erties of particles in the air the latter do not sink to the bottom at the same speed. There-fore, measuring uncertainty during sampling is rather large.
Due to their empirical experiences the BGIA assumes that values from dust samples may vary by a factor 2 up or down which seems common.
The arguable scatter range of individual values is composed of the measuring error (see chapter 5.5), which may also appear if the very same test sequence is measured exactly parallel and, secondly, of deviations additionally occurring from variously sized differences during test (e.g. differences while operating the machine like number of starts, interrup-tions, contact pressure, operating speed, jamming etc.).
For practical reasons and cost concerns every power tool system was generally tested in three equal test sequences (in some cases four were carried out). For some tests values for A-dust and silica dust were determined from the left as well as from the right breathing area of the operator (see chapter 7.1.3), so for these two dust types sometimes 2*3=6 resp. 2*4=8 individual values from samples adherent on person are on hand. According to sample duration for N individual values the time-weighted arithmetic average was formed, related to a dust type (E-dust, A-dust, silica dust).

99
The calculation of standard deviation from the average value (σMW) was carried out without any severity of duration on the basis of the N individual values according to the formula listed in the appendix 7.4 (fig. 7.4. - 5). The general overview chart A 1 in the appendix presents the standard deviation in percent σ (= σMW / MW). Usually differences between time-weighted average (gew. MW) and „non-weighted“ average values (MW) are rather small here so that this simplified procedure was chosen.
Convention for specification of outliers
Bearing those things in mind, for the present survey the question comes up when exactly a value has to be considered as outliers and cannot be used for evaluation of the power tool system. For that it is necessary to estimate the reliability of gained measured values. Con-fidence in the comparability is of utter importance to make sure evaluations of power tool systems are accepted and decisions are backed from all participants of the project.
The calculated standard deviations for all E-dust measurements are diagrammed in ap-pendix, fig. 7.4. - 6. For specification of outliers only measurement series with a standard deviation (σMW) exceeding 40 percent were observed. This limit of 40 percent as a criterion for the derivation of the values with extraordinary scatter range around the average value was specified by the work group for further approach. It is amazingly similar to the afore-mentioned empiric experiences of the BGIA that a variation of values from dust samples by factor 2 up and down must be considered normal. So with a measured value of 1 mg/m³: (Variations for three tests: 0.5 mg/m³; 1.0 mg/m³; 2 mg/m³; average value = 1.17 mg/m³) means a standard deviation (σMW) of 38 percent. This applies to all triple fig-ures "with factor 2 up and down".
Observing the distribution of all calculated standard deviations it is obvious that 90 percent of all standard deviations (of A-dust- and E-dust measurements) and app. 80 percent of all standard deviations (for silica dust measurements) are below 40 percent (see appendix, fig. 7.4. - 7).
Measurement series showing standard deviations for E- and A dust of more than 40 per-cent have been analyzed thoroughly. Values were only left in the database if the analysis showed that they were indeed present with such a scatter range. For this all available re-sults (values from sampling on person and stationary, results from the E/A-procedure, the Respikon as well as indications from TM-digital strain gauges or out of PIMEX signals) were taken into account. Only 10 out of 2040 values (adherent on person, stationary, E-dust, A-dust) from this enormous scatter ranger could not be verified. These values were considered outliers so they were neglected for valuation. On chart A1 (see appendix), these (outlier) values have been put into brackets.
7.1.2 Differences of samples adherent on person and stationary samples
Apart from samples adherent on person also stationary sampling was carried out during the tests. The results are all diagramed (see chart A1) and charted to clearly present the time-weighted average values as shown in fig. 7.1.2 -1 up to fig. 7.1.2 - 3 in the appendix. As the figures show, there is a certain scatter range with the quotients from the average value taken on person and the stationary average value. In average the E-dust value is two or three times that of the stationary one, for A-dust it is roughly 1 to 2 times as much. While the E-dust value from samples on person is mostly higher (with a few exceptions) than the stationary value, the stationary value of the A-dust often exceeds the other sam-ple. With silica dust the stationary value usually exceeds the sample adherent on person. In some cases halfening (values below detection limit are rated as half of the limit) could be an explanation for this matter. However, often the stationary values are significantly higher than expected from the detection limit on person. Some are even above the limit.

100
7.1.3 Differences of left and right sample holder
In order to gain experiences about the influence of the exact positioning the sample cover slip within the breathing area of the operator, a few tests A-dust samples were taken from left and right areas (the relevant power tools were orbital and eccentric sanders as well as diamond cutters). These additional results are also presented in the appendix (chart A1, see V1a, V2a etc). From these sample cover slips also silica dust was determined. So for determination of the time-weighted average value of A-dust and silica dust there were sometimes 6 - 8 values. As this number is also relevant for calculation of the standard de-viation, in these cases the value of the standard deviation is usually significantly lower than for measurement series with N=3.
While for most test sequences both values are quite close to each other, with some tests there are deviations of as much as 100 - 300 %. There is, however, a tendency that values designated as "a" often are above the „standard values“, only a few are below. Also, posi-tive deviations are larger by their amount than the negative ones.
The basis for these deviations has to be clarified on a case-by-case basis, it could not be carried out within this project. Conceivable reasons could be the influence of the geometry of the machine as well as the operating manner of the operator (where are nozzles, how is the machine held etc.).
7.2 Measurements in practice at building sites
In order to examine if the knowledge gained in the test room can be transferred into practice, workplace measurements were carried out in summer 2005 on two building sites (A and B) with a few power tool systems used in the test room. Measuring was done in cooperation with BGFE. Wall chasers of different manufacturers were tested [8]. The power tool system chosen had shown only little dust emission in the test room.
fig. 7.2 - 1 Measurements taken at work-
place
fig. 7.2 - 2 Wall chaser measured in practice

101
The wall chasers 1 and 2 had similar output data (35 mm); a lower cutting depth was used for slots cut with wall chaser 3 (25 mm). As in the test room the material was lime sand brick.
For practical measurements at building site A (compare chart 7.2 - 1) the PIMEX system was be used successfully. Recordings as well as the parallel dust sampling according to the BGIA procedure showed little dust exposure for the machine operator.
Chart 7.2 - 1 Measured values: Using harmonized wall chasers/mobile dust removing units on building site A (2005)
Dust concentration [mg/m³] Wall chaser 1
Wall chaser 2
Wall chaser 3
Adherent on person
E-dust AGW: 10 mg/m³ 7.04 11.9 0.92
A-dust AGW: 3 mg/m³ 1.7 2.82 < 0.55
Stationary inside the room
E-dust AGW: 10 mg/m³ 3.18 4.41 0.74
A-dust AGW: 3 mg/m³ 1.23 1.85 <0.55
Due to conditions at building site B (compare chart 7.2 - 2) only a single power tool system (wall chaser and mobile dust removing unit) could be used. Again, sampling adherent on person and stationary sampling was carried out in workplace.
Chart 7.2 - 2 Measured values on building site B (2005) Dust concentration [mg/m³] Wall chaser 4
Adherent on person
E-dust AGW: 10 mg/m³ 6.09
A-dust AGW: 3 mg/³ 1.47
Stationary inside the room
E-dust AGW: 10 mg/m³ 1.89
A-dust AGW: 3 mg/³ 0.54
Evaluation of the practical measurements:
For the evaluation of the practical measurements it has to be considered that there are very few values. It is noticeable that dust exposures determined during practical meas-

102
urements were sometimes slightly higher compared to the values measured in the test room.
However, it has to be considered that machines used at the building site were run for a longer time than usually necessary for executing the usual working operations. Due to that scheme measuring time for each system at the building site A was app. 45 minutes up to 1 hour. Usually the power tool systems were run for more than an hour.
Furthermore it has to be taken into account that on the building sites a significant initial dust exposure existed in the rooms.
Even if to date only few practical measurements with harmonized systems are present, two things can be stated with due care:
Examinations performed in the test room are very close to practical conditions. They give values similar to the dust exposure on building sites during use of these sys-tems.
During practical measuring in 2005 significantly lower dust exposures compared to BGFE measuring from earlier years (1998-2001) [8] were determined. The use of harmonized power tool systems and partly optimized systems had a positive effect.
Orientating measurements with wall chasers on building sites revealed that the results gained in the test room are realistic and can definitely be transferred to building site situa-tions and conditions.
7.3 Influencing factors on dust emission
Very high dust emission in the test room generally can be traced back to poorly harmo-nized systems or an insufficient seizing element of the power tool. In some cases simply changing the mobile dust removing unit led to a significant improvement.
During the survey the seizing element of the power tool and the mobile dust removing unit turned out to be the essential factor of influence for dust emission properties of the tested machine systems.
The seizing element on the tool produces the major part of the dust in the overall emission, as KLEINE (2005) explained in the workshop "Low-dust machines and devices /Staubarme Maschinen und Geräte“ [10].

103
fig. 7.3 - 1 Relation between seizing rate and depositing rate
The emission rate equals 1 if all seized material is released into the surrounding air. The emission rate (Eges) is determined by emission grade (EE) and by passaging grade of the filter element (Ena).
The diagram clearly shows that with a passaging grade of app. 0.1 and more the emission grade is of far greater importance for the emission rate than the passaging grade of the fil-ter element itself. With a dust seizing of only 50 percent an improvement of the passaging grade of the filter element (e.g. from 0.1 to 0.02) cannot cause a drastic decrease of emis-sion.
As a conclusion from these relations it can be stated that improving the seizing rate is of far greater importance than improvement of the passaging grade of the filter element. In-sufficient seizing cannot be compensated with improved filtering technology, as BETTEN (2005) pointed out impressively, also during the workshop "Low-dust machines and de-vices/Staubarme Maschinen und Geräte“ [10].

104
fig. 7.3 - 2 Efficiency of mobile dust removing units
However, in practice other factors play an important role apart from seizing rate and pas-saging grade: There is, for instance, the cleaning principle of the main filter of the dust re-moving unit, automatic or manual shakeup of the main filter and others. For an optimized power tool system all these factors have to be harmonized to ensure dust emission is as low as possible considering all working duties, including disposal of the seized and depos-ited dust.
7.3.1 Seizing element (style and size of extraction hood etc.)
Due to their different fields of application the seizing elements of the tested machines are specially adapted to their intended purpose and constructed in different ways. Therefore the seizing elements of the power tools with cutting discs (wall chasers, diamond cutters) are generally made as hoods. Seizing dust generated from orbital and eccentric sanders is done mostly through apertures within or at the edge of the grinding surface.
Especially the different kinetic energy within the particles relapsed by the machine de-mands different requirements for efficiency of the seizing unit. The latter is a lot higher with a 230 mm cutting disc than with an eccentric sander.
An important factor for high efficiency of the seizing element is a hood as closed as possi-ble guiding the exhaust air as optimal as possible. Necessary intakes have to be placed in the right positions. Apart from this, the hood has to be designed in terms of fluid mechan-ics, e.g. extraction connector in direction of dust flow. This implies that the hood should be constructed in a way so that sharp edges, rims and narrow angles are avoided, so that dust cannot set on parts that are in flow.
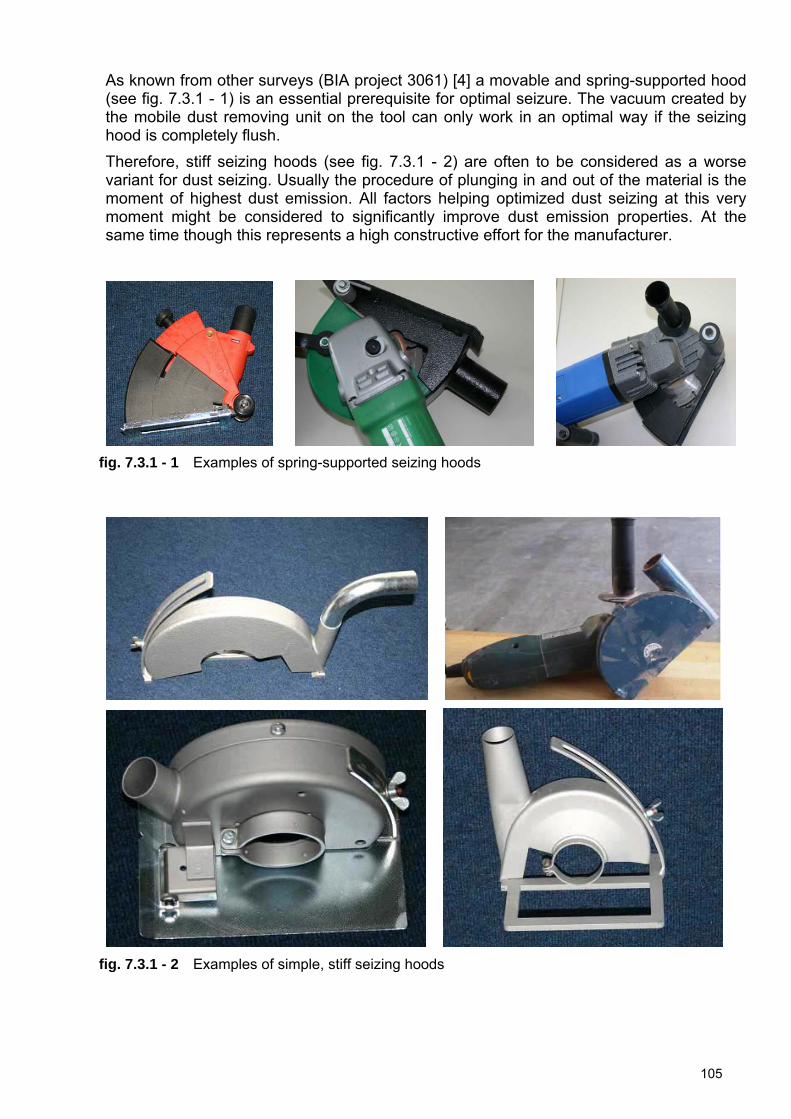
105
As known from other surveys (BIA project 3061) [4] a movable and spring-supported hood (see fig. 7.3.1 - 1) is an essential prerequisite for optimal seizure. The vacuum created by the mobile dust removing unit on the tool can only work in an optimal way if the seizing hood is completely flush.
Therefore, stiff seizing hoods (see fig. 7.3.1 - 2) are often to be considered as a worse variant for dust seizing. Usually the procedure of plunging in and out of the material is the moment of highest dust emission. All factors helping optimized dust seizing at this very moment might be considered to significantly improve dust emission properties. At the same time though this represents a high constructive effort for the manufacturer.
fig. 7.3.1 - 1 Examples of spring-supported seizing hoods
fig. 7.3.1 - 2 Examples of simple, stiff seizing hoods

106
7.3.2 Mobile dust removing unit A remarkable result of the test was the conclusion which influences the mobile dust remov-ing unit has on the complete system. Only if the connected mobile dust removing unit is matched to the performed work with the power tool ideal results can be gained according to dust emission properties.
All participants had to realize that great technical improvements have to be made. Apart from this problems might arise as the relevant standards and regulations, regarding mobile dust removing units do not match seizing mineral dust. Adjusting the existing requirements could be a measure to be taken.
The present requirements from regulations are difficult to put into practice. Especially the evaluation (carried out by the committee for hazardous materials as TRGS 906 in July 2005) for work during which silica dust is released and rating it as cancer cause gives enormous difficulties in practice. Stiff usage of these regulations formally necessitates (any) mobile dust removing unit of dust category H for work emitting or generating mineral dust including silica dust particles.
However it is far more important to use harmonized systems. Tests carried out with mo-bile dust removing units of dust category M have shown that a much larger positive effect can be reached by matching system components rather than using any non harmonized mobile dust removing unit of a higher dust category.
During a test of wall chasers (MF07) the mobile dust removing unit provided by the manu-facturer (as system component, dust category M (E01)) gave significantly lower dust emis-sion compared to other units used not recommended by the manufacturer. Despite dust category H (of a mobile dust removing unit non harmonized with the machine) dust emis-sion was higher (see also chapter 6.1.6).
The same effect was measured with diamond cutters. The combination recommended by the manufacturer of diamond cutter (TS11 b and TS11 c) and mobile dust removing unit (E01) of dust category M is the better combination (see also chapter 6.3.6).
Small, light mobile dust removing units of dust category H are currently not constantly available. Units currently available on the market and meeting the technical requirements as well as the requested dust categories are not always practice-oriented regarding size, weight and handling. Therefore practical requirements for small and light units have to be harmonized with technical possibilities of these units in the future.
Handling of mobile dust removing units plays a decisive role in mobile workplaces of the building industry. Apart from this, purchase and follow-up costs (e.g. for filters and bags for low-dust/dust-free disposal) are important. Even if dust seizing is now mandatory by the Ordinance of Hazardous Substances, acceptance of these systems will be influenced by these factors.
In a formal way, requirements for mobile dust removing units rise with the publication of the TRGS 906 in June 2005 as this rates work where silica dust is emitted as possible cancer cause. If formerly, also again considered formally, a mobile dust removing unit of dust category M for silica-containing dust types was sufficient, now dust category H must be used. However, the tests in Feuchtwangen attested that even today a mobile dust re-moving unit, used as a harmonized system, category M is sufficient according to its protec-tive effect. Optimized systems with matching mobile dust removing units of category H will lead to further decrease of exposure and simultaneously fulfill legal requirements. Devel-opment of mobile dust removing units of category H, compact and easy to handle, rough enough for use on building sites and suited for mineral dusts needs to be promoted.
In the past primarily developed for removing wooden dusts these types of mobile dust re-moving units cannot cope with mineral dust due to technical limits. Especially seizing large dust amounts puts high demands on cleaning the main filter. Under building-site conditions

107
paper as filter bag material seems unsuitable. Tests reveal that the fine dust particles of the mineral dust quickly clog up the pores of the filter. As a result, the volume flow monitor-ing of the mobile dust removing unit reacts. It gives a warning sound or permanently shakes the main filter making a change of the filter element necessary.
During tests some filters had to be changed after only 10 - 20 minutes. However, inside the bag was only little seized dust (app. 1.2 – 1.3 kg).
7.3.3 PIMEX-records (observations)
These observed effects can be seen very well on the PIMEX-records. The system displays the course of the determined dust concentration during work. It can be observed that weak points of the power tool system obviously cause a characteristic dust concentration run. For comparison, fig. 7.3.3 - 1 shows the progress of a system harmonized by the manufac-turer. It is obvious that the low dust concentration stays constant throughout the complete measuring time.
fig. 7.3.3 - 1 Time dependent course of dust concentration of a harmonized system
In fig. 7.3.3 -2 a power tool system is shown with a seizing unit on the tool that does not work well and a great part of the emitted dust is not seized. The effect appears immedi-ately (as soon as starting work with the power tool) and lasts until the test is terminated (due to extreme dust exposure).

108
fig. 7.3.3 - 2 Power tool system with unsuitable seizing element
Figure 7.3.3 - 3 shows a power tool system with a mobile dust removing unit which cannot cope permanently with the emitted dust amounts. In the beginning the dust seizing system works well for about 6 minutes. During this time, however, the main filter seems to clog up completely. After only 6 minutes there is very little extraction power left, the dust concen-tration increases rapidly. Obviously the filter cleaning mechanism on this system is not suf-ficient enough to guarantee a permanent extraction output.

109
fig. 7.3.3 - 3 Power tool system with unsuitable dust removing unit
7.4 Comparing different machine categories
Measured values for individual machine categories (eccentric sander, wall chaser, dia-mond cutter, etc.) and all dust types (E-dust, A-dust and silica dust) are compared in the following.
For individual values of samples adherent on person the frequency distribution was deter-mined. By diagramming the percentile values the different number of measured values (for eccentric sander, wall chaser etc.) is standardized to the same width in the diagram. How-ever, this process does only makes sense with at least 10 to 20 values and upwards so the „other devices“ (concrete milling cutter, rotary hammer, socket cutter, bush hammer) were not taken into account. In the considered machine categories the size of the individ-ual collectives was 36 to 110 values. Bigger differences in numbers arise especially for A-dust and silica dust due to only partially taken samples from the left and right side.
The figures 7.4 - 1 to 7.4 - 3 show the distribution of measuring values for A-dust, E-dust and silica dust for the following machine categories: concrete grinder, eccentric sander, wall chaser, plaster milling machine and abrasive grinder. In the sequence of machine categories listed there the dust exposure generally increases. Median values (50 percen-tile values, half of all measured values are smaller or equal to this value) for E-dust for ex-ample rise from 1.27 mg/m³ (concrete grinder) for concrete grinders to more than 10.1 mg/m³ for plaster milling machines and to 18.7 mg/m³ for abrasive cutters. A compa-rable increase can be found for all three dust types in the range of 20 percentile up to 80 percentile. However, occasionally there are overlaps.

110
fig. 7.4 - 1 All E-dust measured values
fig. 7.4 - 2 All A-dust measured values

111
fig. 7.4 - 3 All silica dust measured values
Deviations of low values (most notably of A-dust and silica dust) are based on measure-ments with results lower than the detection limit. These, however, lead to the bends in oth-erwise almost linear sections of the distribution curve (logarithmic scaling!). For concrete grinders, eccentric and orbital sanders the silica dust values are usually below the limit: up to 80 percentile all values were close to 0.01 mg/m³.
In the range of high exposures e.g. above the 80 percentile value the graphic distributions no longer run clearly next to each. Obviously some extreme values of wall chasers, plaster milling machines and eccentric sanders distort the image.
The evaluation of power tool systems within this research project was carried out in a standardized way for all machine categories with workplace limits for E-dust and A-dust which are 10 mg/m³ and 3 mg/m³ resp. observing the distribution curves for E-dust and A-dust and for all machine categories this procedure seems acceptable. As evident from fig. 7.4 - 4 the limits are in the range of 70 to 80 percentile values for the relevant overall data collectives.

112
fig. 7.4 - 4 All dust types, all machine categories

113
8 Conclusion and outlook
Within this survey, it was possible for the first time to test about 100 power tool systems consisting of machine and mobile dust removing unit under comparable basic conditions. With these power tool systems the efficiency of dust seizing was tested under practical conditions. Most of the tested systems show at least adequate efficiency.
Machine runtimes preset by the test procedure might be significantly shorter in practice. Against the backdrop of partly lower dust concentrations it can therefore be assumed in many cases that workplace limits are kept if a system recommended and harmonized by the manufacturer is used.
On the basis of this survey support for the hazard evaluation can now be developed for dif-ferent power tool systems. Without this hazard evaluation, compulsory according to the Labour Protection Act and the Ordinance of Hazardous Substances, no employer may al-low work to be taken up where mineral dust is emitted.
Transferring the results of this survey into practice is one of the important duties in the fu-ture. The essence in the future will be to prompt the firms only to use power tool systems recommended and harmonized by the manufacturers in the future. How-ever, in the survey also differences between systems currently on the market were no-ticed. With systems releasing high amounts of dust important suggestions for improvement were given to the manufacturers.
Still, the use of mobile dust removing units, for removing the dust during work, is far from common on building sites today. Only in very few cases (e.g. if wall chasers are used in-side) combinations of power tool and mobile dust removing unit can be met on site. In many cases though non harmonized system components are combined. As the systems, especially at their tubular connecting points are rarely compatible, the operators often im-provise. Insulation tape ("Silvertape") is therefore often used as the universal adapter. Re-garding efficiency of dust seizing these systems never reach the efficiency of a system recommended and harmonized by the manufacturer.
It is not surprising that during dust exposure measurements on building sites (as carried out by BGFE during the years 1998 to 2001) [8] using wall chasers) with mainly non-matching systems relatively high dust exposure was measured.
However, the Ordinance of Hazardous Substances now valid since January 1st, 2005 takes a firm stand on this matter, as stated in the appendix III, No 2. The appendix „par-ticulate hazardous substances“ requires efficient dust seizing directly on the machine and also evidence of its efficiency before the very first use.
Contrary to this demand of the ordinance the use of mobile dust removing units on building sites unfortunately is still not common practice. So the first step will be to put harmonized systems (machine and mobile dust removing unit) into everyday practice.
This present survey impressively shows that dust concentration can be reduced many times over. Partly the dust exposure can be reduced by the factor 1000 if extraction sys-tems are used.
A comprehensive use of these systems in working practice on building sites would cause a drastic improvement e.g. lowering of dust emission during operations with these machines. Also direct follow-up stress by permanently raised dust layers would then be reduced. So promoting the introduction of these systems into everyday building work seems at the moment to be far more important than a further reduction of dust emission of current avail-able harmonized systems.
Apart from measured values and data gained within the present survey this knowledge is the most important message for practice. Only if the use of harmonized systems and also when cleaning of the building site with existing mobile dust removing systems is current

114
practice, a orientation towards obtaining machines with supposed better values in tests (e.g. supposed lower dust emission) is suitable. It must be assumed in any case that sys-tems that showed rather poor results in the tests are going to be modified by the manufac-turers soon.
During the project a workshop called "Low-dust machines and devices“ was carried out [10]. Target of the event was to incorporate impulses and suggestions from practice into current tasks. At the well-attended event first results of the research project were pre-sented and discussed by the participants. It was also obvious that in the present situation it matters first and foremost to put extraction and harmonized systems into practice. In small companies the reality is to rather use existing non harmonized systems, if a mobile dust removing unit is used at all.
Based on this scheme steps are taken in agreement with all participants which shall lead to a decrease of mineral dust exposure. In the end the target is to record results and agreed schemes within an industry regulation consequently creating a widespread accep-tance.

115
9. Literature (German)
[1] Verordnung zum Schutz vor Gefahrstoffen (Gefahrstoffverordnung - GefStoffV) vom 23. September 2004 (BGBl. I S. 3758), geändert durch Artikel 2 der Verordnung vom 23. Dezember 2004 (BGBl. I S. 3855).
[2] Technische Regeln für Gefahrstoffe: "Arbeitsplatzgrenzwerte" (TRGS 900). Ausg. Januar 2006. BArbBl. (2006) Heft 1, S. 41.
[3] Technische Regeln für Gefahrstoffe: "Verzeichnis krebserzeugender Tätigkeiten oder Verfahren nach § 3 Abs. 2 Nr. 3 GefStoffV" (TRGS 906). Ausg. Juli 2005. BArbBl. Heft 7 / 2005 S. 79.
[4] Georg, Hartmut.: Untersuchungsbericht - Staubemission beim Einsatz von Mauer-nutfräsen; Projekt 3061 des Berufsgenossenschaftlichen Institut für Arbeitsschutz (BGIA), St. Augustin (2003).
[5] Grabriel, S.; Voitl, S.; Charissé, M.; Deppe, D.: Das Qualitätsmanagementsystem im Berufsgenossenschaftlichen Messsystem Gefahrstoff – BGMG; in. Gefahrstoffe- Reinhaltung der Luft, 66(2006) Nr. 1/2 Januar/Februar; St. Augustin (2006).
[6] BGIA-Arbeitsmappe Messung von Gefahrstoffen. Hrsg.: Berufsgenossenschaftli-ches Institut für Arbeitsschutz – BGIA, Sankt Augustin. Berlin: Erich Schmidt 1989 –Losebl.-Ausg.
[7] Technische Regeln für Gefahrstoffe: "Ermittlung und Beurteilung der Konzentratio-nen gefährlicher Stoffe in der Luft in Arbeitsbereichen" (TRGS 402). Ausg. Novem-ber 1997. BArbBl. Heft 11 / 1997 S. 27.
[8] Betten, U.; Böckler, M.; Piskorz, M.; Georg, H.: Kleine, H.; von der Heyden, T.,: Mauernutfräsen - Handlungshilfen zum staubarmen Einsatz bei der Elektroinstalla-tion; BG/BIA-Report; Hrsg. Hauptverband der gewerblichen Berufsgenossenschaft (HVBG), St. Augustin (2005).
[9] Kessel, W.: Messunsicherheit, ein wichtiges Element der Qualitätssicherung, PTB-Mitteilungen 108, S. 377-382; Braunschweig (1998)
[10] Workshop - Staubarme Maschinen und Geräte, Bayerische Baukademie, Mai 2005 (www.gisbau.de)

116
Appendix This appendix incorporates:
Chart A 1: overview of all measured values
Support for the hazard evaluation Type I and II using the example of wall chasers
figures 7.1.2 - 1 up to 7.1.2 - 3 for differences of samples adherent on person and stationary sampling
figures 7.4 - 5 up to 7.4 - 7 for scatter ranges of measurement values

C
har
t A
1: O
verv
iew
of
all m
easu
red
val
ues
(V
1 ...
V4a
), t
ime-
wei
gh
ted
ave
rag
e va
lues
(g
ew. M
W)
and
sta
nd
ard
dev
iati
on
s o
s =
co
mm
erci
ally
ava
ilab
le s
yste
m, P
N-A
rt =
sam
ple
typ
e (a
dh
eren
t o
n p
erso
n /
stat
ion
ary)
; o
utl
iers
are
pu
t in
bra
cket
s
On
case
s m
arke
d * A
-dus
t val
ue is
sig
nific
antly
hig
her t
han
E-d
ust v
alue

Draft - Type I -
Dust exposure from working with wall chasers cutting depth up to 30 mm
wall chaser XY with dust extractor Z
System description In preparation for laying cables or pipework under plas-ter, it is common for some sectors of the industry to cut grooves in the subsurface (e.g. brickwork). Electric wall chasers are usually used for this purpose. This activity generates harmful mineral dust that must be effectively extracted. The processing system must be in accordance with the system configuration specified by the manufacturer. The system consists of wall chaser XY with dust ex-tractor Z. Both devices are connected by a suction hose recommended by the manufacturer. This information only applies to the equipment configu-ration recommended by the manufacturer and refers to approved cutting depth up to 30 mm. Threshold values and classifications
General threshold value for dust, inhalable fraction, 10 mg/m³ General threshold value for dust, respirable (al-veolar) fraction 3 mg/m³ ---------------------------------------------------------------------- Activities or processes in which employees are exposed to respirable (alveolar) quartz dusts are designated as carcinogenic (category 1) in accor-dance with TRGS 906.1
Measurement of hazardous materials When working without extraction, the exposure limits are always — sometimes by 100 fold — exceeded. Informed investigations as well as work place meas-urements have shown that when using equipment with extraction and observing the measures provided in this sheet, the general threshold values for dust can be maintained. The fraction of quartz in the released dust depends on the material being processed.
Risks to health Long-term work under the exposure to dust can result in damage to the respiratory tract and lungs. The quartz-containing fraction in dusts can also lead to changes in the lung tissues. Quartz dust can cause silicosis; in certain instances lung cancer may develop. Hygiene measures Avoid contact with eyes! Thoroughly wash skin before every break and at the end of a period of work! Use skin-care products after work (regreasing cream). Change clothing at the end of a working period! Store street clothing and working clothing separately! 1 The technical regulations relating to respirable (alveolar) quartz dust are currently under review.
Technical and organisational protective measures Read the user's guide! Work with a supply of fresh air! Open windows or doors, no draught! Only operate wall chaser with the dust extractor con-nected! Only use the suction hose recommended by the manufacturer. Do not tamper with the suction hose. Service the dust extractor regularly. During use check the operation and suction efficiency. If stone chippings get into the suction hose, stop work and clean out the hose. Avoid kinks in the suction hose.
Keep your workplace clean. Do not sweep up dry dust, do not blow dust away with
compressed air, instead vacuum up the dust! Provide washing facilities on site. Personal protection Eye protection (goggles) and hearing protection! Preventive medical check-ups Preventative medical check-ups must be provided in consultation with the works doctor. First aid After Eye contact: Rinse with water. After Inhalation: Bring the affected person out into the fresh air. Disposal Tightly seal the dust extractor bag (dust collector) and dispose of it (e.g. dry bulk container). In the event of damage Report all faults/damage to equipment for capturing or precipitating dust to superiors immediately and only continue working when the fault/damage has been rectified.
Copyright by GISBAU 03/2006
Please reproduce!

Draft - Type II -
Dust exposure from working with wall chasers cutting depth up to 30 mm
wall chaser XY with dust extractor Z
System description In preparation for laying cables or pipework under plaster, it is common for some sectors of the industry to cut grooves in the subsurface (e.g. brickwork). Electric wall chasers are usually used for this purpose. This activity generates harmful mineral dust that must be effectively extracted. The processing system must be in accordance with the system configuration specified by the manufacturer. The system consists of wall chaser XY with dust extractor Z. Both devices are connected by a suction hose recommended by the manufacturer. This information only applies to the equipment configuration recommended by the manufacturer and refers to approved cutting depth up to 30 mm. Threshold values and classifications
General threshold value for dust, inhalable fraction, 10 mg/m³ General threshold value for dust, respirable (alveolar) fraction 3 mg/m³ --------------------------------------------------------------------- Activities or processes in which employees are exposed to respirable (alveolar) quartz dusts are designated as carcinogenic (category 1) in accordance with TRGS 906.1
Measurement of hazardous materials When working without extraction, the exposure limits are always — sometimes by 100 fold — exceeded. Informed investigations have shown that threshold values are exceeded when using this equipment with extraction. The fraction of quartz in the released dust depends on the material being processed.
Risks to health Long-term working under the exposure to dust can result in damage to the respiratory tract and lungs. The quartz-containing fraction in dusts can also lead to changes in the lung tissues. Quartz dust can cause silicosis; in certain instances lung cancer may develop.
Hygiene measures Avoid contact with eyes! Thoroughly wash skin before every break and at the end of a period of work! Use skin-care products after work (re-greasing cream). Change clothing at the end of a working period! Store street clothing and working clothing separately!
1 The technical regulations relating to respirable (alveolar) quartz dust are currently under review.
Technical and organisational protective measures Read the user's guide! Work with a supply of fresh air! Open windows or doors, no draught! Only operate wall chaser with the dust extractor connected! Only use the suction hose recommended by the manufacturer. Do not tamper with the suction hose.
Service the dust extractor regularly. During use check the operation and suction efficiency. If stone chippings get into the suction hose, stop work and clean out the hose. Avoid kinks in the suction hose.
Keep your workplace clean. Do not sweep up dry dust, do not blow dust away with compressed
air, instead vacuum up the dust! Provide washing facilities on site.
Personal protection Eye protection (goggles) and hearing protection! Respiratory protection: When working with this wall chaser XY with dust extractor Z, respiratory protection must be used: particle filter half-mask FFP2.
Employment restrictions Young persons may not work with this. Expectant or breast-feeding mothers must not handle this material.
Preventive medical check-ups As he workplace threshold limit is not maintained, preventative medical examination, in consultation with works doctor should be provided.
First aid After Eye contact: rinse generously with water. After Inhalation: Bring the affected person out into the fresh air.
Disposal Tightly seal the dust extractor bag (dust collector) and dispose of it (e.g. dry bulk container).
In the event of damage Report all faults/damage to equipment for capturing or precipitating dust to superiors immediately and only continue working when the fault/damage has been rectified.
Copyright by GISBAU 03/2006
Please reproduce!

124
figures 7.1.2 - 1 up to 7.1.2 - 3 for differences of samples adherent on person and stationary sampling
Quotient P/S
fig. 7.1.2 - 1 Comparing samples for A-dust: adherent on person and stationary samples
Po
wer
To
ol S
yste
m

125
Quotient P/S
fig. 7.1.2 - 2 Comparing samples for A-dust: adherent on person and stationary samples
Po
wer
To
ol S
yste
m

126
Quotient P/S
fig. 7.1.2 - 3 Comparing samples for silica dust: adherent on person and stationary samples
Po
wer
To
ol S
yste
m

127
figures 7.4 – 5 up to 7.4 – 7 for scatter ranges of values
fig. 7.4 - 5 Calculation of standard deviations
fig. 7.4 - 6 E-dust – standard deviations

128
fig. 7.4 - 7 Standard deviations for E-dust of average values from samples adherent on per-son are shown
Standard deviations of mean values for E-dust, A-dust and silica dust sampling at the person are presented here.

129
Figure index fig. 5.3 - 1 Hall 17 before its transformation into test room ...................................................16 fig. 5.3 - 2 Hall 17 before transformation ..............................................................................17 fig. 5.3 - 3 Hall 17 after its transformation with vestibule in the front, test room in the back.17 fig. 5.3 - 4 A-support for material reception in test room.......................................................17 fig. 5.3 - 5 sketch of the A-support........................................................................................18 fig. 5.3 - 6 sketch of the A-support........................................................................................18 fig. 5.3 - 7 rack with support for material treatment ..............................................................18 fig. 5.3 - 8 One of the two high-performance ventilators.......................................................19 fig. 5.3 - 9 TM-Digital mounted on pole.................................................................................19 fig. 5.3 - 10 TM-Digital ............................................................................................................19 fig. 5.3 - 11 Philips PM 8118 curve plotter ..............................................................................20 fig. 5.4.1 - 1 RESPICON and its three stepped collection system ...........................................21 fig. 5.4.1 - 2 GSP and 2x FSP-10 as well as RESPICON adherent on person .......................22 fig. 5.4.2 - 1 Stationary sampling - Gravikon PM 4 G and Gravikon PM 4 F ...........................23 fig. 5.4.3 - 1 principle of PIMEX-measurement (observation) ..................................................24 fig. 5.4.3 - 2 camera fitted with rain cover................................................................................25 fig. 5.4.3 - 3 Signal amplifier ....................................................................................................25 fig. 5.4.3 - 4 Bluetooth data logger and receiver on notebook .................................................25 fig. 5.4.3 - 5 Example of PIMEX-measurement (observation) .................................................26 fig. 5.10 - 1 Kern DS 65 precision scale .................................................................................29 fig. 5.10 - 2 weighing the mobile dust removing unit...............................................................29 fig. 6.1.1 - 1 Carbide tipped milling head for 20° groove (characteristic) and cutaway view of
diamond cutting discs ..........................................................................................32 fig. 6.1.2 - 1 Arrangement of the lime stone slabs on the A-support........................................34 fig. 6.1.3 - 1 E-dust individual measured values for current wall chasers................................38 fig. 6.1.3 - 2 A-dust individual measured values for current wall chasers................................38 fig. 6.1.3 - 3 Silica dust-individual measured values for current wall chasers..........................39 fig. 6.1.3 - 4 Overview of E-dust, A-dust and silica dust. Average values for current wall
chasers ................................................................................................................39 fig. 6.1.3 - 5 Influence of cutting depth on dust concentration for wall chaser MF02-E06 .......40 fig. 6.1.3 - 6 Optimization approaches for wall chaser MF05...................................................40 fig. 6.1.3 - 7 H-dust removing unit-tests of wall chasers ..........................................................41 fig. 6.1.3 - 8 Prototype-tests of wall chasers............................................................................41 fig. 6.2.1 - 1 Concrete slabs on A-support ...............................................................................48 fig. 6.2.2 - 1 Assembly of concrete slabs on A-support ..........................................................49 fig. 6.2.3 - 1 E-dust-individual measured values for current concrete grinders........................50 fig. 6.2.3 - 2 A-dust individual measured values for current concrete grinders........................50 fig. 6.2.3 - 3 Silica dust- individual measured values for current concrete grinders.................51 fig. 6.2.3 - 4 Overview of E-dust, A-dust and silica dust-average measured values for current
concrete grinders .................................................................................................51 fig. 6.2.4 - 1 Prototype tests for concrete grinders...................................................................56 fig. 6.3.1 - 1 Supporting framework for resting concrete slabs for testing diamond cutters .....57 fig. 6.3.2 - 1 Arrangement of concrete slabs on framework. ....................................................59 fig. 6.3.3 - 1 E-dust individual measured values for current diamond cutters ..........................60 fig. 6.3.3 - 2 A-dust individual measured values for current diamond cutters ..........................60 fig. 6.3.3 - 3 Silica dust-individual measured values for current diamond cutters....................61 fig. 6.3.3 - 4 Overview of E-, A- and silica dust. Average measured values for current diamond
cutters ..................................................................................................................65 fig. 6.3.4 - 1 H-Dust removing units and examinations of current diamond cutters .................67 fig. 6.3.4 - 2 Prototypes and tests for current diamond cutters ................................................68 fig. 6.4.2 - 1 Arrangement of lime-sand hollow blocks on A-support ......................................70 fig. 6.4.3 - 1 E-dust individual measured values for current plaster milling machines .............71 fig. 6.4.3 - 2 A-dust individual measured values for current plaster milling machines .............71 fig. 6.4.3 - 3 Silica dust-individual measured values for current plaster milling machines .......72 fig. 6.4.3 - 4 Overview of E-, A- and silica dust. Average values for current plaster milling
machines .............................................................................................................75

130
fig. 6.4.3 - 5 Dependency of E-dust concentration on seized mass with current plaster milling machines .............................................................................................................76
fig. 6.4.4 - 1 Examinations of H-dust removing units for current plaster milling machines ......77 fig. 6.5.1 - 1 Test setup for orbital- and eccentric sanders.......................................................79 fig. 6.5.2 - 1 Arrangement of dry construction fiberboard on A-support...................................80 fig. 6.5.3 - 1 E-dust individual measured values for current eccentric grinders/sanders .........81 fig. 6.5.3 - 2 A-dust individual measured values for current eccentric grinders/sanders .........81 fig. 6.5.3 - 3 Silica dust- individual measured values for current eccentric grinders/sanders ..82 fig. 6.5.3 - 4 Overview of E-, A- and silica dust. Average values for current eccentric
grinders/sanders ..................................................................................................85 fig. 6.5.3 - 5 H-dust removing unit – examinations for current eccentric grinders/sanders......85 fig. 6.5.3 - 6 E-dust individual measured values for current orbital sanders ............................86 fig. 6.5.3 - 7 A-dust individual measured values for current orbital sanders ............................87 fig. 6.5.3 - 8 Silica dust-individual measured values for current orbital sanders......................87 fig. 6.5.3 - 9 Overview of E-, A- and silica dust. Average values for current orbital sanders ...91 fig. 6.5.4 - 1 Orbital sander SS01 in a conventional configuration as well as with a special filter
bag only ...............................................................................................................92 fig. 6.6.2 - 1 E-dust- individual measured values for current other machines..........................96 fig. 6.6.2 - 2 A-dust-individual measured values for current other machines...........................96 fig. 6.6.2 - 3 Silica dust-individual measured values for current other machines.....................97 fig. 6.6.2 - 4 Overview of E-, A- and silica dust. Average values for current other machines ..97 fig. 7.1.2 - 1 Comparing samples for A-dust: adherent on person and stationary samples ...124 fig. 7.1.2 - 2 Comparing samples for A-dust: adherent on person and stationary samples ...125 fig. 7.1.2 - 3 Comparing samples for silica dust: adherent on person and stationary samples
...........................................................................................................................126 fig. 7.2 - 1 Measurements taken at workplace ....................................................................100 fig. 7.2 - 2 Wall chaser measured in practice......................................................................100 fig. 7.3 - 1 Relation between seizing rate and depositing rate ............................................103 fig. 7.3 - 2 Efficiency of mobile dust removing units............................................................104 fig. 7.3.1 - 1 Examples of spring-supported seizing hoods ....................................................105 fig. 7.3.1 - 2 Examples of simple, stiff seizing hoods .............................................................105 fig. 7.3.3 - 1 Time dependent course of dust concentration of a harmonized system ...........107 fig. 7.3.3 - 2 Power tool system with unsuitable seizing element...........................................108 fig. 7.3.3 - 3 Power tool system with unsuitable dust removing unit ......................................109 fig. 7.4 - 1 All E-dust measured values ...............................................................................110 fig. 7.4 - 2 All A-dust measured values ...............................................................................110 fig. 7.4 - 3 All silica dust measured values..........................................................................111 fig. 7.4 - 4 All dust types, all machine categories................................................................112 fig. 7.4 - 5 Calculation of standard deviations.....................................................................127 fig. 7.4 - 6 E-dust – standard deviations .............................................................................127 fig. 7.4 - 7 Standard deviations for E-dust of average values from samples adherent on
person are shown ..............................................................................................128

131
Chart index Chart 5.4 - 1 Key figures of sampling- and analysis procedures from BGIA, taken from BGIA-
workfile[6] ..........................................................................................................20 Chart 5.4 - 2 Relative detection limits in mg/m³ during research............................................26 Chart 6.1 - 1 Overview: Cutting depth categories...................................................................31 Chart 6.1.3 - 1 Number of values for different dust types and sampling from wall ....................35 Chart 6.1.3 - 2 Tested wall chasers ...........................................................................................35 Chart 6.1.3 - 3 Evaluation of current power tool systems: wall chasers ....................................42 Chart 6.1.4 - 1 Additional tests – wall chasers...........................................................................45 Chart 6.2.3 - 1 Number of measured values for different dust types and sampling from concrete
grinders .............................................................................................................52 Chart 6.2.3 - 2 Tested concrete grinders ...................................................................................53 Chart 6.2.3 - 3 Evaluation of current power tool systems: concrete grinders ............................54 Chart 6.2.4 - 1 Tested concrete grinders, non-current systems.................................................55 Chart 6.3.3 - 1 Number of measured values for different dust types and samples with diamond
cutters................................................................................................................61 Chart 6.3.3 - 2 Tested diamond cutters .....................................................................................62 Chart 6.3.3 - 3 Evaluation of current systems: diamond cutters ................................................64 Chart 6.3.4 - 1 Tested diamond cutters, non-current units ........................................................66 Chart 6.4.3 - 1 Number of measured values for different dust types and samples on plaster
milling machines................................................................................................72 Chart 6.4.3 - 2 Tested plaster milling machines.........................................................................73 Chart 6.4.3 - 3 Evaluation of current systems: plaster milling machines ...................................74 Chart 6.4.4 - 1 Tested plaster milling machines with different mobile dust removing units fitted
..........................................................................................................................77 Chart 6.5.3 - 1 Number of measured values for different dust types and sampling on eccentric
sanders..............................................................................................................83 Chart 6.5.3 - 2 Tested eccentric sanders...................................................................................83 Chart 6.5.3 - 3 Evaluation of current systems: eccentric sanders..............................................84 Chart 6.5.3 - 4 Number of measured values for different dust types and samples on orbital
sanders..............................................................................................................88 Chart 6.5.3 - 5 Tested orbital sanders .......................................................................................89 Chart 6.5.3 - 6 Evaluation of current systems: orbital sanders ..................................................90 Chart 6.5.4 - 1 Additional tests: orbital and eccentric sanders...................................................92 Chart 6.6.2 - 1 Evaluation of current systems: other tools .........................................................95 Chart 7.2 - 1 Measured values: Using harmonized wall chasers/mobile dust removing units
on building site A (2005)..................................................................................101 Chart 7.2 - 2 Measured values on building site B (2005) .....................................................101


![Parameterization of Respiratory Peripheral Drive in ... · were tested [Larraza et al., 2015a,b]. The models have not been tested on spontaneous breathing patients, who are not mechanical](https://img.pdfslide.net/doc/110x75/5eca53dbf9c8b5322c7ba639/parameterization-of-respiratory-peripheral-drive-in-were-tested-larraza-et.jpg)