Embed Size (px)
Citation preview

Acknowledgments
I want to begin with a sentence that describes this Master’s degree for me: “Happy
people remember the past with gratitude, rejoice in the present and face the future without
fear.” – Epicuro.
I have to say that I desired to attend this Master’s degree even when I was in my
second year of graduation. In that year (2010) I went to a lecture with several of my current
teachers and I realized that this area would be a great, or better said, the best way to go
ahead in life.
I will remember everything of these two years. My colleagues, the teachers, the
secretary (Patrícia), the people in the CINTESIS and CIDES department. They have really
helped me to achieve what I’ve always wanted: to have a Master’s degree!
First, I want to thank myself. For all my effort, for surviving the adversities, for saying
no to the impossible. I’ve always believed in myself, but to finish this, after all that I went
through this last year, is really a way of proving to myself who I am.
Secondly, I want to thank my parents and brother. They are my foundation and the
people that never give up on me. Even when I try to say that I cannot make it, they forbid
me of doing that.
Thirdly, to Pedro Pereira Rodrigues, my teacher and mentor. I have to say that you’ve
always backed me up. You’ve always trusted my work and me. I really appreciate all that
you did for me and thanks for keeping believing in me. For me, you are not the “feared
teacher” but the best teacher. I hope that our friendship continues.
Finally, to the Sleep Laboratory team of Vila Nova de Gaia/Espinho Hospital Center,
especially Liliana Leite, and the Informatics Department in the name of Eng. Domingos
Pereira and Eng. Joaquim Pereira. Without them I wouldn’t be allowed to collect the data.
iii


Abstract
Introduction: In Obstructive Sleep Apnea, respiratory effort is maintained but ventilation
decreases or disappears because of the partial or total occlusion in the upper airway. It
affects about 4% of men and 2% of women in the world population. The major risk
factors include obesity, advanced age and male sex. Diagnostic is based in signs and
symptoms during a sleep testing – polysomnography.
Aim: To define a new auxiliary diagnostic method that can support the decision to
perform polysomnography, based on signs and symptoms, prioritizing patients.
Methods: Data was retrospectively collected from medical histories and a total of 39
variables were defined from a literature review. Only adult’s patients referred to
polysomnography and with suspicion of obstructive sleep apnea at the Vila Nova de
Gaia/Espinho Hospital Center were included. A pre-processing analyse of the data were
performed, and continuous variables were categorized. Two datasets were obtained and
two plus two Bayesian models were build (Naïve Bayes and Tree augmented Bayesian
networks. The sensitivity and specificity were analysed to determine their performance.
Results: We considered for building the models 194 patients, 128 (66%) with obstructive
sleep apnea diagnosis. The first dataset have missing values and was used the selection of
the significant variables. The second dataset, with the assumption “No” in the missing
values, were used to build the two plus two models. This and the dataset from a previous
work were comparable and significance differences were found, leading to the use of these
new datasets. The chosen model were Tree augmented Bayesian network with the
selection variables: gender; neck circumference; craniofacial and upper airway
abnormalities; witnessed apneas; nocturia; alcohol before sleep; Epworth Somnolence
Scale; concentration decrease; atrial fibrillation; stroke; myocardial infarction; truck driver
and daytime sleepiness, with sensitivity of 81% and a positive predictive value of 76%.
Discussion: Our study reveals a proportion of 34% of normal results obtained in
polysomnography, leading to the need of a good clinical decision support tool.
Keywords: obstructive sleep apnea, risk factors, diagnosis, Bayesian network, clinical model,
sensitivity and specificity
v
Resumo
Introdução: Na Síndrome da Apneia Obstrutiva do Sono, o esforço respiratório é mantido
mas há diminuição/ausência da ventilação devido à oclusão parcial/total da via aérea
superior. Afeta 4% dos homens e 2% das mulheres da população mundial. Os principais
fatores de risco são a obesidade, idade avançada e género masculino. O seu diagnóstico é
baseado em sinais e sintomas durante um estudo do sono – polissonografia.
Objetivo: Definir um novo método auxiliar de diagnóstico que suporta a decisão de realizar
polissonografia, baseado em sinais e sintomas, priorizando pacientes.
Métodos: Os dados foram recolhidos retrospetivamente, a partir dos diários médicos, e um
total de 39 variáveis foram definidas por uma revisão da literatura. Apenas pacientes
adultos referenciados para polissonografia e com suspeita da síndrome, encaminhados
para o Centro Hospitalar de Vila Nova de Gaia/Espinho, foram incluídos. Efetuou-se
uma pré-análise aos dados para categorização das variáveis. Duas bases de dados foram
obtidas e duas mais duas redes Bayesianas foram contruídas (Naive Bayes and Tree
augmented Bayesian network). A sensibilidade e especificidade foram analisadas para
determinar a validade dos modelos.
Resultados: Na construção das bases de dados foram considerado 194 pacientes, sendo que
128 (66%) apresentavam a síndrome. A primeira base continha informação em falta e foi
utilizada na seleção das variáveis significativas. A segunda, com a assunção “Não” na
informação em falta, foi usada na construção dos dois mais dois modelos. Esta base e a
base de um trabalho prévio foram comparadas. O modelo escolhido foi o Tree augmented
Bayesian network com as variáveis selecionadas: género; circunferência do pescoço;
anormalidades craniofacial; apneias presenciadas; álcool antes de dormir; Escala de
Sonolência de Epworth; diminuição da concentração; fibrilação auricular; acidente
vascular cerebral; enfarte; camionista e sonolência diurna, com uma sensibilidade de 81%
e valor positivo preditivo de 76%.
Discussão: O nosso estudo revela uma proporção de 34% de exames normais obtidos com
a polissonografia, levando à necessidade de um melhor modelo de suporte à decisão.
Palavras-chave: apneia obstrutiva do sono, fatores de risco, diagnóstico, rede Bayesiana,
modelo clínico, sensibilidade e especificidade
vi

Preamble
The interest in this thesis, firstly began with my previous thesis coming to an end. I
have a Degree in Physiology, and I have worked in Respiratory Physiology. This was my
favourite area in my course. But the circumstances led me to a change. And I don’t regret
it.
The sleep area has several mysteries that probably fascinate me but my real interest
in this thesis was the use of Bayesian Networks. In the first year of the Master’s degree
we had a subject that talks a little bit about this theme, but I was lucky to attend a summer
course on Bayesian Networks. This rose my curiosity and interest.
The teacher had a previous student that had studied Obstructive Sleep Apnea and
the use of Bayesian Networks, and so, we decided to refresh and upgrade this.
We created a new dataset, although in the same Hospital Center – Vila Nova de Gaia
& Espinho. We applied new methods, tried to reach new results and confirm them. Also,
we tried to lead this to the primary care.
As everyone knows, the primary care, should be the first way in the Health System,
but this is not what is happening. The Hospitals are receiving and treating patients that
should be taken care of in the first care. We are talking of obstructive sleep apnea patients.
Their screening should be more accurate. The Sleep Laboratories in the country are
not capable of applying tests, like polysomnography, to all the patients. So, we need to
find a better way to manage and optimize resources.
vii


Index
Acknowledgments ...................................................................................................... iii
Abstract ........................................................................................................................ v
Resumo ....................................................................................................................... vi
Preamble .................................................................................................................... vii
Index ........................................................................................................................... ix
Abbreviations .............................................................................................................. xi
Figure Index ............................................................................................................. xiii
Table Index .............................................................................................................. xiv
Thesis Organization .................................................................................................. xv
Scientific results....................................................................................................... xvii
1. Introduction ......................................................................................................... 2
2. Aim ....................................................................................................................... 8
3. Background ........................................................................................................ 12
3.1 Pathophysiology ............................................................................................................. 14
3.2 Severity levels .................................................................................................................. 15
3.3 Risk factors ...................................................................................................................... 16
3.3.1 Age ........................................................................................................................... 17
3.3.2 Gender ..................................................................................................................... 17
3.3.3 Obesity ..................................................................................................................... 18
3.3.4 Excessive daytime sleepiness ................................................................................ 18
3.3.5 Snoring and Nocturia ............................................................................................ 19
3.3.6 Neck and abdominal circumference .................................................................... 19
ix
3.3.7 Craniofacial and upper-airway structure ............................................................. 19
3.3.8 Ethnicity .................................................................................................................. 20
3.3.9 Genetics/Family history ....................................................................................... 20
3.3.10 Smoking, alcohol and sedatives ........................................................................... 20
3.3.11 Comorbid conditions ............................................................................................ 20
3.4 Diagnosis ......................................................................................................................... 22
3.5 Polysomnography ........................................................................................................... 23
3.6 Portable monitors ........................................................................................................... 23
3.7 Treatment ........................................................................................................................ 24
3.8 Primary care .................................................................................................................... 24
3.9 Clinical decision support systems ................................................................................ 27
3.9.1 Bayesian networks .................................................................................................. 27
4. Methods ............................................................................................................. 30
4.1 Variables .......................................................................................................................... 32
4.2 Data collection ................................................................................................................ 33
4.3 Bayesian networks .......................................................................................................... 34
5. Results ................................................................................................................ 38
6. Discussion.......................................................................................................... 50
6.1 Limitations ....................................................................................................................... 55
7. Conclusion ......................................................................................................... 56
8. Future work ........................................................................................................ 60
9. References .......................................................................................................... 64
10. Annexes .............................................................................................................. 76
x

Abbreviations
AASM: American Academy of Sleep Medicine
AC: Abdominal circumference
ACES: Groups of primary care centres
AHI: Apnea-hypopnea index
AUC: Area under the curve
BMI: Body mass index
BN: Bayesian networks
BQ: Berlin questionnaire
CV: Cross-validation
COPD: Chronic Obstructive Pulmonary Disease
CPAP: Continuous Positive Airway Pressure
ESS: Epworth Sleepiness Scale
HC: Hill climbing
NB: Naïve Bayes
NC: Neck circumference
NHS: National Health Service
NPV: Negative predictive value
OSA: Obstructive sleep apnea
PM: Portable monitors
PPV: Positive predictive value
xi

PSG: Polysomnography
ROC: Receiver Operating Characteristic
TAN: Tree augmented Bayesian network
USF: Family Health Unit
WA: Witnessed apneas
xii
Figure Index
Figure 1: Dissertation Flow diagram ............................................................................................ 36
Figure 2: Flow diagram for inclusion and exclusion criteria in the study ............................... 40
Figure 3: Naïve Bayes with the 39 variables ................................................................................ 45
Figure 4: Tree augmented Bayesian network with the 39 variables ......................................... 46
Figure 5: ROC Curves for Naïve Bayes and Tree augmented Bayesian network with the 39
variables ............................................................................................................................................ 46
Figure 6: Naïve Bayes with the 13 variables selected ................................................................. 47
Figure 7:ROC Curves for Naïve Bayes and Tree augmented Bayesian network with the 13
variables ............................................................................................................................................ 47
Figure 8: Tree augmented Bayesian network with the 13 variables selected .......................... 48
Figure 9: Marginal probabilities of Tree augmented Bayesian network to the presence of
OSA................................................................................................................................................... 48
Figure 10: Causal Hill climbing with the 13 variables selected ................................................. 49
Figure 11: Inference using TAN13 in a female patient ............................................................. 53
Figure 12: Inference using TAN13 in a male patient ................................................................ 53
Figure 13: Inference using TAN13 in a female and male patient ............................................ 53
xiii

Table Index
Table 1: Description and Chi-square for the 39 variables without the assumption .............. 41
Table 2: Description and Chi-square for the 39 variables with the assumption .................... 42
Table 3: Comparison of the new dataset (OSA39) with the previous work (OSA2012) ..... 44
Table 4: Validity assessment averaged from 10-times 10-fold cross validation ..................... 49
xiv

Thesis Organization
Chapter 1 (Introduction) - an introduction to the problem with is definition and context
were written not forgetting the relevance of the problem that motivates this thesis.
Chapter 2 (Aim) - our main objective is to define a new auxiliary diagnostic method that
can support the decision to perform polysomnography, based on signs and symptoms,
prioritizing patients.
Chapter 3 (Background) – key concepts like sleep apnea, risk factors, diagnosis, treatment
and Bayesian network are explain. This definitions try to help the thesis perception.
Chapter 4 (Methods) – all the methodology used to develop this thesis are place here.
Data collection, variables, models and a flow diagram are present.
Chapter 5 (Results) – detail results are written, with table and figures illustrate it.
Chapter 6 (Discussion) – the risk and diagnostics factors for obstructive sleep apnea
achieve in this thesis are compared with the literature. Also, advantages of the Bayesian
network are enumerate.
Chapter 7 (Conclusion) – a brief text of our results and their explanations are expose.
Also, an end message is present.
Chapter 8 (Future work) – the thinking next of our results and the new risk factor.
xv


Scientific results
Rodrigues, Pedro Pereira; Santos, Daniela Ferreira; Leite, Liliana. (2015).
Obstructive Sleep Apnea diagnosis: the Bayesian network model revisited.
Submetid to 28th IEEE International Symposium on Computer-Based Medical Systems
(CBMS 2015).
xvii


1. Introduction
Sleep apnea has been recognised throughout human history, dating as far back as the
4th century BC. Numerous reports throughout the 19th century and the early part of the
20th century AD gave way to systematically conducted studies on patients with obstructive
sleep apnea (OSA) and related syndromes (Jennum & Riha, 2009).
Apnea is defined as the complete cessation of airflow for at least 10 seconds and a
hypopnea is defined as a reduction in airflow (30-50%) that is followed by an arousal from
sleep or a decrease in oxyhaemoglobin saturation (3-4%) (Chung, Jairam, Hussain, &
Shapiro, 2002; Jamie C M Lam, Sharma, & Lam, 2010). There are three types of apneas:
central, mixed and obstructive. Central sleep apnea is defined as reduced respiratory effort
resulting in reduced or absent ventilation. Mixed apnea is often characterized by starting
with central apneas and ending with obstructive events (Brostrom et al., 2012; Jamie C M
Lam et al., 2010). In OSA, respiratory effort is maintained but ventilation decreases or
disappears because of partial or total occlusion in the upper airway (Chung et al., 2002;
Jamie C M Lam et al., 2010; Lee, Won; Nagubadi, Swamy; Kryger, Meir; Mokhlesi, 2008;
Mansfield, Antic, & McEvoy, 2013; Robichaud-Hallé, Beaudry, & Fortin, 2012).
OSA was first properly documented in neurophysiological sleep laboratories using
techniques developed for the investigation of other conditions such as depression and
narcolepsy. It was first described as such in 1965 and there has been an explosion in the
facilities for its diagnosis and treatment as well as rapid advancement in the understanding
of its far-reaching consequences (Jennum & Riha, 2009). OSA severity is assessed with
apnea-hypopnea index (AHI), which is the number of apneas and hypopneas per hour of
sleep (Jamie C M Lam et al., 2010). According to the American Academy of Sleep
Medicine (AASM) recommendations, OSA is defined with AHI≥5, and it is classified as
mild OSA with AHI of 5 to 15; moderate OSA with AHI of 16 to 30; and severe OSA
with AHI ≥30 (Chung et al., 2002; Corral-Peñafiel, Pepin, & Barbe, 2013; Epstein et al.,
2009; Jamie C M Lam et al., 2010).
Approximately 30% of the general public are affected by a significant sleep problem,
often of long standing, with much higher rates in certain groups such as the elderly, those
with a psychiatric disorder or learning disability, and others who have neurological or
other medical disorders (Stores, 2007). OSA affects about 4% of men and at least 2% of
4 Introduction
women (Brostrom et al., 2012; Corral-Peñafiel et al., 2013; Epstein et al., 2009; Jennum
& Riha, 2009; Stores, 2007).
The signs, symptoms and consequences of OSA are a direct result of the
derangements that occur due to repetitive collapse of the upper airway: sleep
fragmentation, hypoxemia, hypercapnia, marked swings in intrathoracic pressure, and
increased sympathetic activity. Clinically, OSA is defined by the occurrence of daytime
sleepiness, loud snoring, changes in personality and adverse effects on social life and
performance at work, as well as intellectual deterioration to the extent that dementia is
suspected, witnessed breathing interruptions, or awakenings due to gasping or chocking
(Corral-Peñafiel et al., 2013; Epstein et al., 2009; Stores, 2007).
Risk factors for developing OSA include obesity (body mass index (BMI) ≥30),
snoring, aging, increased neck circumference (NC) and increased abdominal
circumference (AC), hypertension, pulmonary hypertension, congestive heart disease,
atrial fibrillation, coronary artery disease, first-ever stroke, gastroesophageal reflux,
primary open-angle glaucoma, heart transplants, hypothyroidism, diabetes, anxiety, heavy
alcohol consumption, history of smoking, male sex, postmenopausal status, high-risk
driving populations (such as truck drivers), those being evaluated for bariatric surgery,
and family history (Chung et al., 2002; Corral-Peñafiel et al., 2013; Epstein et al., 2009;
Jamie C M Lam et al., 2010; Lee, Won; Nagubadi, Swamy; Kryger, Meir; Mokhlesi, 2008).
Diagnostic criteria for OSA are based on clinical signs and symptoms determined
during a comprehensive sleep evaluation, which includes a sleep oriented history and
physical examination, and findings identified by sleep testing (Epstein et al., 2009;
Mansfield et al., 2013). A comprehensive sleep history in patients suspected of OSA
should include an evaluation for snoring, witnessed apneas (WA), gasping/chocking
episodes, excessive daytime sleepiness not explained by other factors, including
assessment of sleepiness severity by the Epworth Sleepiness Scale (ESS), non-refreshing
sleep, total sleep amount, nocturia, morning headaches, sleep fragmentation/sleep
maintenance insomnia, decreased libido, irritability and decreased concentration and
memory (Epstein et al., 2009; Jamie C M Lam et al., 2010). The presence of at least 5
obstructive respiratory events (apneas, hypopneas or respiratory effort related arousals)
per hour of sleep or the presence of 15 or more obstructive respiratory events per hour
of sleep in the absence of sleep related symptoms is also sufficient for the diagnosis of
OSA (Epstein et al., 2009; Stores, 2007). The diagnosis must be established by an
acceptable method being the two accepted methods of objective testing the in-laboratory
polysomnography (PSG) and home testing with portable monitors (PM) (Blondet et al.,
2009; Chung et al., 2002; Corral-Peñafiel et al., 2013; Epstein et al., 2009; Jennum & Riha,
2009; Jamie C M Lam et al., 2010; Stores, 2007). PSG is time consuming, labour intensive,
limited to urban areas, and costly (Jennum & Riha, 2009; Jamie C M Lam et al., 2010).
PM tends to underestimate the severity of OSA, because it doesn’t allow determination
of sleep efficiency (Jennum & Riha, 2009).
Introduction 5

Despite the recent advances in diagnostic technology in the field of sleep medicine
and increased awareness of OSA by the public, a majority of those affected are still
undiagnosed, making sleep apnea vastly under recognized in primary practice (Chung et
al., 2002; Jennum & Riha, 2009). Researchers estimate that 82% of men and 93% of
women with moderate-to-severe OSA have not been clinically detected or diagnosed. It
is important to emphasize that primary physicians should assess their patients’ medical
status thoroughly before referring them for a sleep study (Chung et al., 2002). Busy
primary care physicians are routinely challenged by the need to add information about
medical conditions to their store of knowledge. The substantial medical, social, and
economic consequences of untreated OSA; the overwhelming number of patients who
have escaped clinical detection; and the likelihood of successful treatment strongly justify
screening for this disease. Routinely asking patients about loud snoring, excessive daytime
sleepiness, and unsatisfactory sleep will better serve primary care patients and advance
diagnosis and treatment of OSA (Chung et al., 2002).
OSA is considered to be a long-standing illness and the associated complications
seem to impose an economic burden in our society, affecting both developing and
developed countries all over the world (Jamie C M Lam et al., 2010). This significant
socioeconomic burden relays in comorbidity, healthcare utilization in the primary and
secondary healthcare sectors, use of medication, effects on employment and lost income.
Therefore, it is important for primary care physicians and specialists to be competent to
recognise and identify those affected subjects for early and appropriated treatments
(Jennum & Riha, 2009).
Nowadays, prediction models are generated by artificial intelligence, using decision
trees, neural networks, support vector machines and Bayesian networks (BN). All of this
should have good performance, good ability to handle data entry errors or omissions,
transparency of diagnostic knowledge, ability to explain decisions, and the algorithm
should be able to reduce the number of tests needed for making a reliable diagnosis. Its
tools have been used in sleep medicine to create models alternative of those based in
logistic regression. BN have been used in medical domain in some areas with high
performance like pneumonia and breast cancer (Leite, 2012).
Previous thesis “Refining pre-polysomnography suspicion of Obstructive Sleep
Apnea Syndrome: Logistic and Bayesian analysis of clinical factors” written by MD Liliana
Leite, affirms that in Portugal, patients referred by the primary care physician to a sleep
consult, based on clinical factors, have a specificity of the entire process of 48% of PSG
performed in 2010, in Vila Nova de Gaia/Espinho Hospital Center, with a negative result
for OSA, from which 75% had a completely normal result. It’s also said that prediction
models, consisting in simple decision rules, prognostic score and classification of patients
into different risk categories, have a main limitation: sensitivity.
6 Introduction

These models need a high sensitivity, as false negatives should be avoided, to prevent
excluding patients with moderate or severe OSA from performing PSG. Another problem
in the application of these models is the lack or internal and/or external validation of the
results (Leite, 2012). This work studied several factors and identified six as associated with
OSA diagnosis (BMI, NC and AC, gender, WA and alcohol consumption before sleep)
but this made the results not generalizable to use in primary care. Also, the BN were
developed based only on variables univariatedly associated with the outcome, yielding a
bias on the possible knowledge representation of the models. This is why emerge the need
to revisit the OSA cohort, develop and validate a new Bayesian network-based decision
support system that can be used in the future. In this we use all 33 variables, creating a
model with a high interpretability, high discriminated power and better accuracy,
sensitivity and precision cross-validation (CV). But more studies are needed to better fit
this clinical decision support model tool and also the need to integrate a much wider set
of clinical variable (Rodrigues, Pedro Pereira; Santos, Daniela Ferreira; Leite, 2015).
Introduction 7


2. Aim
The proposal is to define a new auxiliary diagnostic method that can support the
decision to perform polysomnography, based on clinical data.
The secondary objectives are to:
Reduce the number of unnecessary PSG;
Avoid false negatives;
Prioritize patients recommended for PSG or PM;
Expand the Bayesian network results, and
Produce an evaluation protocol model for use in the primary setting.
10 Aim


3. Background
The human upper airway is a unique multipurpose structure involved in performing
functional tasks such as speech, swallowing of liquids/food, and the passage of air for
breathing. The airway is composed of numerous muscles and soft tissues but lack rigid or
bony support (Eckert & Malhotra, 2008). The upper airway includes the pharynx and the
nasal cavities. The pharynx can be divided into the nasopharynx, laryngopharynx and
oropharynx, being the only collapsible segment of the respiratory tract. The nose is
composed of bone and cartilage attached to the facial skeleton. It is a pyramidal structure
that is divided by a midline septum into two nasal cavities. The nasal cavities are lined
with mucosa that can function to heat and humidify inspired gas. The posterior portion
of the mouth opens into the oropharynx, so when a patient is in supine position or
unconscious, the tongue and lower jaw may slide posteriorly leading to airway obstruction
(Nemergut & Kopp, 2013).
3.1 Pathophysiology
OSA is characterized by recurrent collapse of the pharyngeal airway during sleep,
resulting in substantially reduced (hypopnea) or complete cessation (apnea) of airflow
despite ongoing breathing efforts. These disruptions to breathing lead to intermittent
blood gas disturbances (hypercapnia and hypoxemia) and surges of sympathetic activation
(Eckert & Malhotra, 2008; Romero, Krakow, Haynes, & Ulibarri, 2010).
The pathophysiological causes of OSA likely vary considerably between individuals.
Important components likely include upper airway anatomy, the ability of the upper
airway dilator muscles to respond to respiratory challenge during sleep, the propensity to
wake from increased respiratory drive during sleep (arousal threshold), the stability of the
respiratory control system (loop gain), and the potential for state-related changes in lung
volume to influence these factors (Chung et al., 2002; Eckert & Malhotra, 2008; Jamie C
M Lam et al., 2010).
14 Background
One mechanism believed to be important in the pathogenesis of OSA relates to the
interaction between pharyngeal anatomy and a diminished ability of the upper airway
dilator muscles to maintain a patent airway during sleep. During wakefulness, patients
with OSA appear to compensate for an anatomically compromised upper airway through
protective reflexes which increase upper airway dilator muscle activity to maintain airway
patency (Chung et al., 2002; Eckert & Malhotra, 2008).
Ventilatory control stability is believed to be an important contributor to OSA
pathogenesis because it creates a cyclical breathing pattern that develops, whereby the
patient oscillates between obstructive breathing events (sleep) and arousal (wakefulness).
Ventilatory control stability can be described using the engineering concept loop gain.
Essentially, loop gain is a term used to describe the stability of a system controlled by
feedback loops. In the context of ventilatory control, loop gain refers to the stability of
the respiratory system and how responsive the system is to a perturbation to breathing
(arousal). In other words, loop gain can be considered as the propensity for the ventilatory
control system to develop cyclical fluctuations in ventilatory output (Eckert & Malhotra,
2008).
The interaction between pharyngeal patency and lung volume is believed to be an
important contributor to OSA pathogenesis. Indeed, upper airway mechanics can be
modulated by changes in lung volume during wakefulness and sleep in healthy individuals
(Eckert & Malhotra, 2008).
OSA has long been recognized as a heterogeneous disorder with potentially multiple
contributing pathophysiological causes, the relative contributions of which may vary
considerably between patients (Eckert & Malhotra, 2008).
3.2 Severity levels
The severity of OSA has two components: the severity of daytime sleepiness and of
overnight monitoring. The severity should be specified for both components and the
rating severity should be based on the most severe component (“Practice parameters for
the use of portable recording in the assessment of obstructive sleep apnea. Standards of
Practice Committee of the American Sleep Disorders Association.,” 1994).
Daytime sleepiness
a. Mild: unwanted sleepiness or involuntary sleep episodes occur
during activities that require little attention. Symptoms produce
minor impairment of social or occupational function.
b. Moderate: unwanted sleepiness or involuntary sleep episodes
occur during activities that require some attention. Symptoms
produce moderate impairment of social and occupational
function.
Background 15

c. Severe: unwanted sleepiness or involuntary sleep episodes occur
during activities that require more active attention. Symptoms
produce marked impairment in social or occupational function.
Overnight monitoring (AHI):
a. Mild: 5 to 15 events per hour.
b. Moderate: 15 to 30 events per hour.
c. Severe: greater than 30 events per hour.
3.3 Risk factors
The major risk factors for OSA include advanced age, male sex and obesity, although
the underlying mechanisms remain unclear (Al Lawati, Patel, & Ayas; Davies, Ali, &
Stradling, 1992; Doghramji, 2008; Hoffstein & Szalai, 1993; Kapur, 2010; Kohler, 2009;
Jamie C M Lam et al., 2010; Manber & Armitage, 1999; Pagel, James; Hirshkowitz, Max;
Doghramji, Paul; Ballard, 2008; Romero et al., 2010; Wall, Smith, & Hubbard, 2012; T
Young, Evans, Finn, & Palta, 1997; Terry Young et al., 2002; Terry Young, Skatrud, &
Peppard, 2004).
Common symptoms of patients with OSA are (Chung et al., 2002; Jennum & Riha,
2009; Jamie C M Lam et al., 2010; Mattei, Tabbia, & Baldi, 2004; Stores, 2007):
Excessive daytime sleepiness;
Loud snoring, stopped or shallow breathing or chocking during sleep;
Unrefreshing sleep, possible with nocturia;
Weight gain or more body fat in neck or chest or abdomen;
Irritability, mood changes, and loss of libido, can mimic
depression/anxiety.
Less common features of OSA (Chung et al., 2002; Jennum & Riha, 2009; Jamie C M
Lam et al., 2010; Mattei et al., 2004; Romero et al., 2010; Stores, 2007):
Nocturnal manifestations:
o Gasping for air; Shortness of breath;
o Chronic mouth breathing;
o Frequent awakenings;
o Restless sleep;
o Gastroesophageal reflux;
o Nocturnal panic attacks;
o Excessive sweating;
o Nocturnal cyclical bradycardia;
o Nocturia.
16 Background

Daytime manifestations:
o Lack of energy, tiredness, fatigue (increases risk for automobile
accidents);
o Daytime naps are not refreshing;
o Morning headaches;
o Feeling of morning “drunkenness”;
o Bilateral leg edema.
There are some features that need to be evaluated that may suggest the presence of
OSA: increased NC (>42 cm in men, >37 cm in women), increased AC (>94 cm in men,
>80 in women), a Modified Mallampati score of 3 or 4, the presence of retrognathia,
lateral peritonsillar narrowing, macroglossia, tonsillar hypertrophy, elongated/enlarged
uvula, high arched/narrow hard palate, nasal abnormalities (polyps, deviation, valve
abnormalities, turbinate hypertrophy) and/or overjet (Epstein et al., 2009; Mattei et al.,
2004; Romero et al., 2010)
3.3.1 Age
OSA occurs throughout the entire lifespan, from neonates to the elderly. In adults,
the frequency of disordered breathing during sleep increases with age and is poorly
associated with an increased incidence of daytime sleepiness or other symptoms of OSA
(Jennum & Riha, 2009; Lee, Won; Nagubadi, Swamy; Kryger, Meir; Mokhlesi, 2008) Mean
age of death among people with untreated OSA is 59 years (Chung et al., 2002).
With the advancing age, sleep quality decrease and sleep-related difficulties are more
common (Madani & Madani, 2009). Possible explanations are changes in upper-airway
calibre, attenuation in the ventilatory response to hypoxia and hypercapnia, decreases in
functional activity of the upper airway, and an increase in the variability of ventilation
during sleep. One of the mechanisms proposed for the increased prevalence of sleep
apnea in the elderly include increased deposition of fat in the pharyngeal area, lengthening
of the soft palate (Jamie C M Lam et al., 2010).
3.3.2 Gender
For an overall estimation across different countries, it is approximately 3-7 per cent
for adult men and 2-5 per cent for adult women in the general population. Thus, OSA is
more common in men, approximately 2 to 3 times that of women (Jennum & Riha, 2009;
Jamie C M Lam et al., 2010).
It is not clear why OSA is more common in men than in women. It can be attributed
to anatomical and functional properties of the upper airway and in the ventilator response
to the arousals from sleep, the clinical presentation, different tolerance of symptoms,
differing amount of medical services, or bias by physicians expecting a higher male
predominance. Besides, hormonal differences may play a role in the predisposition to
abnormal breathing during sleep. Pre-menopausal women are relatively protected from
Background 17
OSA even if they have other known risk factors for OSA (Dursunoglu, Ozkurt, &
Sarikaya, 2009; Jennum & Riha, 2009; Jamie C M Lam et al., 2010; Lee, Won; Nagubadi,
Swamy; Kryger, Meir; Mokhlesi, 2008; Resta et al., 2005).
Also, the way that men and women perceive and relate symptoms of sleep are
reported differently (Dursunoglu et al., 2009; Madani & Madani, 2009; Resta et al., 2005).
Women are less unlikely to report classic symptoms like snoring, gasping or chocking,
WA. They pay more attention to report fatigue and lack of energy (Dursunoglu et al.,
2009; Madani & Madani, 2009).
3.3.3 Obesity
OSA is a prevalent and severe condition in close association with obesity (BMI)
epidemic globally (Chung et al., 2002; Jamie C M Lam et al., 2010; Lee, Won; Nagubadi,
Swamy; Kryger, Meir; Mokhlesi, 2008; Wall et al., 2012). Obesity or visceral obesity is
thought to be associated with anatomic alterations that predispose to upper airway
obstruction during sleep, by increasing adiposity around the pharynx and body. In
subjects with severe obesity, BMI>40, the prevalence of sleep apnea was markedly
increased to 40-90 per cent. It is well demonstrated that a 10 per cent body weight
reduction was associated with a parallel 26 per cent decrement in AHI (Jamie C M Lam
et al., 2010).
3.3.4 Excessive daytime sleepiness
The main symptom of untreated OSA is hypersomnolence or excessive daytime
sleepiness that often manifests as dozing off in meetings or while reading, watching
television, or driving (greatest impact from the public health perspective) (Chung et al.,
2002; Jennum & Riha, 2009). Some patients, especially women, describe a lack of energy
and tiredness or fatigue rather than sleepiness (Chung et al., 2002).
Sleepiness can be regarded as “normal” sleepiness (a result of the normal circadian
rhythm) and “pathological” sleepiness (a result of altered sleep scheduling). Pathological
sleepiness can be subdivided into “habitual” (OSA) or “occasional” (jet lag) (Jennum &
Riha, 2009).
To evaluate daytime sleepiness the widest questionnaire is ESS, first devised in 1991.
It consists of eight items and the patient is asked to score (on a 0 to 3 scale) how likely
he/she is to doze off. The maximal score is 24 and normal subjects score between 0 and
10. Scores greater than 10 are usually considered an indication of daytime sleepiness
(Jennum & Riha, 2009; Johns, 1991). This measures propensity for daytime sleep in adults
with an internal consistency (Cronbach’s α) of 0.88, and at a cut off score of >10. This
measure has a 94% sensitivity and 100% specificity. Its advantages include ease of
administration and low cost and it is independent of short-term variations in sleepiness
with no time relation of day and also of inter-day variations. While this questionnaire is
18 Background
not specifically diagnostic for OSA, it is a useful indicator of general sleep disorders
(Chung et al., 2002; Di Guardo et al., 2010; Jennum & Riha, 2009; Johns, 1991).
3.3.5 Snoring and Nocturia
Snoring is a common complaint, but by itself does not definitely imply presence of
OSA (Chung et al., 2002; Wall et al., 2012). Reports published in the 1990s suggested a
relationship between self-reported snoring and familial occurrence of snoring and sleep
apnea, with a relative risk association of 3-5. The risk has been demonstrated to increase
if both parents are affected (Jennum & Riha, 2009). It results from vibration and
turbulence in the airways and its degree of blockage across airway segments determines
the quality and intensity of snoring (Mattei et al., 2004).
Nocturia is the condition of getting up to urinate once or multiple times during the
night. This is the most common and well-researched symptom of OSA and is related to
increased negative intrathoracic pressure swings due to sleep breathing events. Despite
this mechanism, primary care physicians are not encouraged to use nocturia when
assessing OSA risk. In fact, nocturia is not recognized as an OSA symptom in the AASM
(Romero et al., 2010).
3.3.6 Neck and abdominal circumference
NC and AC is also described as a risk factor for OSA. This is related to obesity,
because of the previous referred anatomic alterations that lead to upper airway collapse
during sleep. The excess of adipose tissue in the area of the neck and belly will compress
the respiratory tract. A neck size bigger than 37 cm in women and 42 cm in men, and an
abdominal size bigger than 94 cm in men and 80 cm in women are considered clinically
significant (Davies et al., 1992; Doghramji, 2008).
3.3.7 Craniofacial and upper-airway structure
Previous studies have shown that craniofacial abnormalities are important in the
pathogenesis of OSA, particularly in non-obese patients. Differences in craniofacial
morphology may explain some of the variation in risk of OSA in different ethnic groups
(Jamie C M Lam et al., 2010).
The structural factors in the upper airway may alter its mechanical properties.
Abnormal characteristics can alter this mechanical properties and increase its propensity
to collapse during sleep, such as enlarged tonsilis, enlarged uvula, “narrow airway”,
macroglossia, retroplaced mandible, soft tissue, tonsillar hypertrophy, inferiorly
positioned hyoid bone, and decreased posterior airway space (Doghramji, 2008; Jamie C
M Lam et al., 2010; Madani & Madani, 2009; Punjabi, 2008; Yaggi & Strohl, 2010; Terry
Young et al., 2004).
Background 19

3.3.8 Ethnicity
The prevalence of OSA appears to vary among ethnic groups. The discrepancy in
prevalence is most likely associated with a propensity of known risk factors for OSA in
certain cultural groups, although anthropometrical variables and genetic predisposition
could also play a role (Blondet et al., 2009; Lee, Won; Nagubadi, Swamy; Kryger, Meir;
Mokhlesi, 2008). Chinese patients tend to be younger and have a lower BMI than white
patients, but they present more severe underlying craniomandibular abnormalities (Chung
et al., 2002). Inter-ethnic studies suggest that African-American ethnicity may also be a
significant risk factor for OSA (Jamie C M Lam et al., 2010).
3.3.9 Genetics/Family history
Familial aggregation and genetic factors are thought to play a role in the development
of OSA. First degree relatives of those with OSA increases the relative risk compared to
those without OSA by 1.5-2.0, and familial susceptibility to OSA increases directly with
the number of affected relatives. Obesity is closely associated with OSA and itself
aggregates in families, so it is possible that familial aggregation of OSA is related to the
genetics of obesity (Jamie C M Lam et al., 2010).
3.3.10 Smoking, alcohol and sedatives
Cigarette smoking and alcohol have been shown to be risk factors for OSA. Smoking
is associated with a higher prevalence of snoring and sleep-disordered breathing. It can
be explained by the cigarette-induced airway inflammation and damage which could
change the structural and functional properties of the upper airway, and increasing the
risk of collapsibility during sleep. Alcohol relaxes upper airway dilator muscles, increases
upper airway resistance and may induce OSA in susceptible subjects. Therefore, alcohol
intake can prolong apnea duration, suppress arousals, increase frequency of occlusive
episodes and worsen the severity of hypoxaemia, even though the underlying mechanisms
are not well understood (Jennum & Riha, 2009; Jamie C M Lam et al., 2010).
3.3.11 Comorbid conditions
World population is at risk of co-occurrence of two or more chronic diseases –
multimorbidity. Nine out of ten primary care patients had more than one chronic
condition, while approximately 50% had five or more. Multimorbidity has been associated
with several adverse effects, such as a reduction in the quality of life, increase in
physiological distress, medical complications and increased mortality. (Robichaud-Hallé
et al., 2012)
Sleep disturbance can exacerbate pre-existing medical and psychiatric disorders
(Alam, Chengappa, & Ghinassi, 2012; Epstein et al., 2009).OSA appears to occur more
frequently in people with psychiatric disorders than with other medical conditions, being
more common in patients with schizophrenia (Alam et al., 2012).
20 Background

OSA can worsen epilepsy, systematic hypertension and cardiac failure, but it can also
be implicated (possible concomitant problems) in pulmonary hypertension, stroke,
myocardial infarction, cor pulmonale, decreased daytime alertness, motor vehicle
accidents, cardiovascular and cerebrovascular disease, diabetes mellitus, arrhythmia,
coagulability, endothelial dysfunction and inflammation (Epstein et al., 2009; Jennum &
Riha, 2009; Jamie C M Lam et al., 2010; Robichaud-Hallé et al., 2012; Stores, 2007).
There is increasing evidence that OSA is an independent risk factor for an adverse
cardiometabolic profile, although much of the causal role and mechanisms are still poorly
understood (Dursunoglu et al., 2009; Jamie C M Lam et al., 2010). Despite the lack of
controlled studies, several studies have presented data showing that weight reduction
through dieting or bariatric surgery is followed by a reduction in AHI and incidence of
diabetes, improved glucose control and reductions in hyper-triglyceridaemia (Jennum &
Riha, 2009). Type 2 diabetes mellitus and OSA share a number of common risk factors,
including advancing age, ethnicity and obesity. Diabetes is a major cause of morbidity and
mortality linked to microvascular and macrovascular complications and is considered as
a coronary artery disease risk equivalent for myocardial infarction (Cass, Alvah; Alonso,
Jerome; Islam, Jamal; Weller, 2013).
The morbidity and association between hypertension and untreated OSA is well
established and is independent of confounding factors (age, sex, BMI) but is still unclear:
untreated OSA might trigger slight elevations (5 to 10 mmHg) in diastolic and nocturnal
systolic blood pressure (Chung et al., 2002; Di Guardo et al., 2010). A proposed
mechanism is the sympathetic activation and increased levels of catecholamine’s causing
inflammation, arterial stiffness and atherosclerosis, due to apnea-related oxygen
desaturations. Another one is the shared risk of obesity (Brostrom et al., 2012; Broström
et al., 2012; Pagel, James; Hirshkowitz, Max; Doghramji, Paul; Ballard, 2008).
Nevertheless, in patients with untreated OSA, clinically significant systemic or pulmonary
hypertension can develop over time, especially when OSA is severe and patients have a
greater number of risk factors for hypertension. Physicians should be aware that
hypertension associated with untreated OSA is often intractable, and that a high
prevalence (56%) of OSA has been observed in men with therapy-resistant hypertension
(Brostrom et al., 2012; Chung et al., 2002)
Patients with OSA and moderate-to-severe coexisting lung disease, such as Chronic
Obstructive Pulmonary Disease (COPD), are more likely to develop type II respiratory
failure that will improve with treatment of obstructive apneas. Likewise, nocturnal asthma
may be worsened by sleep apnea and treatment may lead to improvement (Greenberg-
Dotan et al., 2014; Jennum & Riha, 2009).
OSA leads to neuropsychological impairment that includes deficits in attention,
concentration, vigilance, manual dexterity, visuomotor skills, memory, verbal fluency and
executive function (Jennum & Riha, 2009).
Background 21
The pathophysiological interaction between OSA and cardiovascular disease is
complex and comprises sympathetic activation, inflammation, oxidative stress and
endothelial dysfunction (Pagel, James; Hirshkowitz, Max; Doghramji, Paul; Ballard, 2008;
Wachter et al., 2013).
The social and cardiovascular consequences of OSA seem most pronounced among
patients of low socioeconomic status. It should be noted, however, that there is a tendency
towards lower screening and diagnostic activity among people of lower social status
(Jennum & Riha, 2009).
3.4 Diagnosis
The consequences of undiagnosed and untreated OSA are not trivial because the
quality of life for patients is seriously impaired (Chung et al., 2002). As part of the initial
sleep evaluation, and prior to objective testing, patients should receive education
regarding possible diagnoses, diagnostic steps, and the procedure involved in any testing
(Epstein et al., 2009).
A screening questionnaire for use with adult patients can be a useful starting point in
assessment (Mansfield et al., 2013; Stores, 2007). A structured sleep diary, recording day
and night events over 1-2 weeks, may also reveal further valuable information. Other
potentially relevant details may be contained in the patient’s medical, psychiatric and social
histories, including occupational factors and also habits (such as caffeine, alcohol or
nicotine consumption and use of illicit drugs) which might affect sleep. These enquiries
should be accompanied by a review of systems, as well as physical and mental state
examination. It is important to identify any neurological, general medical or psychiatric
disorder likely to affect sleep, or physical anomalies. A family history of sleep disorder
might also be revealing (Stores, 2007).
The diagnosis of OSA is confirmed if the number of obstructive events (apneas,
hypopneas + respiratory event related arousals) on PSG is greater than 15 events/hour
or greater than 5/hour in a patient who reports any of the following: unintentional sleep
episodes during wakefulness; daytime sleepiness; waking up breath holding, gasping or
chocking; or the bed partner describing loud snoring, breathing interruptions, or both
during the patient’s sleep (Epstein et al., 2009).
In view of the high prevalence of OSA and the difficulty in its diagnosis, better tools
are needed to adequately screen susceptible populations and help decide who should be
tested (Blondet et al., 2009)
22 Background

3.5 Polysomnography
High-risk patients with nocturnal symptoms of OSA should undergo sleep testing,
including those who are obese, those with systolic or diastolic heart failure, coronary artery
disease, history of stroke or transient ischemic attacks, or significant tachyarrhythmias or
bradyarrhythmias. Patients with congestive heart failure who continue to have nocturnal
symptoms of sleep related breathing disorders despite optimal medical management are
also at risk for OSA and should undergo testing. Patients with hypertension should
undergo evaluation and testing if they have nocturnal symptoms (disturbed sleep,
nocturnal dyspnea, or snoring) suggestive of OSA or if they remain hypertensive despite
optimal medical management (Epstein et al., 2009).
The gold standard diagnostic test for OSA is the overnight in-laboratory
polysomnography. It involves multi-channel continuous polygraphic recording from
surface leads for electroencephalography, electro-oculography, electromyography,
electrocardiography, nasal pressure transducer (supplemented by thermistor) for nasal
airflow, thoracic and abdominal impedance belts for respiratory effort, pulse oximetry,
tracheal microphone for snoring, and sensors for leg and sleep position. These recordings
will identify different types of apneas and hypopneas during sleep (Blondet et al., 2009;
Chung et al., 2002; Epstein et al., 2009; Jennum & Riha, 2009; Jamie C M Lam et al., 2010;
Redeker, 2005). This requires an overnight stay in the hospital with trained staff who are
capable of monitoring and interpreting the real-time complicated physiologic data
throughout the night (Epstein et al., 2009; Jamie C M Lam et al., 2010).
This test and its interpretation is technically time-consuming, expensive and intakes
long waiting lists (Blondet et al., 2009; Jennum & Riha, 2009).
3.6 Portable monitors
PM for the diagnosis of OSA should be performed only in conjunction with a
comprehensive sleep evaluation. It should, at a minimum, record airflow respiratory
effort, and blood oxygenation, include an oronasal thermal sensor to detect apneas, a nasal
pressure transducer to measure hypopneas, oximetry, and ideally, calibrated or
uncalibrated inductance plethysmography for respiratory effort. An experienced sleep
technician, sleep technologist, or appropriately trained healthcare practitioner must
perform the application of PM sensors or directly educate the patient in the correct
application of the sensors. PMs may be used in the unattended setting as an alternative to
PSG for the diagnosis of OSA in patients with a high pretest probability of moderate to
severe OSA and no comorbid sleep disorder or major comorbid medical disorders when
all of the previous parameters are met. The diagnosis of OSA is confirmed and severity
determined using the same criteria as used for PSG (Corral-Peñafiel et al., 2013; Epstein
et al., 2009).
Background 23
The term AHI has been defined differently when used with PMs than when used
with PSG. AHI PM is the number of apneas + hypopneas / total recording time rather
than total sleep time. As a result, PMs are likely to underestimate the severity of events
compared to the AHI by PSG (Epstein et al., 2009).
3.7 Treatment
The patient should be an active participant in the decision on treatment type and
taught to contribute to the management of his or her own disease. The physician should
review the results of objective testing with the patient, including education on the nature
of the disorder and treatment options. The educational programs should include
discussion of the pathophysiology, risk factors, natural history, and clinical consequences
of OSA. Treatment options should be discussed in the context of the severity of the
patient’s OSA, their risk factors, any associated conditions, and the patient’s expectations
(Epstein et al., 2009).
Treatment of OSA causes reduced morbidity, mortality and hospitalisation rates and
this has been demonstrated to be cost effective (Jennum & Riha, 2009). Options for OSA
patients include modification of body position during sleep, weight loss, continuous
positive airway pressure (CPAP), oxygen supplementation, oral appliances, and surgery
(Chung et al., 2002; Culpepper & Roth, 2009; Mansfield et al., 2013; Pagel, James;
Hirshkowitz, Max; Doghramji, Paul; Ballard, 2008).
Adjunctive management of OSA should include moderating alcohol consumption
and avoiding sedatives-hypnotics and narcotics because these are respiratory depressants
and might worsen breathing disorders (Chung et al., 2002).
CPAP has been shown unequivocally to alleviate excessive daytime sleepiness;
restore quality of life; improve vigilance, concentration, fatigue, and memory; reduce use
of health care services, and decrease traffic accidents. CPAP treatment lowers blood
pressure, improves cardiac function, and decreases mortality (Chung et al., 2002; Corral-
Peñafiel et al., 2013; Epstein et al., 2009).
For patients with comorbid primary depression and OSA, recommendations are to
treat the sleep apnea to facilitate managing the depression (Chung et al., 2002; Culpepper
& Roth, 2009).
3.8 Primary care
For most physicians, the symptoms give a good indication of whether to refer
patients for further investigation but this depends on their ability to recognize the disorder
and make the appropriate referral, because it is not feasible to send every patient who
snores for evaluation. Primary physicians should conduct careful interviews, physical
24 Background

examinations, and screening for other medical disorders (Broström et al., 2012; Chung et
al., 2002; Culpepper & Roth, 2009; Epstein et al., 2009; Mansfield et al., 2013; Stores,
2007).
The physical examination can suggest increased risk and should include the
respiratory, cardiovascular, and neurologic systems. Particular attention should be paid to
the presence of obesity, signs of upper airway narrowing, or the presence of other
disorders that can contribute to the development of OSA or to the consequences of OSA.
Routinely asking patients about loud snoring, staying asleep, excessive daytime sleepiness,
and unsatisfactory sleep will better serve primary care patients and advance diagnosis and
treatment of OSA. Also, the patient’s bed partner or other relative should also be
questioned (Broström et al., 2012; Chung et al., 2002; Epstein et al., 2009; Mansfield et
al., 2013; Pagel, James; Hirshkowitz, Max; Doghramji, Paul; Ballard, 2008; Stores, 2007).
The following laboratory investigations could be specifically helpful in assessment,
diagnosis, and management of OSA and its complications (Broström et al., 2012):
Complete blood count;
Electrocardiogram;
Electrolytes;
Blood glucose.
Two questionnaires are available and are specifically designed to assist primary care
physicians: Berlin Questionnaire (BQ) and ESS. The BQ takes about 5 minutes to
complete, it has ten items divided in three categories according to the symptoms: snoring
or increased upper resistance, somnolence or chronic fatigue, and presence of
hypertension or obesity. This questionnaire is designed for patients with clinically
significant OSA (AHI>15), and its positive predictive value (PPV) is 0.97, the specificity
0.97, and the sensitivity 0.54. Apart from these two, no other questionnaires are specific
and exclusive for OSA (Ahmadi, Chung, Gibbs, & Shapiro, 2008; Bouloukaki et al., 2013;
Chung et al., 2002; Kang et al., 2013; Mattei et al., 2004).
A survey of United Kingdom medical schools revealed that out of a typical 5 year
undergraduate course, the median time spent on formal teaching about sleep and its
disorders was 5 minutes, therefore, medical staff do not usually enquire about sleep
symptoms (Stores, 2007). The annual Sleep in America survey reported that 86% of
respondents’ generalists had never discussed sleep with patients. Six of ten healthcare
professionals reported not having enough time to discuss sleep problems during office
visits. Another study reported that 90% of generalists rated their knowledge of sleep
disorders as fair or poor (Hayes, Murray, Castriotta, Landrigan, & Malhotra, 2012).
Portugal chose to protect constitutionally access to health and include in the study
design of its health system creating (1979) a National Health Service (NHS), universal,
general and also trend free. This was the response that the community found to provide
Background 25

comprehensively access to health care, depending on need and not their ability to pay,
assuming collective responsibility through taxation. As a result of the created device,
Portugal has a network of primary care, a hospital network and a more recent continuum
of care network. The greatest challenge of our time is the future sustainability of our NHS.
Nowadays, it corresponds to a share of 66% of the overall costs that the Portuguese
spends on health which tends to double every 10 years, largely due to pressure that
therapeutic and technological innovation and the lifetime of the extension have on health
systems. After all, the cost to the society by the NHS funding highlights as one of the best
investments made by the Portuguese democracy (Ribeiro, 2003).
Primary care centres are responsible for delivering primary health care. They do not
have financial or administrative autonomy. It is the Ministry of Health that allocates funds
to the regional health administration, which in turn fund the global activity of each health
centre through the recently created groups of primary care centres (ACES). In 2006, a
reform approved by the government, introduced new models – the Family health unit
(USF), which are multidisciplinary teams, paid partially through incentive mechanisms
(Barros, Pedro Pita; Machado, Sara Ribeirnho; Simões, 2011).
The objective of these USFs is to promote health and disease prevention, including
management of acute or serious health problems according to physical, psychological,
social and cultural dimension, through a person-centred approach oriented towards the
individual, her/his family and the community of which she/he is member. The services
provided by the general physicians are: general medical care for the adult population;
prenatal care; children’s care; family planning and perinatal care; first aid; certification of
incapacity to work; home visits; preventive service, including immunization. They work
with a system of patient’s lists, average 1500 patients, but there are patient’s lists exceeding
2000 patients (Barros, Pedro Pita; Machado, Sara Ribeirnho; Simões, 2011).
The major problems currently faced in primary care include (Barros, Pedro Pita;
Machado, Sara Ribeirnho; Simões, 2011):
An inequitable distribution of health care resources;
Difficult access to primary health care resulting in emergency department
overuse;
Very limited public provision of services in continuing and home care;
Mixed options about the public primary health care system;
Scarcity of quality control programmes;
A lack of motivation of physicians working in isolation for fixed salaries;
Limited access to health care services for poorer and geographically isolated
people, and
A shortage of qualified ancillary staff in primary care centres.
26 Background

3.9 Clinical decision support systems
Nowadays, new computational techniques are available and are better at detecting
patterns hidden in biomedical data, being better in representing and manipulating
uncertainties. Clinical decision support systems are today a major topic because it may
help the diagnosis, prognosis and treatment. However, the complicated nature of real-
world bio and medical data take us beyond traditional biostatistics (P. J. F. Lucas, van der
Gaag, & Abu-Hanna, 2004). When biomedical data are represented as dichotomous
outcomes, the best choice for statistical modelling is logistic regression. This uses the
assumption that predictor variables are related in a linear manner to the log odds of the
outcome, being unable to deal with great databases. This made the utilization of new
methods extremely necessary (Tu, 1996). We are talking about data mining. Data mining
allows data pre-processing and visualization, non-statistical methods and new methods
based on probabilities and statistics (P. J. F. Lucas et al., 2004).
Another technique is artificial intelligence, more exactly machine learning. It can be
described as the study of computer algorithms that can improve automatically through
experience. It can be divided in statistical and pattern recognition (Bayesian classifiers),
inductive learning of symbolic rules (decision trees) and artificial neural networks
(Kononenko, 2001).
To analyse a biomedical dataset we need five steps: (1) problem identification; (2)
data extraction; (3) data pre-processing; (4) data mining, and (5) pattern interpretation and
presentation (Lee & Abbott, 2003). Also, to be applied in medical diagnostic tasks it
should fit some requirements (Kononenko, 2001):
Good performance/high accuracy;
Dealing with missing data;
Dealing with error data;
Transparency of diagnostic;
Explanation ability;
Reduction of the number of tests.
3.9.1 Bayesian networks
BN are important to machine learning because they provides a quantitative approach
to assess the evidence supporting alternative and also represents a joint probability
distribution and domain prior knowledge when analysing biomedical data (Lee & Abbott,
2003). BN are based on probability theory and are graph-based for the representation and
manipulation of uncertain knowledge (P. Lucas, 2004). They are the most popular
uncertainty formalism because it fills the requirements described above – handle noise
and missing or error information, provide probabilistic relations with a good interface and
can learn from the data and/or incorporate expert knowledge. That’s why it is becoming
the most reliable technique for medical domain (Lee & Abbott, 2003).
Background 27

Being a graphical representation of statistical dependences and independences among
variables, BN deal with the direction of the arcs and the assumption that the classification
of patterns is expressed in probabilistic terms between predictors and outcome variables.
Each node represents a variable and each arc the (in) dependence of all its non-descendent
nodes, given its parents. For building the BN, two phases are required: the creation of the
BN structure and the assessment of prior and local condition probabilities (Lee & Abbott,
2003). We can build it manually or learn from data. The first one is time consuming and
requires the access to human experts. The second one is much more attractive, being
nowadays in constant use (P. J. F. Lucas et al., 2004). When using Bayesian network
building from data we have to satisfy some requisites: unbiased data collection, variables
and values should match characteristics in the network, the dataset size should allow
reliable information of probabilistic relationships among variables. Regarding missing
data we have to choose one of two options: we either remove all the cases with missing
data or we fill/ input missing data. The first one can lead to a loss of large number of
valuable data, leading to a decrease in the robustness of the model. The other replaces the
missing values with an estimate of the actual value (P. J. F. Lucas et al., 2004).
Naïve Bayes (NV) classifier is based on the simple assumption that the attribute
values are conditionally independent given the target value. Tree augmented Bayesian
network (TAN) is an extension of NV, reducing the number of independent assumptions,
each node has at most two dependences, one conditionally from the class and other
conditionally from another attribute. Hill climbing (HC) is an iterative algorithm that
starts with an arbitrary solution to a problem, then attempts to find a better solution by
incrementally changing a single element of the solution. If the change produces a better
solution, an incremented change is made to the new solution, repeating until no further
improvements can be found (P. J. F. Lucas et al., 2004).
The models/classifiers performance and quality should be evaluated by their ability
of discrimination and calibration. Discrimination measures how the model is able to
separate cases with positive outcome value from those with negative outcome value. Area
under the ROC Curve (AUC) is the most common measure, plotting a sensitivity versus
specificity model. On the other hand, calibration is how close the predicted values are to
the real outcomes (Lee & Abbott, 2003).
Sensitivity can be defined as the number of correctly classified cases as positives
divided by the total number of actual positive cases. Specificity is the number of correctly
classified cases as negatives divided by the total number of actual negative cases (Lee &
Abbott, 2003). Also, PPV and negative predictive value (NPV) should be reported in the
results. PPV is the proportion of cases that the network classifies as positive that actually
are positive and NPV is the proportion of cases that the network classifies as negative
that actually are negative (Lee & Abbott, 2003).
28 Background


4. Methods
4.1 Variables
A literature review was performed to define the most relevant variables to be
collected. The search was performed on Pubmed on the 19th of April of 2015, using the
Mesh terms “risk factors”, “sleep apnea, obstructive” and “diagnosis”. A total of 1397
articles were obtained, but we only selected reviews. At first we found 310 reviews, but
we excluded 162 articles after reading the title and abstract. The exclusion criteria were:
therapeutic or surgical studies, children, pregnant women, not related to risk factors and
OSA as a secondary problem from another disease. In the end we had 148 articles to
analyse the full text. In this second analysis we disqualified 46 (without access in time), 46
(not related to risk factors), 8 (not in English or Portuguese), keeping 48 articles.
Data was retrospectively collected from medical histories in the beginning of June,
in a total of 39 variables collected and studied, presented below (Al Lawati, Patel, & Ayas,
2009; Ali et al., 2014; Andrews & Oei, 2004; Ayas et al., 2014; Bennett, 2014; Berry, 2008;
Bonekat & Hardin, 2003; Bonsignore, Borel, Machan, & Grunstein, 2013; Brisco,
Meredith; Goldberg, 2010; Doghramji, 2008; Eckert & Malhotra, 2008; Hanafy, 2007;
Harris, Glozier, Ratnavadivel, & Grunstein, 2009; Heatley et al., 2013; Jordan & McEvoy,
2003; Kapur, 2010; Jamie C M Lam & Ip, 2010; Jamie C M Lam et al., 2010; Jamie Chung
Mei Lam, Mak, & Ip, 2012; Loke, Brown, Kwok, Niruban, & Myint, 2012; Madani &
Madani, 2009; Madani, 2007; Malhotra & White, 2002; Mannarino, Di Filippo, & Pirro,
2012; Martins, Maria, Pereira, & Moura, 2007; Mbata & Chukwuka, 2012; Mieczkowski
& Ezzie, 2014; Mohsenin, 2014; Pagel, 2008; Park, Ramar, & Olson, 2011; Pillar & Lavie,
2011; Riha, 2010; Salles, Cristina; Ramos, Regina; Machado, Adelmir; Cruz, 2013; Schwab,
2005; Schwartz et al., 2008; Sheldon, Belan, Neill, & Rowland; Smith, Ian; Quinnell, 2011;
Stanke-Labesque, Pepin, Gautier-Veyret, Levy, & Back, 2014; Stierer & Punjabi, 2005;
Sutherland, Lee, & Cistulli, 2012; Tasali, Mokhlesi, & Van Cauter, 2008; Tate & Tasota,
2002; Togeiro et al., 2010; Tregear, Reston, Schoelles, & Phillips, 2009; Tuomilehto,
Seppä, & Uusitupa, 2013; Villaneuva, Buchanan, Yee, & Grunstein, 2005; Viswanath,
Ramamurthy, Dinesh, & Srinivas, 2015; Younes, 2003).
32 Methods
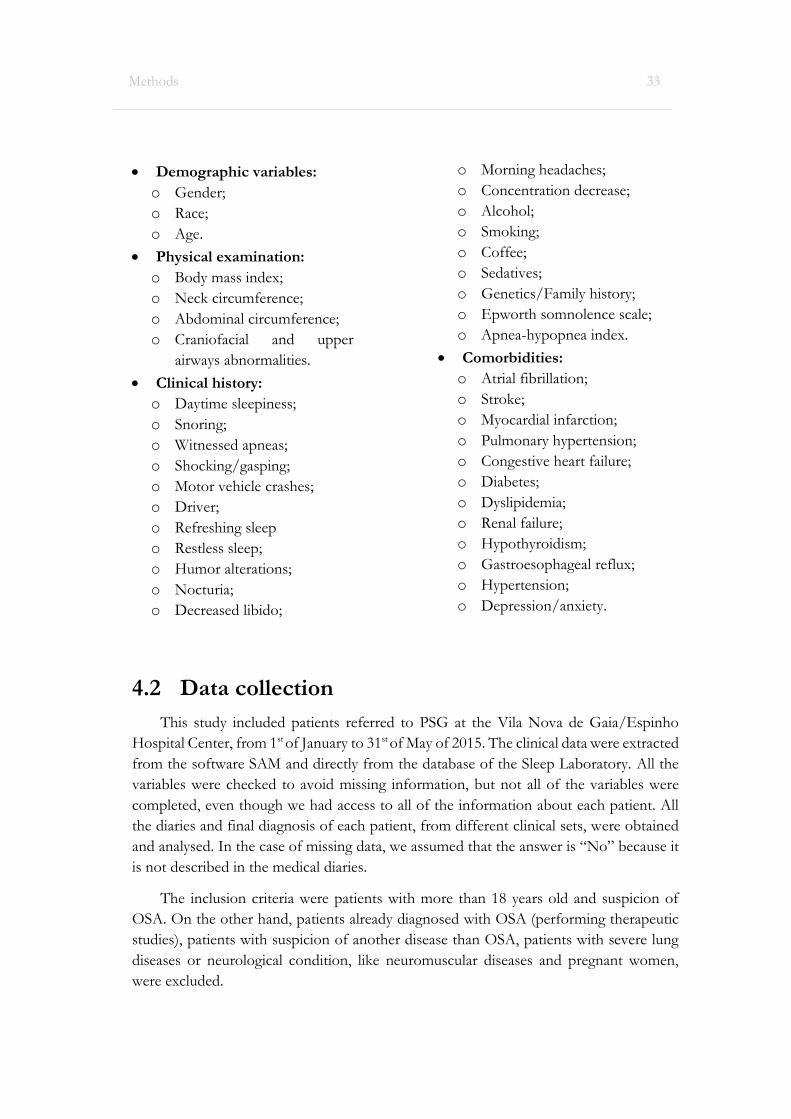
Demographic variables:
o Gender;
o Race;
o Age.
Physical examination:
o Body mass index;
o Neck circumference;
o Abdominal circumference;
o Craniofacial and upper
airways abnormalities.
Clinical history:
o Daytime sleepiness;
o Snoring;
o Witnessed apneas;
o Shocking/gasping;
o Motor vehicle crashes;
o Driver;
o Refreshing sleep
o Restless sleep;
o Humor alterations;
o Nocturia;
o Decreased libido;
o Morning headaches;
o Concentration decrease;
o Alcohol;
o Smoking;
o Coffee;
o Sedatives;
o Genetics/Family history;
o Epworth somnolence scale;
o Apnea-hypopnea index.
Comorbidities:
o Atrial fibrillation;
o Stroke;
o Myocardial infarction;
o Pulmonary hypertension;
o Congestive heart failure;
o Diabetes;
o Dyslipidemia;
o Renal failure;
o Hypothyroidism;
o Gastroesophageal reflux;
o Hypertension;
o Depression/anxiety.
4.2 Data collection
This study included patients referred to PSG at the Vila Nova de Gaia/Espinho
Hospital Center, from 1st of January to 31st of May of 2015. The clinical data were extracted
from the software SAM and directly from the database of the Sleep Laboratory. All the
variables were checked to avoid missing information, but not all of the variables were
completed, even though we had access to all of the information about each patient. All
the diaries and final diagnosis of each patient, from different clinical sets, were obtained
and analysed. In the case of missing data, we assumed that the answer is “No” because it
is not described in the medical diaries.
The inclusion criteria were patients with more than 18 years old and suspicion of
OSA. On the other hand, patients already diagnosed with OSA (performing therapeutic
studies), patients with suspicion of another disease than OSA, patients with severe lung
diseases or neurological condition, like neuromuscular diseases and pregnant women,
were excluded.
Methods 33

The development of the models and its validation were performed in the total sample
of 194 patients, after applying the inclusion and exclusion criteria (collected data from 241
patients). The outcome measure is the clinical diagnosis, categorized into normal or OSA
(mild, moderate and severe).
This was approved by the Ethics Commission of Vila Nova de Gaia/Espinho
Hospital Center, fulfilling the Declaration of Helsinki (annexe 1).
4.3 Bayesian networks
First, a pre-processing of the data was performed and non-continuous variables were
categorized into dichotomous variables:
BMI
o BMI < 30 Kg/m - Normal
o BMI ≥ 30 Kg/m – Obese
NC
o Female
≤ 37 cm – Normal
> 37 cm – Increased
o Male
≤ 42 cm – Normal
> 42 cm – Increased
AC
o Female
≤ 80 cm – Normal
> 80 cm – Increased
o Male
≤ 94 cm – Normal
> 94 cm – Increased
Age
o 0 to 39 years;
o 40 to 49 years;
o 50 to 59 years;
o 60 to 69 years;
o 70 to 79 years;
o 80 to 89 years.
Smoking
o Yes
o No
34 Methods

o Ex-smoker
AHI
o 0 to 4 – Normal
o 5 to 14 – Mild
o 15 to 29 – Moderate
o ≥ 30 – Severe
ESS
o 0 to 10 – Normal
o 11 to 24 – Daytime Sleepiness
A statistical investigate of the previous work (OSA2012) referred in the chapter
introduction was performed. All the 86 patients were analyse to be compare with the new
dataset without missing values, using Chi-square test with a significance level of 5%.
The first BN models were built using all the 39 variables without missing values
(OSA39). This dataset was used to learn the structure, fit the network (probabilities) and
to calculate the predict values and also in cross-validation. The second BN models were
built using only 13 variables (OSA13) that were considered significant, after performing
Chi-square test, with a significance level of 5%. Also, the variables that have a p value
below 0,200 and a value of n≥10 patients were also included. A logistic regression model
– backward conditional - were calculated using 39 variables as independent variables and
the presence of OSA as dependent variable, to helped construct the second model. These
were performed in the “real” dataset, with the missing’s values.
We performed AUC to find the cut-off of each model and Receiver Operating
Characteristics (ROC) curve analysis to determine prediction error. The target is 100%
sensitivity, avoiding false negatives, with increasing specificity.
Given the previous good results in other clinical domains, we use NB and TAN to
build the models. We use software R to learn the networks, with the packages foreign,
bnlearn, gRain and pROC. SamIam software was used to consult the conditional
probabilities, given the outcome.
In the cross-validation we used a 10 times 10-fold cross validation to check for
external validation. All the analysis was performed with R software and SPSS software,
version 22.
The following flow diagram illustrated all the steps take under consideration in the
development of this dissertation (figure 1).
Methods 35

Figure 1: Dissertation Flow diagram
36 Methods


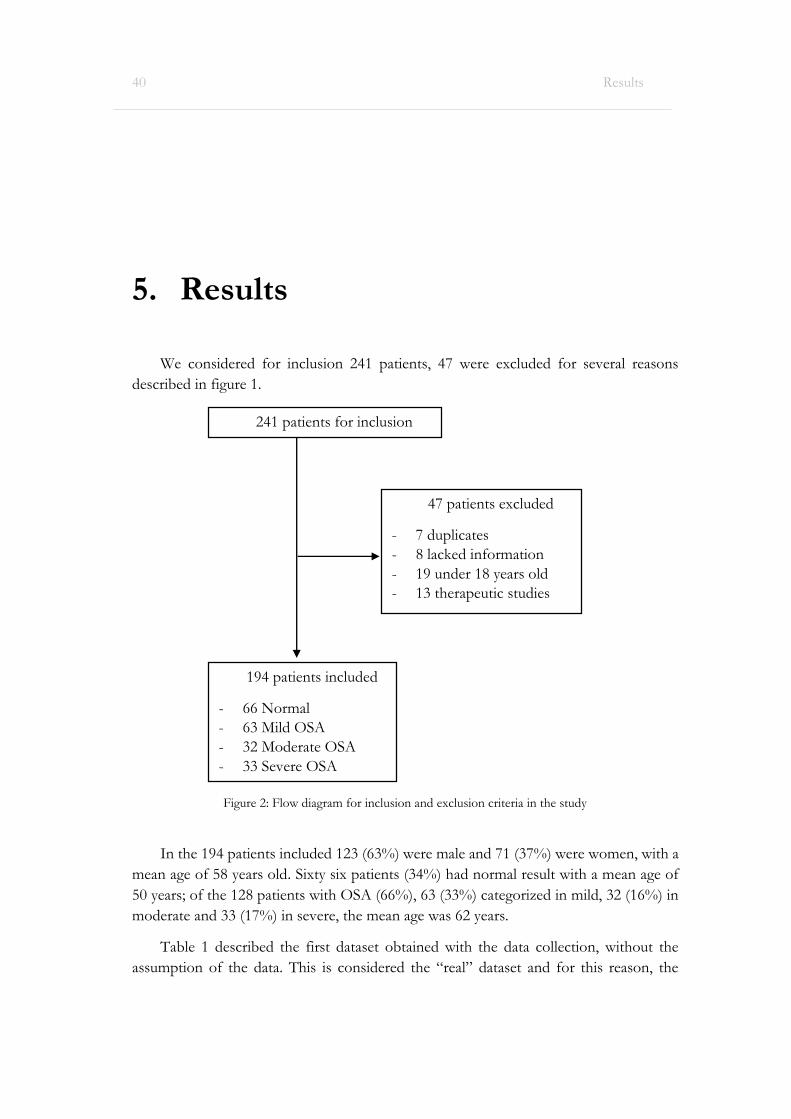
5. Results
We considered for inclusion 241 patients, 47 were excluded for several reasons
described in figure 1.
In the 194 patients included 123 (63%) were male and 71 (37%) were women, with a
mean age of 58 years old. Sixty six patients (34%) had normal result with a mean age of
50 years; of the 128 patients with OSA (66%), 63 (33%) categorized in mild, 32 (16%) in
moderate and 33 (17%) in severe, the mean age was 62 years.
Table 1 described the first dataset obtained with the data collection, without the
assumption of the data. This is considered the “real” dataset and for this reason, the
40 Results
241 patients for inclusion
194 patients included
- 66 Normal
- 63 Mild OSA
- 32 Moderate OSA
- 33 Severe OSA
47 patients excluded
- 7 duplicates
- 8 lacked information
- 19 under 18 years old
- 13 therapeutic studies
Figure 2: Flow diagram for inclusion and exclusion criteria in the study
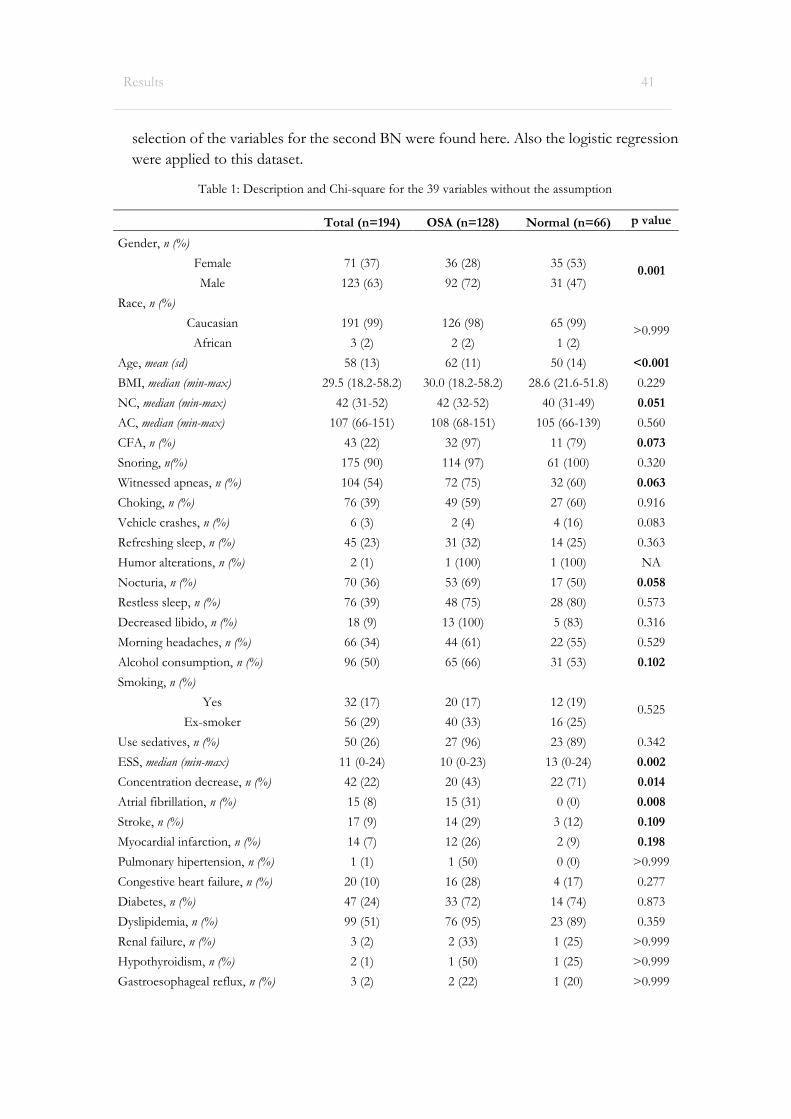
selection of the variables for the second BN were found here. Also the logistic regression
were applied to this dataset.
Table 1: Description and Chi-square for the 39 variables without the assumption
Total (n=194) OSA (n=128) Normal (n=66) p value
Gender, n (%)
Female 71 (37) 36 (28) 35 (53) 0.001
Male 123 (63) 92 (72) 31 (47)
Race, n (%)
Caucasian 191 (99) 126 (98) 65 (99) >0.999
African 3 (2) 2 (2) 1 (2)
Age, mean (sd) 58 (13) 62 (11) 50 (14) <0.001
BMI, median (min-max) 29.5 (18.2-58.2) 30.0 (18.2-58.2) 28.6 (21.6-51.8) 0.229
NC, median (min-max) 42 (31-52) 42 (32-52) 40 (31-49) 0.051
AC, median (min-max) 107 (66-151) 108 (68-151) 105 (66-139) 0.560
CFA, n (%) 43 (22) 32 (97) 11 (79) 0.073
Snoring, n(%) 175 (90) 114 (97) 61 (100) 0.320
Witnessed apneas, n (%) 104 (54) 72 (75) 32 (60) 0.063
Choking, n (%) 76 (39) 49 (59) 27 (60) 0.916
Vehicle crashes, n (%) 6 (3) 2 (4) 4 (16) 0.083
Refreshing sleep, n (%) 45 (23) 31 (32) 14 (25) 0.363
Humor alterations, n (%) 2 (1) 1 (100) 1 (100) NA
Nocturia, n (%) 70 (36) 53 (69) 17 (50) 0.058
Restless sleep, n (%) 76 (39) 48 (75) 28 (80) 0.573
Decreased libido, n (%) 18 (9) 13 (100) 5 (83) 0.316
Morning headaches, n (%) 66 (34) 44 (61) 22 (55) 0.529
Alcohol consumption, n (%) 96 (50) 65 (66) 31 (53) 0.102
Smoking, n (%)
Yes 32 (17) 20 (17) 12 (19) 0.525
Ex-smoker 56 (29) 40 (33) 16 (25)
Use sedatives, n (%) 50 (26) 27 (96) 23 (89) 0.342
ESS, median (min-max) 11 (0-24) 10 (0-23) 13 (0-24) 0.002
Concentration decrease, n (%) 42 (22) 20 (43) 22 (71) 0.014
Atrial fibrillation, n (%) 15 (8) 15 (31) 0 (0) 0.008
Stroke, n (%) 17 (9) 14 (29) 3 (12) 0.109
Myocardial infarction, n (%) 14 (7) 12 (26) 2 (9) 0.198
Pulmonary hipertension, n (%) 1 (1) 1 (50) 0 (0) >0.999
Congestive heart failure, n (%) 20 (10) 16 (28) 4 (17) 0.277
Diabetes, n (%) 47 (24) 33 (72) 14 (74) 0.873
Dyslipidemia, n (%) 99 (51) 76 (95) 23 (89) 0.359
Renal failure, n (%) 3 (2) 2 (33) 1 (25) >0.999
Hypothyroidism, n (%) 2 (1) 1 (50) 1 (25) >0.999
Gastroesophageal reflux, n (%) 3 (2) 2 (22) 1 (20) >0.999
Results 41

Hypertension, n (%) 123 (63) 91 (96) 32 (89) 0.214
Driver, n (%) 16 (8) 13 (12) 3 (5) 0.130
Coffee, n (%) 120 (62) 76 (88) 44 (85) 0.525
Daytime sleepiness, n (%) 114 (59) 65 (77) 49 (94) 0.010
Genetics/Family history, n (%) 2 (1) 0 (0.0) 2 (100) 0.333
Depression, n (%) 53 (27) 28 (97) 25 (93) 0.605
AHI, n (%)
Normal 66 (34)
Mild 63 (33)
Moderate 32 (16)
Severe 33 (17)
OSA, n (%) 128 (66)
BMI: Body Mass Index; NC: Neck circumference; AC: Abdominal circumference; CFA: Craniofacial and upper
airway abnormalities; ESS: Epworth Somnolence Scale; AHI: Apnea-Hypopnea Index; OSA: Obstructive Sleep
Apnea
After this analysis, the dataset was fulfilling with the assumption. Like previous statement,
the access to all the diaries and diagnostics of each patient were obtained and studied, so we
assumed that if the patient does not have a medical record saying yes, is because he or she
does not have it. After this assumption, table 2 demonstrated the new dataset obtained.
Table 2: Description and Chi-square for the 39 variables with the assumption
Total (n=194) OSA (n=128) Normal (n=66) p value
Gender, n (%)
Female 71 (37) 36 (28) 35 (53) 0.001
Male 123 (63) 92 (72) 31 (47)
Race, n (%)
Caucasian 191 (99) 126 (98) 65 (99) >0.999
African 3 (2) 2 (2) 1 (2)
Age, mean (sd) 58 (13) 62 (11) 50 (14) <0.001
BMI, median (min-max) 29.5 (18.2-58.2) 30.0 (18.2-58.2) 28.6 (21.6-51.8) 0.229
NC, median (min-max) 42 (31-52) 42 (32-52) 40 (31-49) 0.051
AC, median (min-max) 107 (66-151) 108 (68-151) 105 (66-139) 0.560
CFA, n (%) 43 (22) 32 (25) 11 (17) 0.186
Snoring, n(%) 175 (90) 114 (89) 61 (92) 0.455
Witnessed apneas, n (%) 104 (54) 72 (56) 32 (49) 0.304
Choking, n (%) 76 (39) 49 (38) 27 (41) 0.722
Vehicle crashes, n (%) 6 (3) 2 (2) 4 (6) 0.183
Refreshing sleep, n (%) 45 (23) 31 (24) 14 (21) 0.638
Humor alterations, n (%) 2 (1) 1 (1) 1 (2) >0.999
Nocturia, n (%) 70 (36) 53 (41) 17 (26) 0.032
Restless sleep, n (%) 76 (39) 48 (38) 28 (42) 0.506
Decreased libido, n (%) 18 (9) 13 (10) 5 (8) 0.557
42 Results

Morning headaches, n (%) 66 (34) 44 (34) 22 (33) 0.885
Alcohol consumption, n (%) 96 (50) 65 (51) 31 (47) 0.615
Smoking, n (%)
Yes 32 (17) 20 (16) 12 (18) 0.585
Ex-smoker 56 (29) 40 (31) 16 (24)
Use sedatives, n (%) 50 (26) 27 (21) 23 (35) 0.038
ESS, median (min-max) 11 (0-24) 10 (0-23) 13 (0-24) 0.002
Concentration decrease, n (%) 42 (22) 20 (16) 22 (33) 0.005
Atrial fibrillation, n (%) 15 (8) 15 (12) 0 (0) 0.004
Stroke, n (%) 17 (9) 14 (11) 3 (5) 0.136
Myocardial infarction, n (%) 14 (7) 12 (9) 2 (3) 0.145
Pulmonary hipertension, n (%) 1 (1) 1 (1) 0 (0) >0.999
Congestive heart failure, n (%) 20 (10) 16 (13) 4 (6) 0.162
Diabetes, n (%) 47 (24) 33 (26) 14 (21) 0.482
Dyslipidemia, n (%) 99 (51) 76 (59) 23 (35) 0.001
Renal failure, n (%) 3 (2) 2 (2) 1 (2) >0.999
Hypothyroidism, n (%) 2 (1) 1 (1) 1 (2) >0.999
Gastroesophageal reflux, n (%) 3 (2) 2 (2) 1 (2) >0.999
Hypertension, n (%) 123 (63) 91 (71) 32 (49) 0.002
Driver, n (%) 16 (8) 13 (10) 3 (5) 0.178
Coffee, n (%) 120 (62) 76 (59) 44 (67) 0.322
Daytime sleepiness, n (%) 124 (64) 69 (54) 55 (83) <0.001
Genetics/Family history, n (%) 2 (1) 0 (0) 2 (3) 0.115
Depression, n (%) 54 (28) 29 (23) 25 (38) 0.025
AHI, n (%)
Normal 66 (34)
Mild 63 (33)
Moderate 32 (16)
Severe 33 (17)
OSA, n (%) 128 (66)
BMI: Body Mass Index; NC: Neck circumference; AC: Abdominal circumference; CFA: Craniofacial and upper
airway abnormalities; ESS: Epworth Somnolence Scale; AHI: Apnea-Hypopnea Index; OSA: Obstructive Sleep
Apnea
The OSA39 were used to construct the two BN models, like previous said, and so is this
that we needed to use to compared the new data and the old one. This comparison was
relevant because we wanted to expand our results. Table 3 is the result of the comparison of
OSA39 and OSA2012.
Results 43

Table 3: Comparison of the new dataset (OSA39) with the previous work (OSA2012)
OSA39 (n=194) OSA2012 (n=86) p value
Gender, n (%)
Female 71 (37) 16 (19) 0.003
Male 123 (63) 70 (81)
Race, n (%)
Caucasian 191 (99) 84 (98) >0.999
African 3 (2) 2 (2)
Age, mean (sd) 58 (13) 56 (14) 0.676
BMI, median (min-max) 29.5 (18.2-58.2) 28.9 (21.7-44.5) 0.012
NC, median (min-max) 42 (31-52) 41 (33-104) 0.074
AC, median (min-max) 107 (66-151) 103 (2-150) 0.201
CFA, n (%) 43 (22) 46 (54) <0.001
Snoring, n(%) 175 (90) 86 (100) 0.003
Witnessed apneas, n (%) 104 (54) 55 (65) 0.085
Choking, n (%) 76 (39) 22 (26) 0.028
Vehicle crashes, n (%) 6 (3) 6 (8) 0.112
Refreshing sleep, n (%) 45 (23) 39 (45) <0.001
Humor alterations, n (%) 2 (1) 4 (5) 0.074
Nocturia, n (%) 70 (36) 32 (37) 0.857
Restless sleep, n (%) 76 (39) 13 (15) <0.001
Decreased libido, n (%) 18 (9) 1 (1) 0.013
Morning headaches, n (%) 66 (34) 18 (21) 0.027
Alcohol consumption, n (%) 96 (50) 38 (44) 0.413
Smoking, n (%)
Yes 32 (17) 17 (20) 0.743
Ex-smoker 56 (29) 22 (26)
Use sedatives, n (%) 50 (26) 17 (20) 0.277
ESS, median (min-max) 11 (0-24) 9 (0-24) 0.044
Concentration decrease, n (%) 42 (22) 11 (13) 0.081
Atrial fibrillation, n (%) 15 (8) 2 (2) 0.081
Stroke, n (%) 17 (9) 3 (4) 0.114
Myocardial infarction, n (%) 14 (7) 6 (7) 0.943
Pulmonary hipertension, n (%) 1 (1) 0 (0) >0.999
Congestive heart failure, n (%) 20 (10) 1 (1) 0.007
Diabetes, n (%) 47 (24) 17 (20) 0.412
Dyslipidemia, n (%) 99 (51) 1 (1) <0.001
Renal failure, n (%) 3 (2) 0 (0) 0.555
Hypothyroidism, n (%) 2 (1) 3 (4) 0.328
Gastroesophageal reflux, n (%) 3 (2) 4 (5) 0.207
Hypertension, n (%) 123 (63) 42 (49) 0.022
Driver, n (%) 16 (8) NA NA
Coffee, n (%) 120 (62) NA NA
44 Results

Daytime sleepiness, n (%) 124 (64) NA NA
Genetics/Family history, n (%) 2 (1) NA NA
Depression, n (%) 54 (28) NA NA
AHI, n (%)
Normal 66 (34) 39 (45)
0.184 Mild 63 (33) 18 (21)
Moderate 32 (16) 15 (17)
Severe 33 (17) 14 (16)
OSA, n (%) 128 (66) 47 (55) 0.071
BMI: Body Mass Index; NC: Neck circumference; AC: Abdominal circumference; CFA: Craniofacial and upper
airway abnormalities; ESS: Epworth Somnolence Scale; AHI: Apnea-Hypopnea Index; OSA: Obstructive Sleep
Apnea
Analysing table 3, becomes obvious that the two datasets are not resembling. Because of
this, the results of this dissertation will only rely on the new dataset.
Utilizing R software two BN models were created for the 39 variables. The first (figure 3)
is a NB model, with the outcome – OSA – and all the factors. The second image is regarding
a TAN model (figure 4).
Figure 3: Naive Bayes with the 39 variables
Results 45

For these two model’s we obtained a ROC curve (figure 5), demonstrated and AUC of
83% for the NB model (NB39) and 97% for the TAN (TAN39). When performing predict
and cross-validation we obtained a sensitivity of 75% and a specificity of 57% for the NB
model and 82% and 55%, respectively, for TAN (table 4).
Figure 4: Tree augmented Bayesian network with the 39 variables
Figure 5: ROC Curves for Naive Bayes and Tree augmented Bayesian network with the 39 variables
46 Results

Although the values of ROC curves are higher than 80% presented good discriminate
power towards the outcome (using the 50% threshold classification cut off to predict the
outcome) the specificity of the models are low. On the other hand, if we try to apply the
TAN39 to the clinical setting we will have a problem: the number of variables to be collected.
Thinking of this issue, a new model were created. This will only involve 13 variables, become
easiest to fulfilling.
Analysing table 1 informed us of the 14 variables that are relevant to the model: gender;
age; NC; craniofacial and upper airway abnormalities; WA; nocturia; alcohol before sleep;
ESS; concentration decrease; atrial fibrillation; stroke; myocardial infarction; driver (truck)
and daytime sleepiness. But, after the logistic regression and analyse of the TAN network,
we considered age as a confounding factor.
Figure 6 presents the NB with the 13 variables selected (NB13).
For the 13 variables, ROC curve (figure 7), demonstrated an AUC of 79% for the NB
model (NB13) and 85% for the TAN (TAN13).
Figure 6: Naive Bayes with the 13 variables selected
Figure 7: ROC Curves for Naive Bayes and Tree augmented Bayesian network with the 13 variables
Results 47

The figure 8 demonstrated the TAN network obtained. And figure 9, the conditional
probabilities of this network.
Figure 8: Tree augmented Bayesian network with the 13 variables selected
Figure 9: Marginal probabilities of Tree augmented Bayesian network to the presence of OSA
48 Results

The 13 variables selected can be divided in risk factors and diagnostic factors. This can
be relevant if we want to study a causal model. In the risk factors group we may include:
gender; NC; craniofacial and upper airway abnormalities; alcohol before sleep; atrial
fibrillation; stroke; myocardial infarction and truck driver. In the diagnostic factors: WA;
nocturia; ESS; concentration decrease and daytime sleepiness. A BN model were created to
illustrate this, using HC strategy.
Table 4 presents the result of the 10-times-repeated stratified 10-fold cross-validation.
From the exposed results, TAN39 rises as the best classification model (using the 50%
threshold classification cut off to predict the outcome) only losing in terms of specificity.
This could possibly be overcome with a threshold study.
Table 4: Validity assessment averaged from 10 times 10-fold cross validation
Model Accuracy Sensitivity Specificity Precision (Positive)
Precision (Negative) AUC
NB39 68.82%
[66.67.70.97] 75.03%
[72.57.77.5] 56.67%
[52.46.60.87] 77.81%
[75.97.79.66] 54.46%
[51.03.57.88] 71.61%
[68.88.74.33]
TAN39 72.57%
[70.69.74.45] 81.67%
[79.26.84.08] 54.83%
[50.93.58.74] 78.5%
[76.93.80.07] 62.46%
[58.67.66.25] 78.6%
[76.4.80.8]
NB13 68.84%
[66.84.70.83] 75.8%
[73.43.78.17] 55.25%
[51.56.58.94] 77.31%
[75.62.79] 55.46%
[52.08.58.84] 74.58%
[72.2.76.96]
TAN13 69.9%
[68.01.71.79] 81.22%
[79.83.43] 47.75%
[44.28.51.22] 75.54%
[74.14.76.94] 58.64%
[54.58.62.7] 75.47%
[73.01.77.93]
Figure 10: Causal Hill climbing with the 13 variables selected
Results 49


6. Discussion
The initial step towards defining a decision support tool is to evaluate the need for
it. Previous work on BN for OSA was biased by a selection of significant variables
(gender, BMI, NC, AC, WA and alcohol before sleep). This reduced the interpretability
and discriminative power of the models and the predictive quality.
In the sample, the proportion of normal results was 34%, revealing a large number
of normal exams that are performed every day. As we expected, a good clinical decision
support tool is needed to prioritize patients (reducing the waiting lists).
A large number of clinical variables were used (39 variables), but only 13 had
significant results: gender, age, NC, craniofacial and upper airway abnormalities, WA,
nocturia, alcohol before sleep, ESS, concentration decrease, atrial fibrillation, stroke,
myocardial infarction, truck driver and daytime sleepiness.
In our study, male gender was more prevalent (63%), as referred in the background.
One possible explanation is the higher prevalence of craniofacial and upper airway
abnormalities (21%), and also snoring (90%). Regarding the WA, men have a percentage
of 60% against 43% in women. This can be explain because of female bed partners appear
to have a lower threshold for symptom perceptions and reporting than male bed partners.
Other studies presents age as an important risk factor. In our study, even though age
presents a statistical significance, it cannot be used, because was considered a confounding
factor. The NC need to be consider as an important factor to OSA, and more studies are
important to prove this.
In the first BN model (39 variables), a sensitivity of 82% and a PPV of 79% were
reach with the TAN model, telling us that patients with OSA are identified in 80% of the
exams performed. It left us a 20% of patients that have the disease and the BN model
cannot predict it. In the second BN model (13 variables), a sensitivity of 81% and a PPV
of 76% were obtained, also in TAN model. Looking to the AUC of each model – TAN
39 and TAN13 – with 79% and 75%, respectively, we can affirm that the selection of the
variables, making the model more adequate to the clinical practice, can be generalized.
To explain how the TAN13 network can be implemented in a clinical decision
support tool, we apply information of several patients (marked in red).
52 Discussion

The first patient is female and have a normal NC. Is a health patient, so thus not have any
comorbidity or WA. She described fatigue and presents an ESS of 11. She do not have the
drivers licence and usually do not go to the bathroom during the night. Regarding alcohol
consumption, she does not drink alcohol. The probability of OSA is 28% (figure 11). The
same characteristics, but in a male, the probability of OSA increases for 59% (figure 12).
Figure 12: Inference using TAN13 in a female patient
Figure 11: Inference using TAN13 in a male patient
Discussion 53

Imagine that, in the case that we presented above, we don’t access to NC. We can use
TAN13 without this information as the probabilities are obtained are based on the learning
process that the network are built with the information of other patients, in this case, with
194 other patient’s. The results of this missing value are present below in figure 13. In the
female case the probability changes to 34% and in the male case to 65%.
Figure 13: Inference using TAN13 in female and male patient
54 Discussion

6.1 Limitations
The lack of representativeness of some factors, like ethnicity, vehicle crashes, humor
alterations, decreased libido, pulmonary hypertension, congestive heart failure, renal
failure, hypothyroidism, gastroesophageal reflux and genetics, may lead to a biased model
in the 39 variables. Our study was conducted on patients referred by primary care
physicians to the sleep consult, so OSA prevalence cannot be estimated.
The selection of significant variables (13 variables) may reduce the interpretability,
the accuracy, sensitivity and precision of the model, but can improve the implementation
of this network in the clinical practice.
Discussion 55


7. Conclusion
Our study presents as main risk factors the gender; NC; craniofacial and upper airway
abnormalities; alcohol before sleep; atrial fibrillation; stroke; myocardial infarction and
truck driver. And as diagnostic factors the WA; nocturia; ESS; concentration decrease and
daytime sleepiness.
We used two datasets. The first with the missing values, obtained directly from the
diaries and diagnostics of each patient and the second one, using the first, but fulfilling
the missing values with the assumption that if it was not described in the patient medical
records, the patient does not get it. The first dataset is consider the “real” dataset and
because of that this was used to test the Chi-square, and to obtain the significant variables.
The second dataset were used to build the network.
Two types of models were created: NB and TAN. In our study, TAN is consider a
better classifier, proving the great advantages of BN models. It can deal with missing
information and its graphical representation can shows not only the probabilities given
the patient characteristics but also the relationship between variables.
Portugal does not have a validated method to screen patients with suspicion of OSA,
before performing PSG, so we think that our model (TAN13) consist in a valid method.
A protocol of the evaluation of the implementation of TAN13 in the primary care are in
the section annexe. We think that this can reduce the number of normal results exams,
optimizing the available resources and prioritizing patients.
58 Conclusion


8. Future work
More studies are required to better fit a clinical decision support model in to clinical
practice, especially if we consider anticipating support to the primary care. We need to
compare our results to other sleep laboratories, collected more information from risk and
diagnostic factors and try to implement our protocol. This will be essentially to evaluate
model TAN13 in the primary care.
Also, another variable to take in account wold be Modified Mallampati. Nowadays,
literature begins to talk about this as a risk factor for OSA. This is used to predict the ease
of intubation. A high Mallampati score (>3) is associated with more difficult intubation
as well as a higher incidence of OSA. It asses the height of the mouth and the distance
from the tongue base to the roof of the mouth.
62 Future Work


9. References
Ahmadi, N., Chung, S. A., Gibbs, A., & Shapiro, C. M. (2008). The Berlin questionnaire for sleep apnea in a sleep clinic population: relationship to polysomnographic measurement of respiratory disturbance. Sleep and Breathing, 12(1), 39–45. doi:10.1007/s11325-007-0125-y
Al Lawati, N. M., Patel, S. R., & Ayas, N. T. Epidemiology, risk factors, and consequences of obstructive sleep apnea and short sleep duration. Progress in Cardiovascular Diseases, 51(4), 285–93. doi:10.1016/j.pcad.2008.08.001
Al Lawati, N. M., Patel, S. R., & Ayas, N. T. (2009). Epidemiology, risk factors, and consequences of obstructive sleep apnea and short sleep duration. Progress in Cardiovascular Diseases, 51(4), 285–293. doi:10.1016/j.pcad.2008.08.001
Alam, A., Chengappa, R., & Ghinassi, F. (2012). Screening for obstructive sleep apnea among individuals with severe mental illness at a primary care clinic. General Hospital Psychiatry, 34(6), 660–664. doi:10.1016/j.genhosppsych.2012.06.015
Ali, S. S., Oni, E. T., Warraich, H. J., Blaha, M. J., Blumenthal, R. S., Karim, A., … Nasir, K. (2014). Systematic review on noninvasive assessment of subclinical cardiovascular disease in obstructive sleep apnea: new kid on the block! Sleep Medicine Reviews, 18(5), 379–391. doi:10.1016/j.smrv.2014.01.004
Andrews, J. G., & Oei, T. P. S. (2004). The roles of depression and anxiety in the understanding and treatment of Obstructive Sleep Apnea Syndrome. Clinical Psychology Review, 24(8), 1031–49. doi:10.1016/j.cpr.2004.08.002
Ayas, N. T., Hirsch, A. A. J., Laher, I., Bradley, T. D., Malhotra, A., Polotsky, V. Y., & Tasali, E. (2014). New frontiers in obstructive sleep apnoea. Clinical Science, 127(4), 209–216. doi:10.1042/CS20140070
Barros, Pedro Pita; Machado, Sara Ribeirnho; Simões, J. de A. (2011). Portugal. Health system review. Health Systems in Transit, 13(4), 1–156.
Bennett, L. S. (2014). Adult obstructive sleep apnoea. Lancet, 33(5), 439–444. doi:10.1016/S0140-6736(13)60734-5.Adult
66 References

Berry, D. (2008). Case study: obstructive sleep apnea. Medsurg Nursing, 17(1), 11–6; quiz 17.
Retrieved from http://www.ncbi.nlm.nih.gov/pubmed/18429535
Blondet, M., Yapor, P., Latalladi-Ortega, G., Alicea, E., Torres-Palacios, A., & Rodríguez-Cintrón, W. (2009). Prevalence and risk factors for sleep disordered breathing in a Puerto Rican middle-aged population. Sleep and Breathing, 13(2), 175–180. doi:10.1007/s11325-008-0216-4
Bonekat, H. W., & Hardin, K. A. (2003). Severe upper airway obstruction during sleep. Clinical Reviews in Allergy & Immunology, 25(2), 191–210. doi:10.1385/CRIAI:25:2:191
Bonsignore, M. R., Borel, A.-L., Machan, E., & Grunstein, R. (2013). Sleep apnoea and metabolic dysfunction. European Respiratory Review, 22(129), 353–364. doi:10.1183/09059180.00003413
Bouloukaki, I., Komninos, I. D., Mermigkis, C., Micheli, K., Komninou, M., Moniaki, V., … Schiza, S. E. (2013). Translation and validation of Berlin questionnaire in primary health care in Greece. BMC Pulmonary Medicine, 13, 6. doi:10.1186/1471-2466-13-6
Brisco, Meredith; Goldberg, L. (2010). Sleep apnea in congestive heart failure. Current Heart Failure Reports, 7, 175–184. Retrieved from http://apps.webofknowledge.com/full_record.do?product=UA&search_mode=GeneralSearch&qid=2&SID=Y16ZWrgIVnKfhue7Mt9&excludeEventConfig=ExcludeIfFromFullRecPage&page=121&doc=1242
Broström, A., Sunnergren, O., Årestedt, K., Johansson, P., Ulander, M., Riegel, B., & Svanborg, E. (2012). Factors associated with undiagnosed obstructive sleep apnoea in hypertensive primary care patients. Scandinavian Journal of Primary Health Care, 30(2), 107–113. doi:10.3109/02813432.2012.675563
Brostrom, A., Sunnergren, O., Johansson, P., Svensson, E., Ulander, M., Nilsen, P., & Svanborg, E. (2012). Symptom profile of undiagnosed obstructice sleep anpnoea in hypertensive outpatients in primary care: a sturctural equation model analysis. Quality in Primary Care, 20, 287–298.
Cass, Alvah; Alonso, Jerome; Islam, Jamal; Weller, S. (2013). Risk of Obstructive Sleep Apnea in Patients With Type 2 Diabetes Mellitus. Family Medicine, 45(7), 492–500. Retrieved from http://apps.webofknowledge.com/full_record.do?product=UA&search_mode=GeneralSearch&qid=2&SID=Y1XzkpI2StDMwpKQdQt&excludeEventConfig=ExcludeIfFromFullRecPage&page=41&doc=521
Chung, S., Jairam, S., Hussain, M. R. G., & Shapiro, C. M. (2002). How, what, and why of sleep apnea. Perspectives for primary care physicians. Canadian Family Physician, 48, 1073–80. Retrieved from http://www.pubmedcentral.nih.gov/articlerender.fcgi?artid=2214069&tool=pmcentrez&rendertype=abstract
References 67
Corral-Peñafiel, J., Pepin, J.-L., & Barbe, F. (2013). Ambulatory monitoring in the
diagnosis and management of obstructive sleep apnoea syndrome. European Respiratory Review, 22(129), 312–24. doi:10.1183/09059180.00004213
Culpepper, L., & Roth, T. (2009). Recognizing and managing obstructive sleep apnea in primary care. Primary Care Companion to the Journal of Clinical Psychiatry, 11(6), 330–338. doi:10.4088/PCC.08m00725
Davies, R. J., Ali, N. J., & Stradling, J. R. (1992). Neck circumference and other clinical features in the diagnosis of the obstructive sleep apnoea syndrome. Thorax, 47(2), 101–5. Retrieved from http://www.pubmedcentral.nih.gov/articlerender.fcgi?artid=463582&tool=pmcentrez&rendertype=abstract
Di Guardo, A., Profeta, G., Crisafulli, C., Sidoti, G., Zammataro, M., Paolini, I., & Filippi, A. (2010). Obstructive sleep apnoea in patients with obesity and hypertension. British Journal of General Practice, 60(574), 325–328. doi:10.3399/bjgp10X484174
Doghramji, P. P. (2008). Recognition of obstructive sleep apnea and associated excessive sleepiness in primary care. The Journal of Family Practice, 57(8 Suppl), S17–23. Retrieved from http://www.ncbi.nlm.nih.gov/pubmed/18687235
Dursunoglu, N., Ozkurt, S., & Sarikaya, S. (2009). Is the clinical presentation different between men and women admitting to the sleep laboratory? Sleep and Breathing, 13(3), 295–298. doi:10.1007/s11325-008-0243-1
Eckert, D. J., & Malhotra, A. (2008). Pathophysiology of adult obstructive sleep apnea. Proceedings of the American Thoracic Society, 5(2), 144–153. doi:10.1513/pats.200707-114MG
Epstein, L. J., Kristo, D., Strollo, P. J., Friedman, N., Malhotra, A., Patil, S. P., … Weinstein, M. D. (2009). Clinical guideline for the evaluation, management and long-term care of obstructive sleep apnea in adults. Journal of Cinical Sleep Medicine, 5(3), 263–276.
Greenberg-Dotan, S., Reuveni, H., Tal, A., Oksenberg, A., Cohen, A., Shaya, F. T., … Scharf, S. M. (2014). Increased prevalence of obstructive lung disease in patients with obstructive sleep apnea. Sleep & Breathing = Schlaf & Atmung, 18(1), 69–75. doi:10.1007/s11325-013-0850-3
Hanafy, H. M. (2007). Testosterone therapy and obstructive sleep apnea: is there a real connection? The Journal of Sexual Medicine, 4(5), 1241–1246. doi:10.1111/j.1743-6109.2007.00553.x
Harris, M., Glozier, N., Ratnavadivel, R., & Grunstein, R. R. (2009). Obstructive sleep apnea and depression. Sleep Medicine Reviews, 13(6), 437–44. doi:10.1016/j.smrv.2009.04.001
68 References
Hayes, S. M., Murray, S., Castriotta, R. J., Landrigan, C. P., & Malhotra, A. (2012). (Mis)
Perceptions and interactions of sleep specialists and generalists: Obstacles to referrals to sleep specialists and the multidisciplinary team management of sleep disorders. Journal of Clinical Sleep Medicine, 8(6), 633–642. doi:10.5664/jcsm.2252
Heatley, E. M., Harris, M., Battersby, M., McEvoy, R. D., Chai-Coetzer, C. L., & Antic, N. A. (2013). Obstructive sleep apnoea in adults: a common chronic condition in need of a comprehensive chronic condition management approach. Sleep Medicine Reviews, 17(5), 349–355. doi:10.1016/j.smrv.2012.09.004
Hoffstein, V., & Szalai, J. P. (1993). Predictive value of clinical features in diagnosing obstructive sleep apnea. Sleep, 16(2), 118–22. Retrieved from http://www.ncbi.nlm.nih.gov/pubmed/8446830
Jennum, P., & Riha, R. L. (2009). Epidemiology of sleep apnoea/hypopnoea syndrome and sleep-disordered breathing. The European Respiratory Journal, 33(4), 907–14. doi:10.1183/09031936.00180108
Johns, M. W. (1991). A new method for measuring daytime sleepiness: the Epworth sleepiness scale. Sleep, 14(6), 540–5. Retrieved from http://www.ncbi.nlm.nih.gov/pubmed/1798888
Jordan, A. S., & McEvoy, R. D. (2003). Gender differences in sleep apnea: epidemiology, clinical presentation and pathogenic mechanisms. Sleep Medicine Reviews, 7(5), 377–389.
Kang, K., Park, K.-S., Kim, J.-S. J.-E., Kim, S.-W., Kim, Y.-T., Kim, J.-S. J.-E., & Lee, H.-W. (2013). Usefulness of the Berlin Questionnaire to identify patients at high risk for obstructive sleep apnea: a population-based door-to-door study. Sleep and Breathing, 17(2), 803–10. doi:10.1007/s11325-012-0767-2
Kapur, V. (2010). Obstructive Sleep Apnea: Diagnosis, Epidemiology, and Economics. Respiratory Care, 55(9), 1155–1167.
Kohler, M. (2009). Risk factors and treatment for obstructive sleep apnea amongst obese children and adults. Current Opinion in Allergy and Clinical Immunology, 9(1), 4–9. doi:10.1097/ACI.0b013e32831d8184
Kononenko, I. (2001). Machine learning for medical diagnosis: history, state of the art and perspective. Artificial Intelligence in Medicine, 23(1), 89–109. doi:10.1016/S0933-3657(01)00077-X
Lam, J. C. M., & Ip, M. S. M. (2010). Sleep & the metabolic syndrome. The Indian Journal of Medical Research, 131, 206–16. Retrieved from http://www.ncbi.nlm.nih.gov/pubmed/20308746
Lam, J. C. M., Mak, J. C. W., & Ip, M. S. M. (2012). Obesity, obstructive sleep apnoea and metabolic syndrome. Respirology, 17(17), 223–36. doi:10.1111/j.1440-1843.2011.02081.x
References 69

Lam, J. C. M., Sharma, S. K., & Lam, B. (2010). Obstructive sleep apnoea: Definitions,
epidemiology & natural history. Indian Journal of Medical Research, 131, 165–170. Retrieved from http://apps.webofknowledge.com/full_record.do?product=UA&search_mode=GeneralSearch&qid=2&SID=Y2ZOo7KbndGHM8xuJN6&excludeEventConfig=ExcludeIfFromFullRecPage&page=135&doc=1417
Lee, S.-M., & Abbott, P. A. (2003). Bayesian networks for knowledge discovery in large datasets: basics for nurse researchers. Journal of Biomedical Informatics, 36(4-5), 389–399. doi:10.1016/j.jbi.2003.09.022
Lee, Won; Nagubadi, Swamy; Kryger, Meir; Mokhlesi, B. (2008). Epidemiology of Obstructive Sleep Apnea: a Population-based Perspective. Expert Review of Respiratory Medicine, 2(3), 349–364. doi:10.1586/17476348.2.3.349.Epidemiology
Leite, L. (2012). Refining pre-polysomnography suspicion of Obstructive Sleep Apnea Syndrome: Logistic and Bayesian analysis of clinical factors. Master’s Thesis.
Loke, Y. K., Brown, J. W. L., Kwok, C. S., Niruban, A., & Myint, P. K. (2012). Association of obstructive sleep apnea with risk of serious cardiovascular events: a systematic review and meta-analysis. Circulation. Cardiovascular Quality and Outcomes, 5(5), 720–728. doi:10.1161/CIRCOUTCOMES.111.964783
Lucas, P. (2004). Bayesian analysis, pattern analysis, and data mining in health care. Current Opinion in Critical Care, 10(5), 399–403. Retrieved from http://www.ncbi.nlm.nih.gov/pubmed/15385759
Lucas, P. J. F., van der Gaag, L. C., & Abu-Hanna, A. (2004). Bayesian networks in biomedicine and health-care. Artificial Intelligence in Medicine, 30(3), 201–14. doi:10.1016/j.artmed.2003.11.001
Madani, M. (2007). Snoring and obstructive sleep apnea. Archives of Iranian Medicine, 10(2), 215–226. Retrieved from http://apps.webofknowledge.com/full_record.do?product=UA&search_mode=GeneralSearch&qid=2&SID=Q2XRMZMuX4H7vnQORrq&excludeEventConfig=ExcludeIfFromFullRecPage&page=279&doc=2817
Madani, M., & Madani, F. (2009). Epidemiology, pathophysiology, and clinical features of obstructive sleep apnea. Oral and Maxillofacial Surgery Clinics of North America, 21(4), 369–75. doi:10.1016/j.coms.2009.09.003
Malhotra, A., & White, D. P. (2002). Obstructive sleep apnoea. Lancet, 360(9328), 237–245. doi:10.1016/S0140-6736(02)09464-3
Manber, R., & Armitage, R. (1999). Sex, steroids, and sleep: a review. Sleep, 22(5), 540–55. Retrieved from http://www.ncbi.nlm.nih.gov/pubmed/10450590
70 References

Mannarino, M. R., Di Filippo, F., & Pirro, M. (2012). Obstructive sleep apnea syndrome.
European Journal of Internal Medicine, 23(7), 586–593. doi:10.1016/j.ejim.2012.05.013
Mansfield, D. R., Antic, N. A., & McEvoy, R. D. (2013). How to assess, diagnose, refer and treat adult obstructive sleep apnoea: a commentary on the choices. The Medical Journal of Australia, 199(8), S21–6. doi:10.5694/mja13.10909
Martins, A. B., Maria, S., Pereira, G., & Moura, T. (2007). Physiopathology of obstructive sleep apnea-hypopnea syndrome. Jornal Brasileiro de Pneumologia, 33(1), 93–100.
Mattei, A., Tabbia, G., & Baldi, S. (2004). Diagnosis of sleep apnea. Minerva Medica, 95(3), 213–231.
Mbata, G., & Chukwuka, J. (2012). Obstructive sleep apnea hypopnea syndrome. Annals of Medical and Health Sciences Research, 2(1), 74–7. doi:10.4103/2141-9248.96943
Mieczkowski, B., & Ezzie, M. E. (2014). Update on obstructive sleep apnea and its relation to COPD. International Journal of Chronic Obstructive Pulmonary Disease, 9, 349–362. doi:10.2147/COPD.S42394
Mohsenin, V. (2014). Obstructive Sleep Apnea and Hypertension: a Critical Review. Current Hypertension Reports, 16(10). doi:10.1007/s11906-014-0482-4
Nemergut, E., & Kopp, S. (2013). Upper Airway Anatomy. Open Anesthesia. Retrieved September 2, 2015, from https://www.openanesthesia.org/upper-airway-anatomy/
Pagel, J. F. (2008). The burden of obstructive sleep apnea and associated excessive sleepiness. The Journal of Family Practice, 57(8 Suppl), S3–8. Retrieved from http://www.ncbi.nlm.nih.gov/pubmed/18687237
Pagel, James; Hirshkowitz, Max; Doghramji, Paul; Ballard, R. (2008). Obstructive Sleep Apnea: Recognition and management in primary care. Supplement to Journal of Family Practice, 348(5), S1–S31. doi:10.1056/NEJM200301303480520
Park, J. G., Ramar, K., & Olson, E. J. (2011). Updates on definition, consequences, and management of obstructive sleep apnea. Mayo Clinic Proceedings, 86(6), 549–54; quiz 554–5. doi:10.4065/mcp.2010.0810
Pillar, G., & Lavie, P. (2011). Obstructive sleep apnea: diagnosis, risk factors, and pathophysiology. Handbook of Clinical Neurology, 98, 383–99. doi:10.1016/B978-0-444-52006-7.00025-3
Practice parameters for the use of portable recording in the assessment of obstructive sleep apnea. Standards of Practice Committee of the American Sleep Disorders Association. (1994). Sleep, 17(4), 372–7. Retrieved from http://www.ncbi.nlm.nih.gov/pubmed/7973322
References 71

Punjabi, N. M. (2008). The epidemiology of adult obstructive sleep apnea. Proceedings of the
American Thoracic Society, 5(2), 136–143. doi:10.1513/pats.200709-155MG
Redeker, N. (2005). Sleep-disordered Breathing in Patients with Heart Failure: An Update. Journal of Cardiac Failure, 11(9), S294. doi:10.1016/j.cardfail.2005.08.231
Resta, O., Carpagnano, G. E., Lacedonia, D., Gioia, G. D., Giliberti, T., Stefano, a., & Bonfitto, P. (2005). Gender difference in sleep profile of severely obese patients with obstructive sleep apnea (OSA). Respiratory Medicine, 99(1), 91–96. doi:10.1016/j.rmed.2004.05.014
Ribeiro, J. M. (2003). O Sistema de Saúde Português. Politica de Saúde, 91–107.
Riha, R. L. (2010). Clinical assessment of the obstructive sleep apnoea/hypopnoea syndrome. Therapeutic Advances in Respiratory Disease, 4(2), 83–91. doi:10.1177/1753465810365080
Robichaud-Hallé, L., Beaudry, M., & Fortin, M. (2012). Obstructive sleep apnea and multimorbidity. BMC Pulmonary Medicine, 12(1), 60. doi:10.1186/1471-2466-12-60
Rodrigues, Pedro Pereira; Santos, Daniela Ferreira; Leite, L. (2015). Obstructive Sleep Apnea diagnosis: the Bayesian network model revisited. CBMS.
Romero, E., Krakow, B., Haynes, P., & Ulibarri, V. (2010). Nocturia and snoring: Predictive symptoms for obstructive sleep apnea. Sleep and Breathing, 14(4), 337–343. doi:10.1007/s11325-009-0310-2
Salles, Cristina; Ramos, Regina; Machado, Adelmir; Cruz, Á. (2013). Obstructive sleep apnea and asthma. Jornal Brasileiro de Pneumologia, 39(March), 604–612. doi:10.1056/NEJMra1313875
Schwab, R. J. (2005). Genetic determinants of upper airway structures that predispose to obstructive sleep apnea. Respiratory Physiology & Neurobiology, 147(2-3), 289–298. doi:10.1016/j.resp.2005.06.006
Schwartz, A. R., Patil, S. P., Laffan, A. M., Polotsky, V., Schneider, H., & Smith, P. L. (2008). Obesity and obstructive sleep apnea: pathogenic mechanisms and therapeutic approaches. Proceedings of the American Thoracic Society, 5(2), 185–192. doi:10.1513/pats.200708-137MG
Sheldon, A., Belan, I., Neill, J., & Rowland, S. Nursing assessment of obstructive sleep apnea in hospitalised adults: a review of risk factors and screening tools. Contemporary Nurse, 34(1), 19–33. Retrieved from http://www.ncbi.nlm.nih.gov/pubmed/20230169
Smith, Ian; Quinnell, T. (2011). Obstructive sleep apnoea : relevance to non-sleep clinicians. Clinical Medicine, 11(3), 286–289.
72 References

Stanke-Labesque, F., Pepin, J.-L., Gautier-Veyret, E., Levy, P., & Back, M. (2014).
Leukotrienes as a molecular link between obstructive sleep apnoea and atherosclerosis. Cardiovascular Research, 101(2), 187–193. doi:10.1093/cvr/cvt247
Stierer, T., & Punjabi, N. M. (2005). Demographics and diagnosis of obstructive sleep apnea. Anesthesiology Clinics of North America, 23(3), 405–20, v. doi:10.1016/j.atc.2005.03.009
Stores, G. (2007). Clinical diagnosis and misdiagnosis of sleep disorders. Journal of Neurology, Neurosurgery, and Psychiatry, 78(12), 1293–1297. doi:10.1136/jnnp.2006.111179
Sutherland, K., Lee, R. W. W., & Cistulli, P. a. (2012). Obesity and craniofacial structure as risk factors for obstructive sleep apnoea: Impact of ethnicity. Respirology, 17(2), 213–222. doi:10.1111/j.1440-1843.2011.02082.x
Tasali, E., Mokhlesi, B., & Van Cauter, E. (2008). Obstructive sleep apnea and type 2 diabetes: interacting epidemics. Chest, 133(2), 496–506. doi:10.1378/chest.07-0828
Tate, J., & Tasota, F. J. (2002). More than a snore: recognizing the danger of sleep apnea. Nursing, 32(8), 46–9. Retrieved from http://www.ncbi.nlm.nih.gov/pubmed/12352851
Togeiro, S. M. G. P., Chaves, C. M., Palombini, L., Tufik, S., Hora, F., & Nery, L. E. (2010). Evaluation of the upper airway in obstructive sleep apnoea. The Indian Journal of Medical Research, 131, 230–5. Retrieved from http://www.ncbi.nlm.nih.gov/pubmed/20308748
Tregear, S., Reston, J., Schoelles, K., & Phillips, B. (2009). Obstructive sleep apnea and risk of motor vehicle crash: systematic review and meta-analysis. Journal of Clinical Sleep Medicine, 5(6), 573–581.
Tu, J. V. (1996). Advantages and disadvantages of using artificial neural networks versus logistic regression for predicting medical outcomes. Journal of Clinical Epidemiology, 49(11), 1225–31. Retrieved from http://www.ncbi.nlm.nih.gov/pubmed/8892489
Tuomilehto, H., Seppä, J., & Uusitupa, M. (2013). Obesity and obstructive sleep apnea - Clinical significance of weight loss. Sleep Medicine Reviews, 17(5), 321–329. doi:10.1016/j.smrv.2012.08.002
Villaneuva, A. T. C., Buchanan, P. R., Yee, B. J., & Grunstein, R. R. (2005). Ethnicity and obstructive sleep apnoea. Sleep Medicine Reviews, 9(6), 419–436. doi:10.1016/j.smrv.2005.04.005
Viswanath, A., Ramamurthy, J., Dinesh, S. P. S., & Srinivas, A. (2015). Obstructive sleep
apnea : Awakening the hidden truth. Nigerian Journal of Clinical Practice, 18(1), 1–7.
References 73
Wachter, R., Luthje, L., Klemmstein, D., Luers, C., Stahrenberg, R., Edelmann, F., …
Pieske, B. (2013). Impact of obstructive sleep apnoea on diastolic function. European Respiratory Journal, 41(2), 376–383. doi:10.1183/09031936.00218211
Wall, H., Smith, C., & Hubbard, R. (2012). Body mass index and obstructive sleep apnoea in the UK: A cross-sectional study of the over-50s. Primary Care Respiratory Journal, 21(4), 371–376. doi:10.4104/pcrj.2012.00053
Yaggi, H. K., & Strohl, K. P. (2010). Adult obstructive sleep apnea/hypopnea syndrome: definitions, risk factors, and pathogenesis. Clinics in Chest Medicine, 31(2), 179–86. doi:10.1016/j.ccm.2010.02.011
Younes, M. (2003). Contributions of upper airway mechanics and control mechanisms to severity of obstructive apnea. American Journal of Respiratory and Critical Care Medicine, 168(6), 645–58. doi:10.1164/rccm.200302-201OC
Young, T., Evans, L., Finn, L., & Palta, M. (1997). Estimation of the clinically diagnosed proportion of sleep apnea syndrome in middle-aged men and women. Sleep, 20(9), 705–6. Retrieved from http://www.ncbi.nlm.nih.gov/pubmed/9406321
Young, T., Shahar, E., Nieto, F. J., Redline, S., Newman, A. B., Gottlieb, D. J., … Samet, J. M. (2002). Predictors of sleep-disordered breathing in community-dwelling adults: the Sleep Heart Health Study. Archives of Internal Medicine, 162(8), 893–900. Retrieved from http://www.ncbi.nlm.nih.gov/pubmed/11966340
Young, T., Skatrud, J., & Peppard, P. E. (2004). Risk factors for obstructive sleep apnea in adults. JAMA, 291(16), 2013–6. doi:10.1001/jama.291.16.2013
74 References


Authorization for study realization
78 References