Embed Size (px)
Citation preview
Administration for Community Living Office of Performance Evaluation
SEPTEMBER 2020
ACL’s Data Quality Guidance

TABLE OF CONTENTS
Overview 1What is Quality Data? 3Benefits of High-Quality Data 5Improving Data Quality 6Data Types 7Data Components 8Building a New Data Set 10
Implement a data collection plan 10Set data quality standards 10Data files 11
Documentation Files 12Create a plan for data correction 13Plan for widespread data integration and distribution 13Set goals for ongoing data collection 13
Maintaining a Data Set 14Data formatting and standardization 14Data confidentiality and privacy 14Data extraction 15Preservation of data authenticity 15Metadata to support data documentation 15
Evaluating an Existing Data Set 16Data Dissemination 18Data Extraction 18Example of High-Quality Data 19
Exhibit 1. Older Americans Act Title III Nutrition Services: Number of Home-Delivered Meals 21Exhibit 2. Participants in Continuing Education/Community Training 22
Summary 23Glossary of Terms 24Data Quality Resources 25Citations 26

1
Overview
The Government Performance and Results Modernization Act of 2010, along with other legislation, requires federal agencies to report on the performance of federally funded programs and grants. The data the Administration for Community Living (ACL) collects from programs, grants, and research are used internally to make critical decisions concerning program oversight, agency initiatives, and resource allocation. Externally, ACL’s data are used by the U.S. Department of Health & Human Services (HHS) head-quarters to inform Congress of progress toward programmatic and organizational goals and priorities, and its impact on the public good.
The Office of Performance and Evaluation (OPE) developed this Data Quality Guide as an introduction to the topic of data quality and to present strategies to enhance data utility. This guide, along with ACL’s Performance Strategy 1, aims to promote high-quality transparent information that supports sound decision-making. The Data Quality Guide begins by defining data quality, explaining the importance of improving data, describing data types, and providing recommendations for building, maintain-ing, and evaluating data sets. It then describes the role of data quality in dissemina-tion and data extraction. It closes with examples of high-quality data and recommen-dations for additional resources. As you review this guide, remember, developing high-quality data is a journey and not a destination. Incremental change is worthwhile.
The Office of Management and Budget (OMB, 2001) defines “quality” as a broad term that encompasses the notions of “utility,” “objectivity,” and “integrity.” “Utility” refers to the usefulness of the information to the intended users. “Objectivity” refers to whether the disseminated information is being presented in an accurate, clear, complete, and unbiased manner and, as a matter of substance, is accurate, reliable,
1 https://acl.gov/sites/default/files/programs/2018-07/OPE%20PM%20Strategy%20FINAL%206-1-2018.docx

2
and unbiased. “Integrity” refers to security or the protection of information from unauthorized access or revision, to ensure that the information is not compromised through corruption or falsification. The General Accounting Office (GAO, 2000) adds to this definition by stating that quality data has validity, in that it adequately rep-resents actual performance, and that it is consistent (i.e., reliable), in that it is col-lected repeatedly, using the same processes over time, allowing for comparisons between findings.
OPE is also available to support your office with assessing the quality of your data.

3
What is Quality Data?
Data collection is the process of gathering and measuring information on variables of interest in an established systematic fashion that enables one to answer stated research questions, test hypotheses, and evaluate outcomes (Faculty Development and Instructional Center at Northern Illinois University, 2005). Data quality refers to the utility of a data set and its ability to be easily processed and analyzed.
Data must be consistent and unambiguous to be of high quality. Data quality issues are often the result of data set mergers or data integration processes in which data fields are incompatible due to schema or format incon-sistencies. Data that are not of high quality can undergo data cleansing to raise their quality (Informatica, 2020).
The Office of Management and Budget (OMB, 2001) defines “quality” as a broad term that encompasses the notions of “utility,” “objectivity,” and “integrity.” “Utility” refers to the usefulness of the information to the intended users. “Objectivity” refers to whether the disseminated information is being presented in an accurate, clear, complete, and unbiased manner and, as a matter of substance, is accurate, reliable, and unbiased. “Integrity” refers to security or the protection of information from unauthorized access or revision, to ensure that the information is not compromised through corruption or falsification.2
2 Office of Management and Budget. (2001). Guidelines for ensuring and maximizing the quality, objectivity, utility, and integrity of information disseminated by federal agencies. Retrieved from https://obamawhite-house.archives.gov/omb/fedreg_final_information_quality_guidelines/
High-quality data is consistent, unambiguous, and accurate.
4
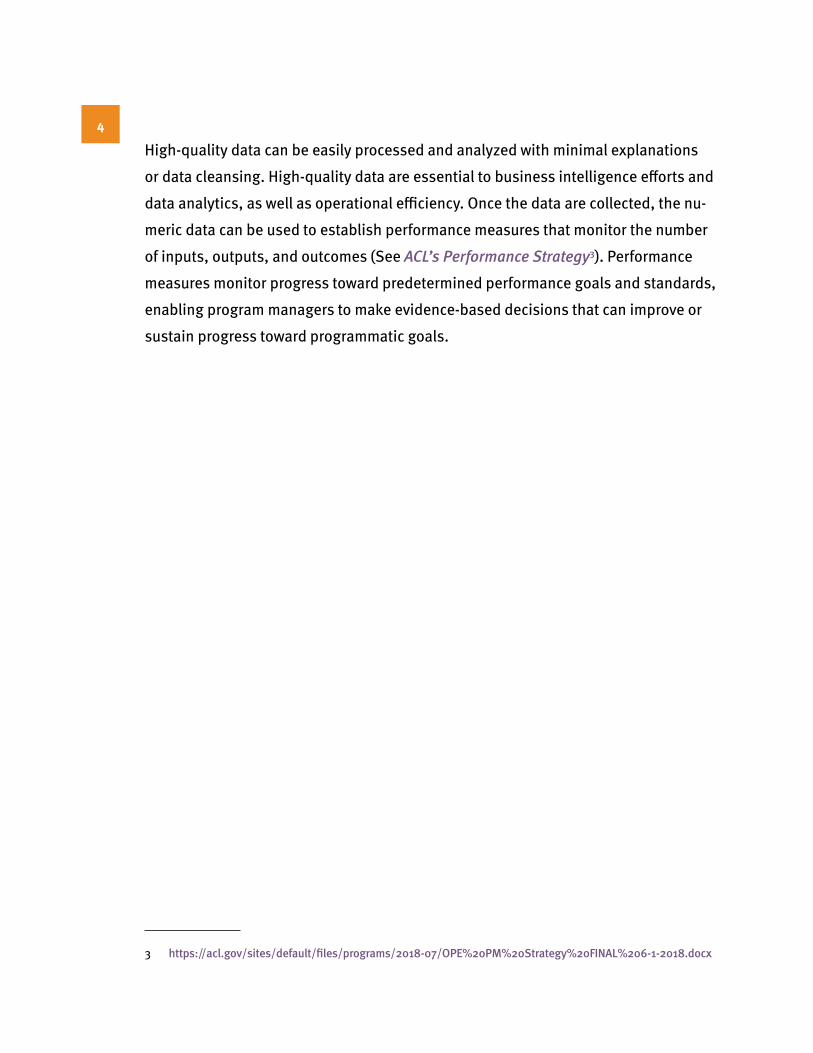
High-quality data can be easily processed and analyzed with minimal explanations or data cleansing. High-quality data are essential to business intelligence efforts and data analytics, as well as operational efficiency. Once the data are collected, the nu-meric data can be used to establish performance measures that monitor the number of inputs, outputs, and outcomes (See ACL’s Performance Strategy3). Performance measures monitor progress toward predetermined performance goals and standards, enabling program managers to make evidence-based decisions that can improve or sustain progress toward programmatic goals.
3 https://acl.gov/sites/default/files/programs/2018-07/OPE%20PM%20Strategy%20FINAL%206-1-2018.docx
5
Benefits of High-Quality Data
There are several benefits of high-quality data. First among them is the ability to communicate the relationship between inputs, action, outputs, and impact. Accurate data can “tell a story” by demonstrating to stakeholders measurable consequences of action or inaction. This information leads to informed decision-making and future action.
High-quality data lead to better decision-making across an organi-zation. ACL’s data impact both policy and programmatic decisions. If we provide quality data, ACL leadership will have a higher level of confidence when making decisions guiding the future of ACL.
Data document the delivery of federal services and can be used to gauge effectiveness.
High-quality data enable the research community to answer research questions that have an impact on the community. Furthermore, ACL, other federal organizations, and state and local agencies depend on quality data for their policy and program plan-ning. These policies and programs, in turn, impact many additional stakeholder groups. They, along with various advocacy groups, depend on ACL’s data to pursue funding for services and initiatives necessary to serve their constituencies.
High-quality data lead to increased consistency and coordination between existing and new data programs or grants, the elimination of redundant data (see the Paperwork Reduction Act), and the capa-bility to analyze and visualize data.
$
6
High-quality data sets may be linked together to explore innovative and complex research topics and inform decision-making. Uniformity in design, data definitions, and identity protections make this possible.
Data advance progress on shared or similar objectives while fulfilling broader federal information needs.
Improving Data Quality
It is important to develop a systematic, standardized data collection strategy that includes a defined process for building, maintaining, and evaluating new data sets (see below). When developing or implementing an approach to improving data, give careful consideration to the needs and capacity of your program or grant. Consider addressing data challenges. Perform an in-depth analysis of existing legislation to ensure all mandatory data elements are collected, the appropriate categories are represented, and the results can be easily interpreted.
7
Data Types
To fulfill ACL’s mission, robust, accurate information is required to inform policy and practice. There are two types of data, quantitative and qualitative. Each form of data has its advantages and disadvantages. Quantitative data provide information about quantities, i.e., numbers. Qualitative data are descriptive and describe observed phenomena, such as language. These data are nonnumerical and collected through observations, interviews, and focus groups (McLeod, 2019). Most government data, particularly performance measure data, are quantitative.
Quantitative data are typically collected using replicable, standardized processes that allow for large numbers of participants to be studied. These data are used to derive generalizations about the phenomenon being examined and, since the collection processes are standardized, it is possible to make comparisons across respondent categories over time. This approach allows for a large volume of data to be collected, but the breadth of the responses is narrower. A limitation of quantita-tive data is that they do not provide a rich narrative of a phenomenon. Quantitative data do not capture individual feelings and perceptions in the way that qualitative techniques can. Most population-level data collection by ACL uses quantitative data.
Qualitative data provide more depth and detail by speaking with or observing individuals rather than focusing on large groups. This approach allows for nuanced responses that, when compared to quantitative data, are more difficult to gener-alize and systematically compare. Due to the time required to build rapport with a respondent, a less structured data collection process, and the need to code and interpret the data, collecting qualitative data can be more time consuming (and expensive) than collecting quantitative data. Qualitative data can be transformed into quantitative data through coding procedures, though they will remain more subjective than quantitative data.

8
Data Components
Several key components are necessary when collecting, reporting, or assessing data, each of which can individually or cumulatively impact data quality. Under-standing these components and their definitions will help to structure and evaluate the quality of data.
Validity refers to how the data are collected rather than the data themselves. Data validation is conducted to determine which data meet a defined format, type, and range. Data are valid if they are in the right format and of the correct type and fall within the proper range. These characteristics help in organi-zation and analysis. Some software automatically converts data to the correct format. For example, if you are collecting data about the time of day users visit your site, you must decide on the format you will use. You might choose to use 24-hour time and use two digits for minutes and two for hours. Examples of this data format would include 14:34, 17:05, and 08:42. Data that do not follow this format would be invalid.
Data are valid if they are in the right format and of the correct type and fall within the proper range.

9
Key Components When Collecting, Reporting, or Assessing Quantitative Data
Data Dictionary
A data dictionary, as defined in the IBM Dictionary of Computing (IBM, 1993), is a “centralized repository of information about data such as meaning, relationships to other data, origin, usage, and format.” Data dictionaries assist data users in under-standing data set content and the meaning and relationships between variables.
Data Format Formatting is an important data quality consideration due to its influence on access, preservation, and interoperability. Selecting a standard format for data allows users to access findings with off-the-shelf software, such as Excel, rather than requiring file manipulation that may introduce unwanted data errors or artifacts. The use of a stan-dard format reduces the likelihood of data becoming unreadable as time and computer software advance. Standard formatting also facilitates research across data sets, allow-ing for new questions to be explored by ACL staff and external researchers. Some types of basic formatting that can improve data quality are formatting concerning currency, percentages, decimals, and dates.
Data Rules Data rules are specific, documented standards for data entry, explaining what quality data are. An example of data quality is the use of a marital status code requiring entry of a value for single, married, widowed, or divorced. Blank entries would considered invalid.
Percentages vs. Raw Numbers
Percentages are commonly used to describe mathematical findings. Mathematically, a percentage represents a numerator divided by a denominator (i.e., the total). A raw number is a count that has not been statistically manipulated. Raw numbers sometimes provide more transparent information than percentages. For example, you could say that 5% of a group declined an intervention. Alternatively, you could say that one out of the 20 participants declined an intervention. Both may be accurate statements, but highlighting the small number of refusals (numerator) and the small size of the group (denominator) improves the clarity of the data and the implications for the findings.
Missing Data Missing data (or missing values) is defined as the data value that is not stored for a variable in the observation of interest.
Data Analysis Data analysis is the process of systematically applying statistical and/or logical techniques to describe and illustrate, condense and recap, and evaluate data.
Variance Variance measures how far a data set is spread out. It is mathematically defined as the average of the squared differences from the mean (Statistics How To, 2020). Small variances indicate few outliers (i.e., unusually high or low numbers) in the data. Outliers can indicate errors in data collection or documentation.

10
Building a New Data Set
Implement a data collection planUsing a logic model and performance measurement strategies is essential to developing a data collection plan. These practices require you to identify inputs, outputs, and outcomes; clarify definitions for each; and strategize how to collect required data and measure progress. Your data collection plan should identify the information you need to collect and additional useful information. This approach may require the establishment of additional indicators, beyond those gathered at the individual project or grantee lev-el, and expand into the development of data-sharing agreements. Data encryption and transmission process-es receive and store sensitive data, particularly data that may include personally identifiable information (PII). Explicitly state your require-ments and procedures to minimize confusion and ensure timely and effective data collection. When building your data set, be mindful of the Paperwork Reduction Act (PRA) of 1995, which gives the OMB authority over the collection of information by federal agencies. The PRA is a law governing how federal agencies collect informa-tion from the public and aims to reduce the burden of collecting unnecessary data (U.S. Office of Performance Management, 2011).
Set data quality standardsIt is important to set data quality standards to assist in identifying erroneous data. This step should include clear instructions for the format of data entry, such as percentiles versus raw numbers, and explanations for any formulas or calculations necessary to produce data required for collection. Data quality standards should also consider outliers that may indicate data entry errors. Historical precedent,
It is essential to set goals for your data collection prior to developing a data system.
11
analysis of variance, and general programmatic knowledge should inform the identification of such errors.
Data quality standards are used by ACL to certify data submissions and develop advisories for ACL’s data presentation website regarding possible data quality issues. As ACL accepts data through the various grantee systems, are there clear guidelines, and are all of the grant/contract officers using the same standards for looking at the data and accepting them as complete?
One approach to establishing a data quality standard is to develop a data quality checklist. Data quality checklists can be used by a grantee to format data and reduce quality concerns for recipients and users. They can also be used by recipients, such as ACL, to identify formatting errors that may introduce incorrect or erroneous data into a data set, limiting their usefulness and accuracy. The example below, from the Oak Ridge National Laboratory Distributed Active Archive Center (n.d.), presents vital components that can be used by ACL.
Example: Data Checklist
Data files1. Check for integrity of files (Checksum, file size, number of files)2. Filenames are descriptive and consistent Action: Rename data files, if needed3. Check if file format is appropriate and can be opened Action: Modify to archive format (non-proprietary) if needed4. File organization is consistent and appropriate5. Table header information complete and consistent with documentation6. Properly versioned, if needed
12
Documentation Files
Documentation files describe and clarify the contents of a data file. When develop-ing a documentation file, you should ensure that the following criteria are met.
1. Documentation matches files received2. Data set and its contents are clearly described3. Geospatial and temporal information are complete and described4. Variables and units follow standards or are well defined5. Publication or manuscript describing the data is provided6. Methodology, calibrations, and algorithms provided7. Known issues/limitations clearly described8. Statements are properly referenced
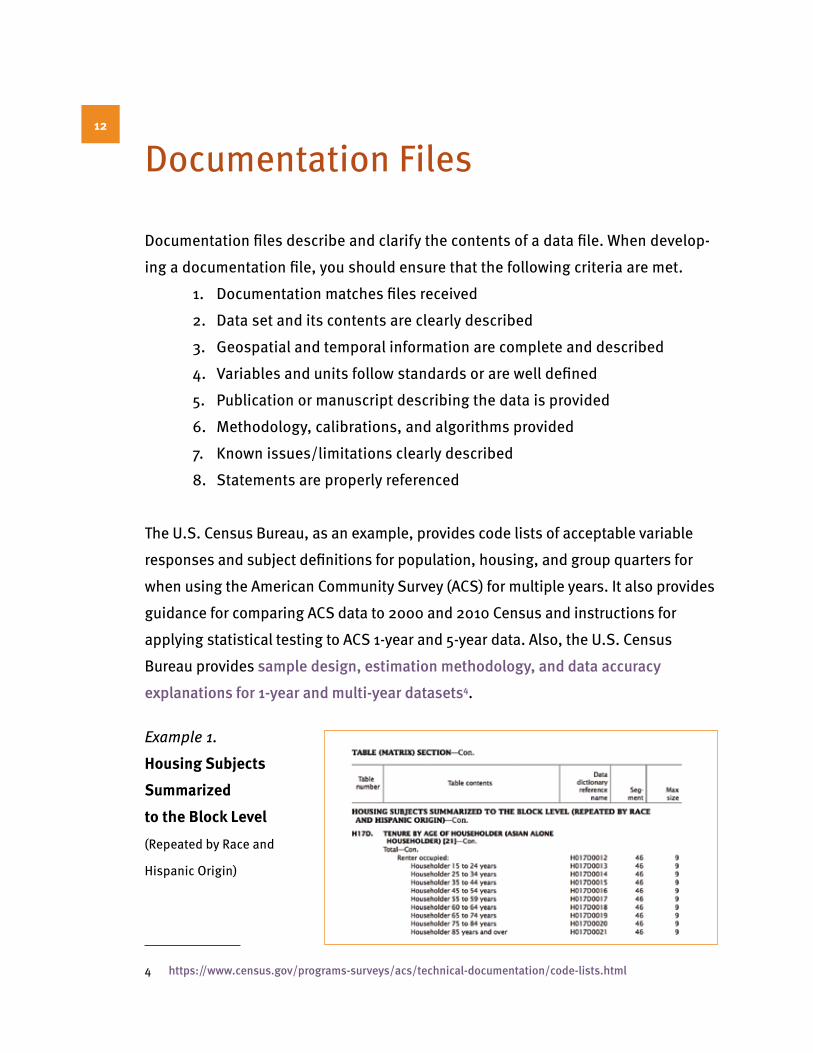
The U.S. Census Bureau, as an example, provides code lists of acceptable variable responses and subject definitions for population, housing, and group quarters for when using the American Community Survey (ACS) for multiple years. It also provides guidance for comparing ACS data to 2000 and 2010 Census and instructions for applying statistical testing to ACS 1-year and 5-year data. Also, the U.S. Census Bureau provides sample design, estimation methodology, and data accuracy explanations for 1-year and multi-year datasets4.
4 https://www.census.gov/programs-surveys/acs/technical-documentation/code-lists.html
Example 1. Housing Subjects Summarized to the Block Level (Repeated by Race and
Hispanic Origin)
13
Parameter Values
Parameter values describe the expected range and form of data, and help identify potential data errors. When developing parameter values documentation, you should ensure that the following actions are taken and criteria defined.
1. Check to ensure valid range2. Visualize (plot, map, or both)3. Code(s) for missing values defined and used4. Values for coded fields defined5. Are accuracy and precision stated and reasonable?
Example 1 from the 2018 U.S. Census shows how many of these parameter values can be communicated to a data user.
Create a plan for data correctionWhen identified, data errors should be investigated, corrected, or removed from the data set. Procedures should include defining the person(s) responsible for cor-recting data and methods for correction. This ensures a consistent process, reduc-ing the likelihood of additional errors entering the data set.
Plan for widespread data integration and distribution ACL is developing processes to link data sets, allowing analyses across data sets to answer new questions and provide previously unavailable insights. You should design your data set with interoperability in mind, using standardized data fields, definitions, and file formatting to allow data sets to be linked, as well as accessed and trans-formed using most statistical software. These practices also reduce the likelihood of introducing errors due to required data transformation.
Set goals for ongoing data collectionIt is vital to remember improving data quality is a process, not an event. It may not be possible to address all data quality issues at one time. The documentation of processes and corrective actions ensure errors are addressed and not repeated.
14
Maintaining a Data Set
Developing and maintaining a data set takes forethought and a commitment to oversight. The results of this work are accurate data that improve organizational efficiency and productivity. For these reasons, it is crucial to investigate and assess data content, structure, relationships, and quality on an ongoing basis. Standardiz-ing your data to meet organizational needs, as well as implementing and enforcing standardized data format rules across your organization, will establish a foundation for additional data set rules concerning data confidentiality and privacy, integrity, authenticity, and documentation. Standardized formats also enhance interoperabil-ity across data sets, allowing data to be cross-referenced and additional analyses to be performed. Data set rules can then guide data cleansing, e.g., the removal of incorrect, incomplete, duplicate, and improperly formatted data.
Data formatting and standardizationData formatting and standardization have been previously introduced as critical components of data set development, as has planning data correction strategies. Knowing when to implement these strategies requires regular, systematic checks of data quality to ensure that data entry is adhering to formatting standards and that any data outliers are identified and checked against historical precedent, analysis of variance, and general programmatic knowledge. These strategies protect the in-tegrity of the data. Data cleansing can then occur to remove incorrect, incomplete, duplicate, and improperly formatted data. Correcting these errors manually is inef-ficient and costly. Data cleansing software can systematically examine and cleanse data in a manner of minutes rather than hours, allowing program staff to focus on data monitoring, profiling, and standardization.
Data confidentiality and privacy The federal government has a responsibility to protect the confidentiality and privacyof individuals whose data it collects, stores, and uses for analysis and programmatic
15
planning. HHS and ACL have strict safety, security, and privacy requirements. To ensure ACL’s data maintains confidentiality and privacy, consult with ACL’s Director of the Office of Information Resources Management and the Chief Information Security Officer on all safety, security, and privacy requirements. If your data is managed by a third party (a contractor or grantee), provide them with all HHS and ACL require ments.
Data extractionProcesses to access and extract information from full data sets should include mech-anisms to log users and their actions within the data sets (i.e., data entry, data alter-ation, data downloads). A previous version of the data set should be automatically archived so that an unaltered version is available if errors are introduced during the extraction. These processes not only protect the integrity of the data but also estab lish an information trail useful in tracking data usage and alteration over time.
Preservation of data authenticityData authenticity requires content being unchanged during transmission from point to point. Inaccuracies can be introduced during transmission of a file and may not neces-sarily be due to tampering but merely to unattributable technology failures. The use of encryption software to authenticate that the file sent is the one received is one way to check for data origin authenticity. This data encryption also protects the data from file corruption, whether intentional or unintentional.
Metadata to support data documentationIn addition to the development of a data dictionary (previously described), data set developers should consider the use of metadata to support data documentation. Metadata provide information that describes data and, at a minimum, contains the information necessary to understand and reuse data created by others. A metadata schema is a formal framework for recording and describing data. Schemas, along with data dictionaries and readme files, which contain instructions and information about file updates, often accompany large data files and data sets (Iowa State Uni versity, University Library, n.d.).
16
ARE THE DATA RELEVANT?
Relevance is the level of consistency be-tween data content and the area of interest of the user. To maximize the use of ACL’s data, those data should not only be accu-rate; they must be relevant to the program’s or grant’s overarching goals and objectives. To ensure your data meet this requirement, link the data collection to the outcomes identified in your logic model (see ACL’s Logic Model Guidance). It is imperative that as time evolves, your data collection evolves as well. Consider a conscientious design that anticipates future uses of data.
According to the PRA, federal agencies must aim to reduce the total amount of paperwork burden the federal government imposes through the collection of data. To achieve ad-herence to PRA requirements, we should only collect data that are useful and necessary.
ARE THE DATA ACCURATE?
Accuracy refers to how well the data describe real-world conditions. Accurate data convey true information. If there are errors in the data, making a data-driven decision is im-possible, and your data have the potential to damage ACL’s reputation. Inaccurate data create clear problems, as they can cause you to come to incorrect conclusions.
ARE THE DATA TIMELY?
Timeliness refers to how recently the event the data represent occurred. Using outdat-ed data can lead to inaccurate results and taking actions that don’t reflect the current reality. Generally, data should be recorded as soon after the real-world event as possible. Data that reflect events that happened more recently are more likely to reflect the current reality. Data typically become less useful and less accurate as time goes on.
Evaluating an Existing Data Set
17
DO YOUR DATA RELATE TO THE GOALS IDENTIFIED IN YOUR LOGIC MODEL?
Identify data needs to answer key agency questions and questions tailored to the needs of your program or grant.
ARE THE DATA COLLECTED VALUED BY STAKEHOLDERS?
Assess and balance the needs of stakehold-ers with the requirements and intent of the program/grant and ACL’s goals and objectives.
ARE THE DATA COMPARABLE?
Data among various groups (e.g., grantees, states, etc.) should be comparable. When comparing data across multiple data sets, consistency is vital. A data item should be con-sistent in both its content and its format. Data items should possess the same definition and format across data collection activities and data sets. If your data aren’t consistent, differ-ent groups may be operating under different assumptions about what is true. Inconsistent data can lead to departments within ACL unknowingly working against one another.
ARE THE DATA COMPLETE?
To get a full picture of the needs of programs/grants ACL supports, as well as maintain open channels of communication, our data must include all up-to-date, pertinent information. If the data are complete, there are no gaps. Everything that was supposed to be collected was successfully collected. Incomplete data may make the data reported less useful. If data are incomplete, you might have trouble gathering accurate insights. For instance, if a respondent doesn’t include his or her age, it will be harder to target content to people based on their age.
18
Data Dissemination
ACL has a responsibility to collect, analyze, and disseminate high-quality data. The collection and analysis of high-quality data are required for programmatic over-sight, evaluations of effectiveness, and mandated federal reporting. Dissemination is essential to allow additional stakeholders to benefit from data collected using federal funds. State stakeholders, including the aging and disability network, local Area Agencies on Aging, Councils on Developmental Disabilities, and other social service providers, depend on high-quality ACL data to fund and provide quality services to the community. Researchers depend on ACL’s data for examining local, regional, and national service usage and service effectiveness trends and findings. Advocates and other private citizens also rely on the accuracy and access to ACL’s data to persuade lawmakers and other service funders to introduce and improve funding and services for older adults, people with disabilities across the lifespan, and their families and caregivers. Ultimately, we have a responsibility to share federal agency data with state, local, and tribal governments.
Data Extraction
Data extraction involves selecting distinct data set variables and then recoding them into a format useful for analysis or presentation. Data extraction and accurate, meaningful presentation are critical to the dissem-ination of information and the use of collected data by stakeholders.
Be sure when developing a data collection system to discuss the required format of the data upon extraction. Consider both the type (currency, percentages, time, etc.) and the format (Excel, Pdf, Word, etc.)

19
The American Community Survey (ACS)5 is a standardized data collection adminis-tered by the U.S. Census Bureau since 2005. Data are collected quarterly via the Inter-net, mail, telephone, and in-person interviews. The ACS addresses many of the topics within the census, but its more frequent data collection (quarterly vs. every 10 years) allows for more current data and trend analysis. The questions used in the ACS are well defined and used by many federal agencies in their data collection efforts. They can also be used at the local or regional level, as well as by researchers. ACS uses the following definition of poverty:
5 https://www.census.gov/programs-surveys/acs
Poverty status is determined by comparing annual income to a set of dollar values (called poverty thresholds) that vary by family size, number of chil-dren, and the age of the householder. If a family’s before-tax money income is less than the dollar value of their thresh-old, then that family and every individual in it are considered to be in poverty. For people not living in families, poverty status is determined by comparing the individual’s income to his or her poverty threshold.
The poverty thresholds are updated annually to account for changes in the cost
of living using the Consumer Price Index (CPI). They do not vary geographically.
The ACS is a continuous survey, and people respond throughout the year. Since income is reported for the previous 12 months, the appropriate poverty threshold for each family is determined by multiplying the base-year poverty threshold from 1982 by the average of monthly CPI values for the 12 months preceding the survey month.
For more information, see page 107 of “American Community Survey and Puerto Rico Community Survey 2018 Subject Definitions” here.
Example of High-Quality Data
How Poverty Is Measured
20
As an example of data usage, the U.S. Census Bureau examined 2017 and 2018 ACS poverty data to determine change in the national poverty rate, as well as to identify states with lower and higher poverty rates than the national average. This annual schedule allows the U.S. Census Bureau to show that there was an increase in the average poverty rate during 2007–2011, but that the rate decreased during 2012–2018. Exhibit 1 shows the year-to-year change in the poverty rate from 2005 to 2018.
University Centers for Excellence in Developmental Disabilities (UCEDDs) are inter-disciplinary education, research and public service units of a university or not-for-profit entity associated with universities. UCEDDs advise federal, state, and com-munity policymakers and promote opportunities for individuals with developmental disabilities to exercise self-determination and to be independent, productive, integrated and included in all facets of community life. Funding from ACL provided the infra structure support for the Centers to engage in interdisciplinary preservice training, continuing education, community services, research, and information dissemina tion activities. From FY 2015 to FY 2018, there was an overall increase in the number of participants receiving continued education and/or training.
ACL’s Administration on Disabilities (AoD) exemplifies high-quality data through the annual use of a Tier I Review Tool to conduct high-level program compliance and outcome reviews of the Statement of Goals and Priorities (SGP) and Program Performance Report (PPR). The outcome review uses narratives and measures to evaluate performance based on data analysis to understand results. In addition to ensuring Developmental Disabilities Assistance Act compliance, AoD’s Tier I Review Tool is also used to determine if a Protection and Advocacy System (P&A) needs a higher level of review such as a Tier II review.
21
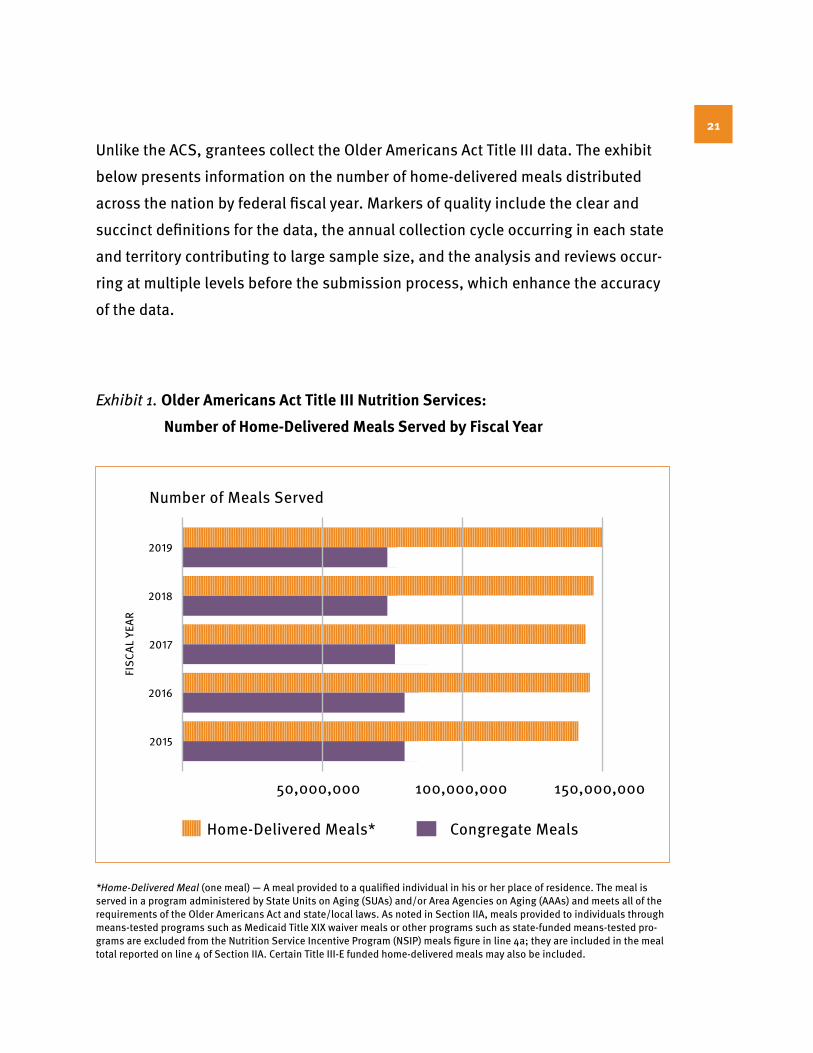
Unlike the ACS, grantees collect the Older Americans Act Title III data. The exhibit below presents information on the number of home-delivered meals distributed across the nation by federal fiscal year. Markers of quality include the clear and succinct definitions for the data, the annual collection cycle occurring in each state and territory contributing to large sample size, and the analysis and reviews occur-ring at multiple levels before the submission process, which enhance the accuracy of the data.
*Home-Delivered Meal (one meal) — A meal provided to a qualified individual in his or her place of residence. The meal is served in a program administered by State Units on Aging (SUAs) and/or Area Agencies on Aging (AAAs) and meets all of the requirements of the Older Americans Act and state/local laws. As noted in Section IIA, meals provided to individuals through means-tested programs such as Medicaid Title XIX waiver meals or other programs such as state-funded means-tested pro-grams are excluded from the Nutrition Service Incentive Program (NSIP) meals figure in line 4a; they are included in the meal total reported on line 4 of Section IIA. Certain Title III-E funded home-delivered meals may also be included.
2019
2018
2017
2016
2015
50,000,000 100,000,000 150,000,000
FISC
AL Y
EAR
NNNNnnnnnnnnnnnnnnnnnnnnnnn
nnnnnnnnnnnnnnnnnnnnnnn
nnnnnnnnnnnnnnnnnnnnnnn
nnnnnnnnnnnnnnnnnnnnnnn
nnnnnnnnnnnnnnnnnnnnnnn
Home-Delivered Meals* Congregate Mealsn
NNNN
NNNN
NNNN
NNNN
NNNN
Number of Meals Served
Exhibit 1. Older Americans Act Title III Nutrition Services: Number of Home-Delivered Meals Served by Fiscal Year

22
Continuing Education/ Community Training: training provided by UCEDD faculty/staff to enhance knowledge of a variety of community members (individuals with develop-mental and other disabilities, their families, professionals, paraprofessionals, policy makers, students or others in the community).
Exhibit 2. Participants in Continuing Education/Community Training: FYs 2014–2018
UCEDD FYs 2014-2018
800
700
600
500
400
300
200
100
02014 2015 2016 2017 2018
513,700
299,229
571,564618,873
794,691
THO
USAN
D

23
Summary
The collection, management, and use of high-quality data are critical to ACL and its mission to ensure older adults and people with disabilities are able to live inde-pendently and fully participate in their communities. ACL, like other federal agen-cies, is required to collect data to assess the performance of its federally funded programs and grants. Findings from these data collection activities are used to measure and communicate progress toward programmatic goals and priorities. Data quality is a process, and ACL is continuously seeking to improve the quality of our data through the development of formatting and interoperability standards, data transmission protocols, cleansing processes, and advisory groups such as the ACL Data Council. These evolving activities will, in time, build upon the recommen-dations made within this document.
24
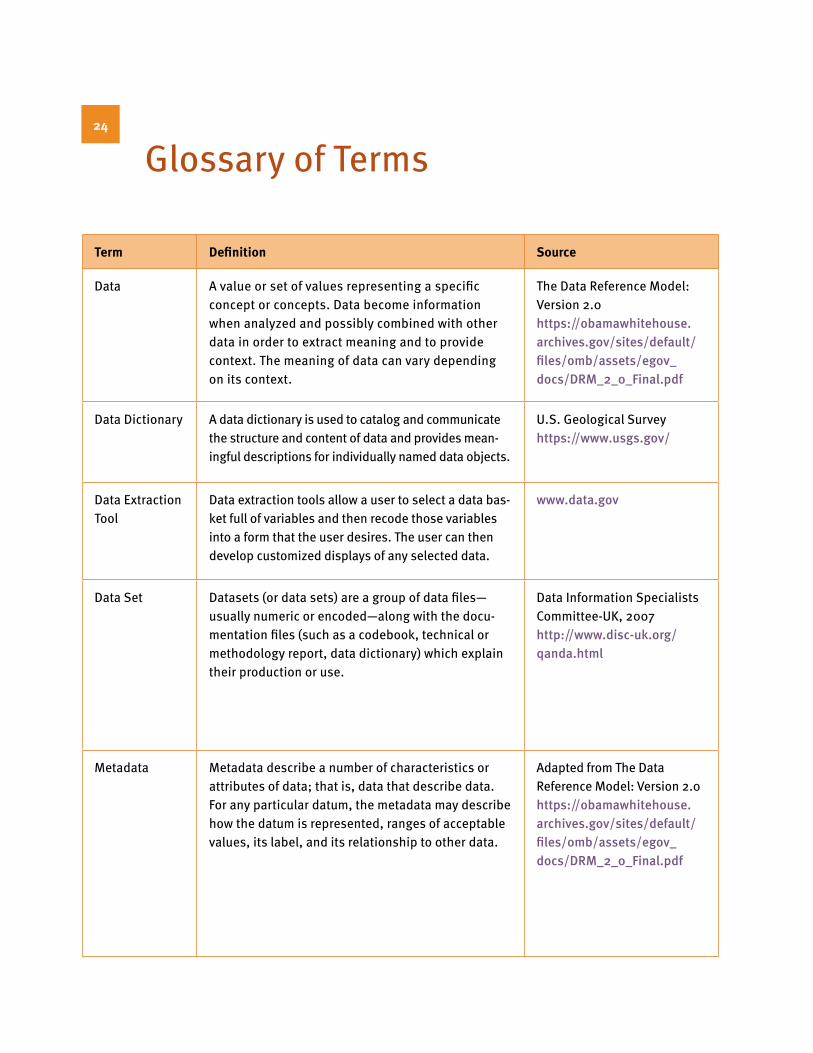
Term Definition Source
Data A value or set of values representing a specific concept or concepts. Data become information when analyzed and possibly combined with other data in order to extract meaning and to provide context. The meaning of data can vary depending on its context.
The Data Reference Model: Version 2.0 https://obamawhitehouse.archives.gov/sites/default/files/omb/assets/egov_docs/DRM_2_0_Final.pdf
Data Dictionary A data dictionary is used to catalog and communicate the structure and content of data and provides mean-ingful descriptions for individually named data objects.
U.S. Geological Survey https://www.usgs.gov/
Data Extraction Tool
Data extraction tools allow a user to select a data bas-ket full of variables and then recode those variables into a form that the user desires. The user can then develop customized displays of any selected data.
www.data.gov
Data Set Datasets (or data sets) are a group of data files— usually numeric or encoded—along with the docu-mentation files (such as a codebook, technical or methodology report, data dictionary) which explain their production or use.
Data Information Specialists Committee-UK, 2007 http://www.disc-uk.org/ qanda.html
Metadata Metadata describe a number of characteristics or attributes of data; that is, data that describe data. For any particular datum, the metadata may describe how the datum is represented, ranges of acceptable values, its label, and its relationship to other data.
Adapted from The Data Reference Model: Version 2.0 https://obamawhitehouse.archives.gov/sites/default/files/omb/assets/egov_docs/DRM_2_0_Final.pdf
Glossary of Terms
25
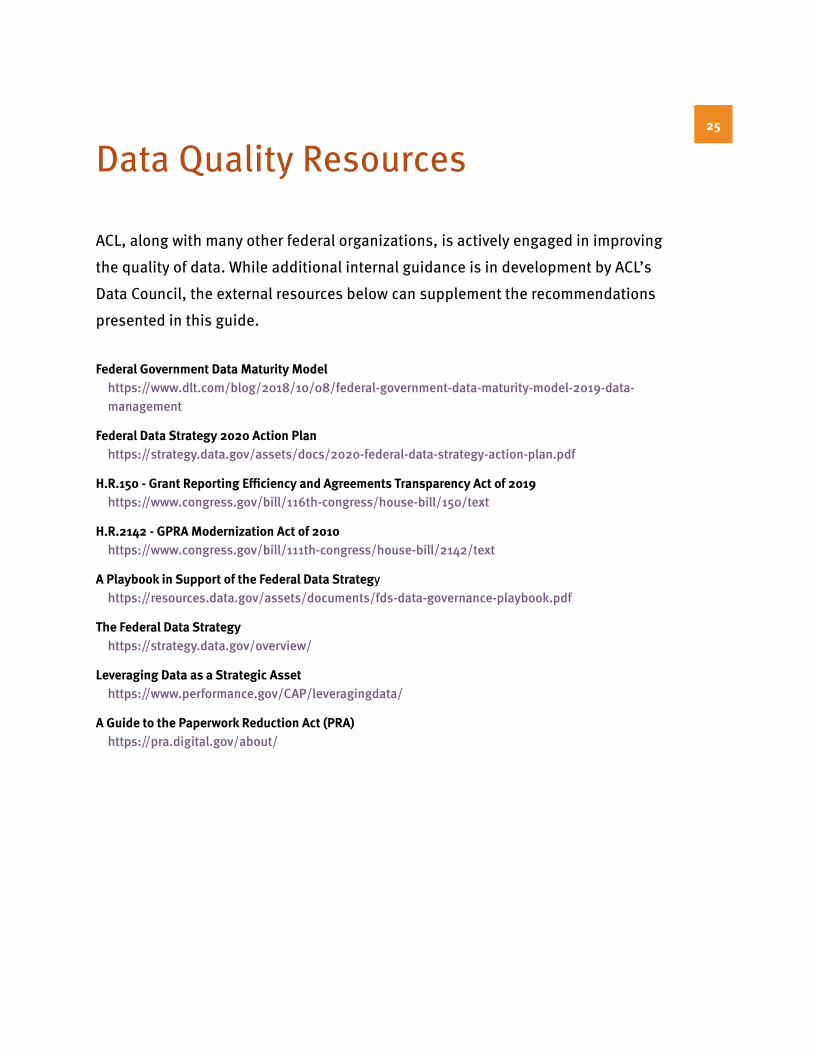
Data Quality Resources
ACL, along with many other federal organizations, is actively engaged in improving the quality of data. While additional internal guidance is in development by ACL’s Data Council, the external resources below can supplement the recommendations presented in this guide.
Federal Government Data Maturity Model https://www.dlt.com/blog/2018/10/08/federal-government-data-maturity-model-2019-data-management
Federal Data Strategy 2020 Action Plan https://strategy.data.gov/assets/docs/2020-federal-data-strategy-action-plan.pdf
H.R.150 - Grant Reporting Efficiency and Agreements Transparency Act of 2019 https://www.congress.gov/bill/116th-congress/house-bill/150/text
H.R.2142 - GPRA Modernization Act of 2010 https://www.congress.gov/bill/111th-congress/house-bill/2142/text
A Playbook in Support of the Federal Data Strategy https://resources.data.gov/assets/documents/fds-data-governance-playbook.pdf
The Federal Data Strategy https://strategy.data.gov/overview/
Leveraging Data as a Strategic Asset https://www.performance.gov/CAP/leveragingdata/
A Guide to the Paperwork Reduction Act (PRA) https://pra.digital.gov/about/

26
Citations
Benson, C. & Bishaw, A. (2019). Poverty: 2017 and 2018: American Community Survey briefs. Retrieved from https://www.census.gov/content/dam/Census/library/publications/2019/acs/acsbr18-02.pdf
Data Information Specialists Committee-UK (2007). Datashare project, questions and answers. Retrieved from http://www.disc-uk.org/qanda.html
Faculty Development and Instructional Center at Northern Illinois University. (2005). Responsible conduct in data management: Data collection. Retrieved from https://ori.hhs.gov/education/products/n_illinois_u/datamanagement/dctopic.html
General Services Administration & the Office of Management and Budget. (2019). CAP goal overview: Leveraging data as a strategic asset. Retrieved from https://www.performance.gov/CAP/leveragingdata/
Government Accounting Office (2000). Assessing the quality of program performance data. Retrieved from https://www.gao.gov/products/GAO/GGD-00-140R
IBM. (1993). IBM dictionary of computing. New York, NY: McGraw-Hill, Inc. ISBN: 978-0-07 031488-7. Retrieved from https://dl.acm.org/doi/book/10.5555/541721
IGI Global. (n.d.). What is data relevance? Retrieved from https://www.igi-global.com/dictionary/data-quality-assessment/6800
Informatica. (2020). What is data quality? Redwood City, CA: Author. Retrieved from https://www.informatica.com/services-and-training/glossary-of-terms/data-quality-definition.html
Iowa State University, University Library. (n.d.). Data management plan (DMP) guide. Retrieved from https://instr.iastate.libguides.com/dmp
Kang, H. (2013). The prevention and handling of the missing data. Korean Journal of Anesthesiology, 64(5), 402–406. Retrieved from https://www.ncbi.nlm.nih.gov/pmc/articles/PMC3668100/
Lotame. (2019). Why is data quality important? Retrieved from https://www.lotame.com/why-is-data-quality-important/
McLeod, S. (2019). What’s the difference between qualitative and quantitative research? Retrieved from https://www.simplypsychology.org/qualitative-quantitative.html
Oak Ridge National Laboratory, Distributed Active Archive Center for Biochemical Dynamics. (n.d.). Data quality review checklist. Retrieved from https://daac.ornl.gov/submit/qachecklist/
Office of Management and Budget. (2001). Guidelines for ensuring and maximizing the quality, objectivity, utility, and integrity of information disseminated by federal agencies. Retrieved from https://obamawhitehouse.archives.gov/omb/fedreg_final_information_quality_guidelines/
27
Prell, M., Chapman, C., Adeshiyan, S., Fixler, D., Garin, T., Mirel, L., & Phipps, P. (2019). Transparent reporting for integrated data quality: Practices of seven federal statistical agencies. FCSM 19-01. Federal Committee on Statistical Methodology. Retrieved from https://nces.ed.gov/FCSM/pdf/Transparent_Reporting_FCSM_19.01.pdf
Statistical Modeling, Causal Inference, and Social Science: Sometimes the Raw Numbers Are Better Than a Percentage. (2010). Retrieved from https://statmodeling.stat.columbia.edu/2010/06/24/sometimes_the_r/
Statistics How To. (2020). Variance: Simple definition, step by step examples. Retrieved from https://www.statisticshowto.com/probability-and-statistics/variance/
University of Virginia Library Research Data Services + Sciences. (2020). Data types & file formats. Retrieved from https://data.library.virginia.edu/data-management/plan/format-types/
U.S. Census Bureau. (n.d.). American Community Survey (ACS). Retrieved from https://www.census.gov/programs-surveys/acs
U.S. Geological Service (n.d.). Data management: Data dictionaries. Retrieved from https://www.usgs.gov/products/data-and-tools/data-management/data-dictionaries
U.S. Office of Management and Budget (2005). The data reference model: Version 2.0. Retrieved from https://obamawhitehouse.archives.gov/sites/default/files/omb/assets/egov_docs/DRM_2_0_Final.pdf
U.S. Office of Personnel Management. (2011). Paperwork Reduction Act (PRA) guide: Version 2.0. Retrieved from https://www.opm.gov/about-us/open-government/digital-government-strategy/fitara/paperwork-reduction-act-guide.pdf
U.S. Office of Research Integrity. (n.d.). Data analysis. https://ori.hhs.gov/education/products/n_illinois_u/datamanagement/datopic.html
Wassen, O. (2019). 11 benefits of achieving high data quality (including confidence, scalability & consistency). Retrieved from https://www.nodegraph.se/11-benefits-of-achieving-high-data-quality/

Developed by Jennifer Tillery, ACL Sr. Social Science Analystin partnership with New Editions Consulting, Inc.
For additional information contact: Office of Performance and EvaluationCenter for Policy and EvaluationAdministration for Community Living330 C St SWWashington, DC 20201www.acl.gov/contact

Administration for Community Living
Office of Performance Evaluation