Embed Size (px)
Citation preview

Arizona City/County Management Association Infrastructure and Transportation

Overview
Growth & Arizona Transportation-To
What End? Diversifying the
economy Transportation
Revenue Future Direction

Arizona’s Future POTENTIAL STATEWIDE GROWTH
2000 6 million
2050 11.5-13.2
million
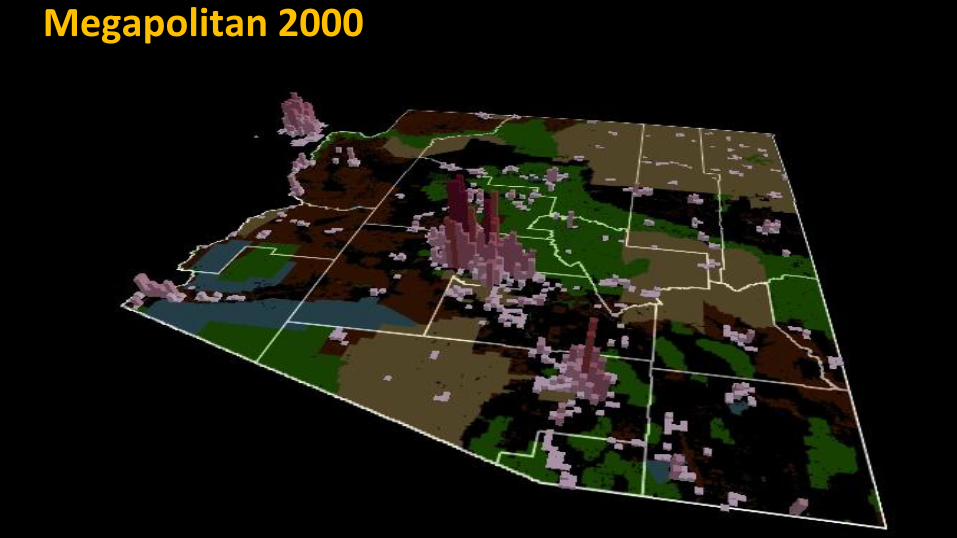
Megapolitan 2000

Megapolitan 2050 Scenario

Visual Volume-to-Capacity Ratio
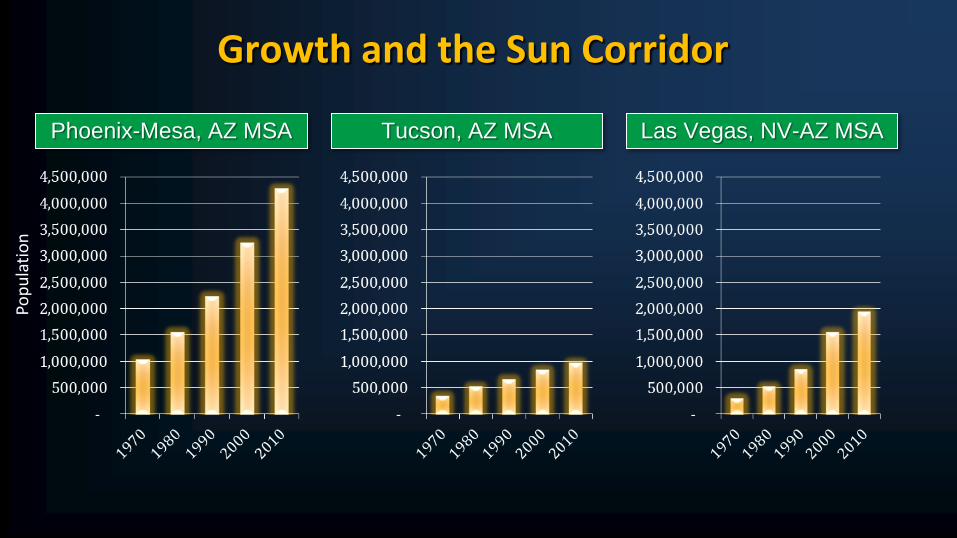
Growth and the Sun Corridor
Phoenix-Mesa, AZ MSA Tucson, AZ MSA Las Vegas, NV-AZ MSA
Pop
ula
tio
n

Explosive Population Growth in Phoenix MSA 1955 – 2040 : More than double year 2000 by 2040!
1955 551,000
2000 3.25 Million
2010 4.2 Million
2040 7.1 Million

Population 2012 Phoenix MSA 4.3 million (66% of AZ) Phoenix + Tucson 5.3 million (81% of AZ ) 82% of AZ Tax receipts

Population 2040 Phoenix MSA 7.1 million (70% of AZ) Phoenix + Tucson 8.4 million (83% of AZ)

Long Range Planning Hassayampa & Hidden Valley Framework Studies Highway & Parkways

State Lands Will Guide Future Development Land Development Status : Central Arizona
Developable Land
Developable (Private)
Developable (ASLD)
Other Land
Developed
Open Space and Military
Indian Communities and BLM
Development Areas
Active Developments
Planned Developments
County Boundaries
Other Features
Highways
Other Highways
Planned Freeway
Freeway
State Land is
64% of remaining
developable land
40% developable 26% remaining developable

Transportation: To What End? Diversify the Economy!

Distressed Residential Properties: March 2010 Second Worst in the Country

Distressed Residential Properties: June 2013 Back to Normal

Arizona Tourism Economic Impact by County*
MEXICO’S IMPORTANCE TO AZ
Mexican visitors spent
$2.65 billion in AZ from July’07 to June’08.
Source: Office of Travel and Tourism Industries
– US Department of Commerce
Source: University of Arizona , Mexican
Visitors to Arizona: Visitor Characteristics
and Economic Impacts, 2007-08
Top Origin Markets for International Travelers to the U.S. (2010 vs. 2009 & 2008)
* Data for 2012

18
Tourism: Key industry
Mexicans to AZ (2007-08): • 24 million crossings • 3.8 million Tourists
$2.7 billion spent AZ
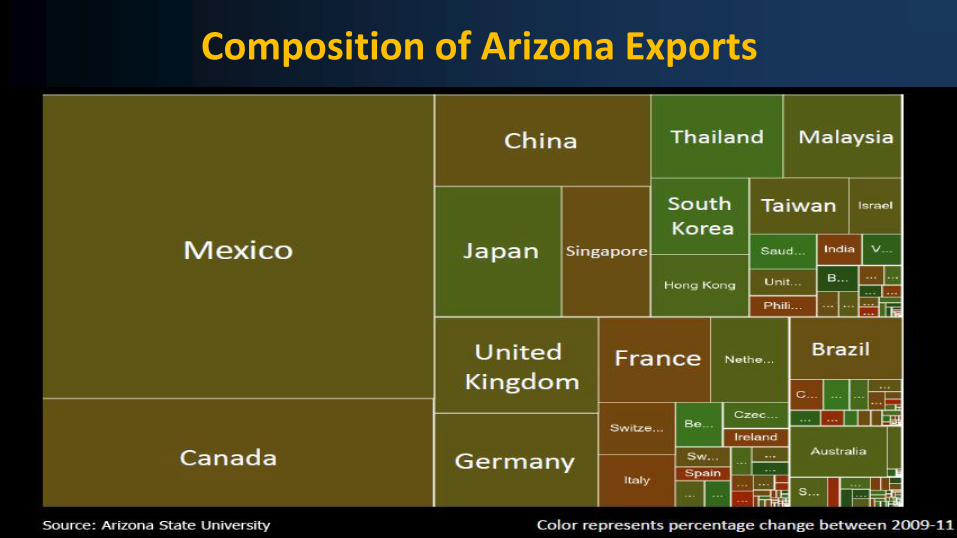
Composition of Arizona Exports

9.3 million people in the AZ-Sonora region • Younger labor force in Sonora. • Arizona will age faster. • Our future is interdependent.
Arizona Sonora
Arizona – Sonora: Population

In 2012: • Mexico was the fastest -
growing economy among NAFTA partners.
• $13 Billion Trade Between Arizona – Mexico.
• 75% of Arizona exports destined for Sonora.
Arizona’s largest exports to Mexico include: Computers and electronic components, minerals and ore, and electrical equipment.

-
50,000
100,000
150,000
200,000
250,000
300,000
350,000
400,000
450,000
2000 2001 2002 2003 2004 2005 2006 2007 2008 2009 2010 2011 2012
Crossings at Arizona/Mexico POEs
Trucks Rail Containers
Imports From Mexico in U.S. Dollars: 2004-2012
Arizona Losing Share in Trade with Mexico’s Fast-Growing Economy

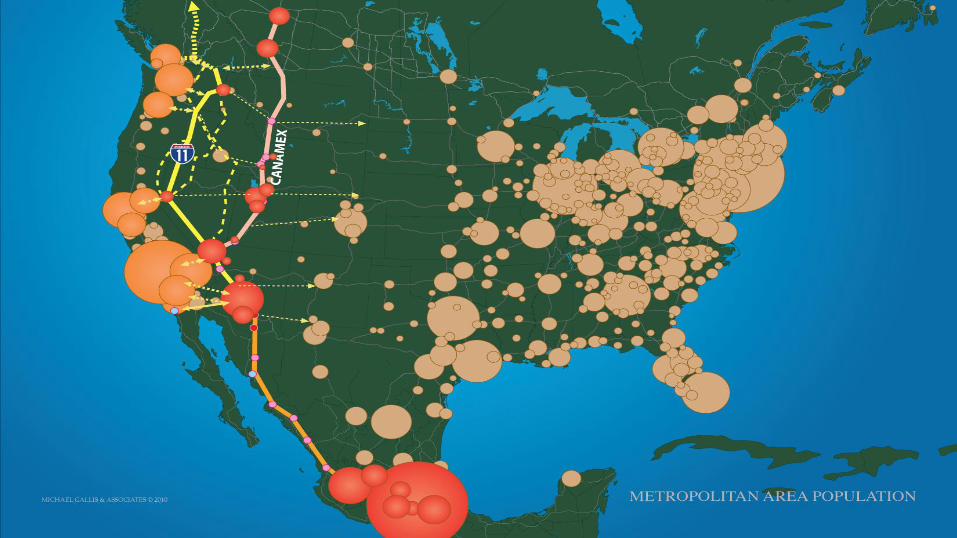
Mexico 112 million population
Arizona–Sonora: One Connected Region

Slide content provided by COPRESON

SOME INTEGRATION MOVEMENTS

America’s Trade Corridor Connecting Canada, the United States, and Mexico

March 22, 2013 Binational Economic Forum We Are All Border Cities

March 22, 2013 Binational Economic Forum

Sun Corridor is now a logical hub for staging imports and distribution to West markets
• Sun Corridor population (anchor market)
• Near-Shoring trends in Mexico
• Strategic location to West Coast and Mexico
Freight Framework ‘Big Picture’ ─ Leverage Strategic Location

Focus Area evaluation helped identify freight typologies present in Sun Corridor:
Maricopa Phoenix Mesa Gateway
West Valley
Discovery Triangle
West Phoenix
Grand Avenue
Deer Valley
West Chandler
Surprise
Pinal
Pinal Airpark
La Palma
Eloy (Interstate 8 / Interstate 10)
Maricopa / Casa Grande
Magma Rail Road
Pima
Tucson International Airport
North Tucson
Marana
Freight Focus Area Identified by JPAC Study Partners

Freight Framework Next Steps
Develop a JPAC logistics working group that will focus on:
• Creating a special regional designation, such as a Sun
Corridor Freight Development Zone.
• Preparing conceptual business plans for freight focus areas.
• Analyzing and identifying key freight transportation
corridors in the Sun Corridor.
• Develop a Freight Plan that will ultimately create jobs and
Increase Arizona’s global competitiveness.

Transportation Revenues

Combined Gas Tax Rates Source: American Petroleum Institute, July 2013
37.4

Potential Transportation Revenue Sources
$1,041.20
$820.14
$604.91
$429.83
$337.04
$316.40
$228.68
$177.96
$115.98
$115.24
$96.78
$53.37
$42.58
$13.15
$0.00 $200.00 $400.00 $600.00 $800.00 $1,000.00 $1,200.00
Add state and local sales tax in addition to current fuel taxes
Add state sales tax in addition to current fuel taxes
1/2 cent state transportation sales tax
Add 5 cents and index state and federal fuel taxes to CPI
Replace fuel tax with state and local sales tax
Add 5 cents and index state fuel taxes to CPI
Index current state and federal fuel tax to CPI
Add 5 cents to fuel tax
Replace fuel tax with state sales tax
Index current state fuel tax to CPI
Property tax for transportation
$10 registration fee increase
10% surcharge on luxury tax collections (liquor & tobacco)
$10 driver's license fee increase
Annual Average Net New Revenue 2013 to 2022 (millions of dollars)
Local $221.06
Local $221.06
0.9% Percent Increase in HURF Revenues Compared to Projections for 2013 to 2022 3.0%
3.8%
6.8%
8.1%
8.2%
12.6%
16.2%
22.4%
23.8%
30.4%
42.8%
58.0%
73.6%
Source: Eric Anderson, Maricopa Association of Governments

The Future
“Only the metropolis has the fundamental assets that together can offer the combination of
specialization and diversity that stimulates self-sustaining economic development and job creation. In this setting, the clustering and networking dynamics among many different firms, entrepreneurs, and institutions interact in ways that span and accelerate growth of production and exports, as well as expansion and spreading of incomes and wealth.”
“By emphasizing the interwoven economic destinies that bridge across families and communities within metropolitan regions, people can begin to see themselves as members of a cohesive economic team that is actively competing against other economic teams all over the world.”
Dr. Marc A. Weiss, Chairman and Chief Executive Officer of the Prague Institute for Global Urban Development and Public Policy Scholar at the Woodrow Wilson International Center

Work as a team in Arizona.
Recognize and enhance our relationship with our #1 trading partner – Mexico.
Protect the Sonoran desert and promote tourism.
Create alliances with the Intermountain West.
Invest in Interstate 11.
Celebrate port of entry improvements, the Port of Tucson and the Red Rock facility.
Work on creative approaches to fund transportation and other concepts that will bring jobs and improve our quality of life.
G'Kar Narn Ambassador to Babylon 5 Interstellar Alliance
“We Are One”
The Future

For More Information Contact: Dennis Smith MAG Executive Director (602) 254-6300 www.azmag.gov