Embed Size (px)
Citation preview
Chapter 2
Acoustic Emission to Detect Damage in FRP StrengthUnder Freeze and Thaw Cycles
Hyun-Do Yun and Wonchang Choi
Additional information is available at the end of the chapter
http://dx.doi.org/10.5772/53813
1. Introduction
Strengthening with carbon fiber reinforced polymer (CFRP) sheets and plates, as opposed tothe use of steel plates, has been employed recently in the rehabilitation and retrofitting ofinfrastructures due to better performance (than that of steel plates) in terms of resistance tocorrosion and high stiffness-to-weight ratios. Because concrete structures are exposed peri‐odically to snow and freezing temperatures during the winter season, a reduction in struc‐tural integrity, such as observed in the deterioration of the concrete and the degradation ofthe FRP bond system, is evident in field conditions. In terms of environmental exposure, pe‐riodic temperature changes such as freeze and thaw cycles can cause devastating damage toRC structures.
Since 1989, research by Kaiser [1] has been used to investigate the structural integrity ofCFRP-strengthened RC beams exposed to freeze and thaw cycling. Results indicate that thestrength of RC beams with CFRP sheets does not decrease with fewer than 100 cycles rang‐ing from -25°C to 25°C. Similar test results are reported by Baumert and Bisby [2] who con‐ducted tests on CFRP-strengthened RC beams exposed to temperatures ranging from -27°Cto 21°C and from -18°C to 15°C with 50 freeze and thaw cycles for each temperature. Bisbyand Green [3] examined the bonding performance of concrete members strengthened withCFRP and glass FRP under freeze and thaw cycling with temperatures ranging from -18°Cto 15°C. Their results indicate insignificant effects on strengthening in flexure within 300 cy‐cles of freeze and thawing. The American Concrete Institute (ACI) 440R-02 [4] recommendsthat the FRP system, which is exposed to high humidity, freeze-thaw cycles, salt water, oralkalinity, should be taken into account when determining the environmental degradationof an adhesively bonded system.
© 2013 Yun and Choi; licensee InTech. This is an open access article distributed under the terms of theCreative Commons Attribution License (http://creativecommons.org/licenses/by/3.0), which permitsunrestricted use, distribution, and reproduction in any medium, provided the original work is properly cited.
2. Problem statement
Because the condition of strengthened concrete is not visible from outside the CFRP sheets,it is difficult to quantify the deterioration and any defects that affect the structural integrityof the infrastructure. Evaluation techniques are needed to expand CFRP’s application in re‐pair and rehabilitation. With that need in mind, an acoustic emission technique is employedto determine the performance of CFRP-strengthened RC beams exposed to freeze and thawcycling.
The author’s previous study successfully shows the possible application of acoustic emis‐sion activities to determine the structural integrity corresponding to the representative dam‐age levels of CFRP-strengthened RC beams that contain intentional defects in the bondsystem [5]. In this research, the acoustic emission signal characteristics of RC beamsstrengthened with CFRP sheets and exposed to several freeze and thaw cycles (0, 30, 60,120,and 400 cycles) ranging in temperature from -18 to 4°C are investigated.
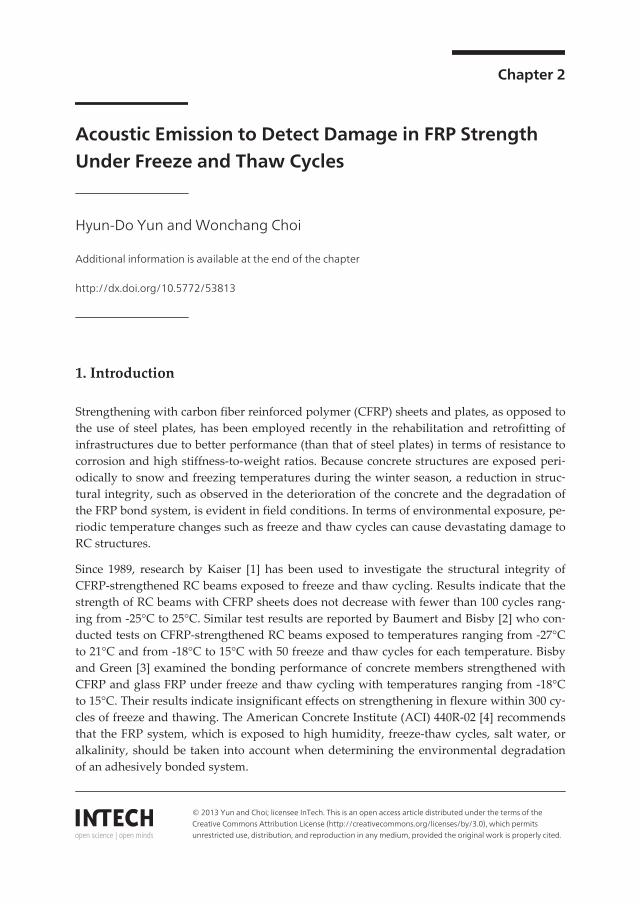
For this study, six beams were fabricated in 100 x 100 x 400 mm sections with a specifieddesign compressive strength of 33 MPa for all specimens. The specimens were designed inshear failure regardless of the shear reinforcement with CFRP. Specimen S1 indicates thecontrol beam without any strengthening or freeze and thaw cycles. Specimens S2 indicatethe shear-strengthened beams with CFRP sheets (0.12 mm thickness). Detailed reinforce‐ment and specimen information is presented in Figure 1.
Figure 1. Detailed information regarding the test specimens
Acoustic Emission - Research and Applications22
The CFRP sheets used in this study have tensile strengths of 4,100 MPa, respectively. Theadhesive (Sikadur-330) used for bonding the CFRP composites is epoxy resin, and its bond‐ing strength, as supplied by the manufacturer, is 17.5 MPa. The material properties of thereinforcement in the specimens are listed in Table 1.
Size of Rebar (diameter, area) Yielding Strength (MPa) Yielding Strain (µm)
Longitudinal
ReinforcementD13 (12.7mm, 1.267cm2) 255 2130
Transverse Reinforcement D6 (6.35mm, 0.3167cm2) 290 1920
Compression
ReinforcementD6 (6.35mm, 0.3167cm2) 290 1920
Table 1. Material Properties of Reinforcement
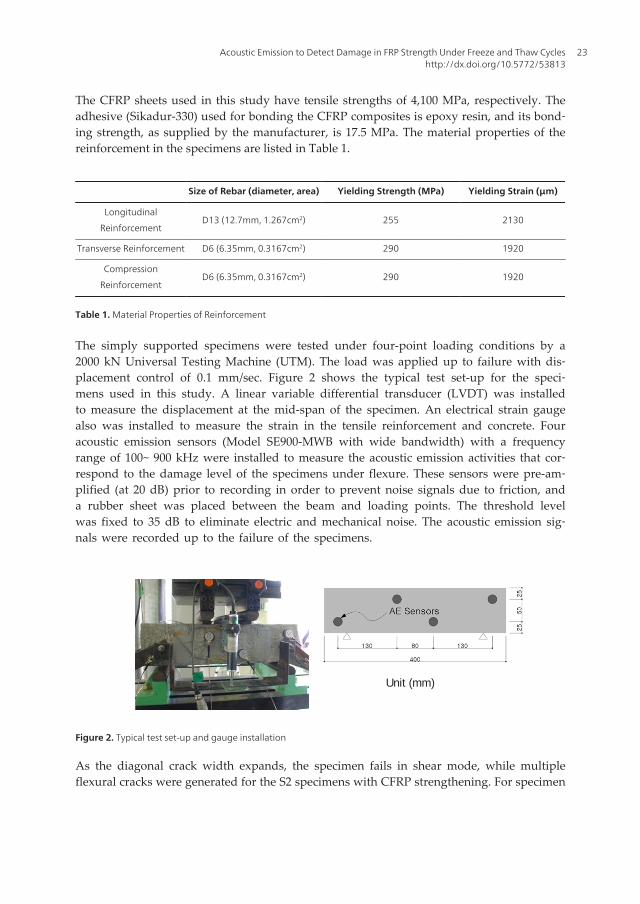
The simply supported specimens were tested under four-point loading conditions by a2000 kN Universal Testing Machine (UTM). The load was applied up to failure with dis‐placement control of 0.1 mm/sec. Figure 2 shows the typical test set-up for the speci‐mens used in this study. A linear variable differential transducer (LVDT) was installedto measure the displacement at the mid-span of the specimen. An electrical strain gaugealso was installed to measure the strain in the tensile reinforcement and concrete. Fouracoustic emission sensors (Model SE900-MWB with wide bandwidth) with a frequencyrange of 100~ 900 kHz were installed to measure the acoustic emission activities that cor‐respond to the damage level of the specimens under flexure. These sensors were pre-am‐plified (at 20 dB) prior to recording in order to prevent noise signals due to friction, anda rubber sheet was placed between the beam and loading points. The threshold levelwas fixed to 35 dB to eliminate electric and mechanical noise. The acoustic emission sig‐nals were recorded up to the failure of the specimens.
Unit (mm)
Figure 2. Typical test set-up and gauge installation
As the diagonal crack width expands, the specimen fails in shear mode, while multipleflexural cracks were generated for the S2 specimens with CFRP strengthening. For specimen
Acoustic Emission to Detect Damage in FRP Strength Under Freeze and Thaw Cycleshttp://dx.doi.org/10.5772/53813
23
S1, the flexural crack initiates at the mid-span of the specimen around 12% (12 kN) of theultimate strength, and then diagonal cracking is generated at around 30% (29kN) of the ulti‐mate strength. As the diagonal crack width expands, the specimen fails in shear mode, whilemultiple flexural cracks were generated for the S2 specimens with CFRP strengthening.
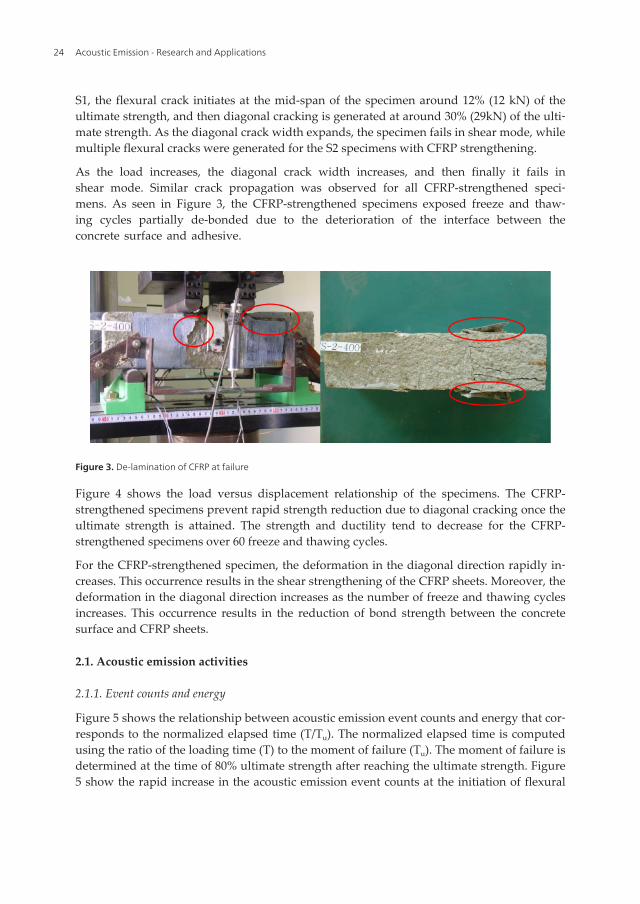
As the load increases, the diagonal crack width increases, and then finally it fails inshear mode. Similar crack propagation was observed for all CFRP-strengthened speci‐mens. As seen in Figure 3, the CFRP-strengthened specimens exposed freeze and thaw‐ing cycles partially de-bonded due to the deterioration of the interface between theconcrete surface and adhesive.
Figure 3. De-lamination of CFRP at failure
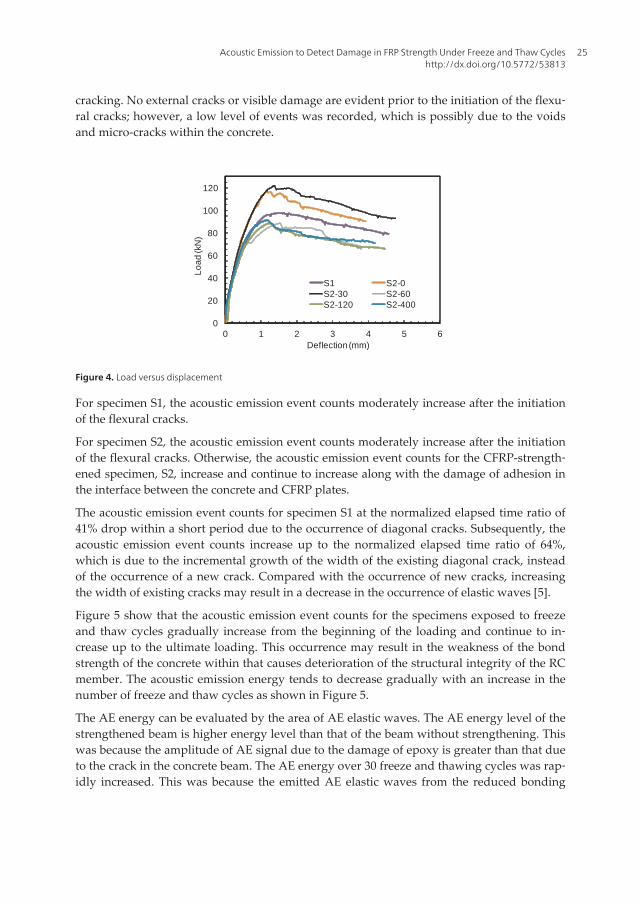
Figure 4 shows the load versus displacement relationship of the specimens. The CFRP-strengthened specimens prevent rapid strength reduction due to diagonal cracking once theultimate strength is attained. The strength and ductility tend to decrease for the CFRP-strengthened specimens over 60 freeze and thawing cycles.
For the CFRP-strengthened specimen, the deformation in the diagonal direction rapidly in‐creases. This occurrence results in the shear strengthening of the CFRP sheets. Moreover, thedeformation in the diagonal direction increases as the number of freeze and thawing cyclesincreases. This occurrence results in the reduction of bond strength between the concretesurface and CFRP sheets.
2.1. Acoustic emission activities
2.1.1. Event counts and energy
Figure 5 shows the relationship between acoustic emission event counts and energy that cor‐responds to the normalized elapsed time (T/Tu). The normalized elapsed time is computedusing the ratio of the loading time (T) to the moment of failure (Tu). The moment of failure isdetermined at the time of 80% ultimate strength after reaching the ultimate strength. Figure5 show the rapid increase in the acoustic emission event counts at the initiation of flexural
Acoustic Emission - Research and Applications24
cracking. No external cracks or visible damage are evident prior to the initiation of the flexu‐ral cracks; however, a low level of events was recorded, which is possibly due to the voidsand micro-cracks within the concrete.
0
20
40
60
80
100
120
0 1 2 3 4 5 6
Lo
ad
(kN
)
Deflection (mm)
S1 S2-0S2-30 S2-60S2-120 S2-400
Figure 4. Load versus displacement
For specimen S1, the acoustic emission event counts moderately increase after the initiationof the flexural cracks.
For specimen S2, the acoustic emission event counts moderately increase after the initiationof the flexural cracks. Otherwise, the acoustic emission event counts for the CFRP-strength‐ened specimen, S2, increase and continue to increase along with the damage of adhesion inthe interface between the concrete and CFRP plates.
The acoustic emission event counts for specimen S1 at the normalized elapsed time ratio of41% drop within a short period due to the occurrence of diagonal cracks. Subsequently, theacoustic emission event counts increase up to the normalized elapsed time ratio of 64%,which is due to the incremental growth of the width of the existing diagonal crack, insteadof the occurrence of a new crack. Compared with the occurrence of new cracks, increasingthe width of existing cracks may result in a decrease in the occurrence of elastic waves [5].
Figure 5 show that the acoustic emission event counts for the specimens exposed to freezeand thaw cycles gradually increase from the beginning of the loading and continue to in‐crease up to the ultimate loading. This occurrence may result in the weakness of the bondstrength of the concrete within that causes deterioration of the structural integrity of the RCmember. The acoustic emission energy tends to decrease gradually with an increase in thenumber of freeze and thaw cycles as shown in Figure 5.
The AE energy can be evaluated by the area of AE elastic waves. The AE energy level of thestrengthened beam is higher energy level than that of the beam without strengthening. Thiswas because the amplitude of AE signal due to the damage of epoxy is greater than that dueto the crack in the concrete beam. The AE energy over 30 freeze and thawing cycles was rap‐idly increased. This was because the emitted AE elastic waves from the reduced bonding
Acoustic Emission to Detect Damage in FRP Strength Under Freeze and Thaw Cycleshttp://dx.doi.org/10.5772/53813
25
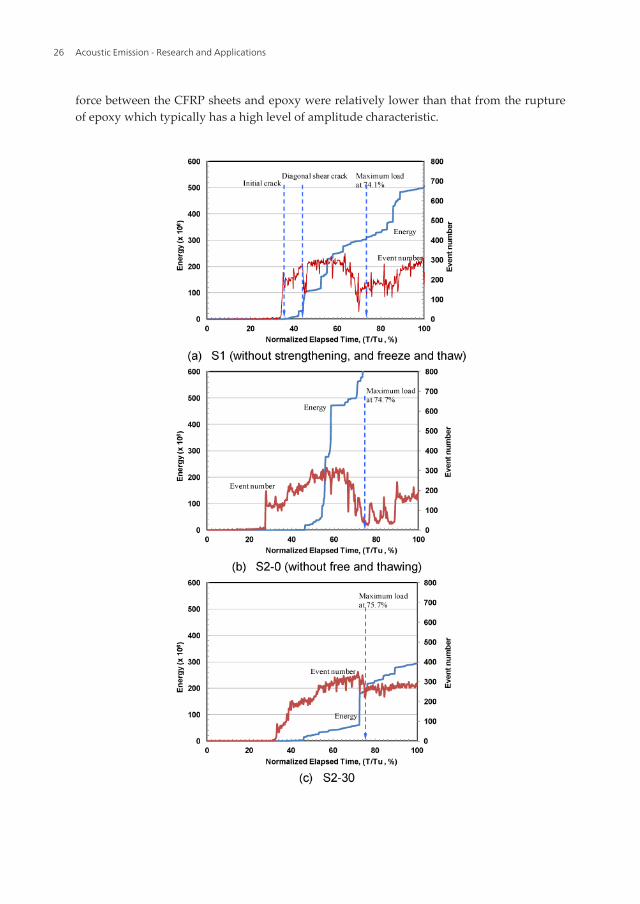
force between the CFRP sheets and epoxy were relatively lower than that from the ruptureof epoxy which typically has a high level of amplitude characteristic.
Acoustic Emission - Research and Applications26
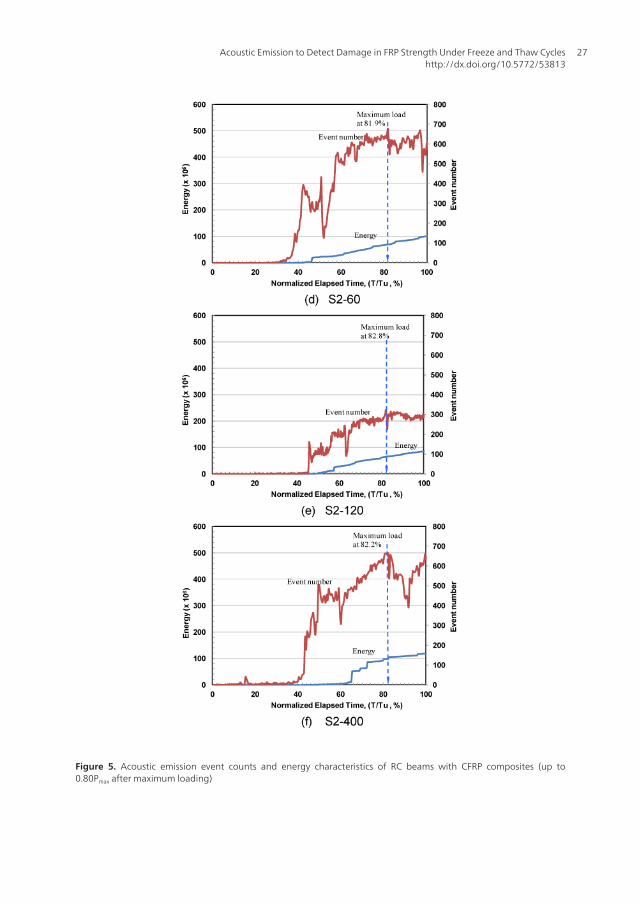
Figure 5. Acoustic emission event counts and energy characteristics of RC beams with CFRP composites (up to0.80Pmax after maximum loading)
Acoustic Emission to Detect Damage in FRP Strength Under Freeze and Thaw Cycleshttp://dx.doi.org/10.5772/53813
27
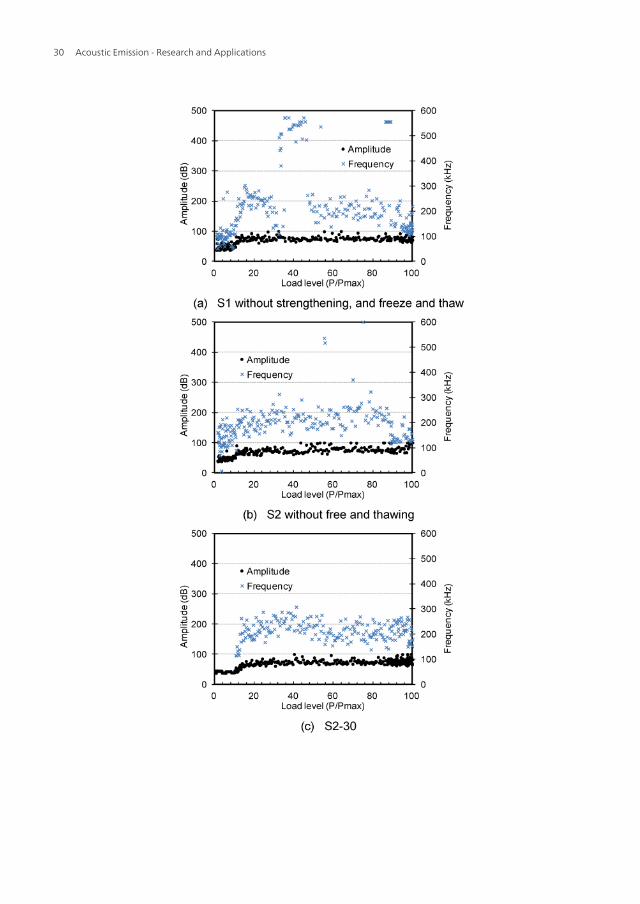
2.2. Amplitude and frequency
Figure 6 shows the progress of amplitude and frequency that corresponds to the normalizedloading ratio for selected specimens. The amplitude and frequency of specimen S1 increaseconsiderably from the beginning of the load to the initial flexural crack, as shown in Figure 6(a). This result is caused by the development of macro-cracks that represent the connectionof the voids and entrapped air within the concrete. The incremental development of themacro-cracks continues until diagonal cracks begin to appear. The frequency decreases radi‐cally once these diagonal cracks appear. However, the amplitude does not change signifi‐cantly. The frequency decreases continuously until the ultimate load is reached. Afterward,it is in the range of 100 – 200 kHz until failure.
For specimen S2, the acoustic emission signal is detected at the beginning of loading. Speci‐men S2 generates a higher amplitude and frequency than specimen S1. These higher acous‐tic emission signals might be caused by the damage of epoxy on the concrete surface andCFRP plate. No considerable change is evident from the beginning of the de-bonding of theCFRP to the ultimate loading and failure. The frequency until failure is in the range of 150 –250 kHz, which is a higher frequency than for specimen S1. This finding is due to the acous‐tic emission signal characteristics of the epoxy in the interface between the concrete andCFRP sheets.
On the other hand, specimens S2-120 and S2-400 generate low amplitude and frequency atthe initial flexural cracks and diagonal cracks. This occurrence results in the deterioration ofthe epoxy and/or the concrete surface due to the considerable number of freeze and thawingcycles.
As shown in Figure 8 (f), the more freeze and thawing cycles, the more deterioration of theconcrete surface and CFRP sheets. This deterioration results in the significant increase inamplitude and frequency during the beginning of loading up to the de-bonding of theCFRP. Afterward, the acoustic emission signal decreases. The frequency until failure is inthe range of 200 – 350 kHz, which is a relatively high frequency range. In general, there is atendency for the amplitude and frequency to increase as the micro-cracks and initial flexuralcracks develop. The frequency tends to decrease as the diagonal cracks propagate and thecrack widths expand, although the maximum amplitude does not change.
2.3. Damage evaluation
In order to apply acoustic emission techniques to the evaluation of damage and integrity ofCFRP-strengthened RC beams, it is essential to study the characteristics of the acoustic emis‐sion parameters according to damage levels. The evolution of acoustic activity caused bymicro-fracture within the concrete is often quantified using the concise framework originat‐ed by Gutenberg and Richter in their analysis of earthquake magnitudes, which is a reflec‐tion of the view that large-scale (i.e., geological) and small-scale (i.e., micro-fracture)acoustic events share a common origin in cascades of strain energy release events. In earth‐quake seismology, events of larger magnitude occur less frequently than events of smaller
Acoustic Emission - Research and Applications28
magnitude. This fact can be quantified in terms of a magnitude-frequency relationship, forwhich Gutenberg and Richter propose the empirical formula (1),
( )log ,N W a bW= - (1)
where N(W) is the Richter magnitude of the events, which is the cumulative number ofevents having a magnitude greater than or equal to W, and a and b are the empirical con‐stants.
In acoustic emission data analysis, the coefficient b is known as the AE-b value [6]. The AE-bvalue is given as the gradient of the linear descending branch of the cumulative frequencydistribution. The coefficient 20 was multiplied to get the AE-b values to the slope [7]. In theprocess where micro-fractures are more prevalent than macro-fractures, the b-value tends toincrease, whereas in the process whereby macro-fractures occur more frequently than mi‐cro-fractures, the b-value tends to decrease.
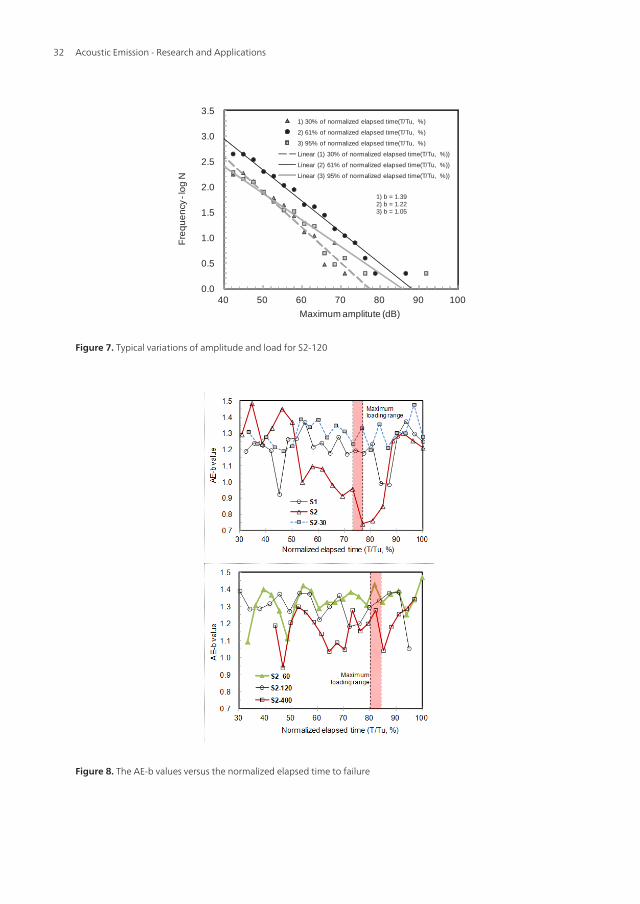
Figure 7 presents the relationship of maximum amplitude versus frequency during the spe‐cific normalized elapsed time, which indicates the representative damage level. For speci‐men S2-120, the AE-b value is 1.389 when the micro-cracks initiate on the surface and can bedetected visually. As the cracks propagate and expand, the values are 1.222 and 1.051, re‐spectively. Those values tend to decrease as damage progresses. In short, the AE-b valuestend to increase when the micro-cracks dominate the overall behavior, whereas the AE-bvalues seem to decrease when the behavior is controlled primarily by the propagating andexpanding cracks [6, 8].
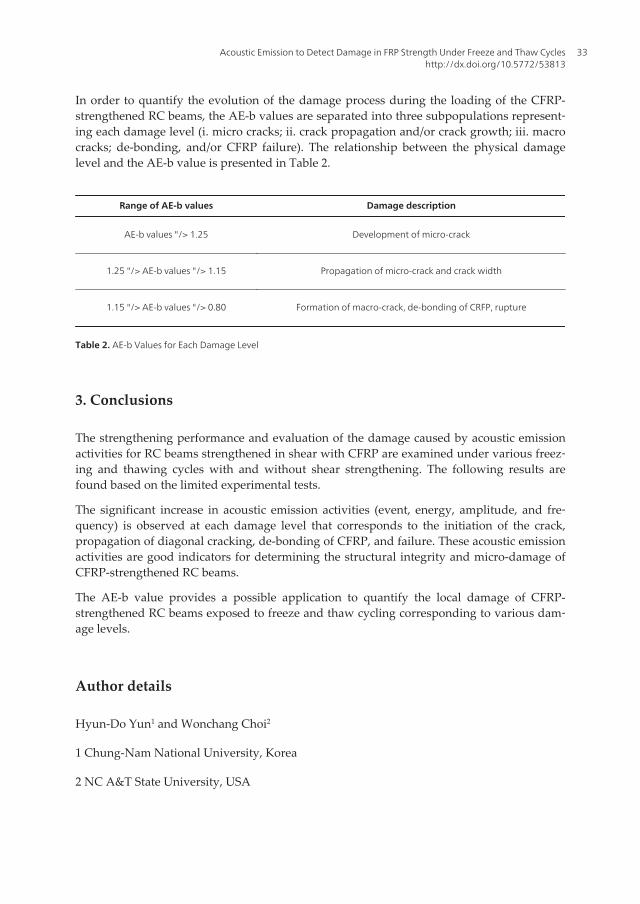
Figure 8 presents the comparison between the AE-b values versus the normalized elapsedtime to failure. For specimen S-1, the AE-b value decreases significantly at the initiation ofthe diagonal cracks and flexural compression failure, at which time considerable damage isgenerated. This occurrence results in a high acoustic emission signal.
For specimen S-2, the lowest AE-b value is obtained at the de-bonding of the CFRP. After‐ward, the rapid decrease in the AE-b value can be observed around the point of failure.
Specimens with fewer than 120 freeze and thawing cycles have relatively higher AE-b val‐ues (higher than 1.2) at the initiation of the micro-cracks and diagonal cracks and de-bond‐ing of the CFRP. In general, the AE-b values range from 1.20 to 1.45, which is a relativelynarrow fluctuation range compared to that for the specimens that are not exposed to freezeand thawing cycles.
For specimens exposed over 400 freeze and thawing cycles (S2-400), the low AE-b values areobtained at the beginning of the elapsed time, which may result in the deterioration of theconcrete surface and bonding surface with the CFRP. The damage level caused by the freezeand thawing cycles is comparable to that of the macro-cracks. This occurrence is caused bythe low acoustic emission values at the beginning of the test.
Acoustic Emission to Detect Damage in FRP Strength Under Freeze and Thaw Cycleshttp://dx.doi.org/10.5772/53813
29
Acoustic Emission - Research and Applications30

Figure 6. Frequency and amplitude
Acoustic Emission to Detect Damage in FRP Strength Under Freeze and Thaw Cycleshttp://dx.doi.org/10.5772/53813
31
0.0
0.5
1.0
1.5
2.0
2.5
3.0
3.5
40 50 60 70 80 90 100
Fre
qu
en
cy -
log
N
Maximum amplitute (dB)
1) 30% of normalized elapsed time(T/Tu, %)
2) 61% of normalized elapsed time(T/Tu, %)
3) 95% of normalized elapsed time(T/Tu, %)
Linear (1) 30% of normalized elapsed time(T/Tu, %))
Linear (2) 61% of normalized elapsed time(T/Tu, %))
Linear (3) 95% of normalized elapsed time(T/Tu, %))
1) b = 1.392) b = 1.223) b = 1.05
Figure 7. Typical variations of amplitude and load for S2-120
Figure 8. The AE-b values versus the normalized elapsed time to failure
Acoustic Emission - Research and Applications32
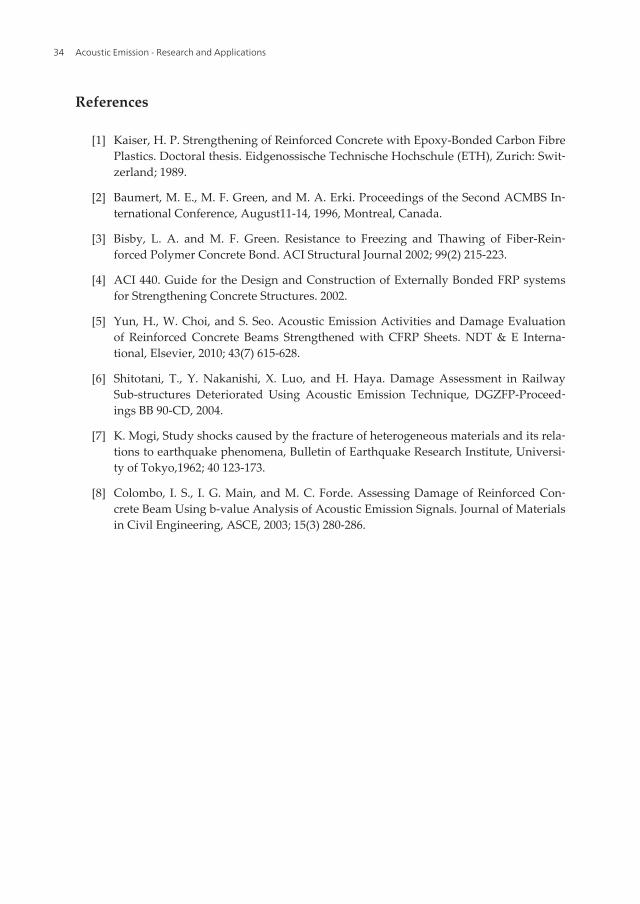
In order to quantify the evolution of the damage process during the loading of the CFRP-strengthened RC beams, the AE-b values are separated into three subpopulations represent‐ing each damage level (i. micro cracks; ii. crack propagation and/or crack growth; iii. macrocracks; de-bonding, and/or CFRP failure). The relationship between the physical damagelevel and the AE-b value is presented in Table 2.
Range of AE-b values Damage description
AE-b values "/> 1.25 Development of micro-crack
1.25 "/> AE-b values "/> 1.15 Propagation of micro-crack and crack width
1.15 "/> AE-b values "/> 0.80 Formation of macro-crack, de-bonding of CRFP, rupture
Table 2. AE-b Values for Each Damage Level
3. Conclusions
The strengthening performance and evaluation of the damage caused by acoustic emissionactivities for RC beams strengthened in shear with CFRP are examined under various freez‐ing and thawing cycles with and without shear strengthening. The following results arefound based on the limited experimental tests.
The significant increase in acoustic emission activities (event, energy, amplitude, and fre‐quency) is observed at each damage level that corresponds to the initiation of the crack,propagation of diagonal cracking, de-bonding of CFRP, and failure. These acoustic emissionactivities are good indicators for determining the structural integrity and micro-damage ofCFRP-strengthened RC beams.
The AE-b value provides a possible application to quantify the local damage of CFRP-strengthened RC beams exposed to freeze and thaw cycling corresponding to various dam‐age levels.
Author details
Hyun-Do Yun1 and Wonchang Choi2
1 Chung-Nam National University, Korea
2 NC A&T State University, USA
Acoustic Emission to Detect Damage in FRP Strength Under Freeze and Thaw Cycleshttp://dx.doi.org/10.5772/53813
33
References
[1] Kaiser, H. P. Strengthening of Reinforced Concrete with Epoxy-Bonded Carbon FibrePlastics. Doctoral thesis. Eidgenossische Technische Hochschule (ETH), Zurich: Swit‐zerland; 1989.
[2] Baumert, M. E., M. F. Green, and M. A. Erki. Proceedings of the Second ACMBS In‐ternational Conference, August11-14, 1996, Montreal, Canada.
[3] Bisby, L. A. and M. F. Green. Resistance to Freezing and Thawing of Fiber-Rein‐forced Polymer Concrete Bond. ACI Structural Journal 2002; 99(2) 215-223.
[4] ACI 440. Guide for the Design and Construction of Externally Bonded FRP systemsfor Strengthening Concrete Structures. 2002.
[5] Yun, H., W. Choi, and S. Seo. Acoustic Emission Activities and Damage Evaluationof Reinforced Concrete Beams Strengthened with CFRP Sheets. NDT & E Interna‐tional, Elsevier, 2010; 43(7) 615-628.
[6] Shitotani, T., Y. Nakanishi, X. Luo, and H. Haya. Damage Assessment in RailwaySub-structures Deteriorated Using Acoustic Emission Technique, DGZFP-Proceed‐ings BB 90-CD, 2004.
[7] K. Mogi, Study shocks caused by the fracture of heterogeneous materials and its rela‐tions to earthquake phenomena, Bulletin of Earthquake Research Institute, Universi‐ty of Tokyo,1962; 40 123-173.
[8] Colombo, I. S., I. G. Main, and M. C. Forde. Assessing Damage of Reinforced Con‐crete Beam Using b-value Analysis of Acoustic Emission Signals. Journal of Materialsin Civil Engineering, ASCE, 2003; 15(3) 280-286.
Acoustic Emission - Research and Applications34


![ZZZ ]LDUDDW FRP - ziyaraat.netziyaraat.net/booksTareekh/MolaAliMadinayMayPacheesSaal.pdf · 3uhvhqwhge\zzz ]lduddw frp. 3uhvhqwhge\zzz ]lduddw frp. 3uhvhqwhge\zzz ]lduddw frp](https://img.pdfslide.net/doc/110x75/5e045b61dc086d0f1330bd6d/zzz-lduddw-frp-3uhvhqwhgezzz-lduddw-frp-3uhvhqwhgezzz-lduddw-frp-3uhvhqwhgezzz.jpg)