Embed Size (px)
Citation preview
Journal of Personality and Social Psychology Copyright 1996 by the American Psychological Association, inc. 1996, Vol. 70, No. 3, 614--636 0022-3514/96/$3.00
Acoustic Profiles in Vocal Emotion Expression
R a i n e r B a n s e Humboldt University
K l a u s R . S c h e r e r University of Geneva
Professional actors' portrayals of 14 emotions varying in intensity and valence were presented to judges. The results on decoding replicate earlier findings on the ability of judges to infer vocally expressed emotions with much-better-than-chance accuracy, including consistently found differ- ences in the recognizability of different emotions. A total of 224 portrayals were subjected to digital acoustic analysis to obtain profiles of vocal parameters for different emotions. The data suggest that vocal parameters not only index the degree of intensity typical for different emotions but also differentiate valence or quality aspects. The data are also used to test theoretical predictions on vocal patterning based on the component process model of emotion (K. R. Scherer, 1986). Although most hypotheses are supported, some need to be revised on the basis of the empirical evidence. Discriminant analysis and jackknifing show remarkably high hit rates and patterns ofc0nfusion that closely mirror those found for listener-judges.
The important role of vocal cues in the expression of emo- tion, both felt and feigned, and the powerful effects of vocal affect expression on interpersonal interaction and social influ- ence have been recognized ever since antiquity (see Cicero's De Oratore or Quintilian's Institutio Oratoria; cf. Scherer, 1993). Darwin (1872/1965), in his pioneering monograph on the ex- pression of emotion in animals and humans, underlined the pri- mary significance of the voice as a carrier of affective signals. More recently, ethologists and psychologists have identified the various functions of vocal affect communication with respect to major dimensions of organismic states (e.g., activity or arousal, valence) and interorganismic relationships (e.g., dominance, nurturance), particularly for the communication of reaction patterns and behavioral intentions (see Cosmides, 1983; Frick, 1985; Marler & Tenaza, 1977; Morton, 1977; Scherer, 1979, 1985, 1989, for reviews). Current research in this area focuses
Rainer Banse, Department of Psychology, Humboldt University, Ber- lin, Germany; Klaus R. Soberer, Department of Psychology, University of Geneva, Geneva, Switzerland.
This research was conducted in collaboration with Heiner Ellgring, University of W'tirzburg, W'tirzburg, Germany, and Harald Wallbott, University of Salzburg, Salzburg, Austria. The work was supported by grants from the Deutsche Forschungsgemeinschat~ (No. Sche 156/8-5 ) and the Swiss National Fund for Scientific Research (FNRS No. 21- 32648.91 ESPRIT-BRA). We also acknowledge the use of space and equipment provided by the University of Giessen, Giessen, Germany, and the Max Planck Institute of Psychiatry in Munich, Germany. We are very indebted to Birgit Perleth and Sigrid Sailer for their careful and untiring work in obtaining the actor portrayals and conducting the expert rating study. The analysis and the preparation of the article greatly profited from the collaboration of Thomas Goldbeck, Ursula Hess, Siegfried Otto, Reiner Standke, and Ursula Scherer. We gratefully acknowledge these contributions.
Correspondence concerning this article should be addressed to Klaus R. Scherer, Department of Psychology, University of Geneva, 9 route de Drize, CH- 1227 Carouge-Gen~ve, Switzerland. Electronic mail may be sent via the Internet to [email protected].
on two major questions, which we addressed in the study re- ported in this article: (a) can listeners infer emotions from vocal cues? and (b) what are the specific vocal expression patterns for specific emotions?
Decod ing : Can Lis teners Infer E m o t i o n F r o m Vocal Cues?
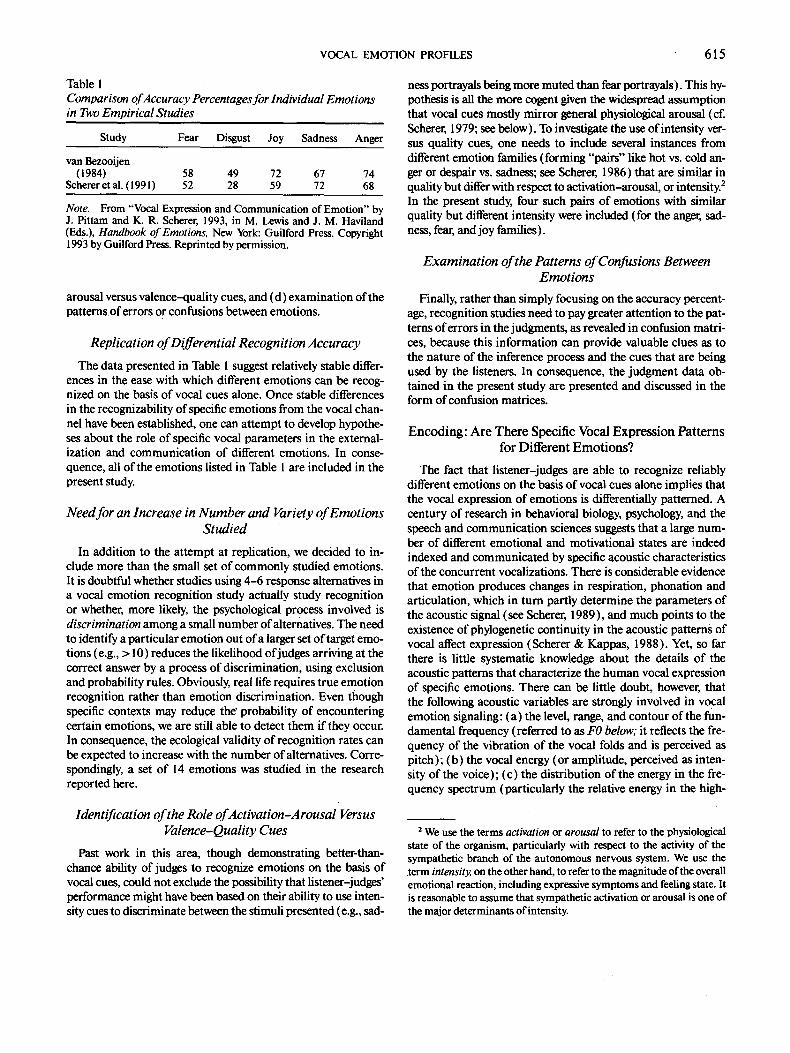
This question has been studied ever since the technological means of storing and reproducing voice sound became available to psychologists.t Reviews of about 60 years of research in this area (van Bezooijen, 1984; Frick, 1985; Scherer, 1979, 1986; Standke, 1992) show that listeners are rather good at inferring affective state and speaker attitude from vocal expression. The accuracy percentage generally attains 50% (after correcting for guessing given the limited number of response alternatives)m about four to five times the rate expected by chance (Pittam & Scherer, 1993). Most studies in this area have focused on a small number of emotions, such as anger, fear, sadness, joy, and dis- gust. Interestingly, there are strong differences in the accuracy with which these major emotions can be inferred from vocal expression alone. Table 1 (reproduced from Pittam & Scherer, 1993) shows the respective accuracy percentages for a subset of emotions from the van Bezooijen (1984) and Scherer, Banse, Wallbott, and Goldbeck (1991 ) studies, which--contrary to many of the earlier studies--can be directly compared. Given the present state of the evidence, the following four issues need to be addressed by future research on emotion decoding: (a) replication of the differences in recognition accuracy between emotions, (b) need for an increase in the number and variety of emotions studied, (c) identification of the role of activation-
t The terms encoding and decoding as opposed to sending and receiv- ing were chosen for this article because they capture both the research method and the underlying process. No claim is made as to the existence of a particular "code" of emotional communication.
614
VOCAL EMOTION PROFILES 615
Table 1 Comparison of Accuracy Percentages for Individual Emotions in Two Empirical Studies
Study Fear Disgust Joy Sadness Anger
van Bezooijen (1984) 58 49 72 67 74
Scherer et al. (1991) 52 28 59 72 68
Note. From "Vocal Expression and Communication of Emotion" by J. Pittam and K. R. Scherer, 1993, in M. Lewis and J. M. Haviland (Eds.), Handbook of Emotions, New York: Guilford Press. Copyright 1993 by Guilford Press. Reprinted by permission.
arousal versus valence-quality cues, and (d) examination of the patterns of errors or confusions between emotions.
Replication of Differential Recognition Accuracy
The data presented in Table 1 suggest relatively stable differ- ences in the ease with which different emotions can be recog- nized on the basis of vocal cues alone. Once stable differences in the recognizability of specific emotions from the vocal chan- nel have been established, one can attempt to develop hypothe- ses about the role of specific vocal parameters in the external- ization and communication of different emotions. In conse- quence, all of the emotions listed in Table 1 are included in the present study.
Need for an Increase in Number and Variety of Emotions Studied
In addition to the attempt at replication, we decided to in- clude more than the small set of commonly studied emotions. It is doubtful whether studies using 4-6 response alternatives in a vocal emotion recognition study actually study recognition or whether, more likely, the psychological process involved is discrimination among a small number of alternatives. The need to identify a particular emotion out of a larger set of target emo- tions (e.g., > 10) reduces the likelihood of judges arriving at the correct answer by a process of discrimination, using exclusion and probability rules. Obviously, real life requires true emotion recognition rather than emotion discrimination. Even though specific contexts may reduce the" probability of encountering certain emotions, we are still able to detect them if they occur. In consequence, the ecological validity of recognition rates can be expected to increase with the number of alternatives. Corre- spondingly, a set of 14 emotions was studied in the research reported here.
Identification of the Role of Activation-Arousal Versus Valence-Quality Cues
Past work in this area, though demonstrating better-than- chance ability of judges to recognize emotions on the basis of vocal cues, could not exclude the possibility that listener-judges' performance might have been based on their ability to use inten- sity cues to discriminate between the stimuli presented (e.g., sad-
ness portrayals being more muted than fear portrayals). This hy- pothesis is all the more cogent given the widespread assumption that vocal cues mostly mirror general physiological arousal (cf. Scherer, 1979; see below). To investigate the use ofintensity ver- sus quality cues, one needs to include several instances from different emotion families (forming "pairs" like hot vs. cold an- ger or despair vs. sadness; see Scherer, 1986) that are similar in quality but differ with respect to activation-arousal, or intensity.2 In the present study, four such pairs of emotions with similar quality but different intensity were included (for the anger, sad- ness, fear, and joy families).
Examination of the Patterns of Confusions Between Emotions
Finally, rather than simply focusing on the accuracy percent- age, recognition studies need to pay greater attention to the pat- terns of errors in the judgments, as revealed in confusion matri- ces, because this information can provide valuable clues as to the nature of the inference process and the cues that are being used by the listeners. In consequence, the judgment data ob- tained in the present study are presented and discussed in the form of confusion matrices.
Encod ing : A r e There Specific Vocal Express ion Pa t te rns for Dif ferent Emot ions?
The fact that listener-judges are able to recognize reliably different emotions on the basis of vocal cues alone implies that the vocal expression of emotions is differentially patterned. A century of research in behavioral biology, psychology, and the speech and communication sciences suggests that a large num- ber of different emotional and motivational states are indeed indexed and communicated by specific acoustic characteristics of the concurrent vocalizations. There is considerable evidence that emotion produces changes in respiration, phonation and articulation, which in turn partly determine the parameters of the acoustic signal (see Scherer, 1989), and much points to the existence of phylogenetic continuity in the acoustic patterns of vocal affect expression (Scherer & Kappas, 1988). Yet, so far there is little systematic knowledge about the details of the acoustic patterns that characterize the human vocal expression of specific emotions. There can be little doubt, however, that the following acoustic variables are strongly involved in vocal emotion signaling: (a) the level, range, and contour of the fun- damental frequency (referred to as FO below; it reflects the fre- quency of the vibration of the vocal folds and is perceived as pitch); (b) the vocal energy (or amplitude, perceived as inten- sity of the voice); (c) the distribution of the energy in the fre- quency spectrum (particularly the relative energy in the high-
2 We use the terms activation or arousal to refer to the physiological state of the organism, particularly with respect to the activity of the sympathetic branch of the autonomous nervous system. We use the .term intensity, on the other hand, to refer to the magnitude ofthe overall emotional reaction, including expressive symptoms and feeling state. It is reasonable to assume that sympathetic activation or arousal is one of the major determinants of intensity.
616 BANSE AND SCHERER
vs. the low-frequency region, affecting the perception of voice quality or timbre); (d) the location of the formants (F 1, F 2 . . . Fn, related to the perception of articulation); and (e) a variety of temporal phenomena, including tempo and pausing (for a more detailed discussion of these parameters, see Borden & Harris, 1984; Scherer, 1989). For a set of repeatedly studied emotions, Pittam and Scherer (1993, pp, 188-189) summa- rized the research evidence as follows (see also Murray & Ar- nott, 1993; Scherer, 1986; Tischer, 1994):
Anger: Anger generally seems to be characterized by an in- crease in mean F0 and mean energy. Some studies, which may have been measuring "hot" anger (most studies do not explic- itly define whether they studied hot or cold anger), also show increases in F0 variability and in the range ofF0 across the ut- terances encoded. Studies in which these characteristics were not found may have been measuring cold anger. Further anger effects include increases in high-frequency energy and down- ward-directed F0 contours. The rate of articulation usually increases.
Fear: There is considerable agreement on the acoustic cues associated with fear. High arousal levels would be expected with this emotion, and this is supported by evidence showing in- creases in mean F0, in F0 range, and high-frequency energy. Rate of articulation is reported to be speeded up. An increase in mean F0 has also been found for milder forms of the emotion such as worry or anxiety.
Sadness: As with fear, the findings converge across the studies that have included this emotion. A decrease in mean F0, F0 range, and mean energy is usually found, as are downward-di- rected F0 contours. There is evidence that high-frequency en- ergy and rate of articulation decrease. Most studies have inves- tigated the quieter, subdued forms of this emotion rather than the more highly aroused forms, such as desperation. The latter variant might be characterized by an increase ofF0 and energy.
Joy: This is one of the few positive emotions studied, most often in the form of elation rather than more subdued forms such ~ enjoyment or happiness. Consistent with the high arousal level that one might expect, we find a strong con- vergence of findings on increases in mean F0, F0 range, F0 vari- ability, and mean energy. There is some evidence for an increase in high-frequency energy and rate of articulation.
Disgust: As Scherer (1989) noted, the results for disgust tend to be inconsistent across studies. The few that have included this emotion vary in their encoding procedures from measuring disgust (or possibly displeasure) at unpleasant films to actor simulation of the emotion. The studies that have used the for- mer found an increase in mean F0, whereas those that have used the latter found the reverse--a lowering of mean F0. This in- consistency is echoed in the decoding literature.
Although many of the findings concerning emotion-specific vocal patterns seem quite robust, the evidence is not conclusive. There are three major causes for this state of affairs.
First, because of the very restricted set of emotions that have so far been included in encoding studies, it is impossible to dis- tinguish between acoustical characteristics that exclusively in- dex nonspecific activation or arousal and those that reflect the valence or quality aspects of emotional states. Thus, there is a research deficit similar to what has been described for decoding
studies above. In consequence, the set of emotions--in particu- lar the four emotion pairs--chosen for systematic comparison of arousal versus quality with respect to the study of emotion recognition, will also help settle the question of the vocal corre- lates of these emotion characteristics.
Second, past work has mostly used F0 and energy parameters that are likely to mostly reflect nonspecific physiological arousal (see Scherer, 1979, 1986, for a detailed discussion of this point). In consequence, the limitations in the choice of acoustic param- eters in past studies may have obscured the existence of emo- tion-specific acoustic profiles. Clearly, the remedy is to measure a much larger set of pertinent acoustic characteristics of vocal emotion expressions. It was therefore one of our aims in the present study to include as many parameters as possible, given current methodology. In addition to the classic variables (energy, F0, and speech rate), this study includes many other acoustic variables, in particular several different measures of spectral energy distribution, which are likely to reflect emotion- specific changes in respiration, phonation, and articulation. Furthermore, given the multiple interactions between the different voice production processes, yielding relatively strong correlations between different acoustic variables, we used mul- tivariate statistical analyses.
Third, the atheoretical nature of much of the research in this area so far has prevented any real cumulativeness of the empir- ical findings or the development of testable hypotheses. Scherer (1986), on the basis of his component-process model of emo- tion, presented an integral set of predictions for the major "modal" emotions 3 and some of their variants (see Table 2). To provide the reader with a general notion of the theory and the rationale for the hypotheses listed in Table 2, a brief review is provided below.
Component process theory (Scherer, 1984, 1986) conceptu- alizes emotion as an episode of temporary synchronization of all major subsystems of organismic functioning represented by five components (cognition, physiological regulation, motiva- tion, motor expression, and monitoring-feeling) in response to the evaluation or appraisal of an external or internal stimulus event as relevant to central concerns of the organism. It is claimed that although the different subsystems or components operate relatively independently of each other during nonemo- tional states, dealing with their respective function in overall behavioral regulation, they are recruited to work in unison dur- ing emergency situations, the emotion episodes. These require the mobilization of substantial organismic resources to allow adaptation or active responses to an important event or change of internal state. The emotion episode is seen to begin with the onset of synchronization following a particular outcome of a
a The term modal emotion was chosen to avoid the controversy sur- rounding the notion of basic or fundamental emotions (see Cognition & Emotion, Special Issue 6(3 & 4), 1992). According to component- process theory, there are as many different emotions as there are differ- ential outcomes of emotion-antecedent situation appraisal. Yet there are a number of prototypical outcomes that occur very frequently (and, in consequence, have had emotion labels attached to them by many of the major languages of the world). Scherer (1984) suggested calling these modal emotions.
V O C A L E M O T I O N P R O F I L E S 617
o ~ o
~= ' ~ Q
~ . ~
~ ~~
y ~g : . o
^~
.~.~-
e..~ .~
~.-=~
,il ,'T ~ ' r .
~ <
.=
sequence of stimulus evaluation checks (SECs) and to end with the return to independent functioning of the subsystems (although systems may differ in responsivity and processing speed). Because stimulus evaluation is expected to affect each subsystem directly, and because all systems are seen to be highly interrelated during the emotion episode, regulation is complex and involves multiple feedback and feedforward processes.
On the basis of this general theoretical framework, detailed hypotheses of predictions foremotion specific patterns of motor expression (including vocal expression) can be derived as fol- lows: First, the theory specifies prototypical profiles of appraisal results (i.e., specific outcomes of the SECs) for all of the major modal emotions. On the basis of past research and theorizing informed by the known physiological mechanisms of vocal pro- duction (adopting a functionalist stance, i.e., which physiologi- cal response allows an adaptation to the condition detected by the stimulus evaluation check), the effect of each result of a particular stimulus evaluation check on vocal production (particularly on respiration and phonation) is then predicted by specifying the nature of the changes in the acoustic speech sig- nal. For example, the effect of appraising an object as intrinsi- cally unpleasant is assumed to be, among other things, faucal and pharyngeal constriction and a tensing of the vocal tract walls. Acoustically, this should lead to more high-frequency en- ergy, rising of FI, falling of F2 and F3, and narrow F1 band- width. In this fashion, predictions for the possible outcomes of every stimulus evaluation check are derived. The pattern of pre- dictions for each modal emotion is then obtained by cumulating the effects of the postulated profile of SEC outcomes for the respective emotion. The result of this procedure is shown in Table 2.
One of the major aims of this study was to test these predic- tions of specific profiles of acoustic parameters for a set of major modal emotions and to encourage a more theory-driven ap- proach to studying the vocal expression of emotion.
Combining Encoding and Decoding: How Do Vocal Cues Affect Emotion Inference?
Studies that have attempted to look at both aspects of the vocal communication process are rather rare (van Bezooijen, 1984; Scherer, London, & Wolf, 1973; Wallbott & Scherer, 1986). Such an approach allows specification of the effect of the different acoustic cues on judges' emotion inferences--for both their correct and their incorrect choices. Independent of the is- sues of emotion recognition from the voice or differential vocal patterning of emotion expression, this throws some light on the nature of the inference mechanisms in voice perception (see Kappas, Hess, & Scherer, 1991 ). We addressed this question in the present study by analyzing the relationships between use of emotion categories by judges and objectively measured acoustic characteristics of vocal emotion portrayals.
Research Paradigm
The questions addressed by the present study required a rather comprehensive research design. Vocal expressions of the 14 emotions under investigation were to be induced in such a
618 BANSE AND SCHERER
way as to be amenable to high-quality audio recording (given the requirements of digital extraction of acoustic parameters). As the nature of the verbal utterance serving as carrier of the vocal emotion expression greatly influences the acoustic pa- rameters (the vocal channel being jointly used for linguistic and emotional signaling), it is necessary to obtain standardized speech samples. Furthermore, because important individual differences in vocal expression can be found in past research, a sizable number of encoders is mandatory. Because of possible interaction effects between individual differences and type of emotion, it is desirable that all encoders express all of the emo- tions to be studied. Finally, given the potential importance of the antecedent situation and the respective context for the elici- tation and expression of emotions, it is desirable to obtain vocal expressions for different types of emotion-inducing situations to increase generalizability.
It is quite obvious that for ethical and practical reasons such a study cannot be conducted with naive participants by using experimental induction of"real" emotions (in such a way that vocal expression will result). Even if, by accepting many com- promises, one succeeded by clever experimentation to induce a few affective states, it is most likely that their intensities would be rather low and unlikely to yield representative vocal expres- sions (a phenomenon that is consistently encountered in studies that try to demonstrate the existence--or the absence--of differential physiological response patterning for different emotions). Furthermore, it is likely that one would succeed only in eliciting blends of several affect states rather than rela- tively "pure" emotions, as was required by the aim of this study. Similar concerns exist for other, "soft" induction methods, such as imagery techniques (Cacioppo, Klein, Berntson, & Hatfield, 1993; Gerrards-Hesse, Spies, & Hesse, 1994; Stemmler, 1989).
Given the patent impossibility of systematically inducing a large number of intense emotional states even for a small group of participants and simultaneously obtaining standard speech samples, we used actor portrayals, as have many of the earlier studies. Obviously, the use of actors in the research on the vocal expression of emotion (as for facial expression ) is based on the assumption that actors are able to produce "natural" vocal emotion expressions and that therefore judges can recognize these renderings both in the theater and in research settings. This assumption is routinely challenged with the argument that actor performances are not comparable to real-life behavior. We propose to approach the issue from the opposite angle by asking the following question: How natural are real-life emotional expressions?
Janney and his collaborators (Arndt & Janney, 1991; Caffi & Janney, 1994) have addressed the problem from the point of view of linguistic pragmatics. They started from Marty's ( 1908 ) suggestion, mirrored by many other early linguists, to distin- guish between emotional and emotive communication. Accord- ing to Marty, emotional communication is a type of spontane- ous, unintentional leakage or bursting out of emotion in speech whereas emotive communication is a type that has no auto- matic or necessary relation to "real" inner affective states. Rather, it is seen as strategic signaling of affective information in speaking to interaction partners. It seems reasonable to as- sume that emotive communication is a very widespread inter-
actional phenomenon. Because actors should be perfectly able to convincingly produce emotive vocal messages, one can claim reasonable ecological validity for using the actor portrayal par- adigm in studying vocal expression. However, one can even go further than that. It is rather unlikely that strategic, emotive messages use signal patterns that differ strongly from spontane- ous, emotional expressions (see Scherer, 1985, for further de- tails concerning this point). Studying emotive messages might thus be an indirect way of studying "real" emotional communi- cation. However, one may have serious doubts as to whether completely pure, uncontrolled externalizations of "real" inner emotional states exist at all. 4
On the basis of ethological and psychological evidence, it can be shown that "naturalistic" affect vocalizations reflecting "real" emotions are jointly determined by an externalization of internal states (push effects) and the requirements of species- or culture-specific normative models for affect signals or displays (pull effects; see Scherer, 1985, 1988, for more detailed discus- sions of this issue). The fact that emotional expressions are al- most always subject to sociocultural censure and are conse- quently closely controlled was expressed forcefully by Wundt ( 1905, p. 85 ) and has been elaborated by many other scholars since (Efron, 1972; Ekman & Friesen, 1969). The likelihood that an emotional state is controlled or regulated is even stronger because a very large percentage of real-life emotion sit- uations occurs in a social-interactive context, the emotions of- ten being caused by other persons (see Scherer, Wallbott, & Summerfield, 1986, for actuarial data from eight European countries).
Furthermore, one might assume that once the person starts to speak (which is required for lengthy vocal expressions), control and regulation become even more pronounced because of the fact that speaking in general is a highly controlled process and is closely monitored. Vocalizations that are almost exclusively de- termined by push effects, that is, externalization of internal states, mainly determined by physiological changes, are thus to be expected only for a few very brief, spontaneous vocalizations or affect bursts (e.g., a disgusted "yuck" on being suddenly con- fronted with unsavory matter; see Scherer, 1988, 1994). Most affect vocalizations (or interjections), however, are equally sub- ject to control and regulation, although to a varying degree. 5 Goffman ( 1959, 1978), who argued that we are all actors and that real-life expressions are in fact acted, has called such vocal- izations response cries and has demonstrated convincingly how we use them for affective self-presentation, whether consciously controlled or not.
It seems reasonable, then, to assume that most so-called
4 In fact, one might challenge, on theoretical grounds, the idea that there are emotional states that are unaffected by the requirements for continuous internal and external regulation, including strategic action tendencies, once one considers seriously that emotion is a process rather than a state.
5 It is intriguing to note that neuroanatomical work has shown that human speech and monkey calls seem to be hierarchically organized, with the highest level, the anterior limbic cortex, being specialized for the production of vocalization on voluntary impulse (Jiirgens, 1988; see also Ploog, 1988 ).
VOCAL EMOTION PROFILES 619
"na tu ra l " vocal affect expression is also staged and represents to some degree an affect portrayal. Al though natural expres- sions are partly staged, acted expressions are also partly natu- ral. The degree o f naturalness depends on the product ion strategy. In the best case, the actors might produce full-blown emot ional reactions by means o f imaginat ion or another form of autoinduct ion (menta l or muscular) as prescribed by the Stanislavski method for example. Very similar techniques, which are considered as ecologically valid, are the standard method for exper imental emot ion induct ion in the psycholog- ical laboratory (see, for example, Gerrards-Hesse et al., i994) . Thus, i f actors are encouraged to use such induct ion methods to produce realistic portrayals and indeed succeed in this task, the expressions should be considered valid instances o f vocal emot ion expressions. Alternatively, the actors might imitate observed instances o f real-life expressions or use cul- turally shared prototypes (see Scherer, 1992a, for a more ex- tended discussion) in their portrayals. In this case, we would still expect a sizable degree o f overlap with natural ly occurr ing expressions. Only i f the actors ' portrayals are a lmost entirely idiosyncratic would the validity o f this research paradigm be compromised. One effective safeguard against this danger is to check the recognizabil i ty o f the portrayal by using indepen- dent judges and to discard samples that do not correspond to a shared system of emot ion communica t ion .
M e t h o d
Emotion Portrayals
Actors
Twelve professional stage actors (6 men and 6 women ) were recruited in Munich, Germany. All actors were native speakers of German. They had all graduated from professional acting schools and were regularly employed in radio, television, and stage work. They were paid for their participation.
Emotions Studied
A representative number of different emotions, including members of the same emotion family (see also Ekman, 1992) with similar emotion quality and different intensity levels were used in this study. The follow- ing 14 emotions were selected: hot anger, cold anger, panic fear, anxiety, despair, sadness, elation, happiness, interest, boredom, shame, pride, disgust, and contempt.
Scenarios
To evaluate the effect of differences in antecedent situations or events, two different eliciting scenarios were developed for each of the 14 emo- tions. To ensure that these short scenarios represented typical anteced- ent situations for the elicitation of the respective emotion, they were selected from a corpus of situations collected in several large intercul- tural studies on emotional experience. In these studies, more than 3,800 respondents had described emotional experiences as well as the respec- tive eliciting situations (Scherer et al., 1986; Scherer & Wallbott, 1994). For the emotions that had been used in the intercultural questionnaire studies, situations or events that were frequently mentioned as elicitors were chosen as basis for the development of scenarios. The respective situation descriptions were rewritten in such a way as to render the see-
narios stylistically similar across emotions. For the remaining emotions, scenarios were developed on the basis of events reported in the literature.
Standard Sentences
To avoid effgcts of differences in phonemic structure on the acoustic variables, standardized language material had to be used. The following two standard sentences from an earlier study (Scherer ct al., 1991 ), composed of phonemes from several Indo-European. languages, were used: ,'Hat sundig pron you venzy"and "Fee gott laish jonkill gosterr.'"
These meaningless utterances resemble normal speech. Listeners generally have the impression of listening to an unknown foreign language.
Design
We combined the variables discussed above into a 14 (emotion) × 6 (actor) x 2 (sex of actor ) × 2 (sentence) × 2 (scenario) factorial design. For each cell, two emotion portrayals were recorded, yielding a total of 1,344 voice samples.
Recording of Emotion Portrayals
Three to seven days before the recording, the actors received a booklet containing the two elieiting scenarios and labels for each of the 14 emo- tions and the two standard sentences. They were asked to learn by heart the standard sentences and their correct accentuation. The recording ses- sions took place at the Max Planek Institute for Psychiatry in Munich. At the beginning of the recording session, the actors received a script consisting of 56 pages, 1 for each of the emotion × scenario x sentence combinations. These pages contained the label of the intended emotion, the text of the scenario, and the standard sentence. The actors were told to imagine each scenario vividly and to start performing when they actu- ally felt the intended emotion. They then acted out the portrayal twice. If they felt that a rendering was not optimal they could repeat it. There were no time constraints; the whole session was recorded continuously. The portrayals were recorded on audio- and videotape. For audio recording, a high-quality microphone and a professional reel-to-reel tape recorder were used. The distance and orientation of the actors to the microphone was held constant. The input level of the sound recording was optimized for each actor and kept constant over all emotions. For video recording, two cameras captured the face and the whole body of the actor respec- tively. The two video images were mixed to produce a split screen image and recorded on U-Marie and VHS recorders simultaneously.
Face Validity o f the Portrayals
A necessary requirement for both the decoding and encoding parts of the study was that the recording of portrayals be of high quality with respect to authenticity and recognizability. A first inspection of the 1,344 emotion portrayals by the investigators and their collaborators revealed considerable quality differences. A number of portrayals seemed somewhat artificial and not very representative of the respective emotion. Given the likelihood that some of the portrayals must be con- sidered as belonging to the class of the idiosyncratic production tech- niques referred to in the introduction, we dropped actor as a separate variable. To ensure maximal validity of the portrayals to be subjected to further analysis, we decided to select only two portrayals of high quality for each of the 112 cells in the remaining 14 (emotion) × 2 (sex of actor) × 2 (sentence) × 2 (scenario) factorial design.
This selection was performed in two steps. First, expert ratings were used to screen the large number of portrayals with respect to perceived recognizability and authenticity. These ratings were performed sepa-
620 BANSE AND SCHERER
rately for the audio, visual, and combined audio-visual channel. ~ On the basis of these ratings, a set of 280 portrayals that met certain quality criteria were selected and presented to student judges in a recognition study. The final selection of 224 portrayals (2 per cell in the reduced design) was based on the results oftbe recognition study.
ber of stimuli, the recognition study was conducted in two sessions on different days. Participants were run in three groups, and the order of the four stimulus tapes was randomized. The soundtrack of each por- trayal was presented once. The tape was then stopped, and the partici- pants checked one of 14 emotion labels on prepared answer sheets.
Expert Rating
Procedure
Twelve advanced students from a professional acting school in Mu- nich served as paid experts. Because of their training and their motiva- tion, they were assumed to be particularly able to judge their senior colleagues' expressive skills. Four experts participated in each of three rating conditions respectively: sound only (audio condition), image only (visual condition), and sound and image combined (audio-visual condition). The ratings were performed in individual sessions. To facil- itate the comparison of the portrayals, we grouped the 1,344 recordings by emotion to form blocks of 24 portrayals (2 portrayals per actor) and copied them onto a judgment videotape. Each block of 24 portrayals was first presented in its entirety. Then the 24 stimuli were presented again, one by one, and the expert rated the authenticity and recogniz- ability after each portrayal. For authenticity a 6-point scale ( 1 = very good, 6 = verypoor; based on the German school grades) was used, and for recognizability a 4-point scale ( 1 = clearly recognizable, 4 = not recognizable) was used.
Selection Procedure
For each cell of the 14 (emotion) X 2 (sex of actor) x 2 (scenario) × 2 (sentence) factorial design, 2 items were chosen in such a way as to meet the following criteria (in hierarchical order ): (a) a mean recogniz- ability rating of 2 or better, and an authenticity rating of 4 or better, in the combined audio-visual presentation; (b) mean recognizability ratings of 3.5 or better in both the audio and the visual conditions; (c) two different actors represented in each cell; (d) mean recognizability ratings of 2 or better in all three judgment conditions. For the entire sample of 224 portrayals, only 4 had to be included that did not meet Criterion (a): 3 for despair and 1 for boredom. For these 4 portrayals, the mean score on recognizability in the audiovisual condition amounted to 2.75.
Once 224 items had been selected, we decided to add some items that had high quality with regard to the criteria but were ranked "next best" on the basis ofthe expert rating. These items were candidates to replace preselected items for the acoustic analyses in case some of the latter would show low recognizability in the recognition study. By adding 4 such borderline items for each of the 14 emotions, we selected a total of 280 portrayals for the recognition study.
Recognition Study
Participants
Twelve undergraduate psychology students at the University of Gies- sen (3 men and 9 women, with a mean age of 22 years) participated in the experiment and were paid Deutsch Marks 15 (the equivalent of $10) for their participation. To increase participants' motivation to perform well, we promised double payment to the 3 who achieved the highest accuracy scores.
Procedure
The 280 emotion portrayals were copied in random order onto four U-Matic videotapes, 70 portrayals on each. 7 Because of the large num-
Acoustic Analysis
Selection of Portrayals
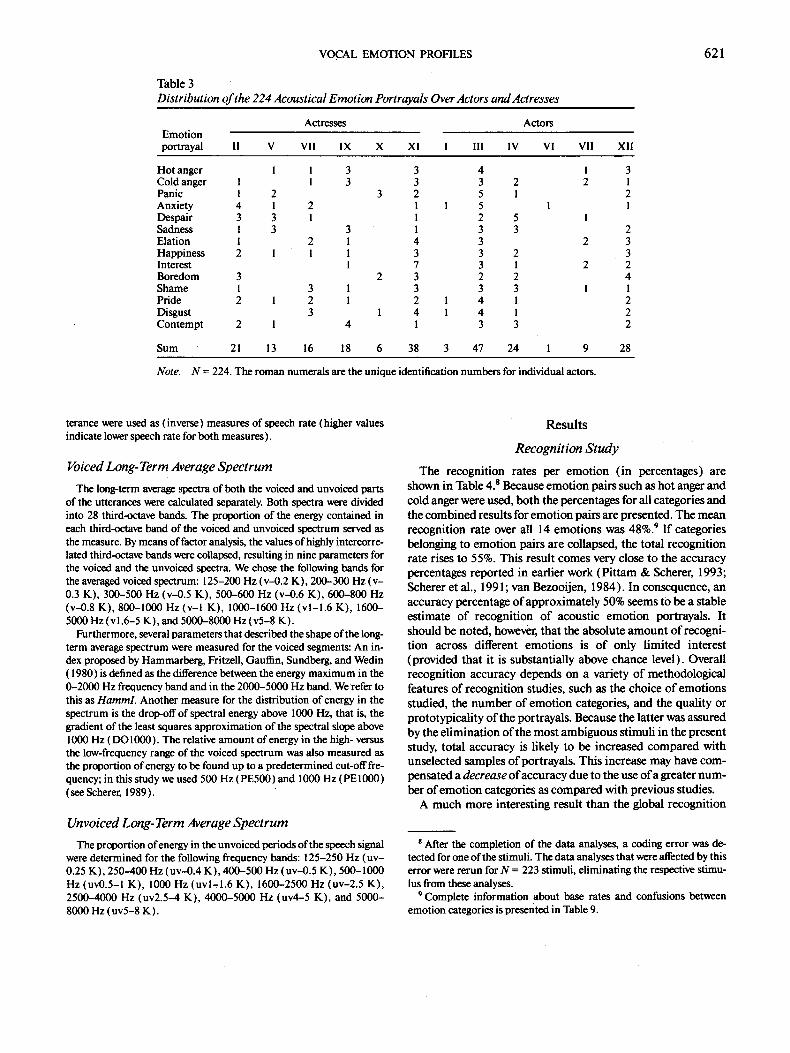
From the 280 voice portrayals, we selected 224 in such a way that each cell of the factorial design contained the 2 most recognizable por- trayals from two different actors. In case of conflict between these two criteria, preference was given to two instead of one actor if the mean recognition rate for that cell did not drop more than 15%. The resulting distribution of portrayals over different actors is shown in Table 3. There are large differences in the contribution of actors. Three actors fur- nished 88% of the portrayals. The distribution of actresses over portray- als is more balanced. For both genders, however, portrayals of the "best" encoders were chosen about twice as often as portrayals of the second best. This led to a confound of emotion and idiosyncratic characteristics of the actors, a problem we discuss in detail in the Results section.
Procedure
The sound recordings were digitized on a 386 Compaq personal com- puter with a sampling frequency of 16,000 Hz and transferred to a PDP 11 /23 computer. An automatic acoustical analysis of the selected emo- tion portrayals was performed by means of the Giessen Speech Analysis System (GISYS; for an introduction to digital speech analysis see Scherer, 1989; for a detailed description of the parameters and the ex- traction algorithms used by GISYS, see Standke, 1992).
Acoustic Parameters
Fundamental Frequency
The following variables were used: mean fundamental frequency (MF0), standard deviation (SDF0), as well as the 25th and the 75th percentiles (P25F0 and P75F0, respectively) of the F0 values per utterance.
Energy
The mean of the log-transformed microphone voltage (MEIOg) was taken as an indicator of loudness. The microphone voltage is propor- tional to the sound pressure that drives the microphone membrane; the log transformation reflects the nonlinear relation between physical stimulus intensity and the subjective perception of loudness. The pa- rameter has no absolute meaning but allows for comparison of intensity across emotion portrayals for each speaker.
Speech Rate
The duration of articulation periods (DurArt; i.e., the duration of nonsilent periods) and the duration of voiced periods (DurVo) per ut-
This procedure was chosen to provide the basis for subsequent multicbannel analyses of vocal, facial, gestural, and postural character- istics. The results on the facial and gestural data' from this study are presented in two separate papers (Ellgring, 1995; Wallbott, 1995 ).
7 Video tape was used to allow for judgment of facial expressions and gesture of the same material in a parallel study.
VOCAL EMOTION PROFILES 621
Table 3 Distribution of the 224 Acoustical Emotion Portrayals Over Actors and Actresses
Actresses Actors Emotion portrayal 1I V VII IX X XI I III IV VI VII XII
Hot anger 1 1 3 3 4 I 3 Cold anger 1 1 3 3 3 2 2 1 Panic 1 2 3 2 5 1 2 Anxiety 4 1 2 1 1 5 1 1 Despair 3 3 1 ! 2 5 I Sadness l 3 3 l 3 3 2 Elation 1 2 l 4 3 2 3 Happiness 2 l 1 l 3 3 2 3 Interest l 7 3 1 2 2 Boredom 3 2 3 2 2 4 Shame 1 3 1 3 3 3 I 1 Pride 2 1 2 1 2 1 4 1 2 Disgust 3 1 4 1 4 1 2 Contempt 2 1 4 ! 3 3 2
Sum 21 13 16 18 6 38 3 47 24 1 9 28
Note. N = 224. The roman numerals are the unique identification numbers for individual actors.
terance were used as (inverse) measures of speech rate (higher values indicate lower speech rate for both measures).
Voiced Long- Term Average Spectrum
The long-term average spectra of both the voiced and unvoiced parts of the utterances were calculated separately. Both spectra were divided into 28 third-octave bands. The proportion of the energy contained in each third-octave band of the voiced and unvoiced spectrum served as the measure. By means of factor analysis, the values of highly intercorre- lated third-octave bands were collapsed, resulting in nine parameters for the voiced and the unvoiced spectra. We chose the following bands for the averaged voiced spectrum: 125-200 Hz (v-0.2 K), 200-300 Hz (v- 0.3 K), 300-500 Hz (v-0.5 K), 500-600 Hz (v-0.6 K), 600-800 Hz (v-0.8 K), 800-1000 Hz (v-I K), 1000-1600 Hz (v l - l .6 K), 1600- 5000 Hz (vl.6-5 K), and 5000-8000 Hz (v5-8 K).
Furthermore, several parameters that described the shape of the long- term average spectrum were measured for the voiced segments: An in- dex proposed by Hammarberg, Fritzell, Gauflin, Sundberg, and Wedin (1980) is defined as the difference between the energy maximum in the 0-2000 Hz frequency band and in the 2000-5000 Hz band. We refer to this as Hamml. Another measure for the distribution of energy in the spectrum is the drop-off of spectral energy above 1000 Hz, that is, the gradient of the least squares approximation of the spectral slope above 1000 Hz (DO1000). The relative amount of energy in the high- versus the low-frequency range of the voiced spectrum was also measured as the proportion of energy to be found up to a predetermined cut-off fre- quency; in this study we used 500 Hz (PE500) and 1000 Hz (PE1000) (see Scherer, 1989).
Unvoiced Long- Term Average Spectrum
The proportion of energy in the unvoiced periods of the speech signal were determined for the following frequency bands: 125-250 Hz (uv- 0.25 K), 250-400 Hz (uv-0.4 K), 400-500 Hz (uv-0.5 K), 500-1000 Hz (uv0.5-1 K), 1000 Hz (uv l , l . 6 K), 1600-2500 Hz (uv-2.5 K), 2500--4000 Hz (uv2.5--4 K), 4000-5000 Hz (uv4-5 K), and 5000- 8000 Hz (uv5-8 K).
R e s u l t s
Recognition Study
The recognition rates per emot ion (in percentages) are shown in Table 4. 8 Because emot ion pairs such as hot anger and cold anger were used, both the percentages for all categories and the combined results for emot ion pairs are presented. The mean recognition rate over all 14 emotions was 48%. 9 I f categories belonging to emot ion pairs are collapsed, the total recognition rate rises to 55%. This result comes very close to the accuracy percentages reported in earlier work (Pi t tam & Scherer, 1993; Scherer et al., 1991; van Bezooijen, 1984). In consequence, an accuracy percentage o f approximately 50% seems to be a stable estimate of recognition o f acoustic emot ion portrayals. It should be noted, however, that the absolute amount o f recogni- tion across different emotions is o f only l imited interest (provided that it is substantially above chance level). Overall recognition accuracy depends on a variety o f methodological features o f recognition studies, such as the choice o f emotions studied, the number o f emot ion categories, and the quality or prototypicali ty o f the portrayals. Because the latter was assured by the el iminat ion o f the most ambiguous stimuli in the present study, total accuracy is likely to be increased compared with unselected samples o f portrayals. This increase may have com- pensated a decrease of accuracy due to the use o f a greater num- ber o f emot ion categories as compared with previous studies.
A much more interesting result than the global recognition
s After the completion of the data analyses, a coding error was de- tected for one of the stimuli. The data analyses that were affected by this error were rerun for N = 223 stimuli, eliminating the respective stimu- lus from these analyses.
9 Complete information about base rates and confusions between emotion categories is presented in Table 9.
622 BANSE AND SCHERER
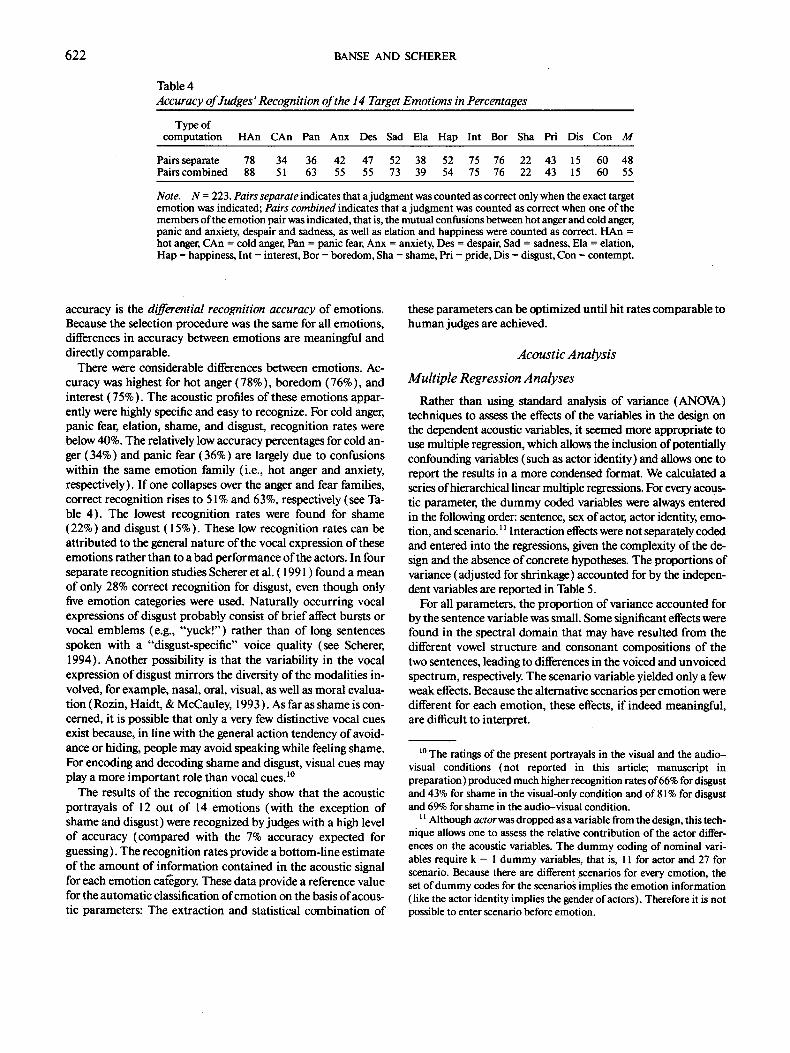
Table 4 Accuracy of Judges' Recognition of the 14 Target Emotions in Percentages
Type of computation HAn CAn Pan Anx Des Sad Ela Hap Int Bor Sha Pri Dis Con M
Pairs separate 78 34 36 42 47 52 38 52 75 76 22 43 15 60 48 Pairs combined 88 51 63 55 55 73 39 54 75 76 22 43 15 60 55
Note. N = 223. Pairs separate indicates that a judgment was counted as correct only when the exact target emotion was indicated; Pairs combined indicates that a judgment was counted as correct when one of the members of the emotion pair was indicated, that is, the mutual confusions between hot anger and cold anger, panic and anxiety, despair and sadness, as well as elation and happiness were counted as correct. HArt = hot anger, CAn = cold anger, Pan = panic fear, Anx = anxiety, Des = despair, Sad = sadness, Ela = elation, Hap = happiness, Int = interest, Bor = boredom, Sha = shame, Pri = pride, Dis = disgust, Con = contempt.
accuracy is the differential recognition accuracy of emotions. Because the selection procedure was the same for all emotions, differences in accuracy between emotions are meaningful and directly comparable.
There were considerable differences between emotions. Ac- curacy was highest for hot anger (78%), boredom (76%), and interest (75%). The acoustic profiles of these emotions appar- ently were highly specific and easy to recognize. For cold anger, panic fear, elation, shame, and disgust, recognition rates were below 40%. The relatively low accuracy percentages for cold an- ger (34%) and panic fear (36%) are largely due to confusions within the same emotion family (i.e., hot anger and anxiety, respectively). If one collapses over the anger and fear families, correct recognition rises to 51% and 63%, respectively (see Ta- ble 4). The lowest recognition rates were found for shame (22%) and disgust (15%). These low recognition rates can be attributed to the general nature of the vocal expression of these emotions rather than to a bad performance of the actors. In four separate recognition studies Scherer et al. ( 1991 ) found a mean of only 28% correct recognition for disgust, even though only five emotion categories were used. Naturally occurring vocal expressions of disgust probably consist of brief affect bursts or vocal emblems (e.g., "yuck!") rather than of long sentences spoken with a "disgust-specific" voice quality (see Scherer, 1994). Another possibility is that the variability in the vocal expression of disgust mirrors the diversity of the modalities in- volved, for example, nasal, oral, visual, as well as moral evalua- tion (Rozin, Haidt, & McCauley, 1993). As far as shame is con- cerned, it is possible that only a very few distinctive vocal cues exist because, in line with the general action tendency of avoid- ance or hiding, people may avoid speaking while feeling shame. For encoding and decoding shame and disgust, visual cues may play a more important role than vocal cues.l°
The results of the recognition study show that the acoustic portrayals of 12 out of 14 emotions (with the exception of shame and disgust) were recognized by judges with a high level of accuracy (compared with the 7% accuracy expected for guessing). The recognition rates provide a bottom-line estimate of the amount of information contained in the acoustic signal for each emotion cat~gory. These data provide a reference value for the automatic classification of emotion on the basis of acous- tic parameters: The extraction and statistical combination o f
these parameters can be optimized until hit rates comparable to human judges are achieved.
Acoustic Analysis
Multiple Regression Analyses
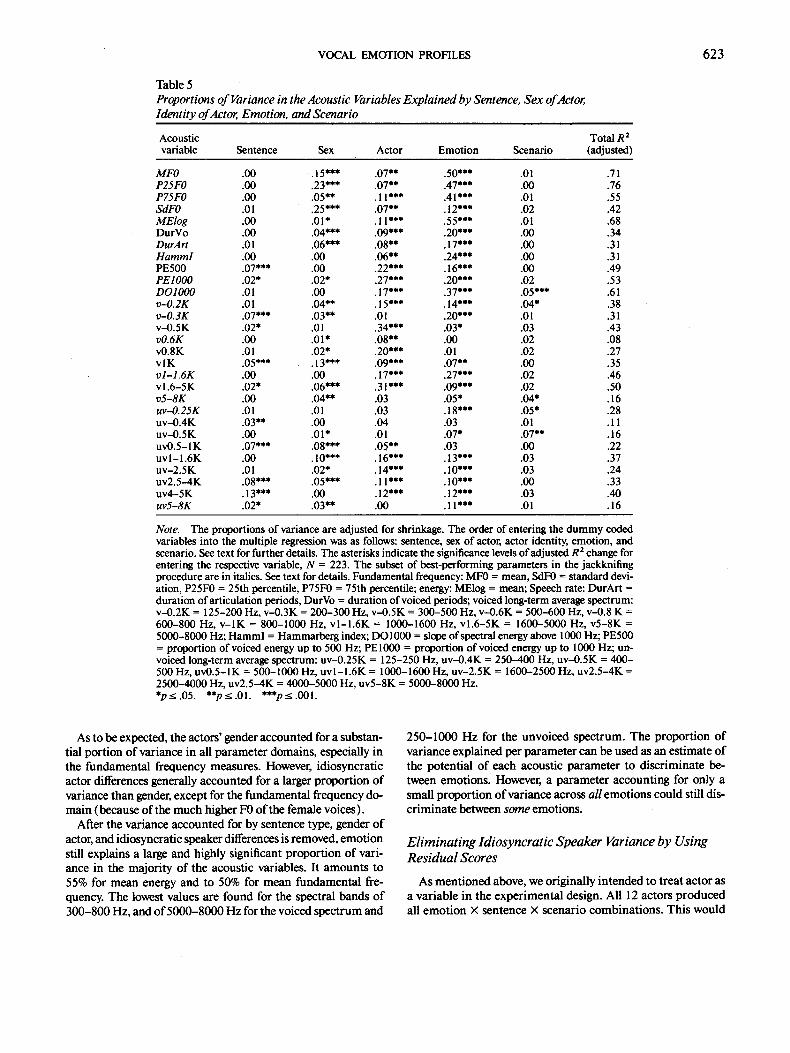
Rather than using standard analysis of variance (ANOVA) techniques to assess the effects of the variables in the design on the dependent acoustic variables, it seemed more appropriate to use multiple regression, which allows the inclusion of potentially confounding variables (such as actor identity) and allows one to report the results in a more condensed format. We calculated a series of hierarchical linear multiple regressions. For every acou s- tic parameter, the dummy coded variables were always entered in the following order: sentence, sex of actor, actor identity, emo- tion, and scenario.l~ Interaction effects were not separately coded and entered into the regressions, given the complexity of the de- sign and the absence of concrete hypotheses. The proportions of variance (adjusted for shrinkage) accounted for by the indepen- dent variables are reported in Table 5.
For all parameters, the proportion of variance accounted for by the sentence variable was small. Some significant effects were found in the spectral domain that may have resulted from the different vowel structure and consonant compositions of the two sentences, leading to differences in the voiced and unvoiced spectrum, respectively. The scenario variable yielded only a few weak effects. Because the alternative scenarios per emotion were different for each emotion, these effects, if indeed meaningful, are difficult to interpret.
~o The ratings of the present portrayals in the visual and the audio- visual conditions (not reported in this article; manuscript in preparation) produced much higher recognition rates of 66% for disgust and 43% for shame in the visual-only condition and of 81% for disgust and 69% for shame in the audio-visual condition.
~ Although actorwas dropped as a variable from the design, this tech- nique allows one to assess the relative contribution of the actor differ- ences on the acoustic variables. The dummy coding of nominal vari- ables require k - 1 dummy variables, that is, I l for actor and 27 for scenario. Because there are different scenarios for every emotion, the set of dummy codes for the scenarios implies the emotion information ( like the actor identity implies the gender of actors). Therefore it is not possible to enter scenario before emotion.
VOCAL EMOTION PROFILES 623
Table 5 Proportions of Variance in the Acoustic Variables Explained by Sentence, Sex of Actor, Identity of Actor, Emotion, and Scenario
Acoustic Total R 2 variable Sentence Sex Actor Emotion Scenario (adjusted)
MFO .00 .15"** .07** .50*** .01 .71 P25FO .00 .23*** .07** .47*** .00 .76 P75FO .00 .05** .11"** .41"** .01 .55 SdFO .01 .25*** .07** .12"** .02 .42 MElog .00 .01" .11"** .55*** .01 .68 DurVo .00 .04*** .09*** .20*** .00 .34 DurA~ .01 .06*** .08** .17"** .00 .31 HammI .00 .00 .06** .24*** .00 .31 PE500 .07*** .00 .22*** .16"** .00 .49 PEIO00 .02* .02* .27*** .20*** .02 .53 DOIO00 .01 .00 .17"** .37*** .05*** .61 v-O.2K .01 .04** .15"** .14"** .04* .38 v-O.3K .07*** .03** .01 .20*** .01 .31 v-0.5K .02* .01 .34*** .03* .03 .43 vO.6K .00 .01" .08** .00 .02 .08 v0.8K .01 .02* .20*** .01 .02 .27 v lK .05*** .13"** .09*** .07** .00 .35 v1-1.6K .00 .00 .17"** .27*** .02 .46 v l .6-5K .02* .06*** .31"** .09*** .02 .50 v5-8K .00 .04** .03 .05* .04* .16 uv-O.25K .01 .01 .03 .18*** .05* .28 uv--0.4K .03** .00 .04 .03 .01 .11 uv-0.5K .00 .01" .01 .07* .07** .16 uv0.5-1K .07*** .08*** .05** .03 .00 .22 u v l - l . 6 K .00 .10"** .16"** .13"** .03 .37 uv-2.5K .01 .02* .14"** .10"** .03 .24 uv2.5-4K .08*** .05*** .11"** .I0"** .00 .33 uv4-5K .13"** .00 .12"** .12"** .03 .40 uv5-8K .02* .03** .00 .11"** .01 .16
Note. The proportions of variance are adjusted for shrinkage. The order of entering the dummy coded variables into the multiple regression was as follows: sentence, sex of actor, actor identity, emotion, and scenario. See text for further details. The asterisks indicate the significance levels of adjusted R 2 change for entering the respective variable, N = 223. The subset of best-performing parameters in the jackknifing procedure are in italics. See text for details. Fundamental frequency: MF0 = mean, SdF0 = standard devi- ation, P25F0 = 25th percentile, P75F0 = 75th percentile; energy: MElog = mean; Speech rate: DurArt = duration of articulation periods, DurVo = duration of voiced periods; voiced long-term average spectrum: v-0.2K = 125-200 Hz, v-0.3K = 200-300 Hz, v-0.5K = 300-500 Hz, v-0.6K = 500-600 Hz, v-0.8 K = 600-800 Hz, v - l K = 800-1000 Hz, v l - l . 6 K = 1000-1600 Hz, v l .6-5K = 1600-5000 Hz, v5-8K = 5000-8000 Hz; HammI = Hammarberg index; DO1000 = slope of spectral energy above 1000 Hz; PE500 = proportion of voiced energy up to 500 Hz; PE1000 = proportion of voiced energy up to 1000 Hz; un- voiced long-term average spectrum: uv-0.25K = 125-250 Hz, uv-0.4K = 250-400 Hz, uv-0.5K = 400- 500 Hz, uv0.5-1K = 500-1000 Hz, u v l - l . 6 K = 1000-1600 Hz, uv-2.5K = 1600-2500 Hz, uv2.5-4K = 2500-4000 Hz, uv2.5-4K = 4000-5000 Hz, uv5-8K = 5000-8000 Hz. *p<.05. **p<.01. ***p<.001.
As to be expected, the actors ' gender accoun ted for a substan- tial por t ion o f var iance in all pa r ame te r domains , especially in the fundamen ta l f requency measures . However, id iosyncrat ic actor differences generally accoun ted for a larger p ropor t ion of var iance t han gender, except for the f undam en t a l f requency do- m a i n (because o f the m u c h higher F0 o f the female voices) .
After the var iance accounted for by sentence type, gender o f actor, and idiosyncrat ic speaker differences is removed, emo t ion still explains a large and highly significant p ropor t ion o f vari- ance in the major i ty o f the acoustic variables. It a m o u n t s to 55% for m e a n energy and to 50% for m e a n fundamen ta l fre- quency. The lowest values are found for the spectral bands o f 300-800 Hz, and o f 5 0 0 0 - 8 0 0 0 Hz for the voiced spec t rum and
2 5 0 - 1 0 0 0 Hz for the unvo iced spec t rum. The propor t ion o f var iance expla ined per pa r ame te r can be used as an es t imate o f the potent ia l o f each acoustic pa r ame te r to d i sc r imina te be- tween emotions . However, a pa r ame te r account ing for only a small p ropor t ion o f var iance across all emot ions could still dis- c r imina te between some emot ions .
Eliminating Idiosyncratic Speaker Variance by Using Residual Scores
As m e n t i o n e d above, we or iginal ly i n t ended to t r ea t ac tor as a var iab le in the expe r imen t a l design. All 12 actors p r o d u c e d all e m o t i o n × sentence × scenar io combina t ions . Th i s would
624 BANSE AND SCHERER
have permitted a systematic analysis of the effect of actors' id- iosyncratic voice characteristics on the acoustic parameters of the emotional portrayals. However, because not all of the re- corded portrayals met the quality criteria, we had to reduce the overall design by eliminating actor as a separate factor. In the remaining sample of 224 portrayals, actors were unsystem- atically represented over emotion categories (see Table 3), thus possibly confounding emotion effects on the acoustic variables. To control for this potential problem, the dummy- coded actor identities were regressed on all acoustic parame- ters, and all subsequent analyses were based on the z- transformed residuals of the acoustical parameters. These re- siduals are independent of main effects of actor identity .and actor gender (because gender is part of the actor identity vari- ation, variance due to gender is automatically eliminated along with individual differences). ~ 2
This procedure can be consider~l conservative with regard to differences between emotions. Because all actor variance is eliminated from the acoustic variables, this is also the case for any emotion specific characteristic that happens to coincide with the specific voice quality and individual speech style of an actor. It is likely that the selection procedure described above favors the selection of portrayals for which an actor's natural vocal setting corresponds to the vocal characteristics of the emotion (e.g., an actor whose voice has a tendency to sound sad is more likely to produce recognizable acoustic portrayals of sadness). Therefore, the residuals of the acoustic variables may be overcorrected, and some genuine emotion specific variance in acoustic measures may be eliminated.
The means and standard deviations for standardized residu- als of all acoustic parameters are reported in Table 6. The rela- tive deviations from the means across emotions and acoustic parameters can be compared with results of other studies.
Most standard deviations are clearly smaller than 1, thus in- dicating that the actors used only a restricted range of a given acoustic parameter to portray a specific emotion. Read col- umnwise, the standard deviations indicate how narrowly the acoustic profiles of single utterances scatter around the mean profiles of each emotion. Interestingly, there is no strong posi- tive relation between the extremity of means and large standard deviations. For example, although hot anger is characterized by more extreme means than cold anger for most acoustic param- eters, there is no clear difference in the size of the standard de- viations. This finding may indicate a more prototypical encod- ing of hot anger, which in turn may have greatly facilitated the correct recognition of this emotion.
Correlations Between Acoustic Parameters
The intercorrelations between the major groups of acoustic parameters are presented in Table 7. For greater clarity, inter- correlations between parameters from the voiced and unvoiced spectra are shown separately. Only a few correlations with val- ues higher than r = .50 emerge. These elevated correlation co- efficients can be explained by two different reasons. First, for some constructs different measures were used. For example, speech rate was operationalized by both duration of articulation (DurArt) and duration of voiced segments (DurVo), which
correlate r = .87. High correlations were also found for different measures Of central tendency, such as the mean and the first and third quartiles of fundamental frequency (MF0, P25F0, and P75F0, respectively), which correlate around .8-.9. In a similar vein, the proportion of spectral energy up to 1000 Hz (PEI000) shows a strong negative relation to the amount of energy found in the two spectral bands ranging from 1000 Hz to 5000 Hz ( v l - l . 6 K, v l .6-5 K; r = - . 85 and r = - .86 , respectively).
Second, high correlations between acoustic parameters mea- suring different constructs are likely to be caused by systemic links in the speech production process. For example, mean fun- damental frequency is relatively highly correlated with mean energy (r = .62) because increases in subglottal pressure and tension of the vocal musculature (as produced by sympathetic arousal, for example) will drive up both energy and fundamen- tal frequency of the speech signal. For the great majority of pa- rameters, low to moderate correlation coefficients show that the extracted acoustical parameters cover different aspects of the acoustic signal.
Test o f Predicted Vocal Character&tics o f Specific Emotions
For 12 out of the 14 emotions studied, Scherer (1986) pre- dicted increases or decreases (of different magnitude, weak or strong) of acoustic parameters with respect to an emotionally neutral utterance (see Table 2 ). For the purpose of testing these predictions, we quantified them in the following manner: strong increase and strong decrease were defined as 1 SD and weak increase or weak decrease as 0.5 SD, with the appropriate sign. In the present study, no neutral category was included, because previous results (Scherer et al., 1991 ) have shown that actors have difficulties producing emotionally neutral utterances in a convincing manner. Therefore, increase and decrease are re- ferred to with respect to the overall mean across all emotions studied for each acoustic parameter. The predictions, together with the results of the acoustical analysis, discussed below, are presented graphically in Figures 1-4. For each prediction the difference between the observed mean and the theoretically pre- dicted value for the respective acoustical variable was tested by means of a t test with N = 16 portrayals per emotion. If a sig- nificant t value indicated a difference between prediction and observation, the respective emotion category is marked with an asterisk in the figures. Given the tentative nature of this type of significance testing (with respect to the quantification of the predictions and the operationalization of the "neutral" refer- ence poin t - - the mean across all emotions), only confirmations (no significant t) and massive departures from prediction (significant t and more than 0.5 SD difference) are discussed.
Fundamental frequency. The most frequently studied (and perceptually most prominent) parameter of the voice is funda- mental frequency (MF0) . Figure 1 shows the means for the 14 emotions in ascending order. Mean F0 is highest for the "in-
12 One actor was represented with only one portrayal of anxiety, thus producing z residuals of 0 for all acoustic parameters. This portrayal was removed from further analysis.
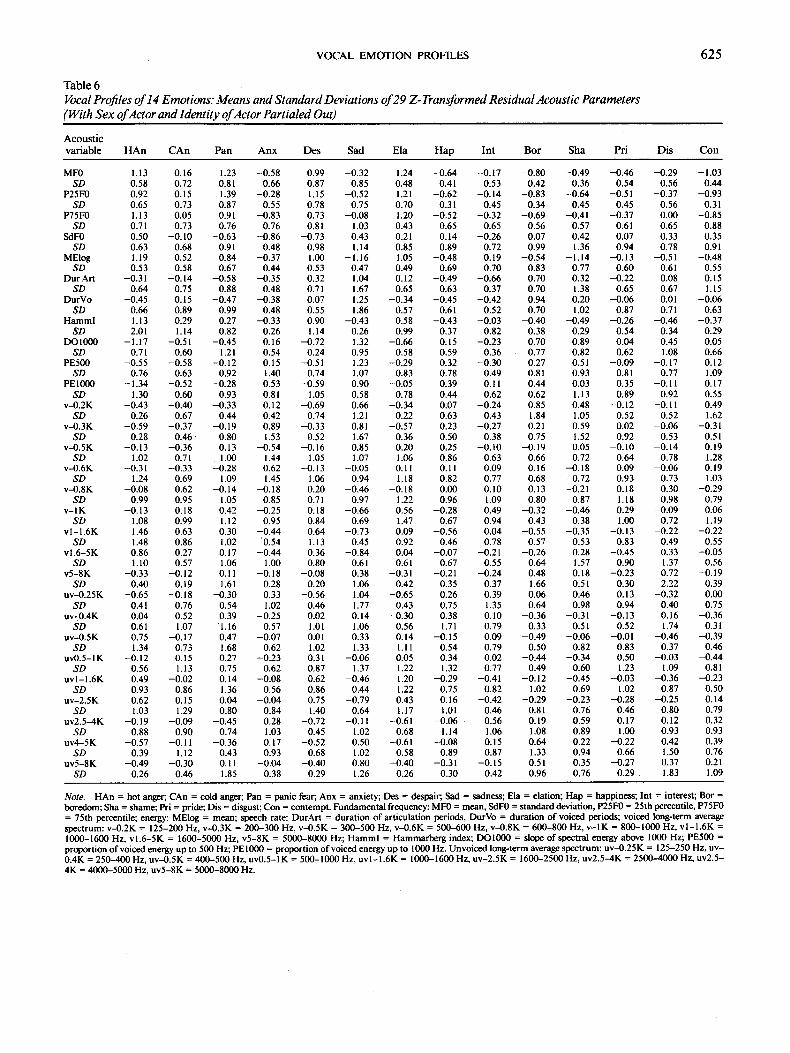
V O C A L E M O T I O N P R O F I L E S 625
T a b l e 6 Vocal Profiles o f 14 Emot ions: M e a n s and S tandard Deviat ions o f 29 Z- Transformed Res idua l Acoustic Parameters (Wi th S e x o f Actor and Ident i ty o f Actor Part ia led Out)
Acoust ic var iable H A n C A n Pan A n x Des Sad Ela H a p In t Bor Sha Pri Dis Con
MF0 1.13 0.16 1.23 -0 .58 0.99 -0 .32 1.24 -0 .64 -0 .17 -0 .80 -0 .49 -0 .46 -0 .29 -1 .03 SD 0.58 0.72 0.81 0.66 0.87 0.85 0.48 0.41 0.53 0.42 0.36 0.54 0.56 0.44
P25F0 0.92 0.15 1.39 -0 .28 1.15 -0 .52 1 .21 -0 .62 -0 .14 -0 .83 -0 .64 -0.51 -0 .37 -0 .93 SD 0.65 0.73 0.87 0.55 0.78 0.75 0.70 0.31 0.45 0.34 0.45 0.45 0.56 0.31
P75F0 1.13 0.05 0.91 -0 .83 0~73 -0.08 1.20 -0 .52 -0.32 -0 .69 -0.41 -0 .37 0.00 -0.85 SD 0.71 0.73 0.76 0.76 0.81 1.03 0.43 0.65 0.65 0.56 0.57 0.61 0.65 0.88
SdF0 0.50 -0 .10 -0.63 -0 .86 -0.73 0.43 0.21 0.14 -0 .26 0.07 0.42 0.07 0.33 0.35 SD 0.63 0.68 0.91 0.48 0.98 1.14 0.85 0.89 0.72 0.99 1.36 0.94 0.78 0.91
MElog 1.19 0.52 0.84 -0 .37 1.00 -1 .16 1.05 -0.48 0.19 -0 .54 -1 .14 -0.13 -0.51 -0.48 SD 0.53 0.58 0.67 0.44 0.53 0.47 0.49 0.69 0.70 0.83 0.77 0.60 0.61 0.55
Dur Art -0.31 -0 .14 -0 .58 -0.35 0.32 1.04 0.12 -0 .49 -0 .66 0.70 0.32 -0 .22 0.08 0.15 SD 0.64 0.75 0.88 0.48 0.7t 1.67 0.65 0.63 0.37 0.70 1.38 0.65 0.67 1.15
DurVo -0.45 0.15 -0 .47 -0.38 0.07 1.25 -0 .34 -0.45 -0 .42 0.94 0.20 -0 .06 0.01 -0 .06 SD 0.66 0.89 0.99 0.48 0.55 1.86 0.57 0.61 0.52 0.70 1.02 0.87 0.71 0.63
Hamml 1.13 0.29 0.27 -0.33 0.90 -0 .43 0.58 -0.43 -0 .03 -0 .40 -0 .49 -0 .26 -0 .46 -0 .37 SD 2.01 1.14 0.82 0.26 1.14 0.26 0.99 0.37 0.82 0.38 0.29 0.54 0.34 0.29
DOI000 -1.17 -0.51 -0.45 0.16 -0 .72 1.32 -0 .66 0.15 -0 .23 0.70 0.89 0.04 0.45 0.05 SD 0.71 0.60 1.21 0.54 0.24 0.95 0.58 0.59 0.36 0.77 0.82 0.62 1.08 0.66
PE500 -0.55 -0 .58 -0 .12 0.15 -0.51 1.23 -0 .29 0.32 -0 .30 0.27 0.51 -0 .09 -0.17 0.12 SD 0.76 0.63 0.92 1.40 0.74 1.07 0.83 0.78 0.49 0.81 0.93 0.81 0.77 1.09
PEI000 -1.34 -0 .52 -0 .28 0.53 -0 .59 0.90 -0 .05 0.39 0.11 0.44 0.03 0.35 -0.11 0.17 SD 1.30 0.60 0.93 0.81 1.05 0.58 0.78 0.44 0.62 0.62 1.13 0.89 0.92 0.55
v-0.2K -0.43 -0 .40 -0 .33 0.12 -0 .69 0.66 -0 .34 0.07 -0 .24 0 .85 0.48 -0 .12 -0.11 0.49 SD 0.26 0.67 0.44 0.42 0.74 1.21 0.22 0.63 0.43 1.84 1.05 0.52 0.52 1.62
v-0.3K -0.59 -0 .37 -0.19 0.89 -0 .33 0.81 -0.57 0.23 -0 .27 0.21 0.59 0.02 -0 .06 -0.31 SD 0.28 0.46 0.80 1.53 0.52 1.67 0.36 0.50 0.38 0.75 1.52 0.92 0.53 0.51
v-0.SK -0.13 -0 .36 0.13 -0 .54 -0 .16 0.85 0.20 0,25 -0 .10 -0 .19 0.05 -0 .10 -0 .14 0.19 SD 1.02 0.71 1.00 1.44 1.05 1.07 1.06 0.86 0.63 0.66 0.72 0.64 0.78 1.28
v-0.6K -0.31 -0 .33 -0.28 0.62 -0 .13 -0.05 0.11 0.11 0.09 0.16 -0 .18 0.09 -0 .06 0.19 SD 1.24 0.69 1.09 1.45 1.06 0.94 1.18 0.82 0.77 0.68 0.72 0.93 0.73 1.03
v-0.8K -0.08 0.62 -0 .14 -0 .18 0.20 -0 .46 -0.18 0.00 0.10 0.13 -0.21 0.18 0.30 -0 .29 SD 0.99 0.95 1.05 0.85 0.71 0.97 1.22 0.96 1.09 0.80 0.87 1.18 0.98 0.79
v - 1K -0.13 0.18 0.42 -0 .25 0.18 -0 .66 0.56 -0 .28 0.49 -0 .32 -0 .46 0.29 -0 .09 0.06 SD 1.08 0.99 1.12 0.95 0.84 0.69 1.47 0.67 0.94 0.43 0.38 1.00 0.72 1.19
v l - l . 6 K 1.46 0.63 0.30 -0 .44 0.64 -0 .73 0.09 -0 .56 0.04 -0.55 -0.35 -0 .13 -0.22 -0 .22 SD 1.48 0.86 1.02 '0.54 1.13 0.45 0.92 0.46 0.78 0.57 0.53 0.83 0.49 0.55
v l .6 -5K 0.86 0.27 0.17 -0 .44 0.36 -0 .84 0.04 -0.07 -0.21 -0 ,26 0.28 -0.45 0.33 -0.05 SD 1.10 0.57 1.06 1.00 0.80 0.61 0.61 0.67 0.55 0.64 1.57 0.90 1.37 0.56
v5-8K -0.33 -0 .12 0.11 -0 .18 -0.08 0.38 -0.31 -0.21 -0 .24 0.48 0.18 -0 .23 0.72 -0 .19 SD 0.40 0.19 1.61 0.28 0.20 1.06 0.42 0.35 0.37 1.66 0.51 0.30 2.22 0.39
uv-0.25K -0.65 -0 .18 -0 .30 0.33 -0 .56 1.04 -0 .65 0.26 0.39 0.06 0.46 0.13 -0 .32 0.00 SD 0.41 0.76 0.54 1.02 0.46 1.77 0.43 0.75 1.35 0.64 0.98 0.94 0.40 0.75
uv-0.4K 0.04 0.52 0.39 -0.25 -0 .02 -0 .14 -0 .30 0.38 0.10 -0 .36 -0.31 -0 .13 0.16 -0 .36 SD 0.61 1.07 1.16 0.57 1.01 1.06 0.56 1.71 0.79 0.33 0.51 0.52 1.74 0.31
uv--0.5K 0.75 -0 .17 0.47 -0.07 0.01 0.33 0.14 -0 .15 0.09 -0 .49 -0 .06 -0.01 -0 .46 -0 .39 SD 1.34 0.73 1.68 0.62 1.02 1.33 1.11 0.54 0.79 0.50 0.82 0.83 0.37 0.46
uvO.5-1K -0.12 0.15 0.27 -0 .23 0.31 -0 .06 0.05 0.34 0.02 -0 .44 -0 .34 0.50 -0 .03 -0 .44 SD 0.56 1.13 0.75 0.62 0.87 1.37 1.22 1.32 0.77 0.49 0.60 1.23 1.09 0.81
u v l - l . 6 K 0.49 -0 .02 0.14 -0 .08 0.62 -0 .46 1.20 -0 .29 -0.41 -0 .12 -0.45 -0 .03 -0 .36 -0 .23 SD 0.93 0.86 1.36 0.56 0.86 0.44 1.22 0.75 0.82 1.02 0.69 1.02 0.87 0.50
uv-2.5K 0.62 0.15 0.04 -0 .04 0.75 -0 .79 0.43 0.16 -0 .42 -0 .29 -0 .23 -0 .28 -0.25 0.14 SD 1.03 1.29 0.80 0.84 1.40 0.64 1.17 1.01 0.46 0.81 0.76 0.46 0.80 0.79
uv2.5--4K -0.19 -0 .09 -0.45 0.28 -0 .72 -0.11 -0.61 -0 .06 0.56 0.19 0.59 0.17 0.12 0.32 SD 0.88 0.90 0.74 1.03 0.45 1.02 0.68 1.14 1.06 1.08 0.89 1.00 0.93 0.93
uv4-5K -0.57 -0.11 -0 .36 0.17 -0 .52 0.50 -0.61 -0 .08 0.15 0.64 0.22 -0 .22 0.42 0.39 SD 0.39 1.12 0.43 0.93 0.68 1.02 0.58 0.89 0.87 1.33 0.94 0.66 1.50 0.76
uv5-8K -0.49 -0 .30 0.11 -0 .04 -0 .40 0.80 -0 .40 -0.31 -0 .15 0.51 0.35 -0 .27 0.37 0.21 SD 0.26 0.46 1.85 0.38 0.29 1.26 0.26 0.30 0.42 0.96 0.76 0.29 1.83 1.09
Note. HAn = hot anger; CAn = cold anger; Pan = panic fear; Anx = anxiety; Des = despair; Sad = sadness; Ela = elation; Hap = happiness; Int = interest; Bor = boredom; Sha = shame; Pri = pride; Dis = disgust; Con = contempt. Fundamental frequency: MF0 = mean, SdF0 = standard deviation, P25F0 = 25th percentile, P75F0 = 75th percentile; energy: MElog = mean; speech rate: DurArt = duration of articulation periods, DurVo = duration of voiced periods; voiced long-term average spectrum: v-0.2K = 125-200 Hz, v-0.3K = 200-300 Hz, v-0.5K = 300-500 Hz, v-0.6K = 500-600 Hz, v-0.SK = 600-800 Hz, v - l K = 800-1000 Hz, v l - l . 6 K = 1000-1600 Hz, v l .6 -5K = 1600-5000 Hz, v5-8K = 5000-8000 Hz; Hamml = Hammarberg index; DOI000 = slope of spectral energy above 1000 Hz; PE500 = proportion of voiced energy up to 500 Hz; PE 1000 = proportion of voiced energy up to 1000 Hz. Unvoiced long-term average spectrum: uv-0.25K = 125-250 Hz, uv- 0.4K = 250--400 Hz, uv-0.5K = 400-500 Hz, uv0.5-1K = 500-1000 Hz, u v l - l . 6 K = 1000-1600 Hz, uv-2.5K = 1600-2500 Hz, uv2.5-4K = 2500-4000 Hz, uv2.5- 4K = 4000-5000 Hz, uv5-8K = 5000-8000 Hz.
626 BANSE AND SCHERER
Table 7 Intercorrelations of Acoustic Parameters (z-Residuals, With Sex of Actor and Identity of Actor Partialed Out)
A MF0 P25F0 P75F0 SdF0 MEiog DurArt DurVo Hamml DO1000 PE500 PE1000
MF0 P25F0 0.93 - - P75F0 0.92 0.76 SdF0 0.00 -0.29 0.25 MElog 0.62 0.71 0.46 -0.29 DurArt -0.02 -0.14 0.08 0.30 -0.28 DurVo -0.07 -0.18 0.04 0.24 -0.33 0.87 HammI 0.34 0.36 0.26 -0.11 0.60 -0.04 -0 . ! 1 DOI000 -0.42 -0.49 -:0.31 0.21 -0.79 0.35 0.42 -0.34 PE500 -0,15 -0.20 -0.09 0,11 -0.46 0.25 0.26 -0 .21 0,58 PEI000 -0.42 -0.35 -0.42 -0,11 -0.37 0.10 0.13 -0.16 0.53 0.51 v-0.2K -0.31 -0.35 -0.23 0.13 -0.49 0.35 0.32 -0.23 0.52 0.55 v--0.3K -0.21 -0.17 -0,21 -0.19 -0.35 0.13 0.17 -0.22 0.42 0.61 v--0.5K 0.09 0.02 0,15 0.26 -0.16 0. t0 0.10 -0.03 0.27 0.71 v-0.6K -0.31 -0.23 -0.34 -0.16 -0.01 -0.10 -0 . I 1 0.06 0.02 -0.27 v--0.8K -0.05 -0.01 -0.09 -0.12 0.17 -0.06 -0.06 0.15 --0.14 -0.46 v - l K 0,23 0.25 0.19 -0.02 0.24 -0.16 -0.12 -0.04 -0.32 -0.39 v l - l . 6K 0.42 0.39 0.39 -0.01 0.52 -0.16 -0.20 0.20 -0.61 -0.47 v1.6-5K 0.29 0.21 0.32 0.20 O. 15 -0.02 -0.05 0.08 -0.36 -0.43 v5-8K 0,03 -0.05 0.06 0.12 -0.30 0.19 0.26 -0.11 0.60 0.22 uv--0.25K -0,30 -0.28 -0.29 -0.05 -0.34 0.32 0.38 -0.14 0.39 0.35 uv-0.4K 0,20 0,20 0.13 -0.18 0.16 -0.02 0.03 0.04 -0.10 "0.01 uv-0.5K 0.27 0.27 0.20 -0.06 0.25 -0.04 -0.04 0.18 -0.16 -0.01 uv0.5-1K 0.13 0.17 0.07 -0.23 0.21 -0.19 -0.12 0.13 -0.16 -0.06 uvl - l .6K 0.32 0.30 0.30 0.12 0.31 -0.01 -0.08 0.21 -0.24 -0.09 uv-2.5K 0.21 0.24 0.t7 -0.07 0.34 -0.09 -0.19 0.31 -0.35 -0.15 uv2.5-4K -0.31 -0.34 -0.25 0.10 -0.32 -0.03 -0.06 -0.24 0.08 0.03 uv4-5K -0.34 -0.37 -0.23 0.17 -0.37 0.18 0.25 -0.31 0.23 -0.05 uv5-8K -0.18 -0.17 -0.18 0.03 -0.35 0.18 0.21 -0.19 0.62 0.30
B v-0.2K v-0.3K v-0.5K v-0.6K v-0.8K v - l K v l - l . 6K vl .6-5K
v-0.2K v-0.3K 0.25 - - v-0.5 K 0.13 -0.02 v--0.6K -0.11 -0.05 -0.31 v-0.SK -0.24 -0.28 -0.33 v- t K -0.27 -0.36 -0.16 v 1-1.6K -0.29 -0.32 -0.29 v1.6-5K -0.23 -0.28 -0.30 v5-8K 0.12 0.14 0.15
C uv-25K uv-0.4K uv-0.5K
uv--0.25K uv-0.4K 0.28 - - uv-0.5K 0.24 0.21 - - uv0.5-1K 0.01 0.04 0.14 uv 1 - 1.6K -0.29 -0,23 -0.12 uv-2.5K -0.22 -0.10 0.01 uv2.5-4K 0.03 -0.03 -0.12 uv4-5K -0.02 -0.18 -0.21 uv5-SK 0.12 -0.13 -0.19
-0.06 -0,33 -0.10 -0.25 -0.05 0.23 - - -0.29 -0.07 0.21 0~46 -0,16 -0.10 -0.08 -0.20
m
0.06
uv0.5-1K uv-l .6K uv-2.5K v2.5-4K uv4-5K
0.06 0.01 0.09
-0.49 -0.48 -0.31 - - -0.47 -0.40 -0.38 0.32 -0.29 -0.18 -0.31 -0.09 0.26
0.30 0.34 0.34 0.33 0.08
-0.25 -0.85 -0.86
0.0l 0.31
-0.07 -0.11
0.04 -0.09 -0.22
0.06 0.02 0.23
v5-8K
m
uv5-8K
Note. N = 223. Matrix A: correlations between all variables except intercorrelations of spectral bands; Matrix B: intercorrelations ofvoiced spectral bands; Matrix C: intercorrelations of unvoiced spectral bands. Fundamental frequency: MFO = mean, SdF0 = standard deviation, P25F0 = 25th percentile, P75F0 = 75th percentile; energy: MElog = mean; speech rate: DurArt = duration of articulation periods, DurVo = duration of voiced periods; voiced long-term average spectrum: v-0.2K = 125-200 Hz, v-0.3K = 200-300 Hz, v-0.5K = 300-500 Hz, v-0.6K = 500-600 Hz, v-0.8K = 600-800 Hz, v - l K = 800-1000 Hz, v l - l . 6K = 1000-1600 Hz, vl .6-5K = 1600-5000 ~ v5-8K = 5000-8000 Hz; HammI = Hammarberg
index; 1301000 = slope of spectral energy above 1000 Hz; PE500 = proportion of voiced energy up to 500 Hz; PEI000 = proportion of voiced energy up to 1000 Hz; unvoiced long-term average spectrum: uv-0.25K = 125-250 Hz, uv-0.4K = 250-400 Hz, uv-0.5K = 400-500 Hz, uv0.5- 1K = 500-1000 Hz, uv l - l . 6K = 1000-1600 Hz, uv-2.5K = 1600-2500 Hz, uv2.5-4K = 2500-4000 Hz, uv2.5-4K = 4000-5000 Hz, uv5-8K = 5000-8000 Hz.
2 . 5 -
2.0-
1.5- m u 88
= 1.0- I=1
m
• = 0 5 -
1D • O.O- E
o - o 5 - W ¢-
P -1.0 - , h , |
N
-1.5
-2.0
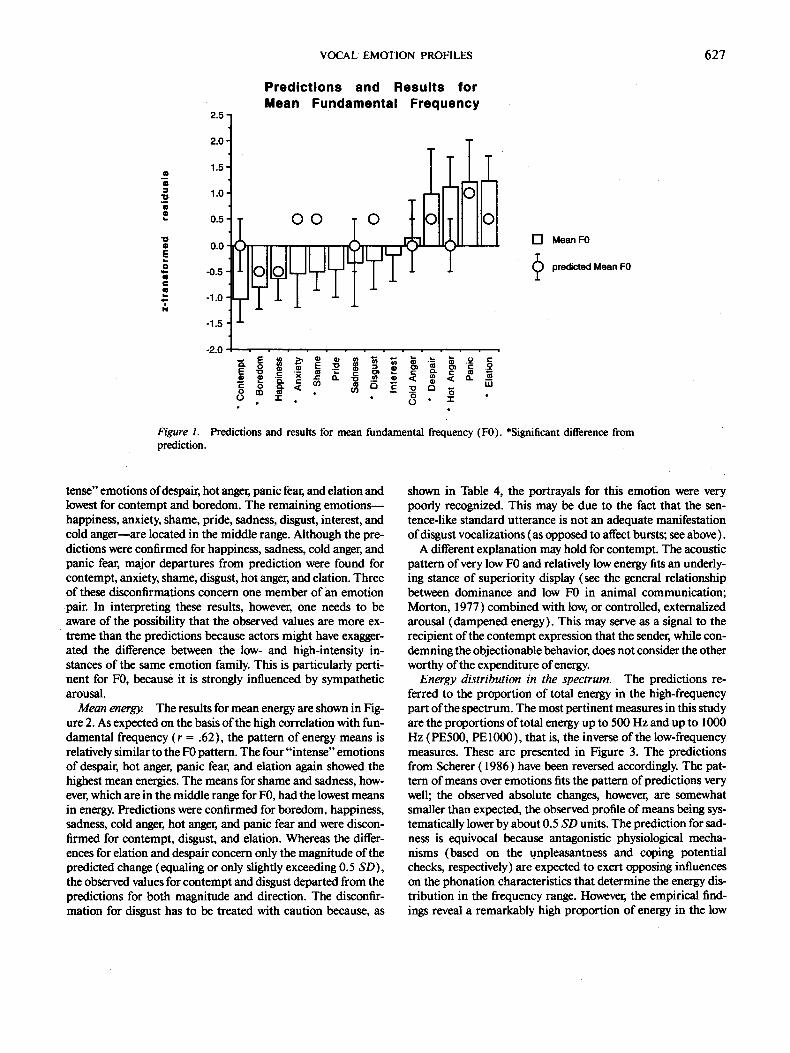
Figure 1. prediction.
VOCAL EMOTION PROFILES
P r e d i c t i o n s a n d R e s u l t s fo r M e a n F u n d a m e n t a l F r e q u e n c y
i o o ¸ [ ] Mean FO
(~ Mean FO predicted
o T = . " • 8 . ~ •
Predictions and results for mean fundamental frequency (FO). *Significant difference from
627
tense" emotions of despair, hot anger, panic fear, and elation and lowest for contempt and boredom. The remaining emotions-- happiness, anxiety, shame, pride, sadness, disgust, interest, and cold anger--are located in the middle range. Although the pre- dictions were confirmed for happiness, sadness, cold anger, and panic fear, major departures from prediction were found for contempt, anxiety, shame, disgust, hot anger, and elation. Three of these disconfirmations concern one member of an emotion pair. In interpreting these results, however, one needs to be aware of the possibility that the observed values are more ex- treme than the predictions because actors might have exagger- ated the difference between the low- and high-intensity in- stances of the same emotion family. This is particularly perti- nent for F0, because it is strongly influenced by sympathetic arousal.
Mean energy. The results for mean energy are shown in Fig- ure 2. As expected on the basis of the high correlation with fun- damental frequency (r = ,62), the pattern of energy means is relatively similar to the F0 pattern. The four"intense" emotions of despair, hot anger, panic fear, and elation again showed the highest mean energies. The means for shame and sadness, how- ever, which are in the middle range for F0, had the lowest means in energy. Predictions were confirmed for boredom, happiness, sadness, cold anger, hot anger, and panic fear and were discon- firmed for contempt, disgust, and elation• Whereas the differ- ences for elation and despair concern only the magnitude of the predicted change (equaling or only slightly exceeding 0.5 SD), the observed values for contempt and disgust departed from the predictions for both magnitude and direction. The disconfir- mation for disgust has to be treated with caution because, as
shown in Table 4, the portrayals for this emotion were very poorly recognized. This may be due to the fact that the sen- tence-like standard utterance is not an adequate manifestation of disgust vocalizations (as opposed to affect bursts; see above ).
A different explanation may hold for contempt. The acoustic pattern of very low F0 and relatively low energy fits an underly- ing stance of superiority display (see the general relationship between dominance and low F0 in animal communication; Morton, 1977) combined with low, or controlled, externalized arousal (dampened energy). This may serve as a signal to the recipient of the contempt expression that the sender, while con- demning the objectionable behavior, does not consider the other worthy of the expenditure of energy.
Energy distribution in the spectrum. The predictions re- ferred to the proportion of total energy in the high-frequency part of the spectrum. The most pertinent measures in this study are the proportions of total energy up to 500 Hz and up to 1000 Hz (PE500, PEI000), that is, the inverse of the low-frequency measures. These are presented in Figure 3. The predictions from Scherer (1986) have been reversed accordingly. The pat- tern of means over emotions fits the pattern of predictions very well; the observed absolute changes, however, are somewhat smaller than expected, the observed profile of means being sys- tematically lower by about 0.5 SD units. The prediction for sad- hess is equivocal because antagonistic physiological mecha- nisms (based on the unpleasantness and coping potential checks, respectively) are expected to exert opposing influences on the phonation characteristics that determine the energy dis- tribution in the frequency range. However, the empirical find- ings reveal a remarkably high proportion of energy in the low
628 BANSE AND SCHERER
frequencies, as compared with the mean of all other emotions. It seems, then, that the appraisal of having little control over the situation (low coping potential), resulting in a lax voice with more low-frequency energy, is a more powerful determinant of the overall physiological-acoustic changes than the unpleasant- ness appraisal (narrow voice, i.e., more high-frequency energy).
Speech rate. Because the utterances in this study were stan- dard sentences, the duration of articulation and duration of voiced segments can be used as (inverse) measures of speech rate or tempo. Both measures were highly intercorrelated ( r = .87) and showed similar patterns of mean values. As predicted, sadness was characterized by a particularly low speech rate. For the intense instances of the four emotion families, we had pre- dicted an increase in speech rate. This was confirmed for hot anger and panic fear, and partially for elation, not, however, for despair, for which a slight decrease was observed. Surprisingly, instead of the predicted decrease in speech rate for happiness, a relatively strong increase was found. One possible explanation is that the actors encoded this emotion in a more active way than the quiet, relaxed form of happiness that formed the basis of the predictions.
Relation Between Judges' Emotion Inference and Acoustic Parameters
We investigated the relation of judges' emotion inferences (as shown in the use of the different emotion categories) and the acoustic parameters by means of multiple regression analysis. For each emotion portrayal, 14 recognition scores were calcu- lated as the number of judges who chose each emotion category. For example, if all 12 judges identified a certain emotion por- trayal as hot anger, the hot anger score for this portrayal was 12. I f a portrayal was never identified as sadness, the sadness score of this portrayal was 0. These scores were then regressed onto a set of acoustic parameters across all portrayals. The number of predictors was minimized. If several conceptually similar pa- rameters were available (e.g., Mean F0, the first and the third quartile of F0), only the acoustical parameter that accounted for the largest proportion of emotion variance (as indicated in Table 5) was selected as a predictor.
In a first step, to keep the set of predictors small, only the following parameters were forced into the regression: mean F0, standard deviation of F0, mean energy, duration of voiced peri- ods, Hammarberg index, proportion of energy up to 1000 Hz, and spectral drop-off. For these parameters, the standardized beta weights and the multiple correlation coefficients are shown in Table 8. The strongest multiple correlation between acousti- cal parameters and category use was that for hot anger (R = .63). For the majority of the remaining emotion categories moderate multiple correlations ranging from R = .27 (happiness) to R = .49 (sadness) were found. For only three emotion categories did the correlations not reach statistical sig- nificance: cold anger (R = . 16 ), interest ( R = . 18 ), and disgust (R = . 17). In a second step, the 18 spectral band parameters were entered stepwise into the regression. If one or several spec- tral bands increased the multiple correlation significantly, the resulting multiple R is reported in Table 8. For only one emo-
t ion--interest---did the addition of spectral band parameters produce a sizable increase in the multiple correlation (from R = .18, ns, to R = .30,p < .05).
The multiple correlation coefficients show that for most emo- tions there was a significant relation between specific acoustic parameter configurations and the frequency that a specific emo- tion category was used by judges. This finding indicates that there is at least some overlap between the extracted acoustic pa- rameters and the acoustic cues used by judges.
Statistical Models of Emotion Recognition
To test to what extent the acoustical parameters analyzed in this study allow correct emotion classification, we contrasted statistical classification with human emotion recognition. We used two different statistical classification procedures: jack- knifing and discriminant analysis.
Jackknifing. To test whether a simple comparison of each utterance's unweighted profile formed by all 29 acoustic pa- rameters with the mean profiles of each of the 14 emotions would allow a satisfactory classification of the utterances, we performed a jackknifing procedure. For each portrayal, the sum of the squared differences between the 29 individual acoustical parameter values and the mean profiles of the 14 emotions were calculated (for each comparison, mean profiles were always cal- culated without using the portrayal to classify). Each stimulus was then classified into the emotion category for which the sum of squared differences was minimal. Exploration of the classi- fication performance for different subsets of parameters showed that the number of correct classifications was not a direct func- tion of the number of parameters used. Some parameters seemed to add more noise than information, some improved the classification for one emotion and diminished it for others. Given the fact that there are 229 - 1 different subsets of 29 pa- rameters, a systematic test of all possible combinations was not feasible. Instead, a simple genetic algorithm was implemented to find a subset of parameters with optimal classification results. In this method, 5 parameters out of 29 are selected randomly, and their classification performance in the jackknifing proce- dure is tested. In the next step, the selection is modified ran- domly by choosing or excluding 5 out of the 29 parameters and tested again. If the performance is improved by the modifica- tion, the new combination is retained and becomes the basis for new random changes. The number of modifications is gradually reduced to allow for the identification of a local maximum. Af- ter 150 loops only 3 parameters are modified, after 300 loops 2, after 400 loops 1 is modified. After 500 loops the process is stopped. The results of the runs were rank-ordered by goodness of fit. After about 100 runs of this algorithm the performance tended to converge with respect to both hit rate and selected parameters. The best solution produced an overall hit rate of 40%. The best-performing subset of 16 of the total set of 29 acoustic parameters is indicated in Table 5 (set in italics). In- spection of this table shows that, with one exception (v-0 .6K) , the genetic algorithm selected parameters for which the emo- tion variable explained high proportions of variance in the multiple regression analysis.
Discriminant analysis. A more frequently used classifica-
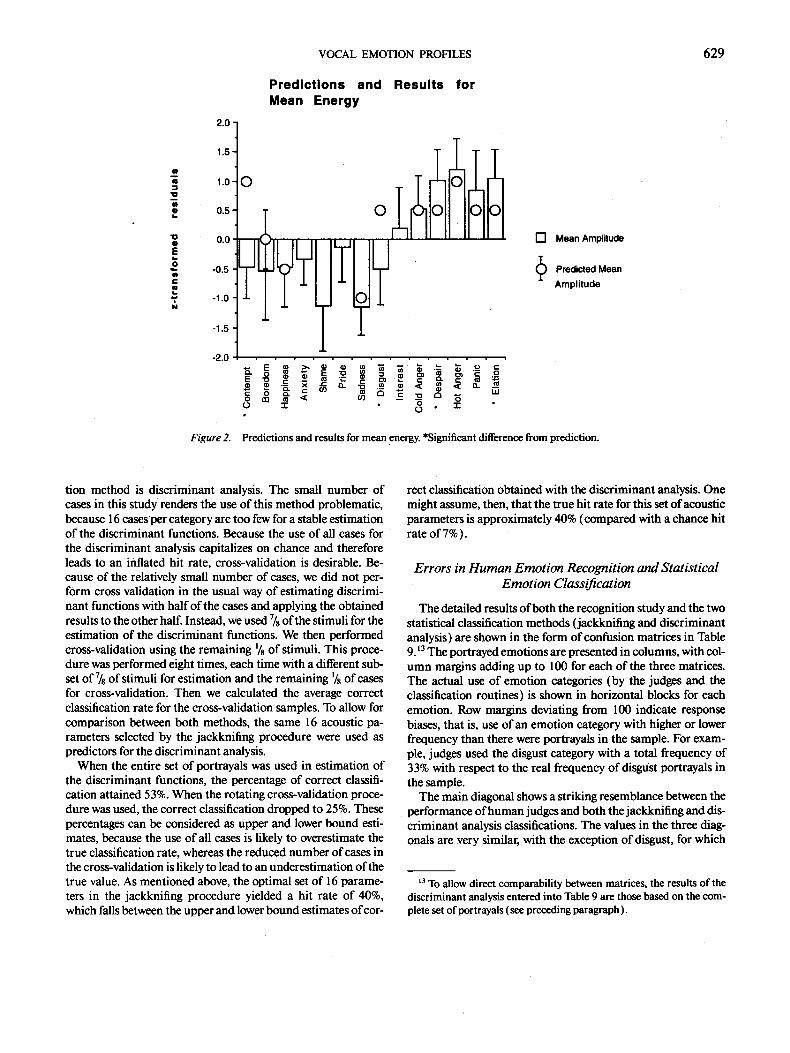
Q m ¢B - !
' V M m
"¢1 O
E b. O
N
2.0
1.5
1.0
0.5
0.0
-0.5
-1.0
-1.5
-2.0
Figure 2.
VOCAL EMOTION PROFILES
P r e d i c t i o n s a n d R e s u l t s fo r M e a n E n e r g y
0
jTUtj 0 I " 0 " I "
17 Mean Amplitude
(~ Pmdi~ed Mean Amplitude
Predictions and results for mean energy. *Significant difference from prediction.
629
tion method is discriminant analysis. The small number of cases in this study renders the use of this method problematic, because 16 cases per category are too few for a stable estimation of the discriminant functions. Because the use of all cases for the discriminant analysis capitalizes on chance and therefore leads to an inflated hit rate, cross-validation is desirable. Be- cause of the relatively small number of cases, we did not per- form cross validation in the usual way of estimating discrimi- nant functions with half of the cases and applying the obtained results to the other half. Instead, we used 7/8 of the stimuli for the estimation of the discriminant functions. We then performed cross-validation using the remaining l/s of stimuli. This proce- dure was performed eight times, each time with a different sub- set of 7/8 of stimuli for estimation and the remaining ~/8 of cases for cross-validation. Then we calculated the average correct classification rate for the cross-validation samples. To allow for comparison between both methods, the same 16 acoustic pa- rameters selected by the jackknifing procedure were used as predictors for the discriminant analysis.
When the entire set of portrayals was used in estimation of the discriminant functions, the percentage of correct classifi- cation attained 53%. When the rotating cross-validation proce- dure was used, the correct classification dropped to 25%. These percentages can be considered as upper and lower bound esti- mates, because the use of all cases is likely to overestimate the true classification rate, whereas the reduced number of cases in the cross-validation is likely to lead to an underestimation of the true value. As mentioned above, the optimal set of 16 parame- ters in the jackknifing procedure yielded a hit rate of 40%, which falls between the upper and lower bound estimates ofcor-
rect classification obtained with the discriminant analysis. One might assume, then, that the true hit rate for this set of acoustic parameters is approximately 40% (compared with a chance hit rate of 7%).
Errors in Human Emotion Recognition and Statistical Emotion Classification
The detailed results of both the recognition study and the two statistical classification methods (jackknifing and discriminant analysis) are shown in the form of confusion matrices in Table 9. ~ 3 The portrayed emotions are presented in columns, with col- umn margins adding up to 100 for each of the three matrices. The actual use of emotion categories (by the judges and the classification routines) is shown in horizontal blocks for each emotion. Row margins deviating from 100 indicate response biases, that is, use of an emotion category with higher or lower frequency than there were portrayals in the sample. For exam- ple, judges used the disgust category with a total frequency of 33% with respect to the real frequency of disgffst portrayals in the sample.
The main diagonal shows a striking resemblance between the performance of human judges and both the jackknifing and dis- criminant analysis classifications. The values in the three diag- onals are very similar, with the exception of disgust, for which
,3 To allow direct comparability between matrices, the results of the discriminant analysis entered into Table 9 are those based on the com- plete set of portrayals (see preceding paragraph).
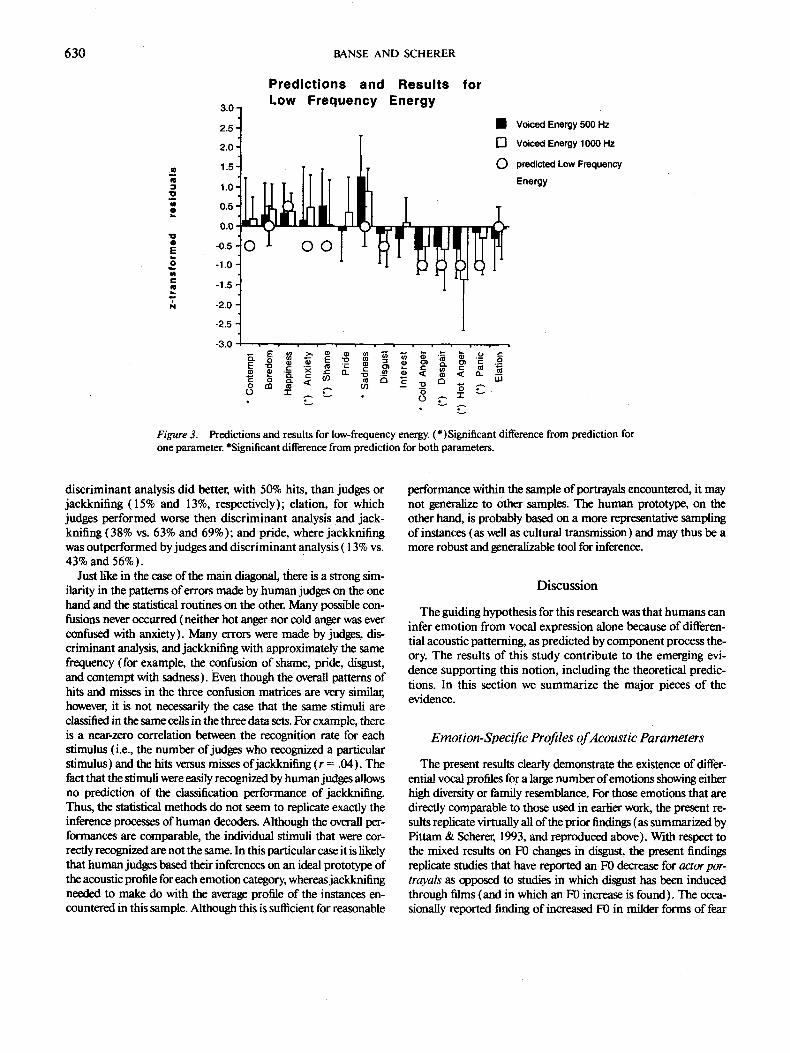
630 BANSE AND SCHERER
1:1 O E O
I -
i N
3 . 0 -
2.5
2.0"~
1.5-
1.0"
o.5'
0.0'
-0.5
-1.0
-1.5
-2.0
-2.5
-3.0
P r e d i c t i o n s a n d R e s u l t s fo r L o w F r e q u e n c y E n e r g y
1 Voiced Energy 500 Hz
[ ] Voiced Energy 1000 Hz
0 predicted Low Frequency
Energy
. - ~ ~ ta o~ ~ . o~ c .O
~ ~ ~ < ~ = . ~ ~ ~ _ ~ ,,,
O I ~ 0 I
Figure 3. Predictions and results for low-frequency energy. (*)Significant difference from prediction for one parameter. *Significant difference from prediction for both parameters.
discriminant analysis did better, with 50% hits, than judges or jackknifing (15% and 13%, respectively); elation, for which judges performed worse then discriminant analysis and jack- knifing (38% vs. 63% and 69%); and pride, where jackknifing was outperformed by judges and discriminant analysis ( 13% vs. 43% and 56%).
Just like in the case of the main diagonal, there is a strong sim- ilarity in the patterns of errors made by human judges on the one hand and the statistical routines on the other. Many possible con- fusions never occurred (neither hot anger nor cold anger was ever confused with anxiety). Many errors were made by judges, dis- eriminant analysis, and jackknifing with approximately the same frequency (for example, the confusion of shame, pride, disgust, and contempt with sadness). Even though the overall patterns of hits and misses in the three confusion matrices are very similar, however, it is not necessarily the case that the same stimuli are classified in the same cells in the three data sets. For example, there is a near-zero correlation between the recognition rate for each stimulus (i.e., the number of judges who recognized a particular stimulus) and the hits versus misses of jackknifing (r = .04). The fact that the stimuli were easily recognized by human judges allows no prediction of the classification performance of jackknifing. Thus, the statistical methods do not seem to replicate exactly the inference processes of human decoders. Although the overall per- formances are comparable, the individual stimuli that were cor- rectly recognized are not the same. In this particular case it is likely that human judges based their inferences on an ideal prototype of the acoustic profile for each emotion category, whereas jackknifing needed to make do with the average profile of the instances en- countered in this sample. Although this is sufficient for reasonable
performance within the sample of portrayals encountered, it may not generalize to other samples. The human prototype, on the other hand, is probably based on a more representative sampling of instances (as well as cultural transmission) and may thus be a more robust and ~neralizable tool for inference.
Discussion
The guiding hypothesis for this research was that humans can infer emotion from vocal expression alone because of differen- tial acoustic patterning, as predicted by component process the- ory. The results of this study contribute to the emerging evi- dence supporting this notion, including the theoretical predic- tions. In this section we summarize the major pieces of the evidence.
Emotion-Specific Profiles o f Acoustic Parameters
The present results clearly demonstrate the existence of differ- ential vocal profiles for a large number of emotions showing either high diversity or family resemblance. For those emotions that are directly comparable to those used in earlier work, the present re- sults replicate virtually all of the prior findings (as summarized by Pittam &Scherer, 1993, and reproduced above). With respect to the mixed results on F0 changes in disgust, the present findings replicate studies that have reported an F0 decrease for actor por- trayals as opposed to studies in which disgust has been induced through films (and in which an F0 increase is found). The occa- sionally reported finding of increased F0 in milder forms of fear
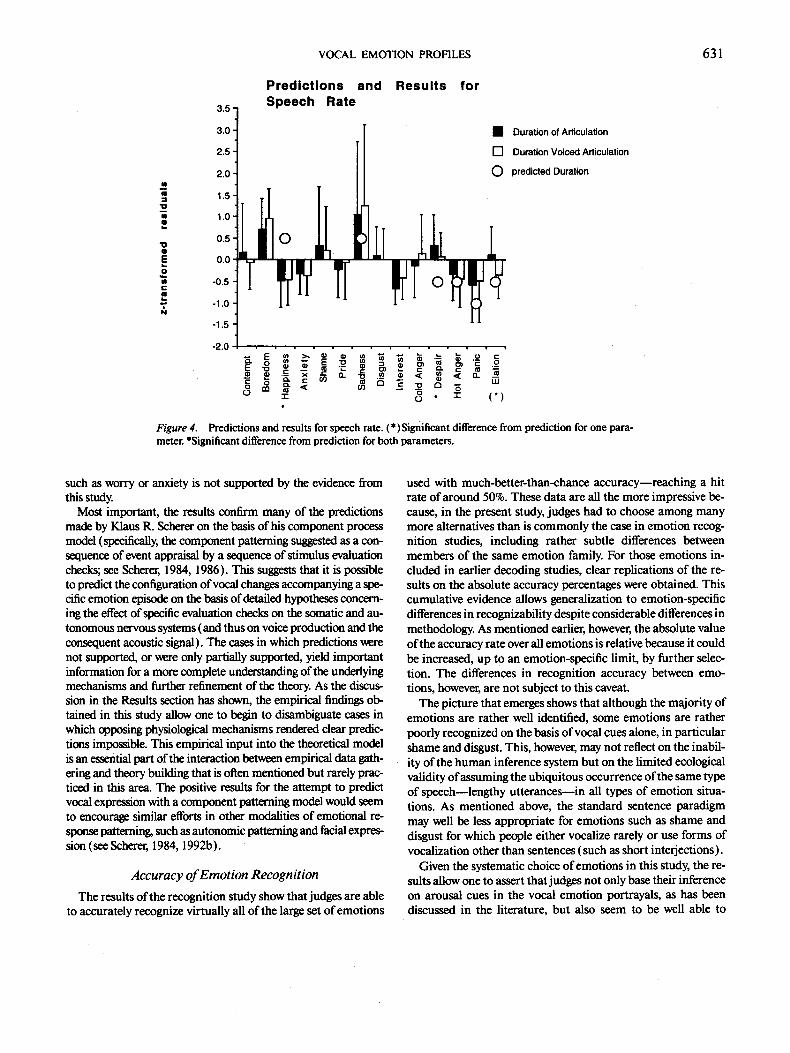
VOCAL EMOTION PROFILES 631
M m
'1= M I
P
" O @
E k .
o m e-
l N
3.5
P r e d i c t i o n s a n d R e s u l t s f o r S p e e c h R a t e
3.0
2.5
2.0
1.5
1.0
0.5
0.0
-0.5
-1.0
-1.5
-2.0
• Duration of Articulation
[ ] Duration Voiced Articulation
C) predicted Duration
a: o " " (*)
Figure 4. Predictions and results for speech rate. ( )Significant difference from prediction for one para- meter. *Significant difference from prediction for both parameters.
such as worry or anxiety is not supported by the evidence from this study.
Most important, the results confirm many of the predictions made by Klaus R. Scherer on the basis of his component process model (specifically, the component patterning suggested as a con- sequence of event appraisal by a sequence of stimulus evaluation checks; see Scherer, 1984, 1986). This suggests that it is possible to predict the configuration of vocal changes accompanying a spe- cific emotion episode on the basis of detailed hypotheses concern- ing the effect of specific evaluation checks on the somatic and au- tonomous nervous systems ( and thus on voice production and the consequent acoustic signal). The cases in which predictions were not supported, or were only partially supported, yield important information for a more complete understanding of the underlying mechanisms and further refinement of the theory. As the discus- sion in the Results section has shown, the empirical findings ob- tained in this study allow one to begin to disarnbiguate cases in which opposing physiological mechanisms rendered clear predic- tions impossible. This empirical input into the theoretical model is an essential part of the interaction between empirical data gath- ering and theory building that is often mentioned but rarely prac- riced in this area. The positive results for the attempt to predict vocal expression with a component patterning model would seem to encourage similar efforts in other modalities of emotional re- sponse patterning, such as autonomic patterning and facial expres- sion (see Scherer, 1984, 1992b).
Accuracy of Emotion Recognition
The results of the recognition study show that judges are able to accurately recognize virtually all of the large set of emotions
used with much-better-than-chance accuracy--reaching a hit rate of around 50%. These data are all the more impressive be- cause, in the present study, judges had to choose among many more alternatives than is commonly the case in emotion recog- nition studies, including rather subtle differences between members of the same emotion family. For those emotions in- eluded in earlier decoding studies, clear replications of the re- suits on the absolute accuracy percentages were obtained. This cumulative evidence allows generalization to emotion-specific differences in recognizability despite considerable differences in methodology. As mentioned earlier, however, the absolute value oftheaccuracy rate over all emotions is relative because it could be increased, up to an emotion-specific limit, by further selec- tion. The differences in recognition accuracy between emo- tions, however, are not subject to this caveat.
The picture that emerges shows that although the majority of emotions are rather well identified, some emotions are rather poorly recognized on the basis of vocal cues alone, in particular shame and disgust. This, however, may not reflect on the inabil- ity of the human inference system but on the limited ecological validity of assuming the ubiquitous occurrence of the same type of speech--lengthy utterances--in all types of emotion situa- tions. As mentioned above, the standard sentence paradigm may well be less appropriate for emotions such as shame and disgust for which people either vocalize rarely or use forms of vocalization other than sentences (such as short interjections).
Given the systematic choice of emotions in this study, the re- suits allow one to assert that judges not only base their inference on arousal cues in the vocal emotion portrayals, as has been discussed in the literature, but also seem to be well able to
632 BANSE AND SCHERER
I III
- - 0 - - 0 0 ~ 0 dddddd~ ~
I I I I I
~ d N d ~ N ~ N N I I I I I
~ o ~ o ~ o o ~ d d d d d d d d d
I I I
O O O O O O O O O I I I I
I Ill I
O O O ~ O ~ O O ~ I I l l I
I I I
d d d d d d d d d I
d ~ N d ~ N N d d I I I
~ O O O
I I I I
I I I
~ O
II II
r , o '
II '
d,, g ~
~ e ~ 0
o
~aN~ ' - N N E
" ~
.... ~ II ~ ~
~._~
~ ~ . • .-- ¢~ ..~ ~ VI
e- II , ~ ' ~ ~ - , . o
~. ~ . ~ ~ -
differentiate emotions on the basis of valence or quality cues, independently of arousal level or intensity.
In the literature on emotion inferences from expressive be- havior, attention is directed almost exclusively on the percent- age of correct identification by judges. It is of equal, if not greater interest, however, to explore the pattern of observed er- rors. A close inspection of the confusion matrix for the human judges (see the first lines of each block in Table 9) reveals that the errors are not randomly distributed over emotions. For ex- ample, hot anger is confused consistently only with cold anger and contempt; interest is confused more often with pride and happiness than with the other 11 emotions taken together. Rather than considering confusions as errors, they can be inter- preted as indicators of similarity between emotion categories. A qualitative analysis of the confusion patterns yields three di- mensions of similarity: quality, intensity, and valence.
The most obvious dimension of similarity is the quality of an emotion. Emotion pairs such as hot anger and cold anger, sad- ness and despair, anxiety and panic fear are similar in quality and differ mainly in intensity. Moreover, confusions between these emotion pairs are approximately symmetric. Taken to- gether, these results seem to indicate that confusions within these three pairs are due to the lack of a well-defined cut-off point between the intense and mild form of the respective emo- tion. Surprisingly, elation and happiness, which make up the fourth emotion pair, were virtually never mutually confused. Apparently both encoders and decoders made a clear-cut dis- tinction between these two emotion expressions.
A second dimension of similarity is intensity. For example, elation was relatively often confused with despair, hot anger, and panic fear, which differ strongly in quality but are similar in intensity.
The third dimension of similarity is the valence dimension. Positive emotions are more likely to be confused with other pos- itive emotions than with negative emotions. For example, pride was more often confused with the positive emotions elation, happiness, and interest (39%) than with all negative emotions taken together (19%).
If the three dimensions of similarity accounted for all errors, one would expect approximately symmetric confusions be- tween emotions (i.e., hot anger was confused with cold anger in 10% of the judgments, cold anger with hot anger in 17%). How- ever, this is not always the case. As mentioned above, there was substantial confusion of the elation portrayals with hot anger, panic fear, and despair, but there were virtually no confusions of stimuli belonging to these three categories with elation. One possible explanation for this finding may bean emotion-specific "typicality" of acoustic features. That is, some emotions (e.g., hot anger) may be characterized by a very typical configuration of acoustic features, which are easy to identify. In this case, the underlying recognition mechanism is probably a prototype based top-down process (for an empirical analysis of top-down vs. bottom-up recognition for facial expression, see Wallbott & Ricci-Bitti, 1993). Other emotions such as elation may lack typicality. Decoders confronted with a display of elation may have to analyze the acoustic pattern in a piecemeal or bottom- up fashion and may be more easily misled by prominent fea- tures such as high intensity, which in the case of elation makes
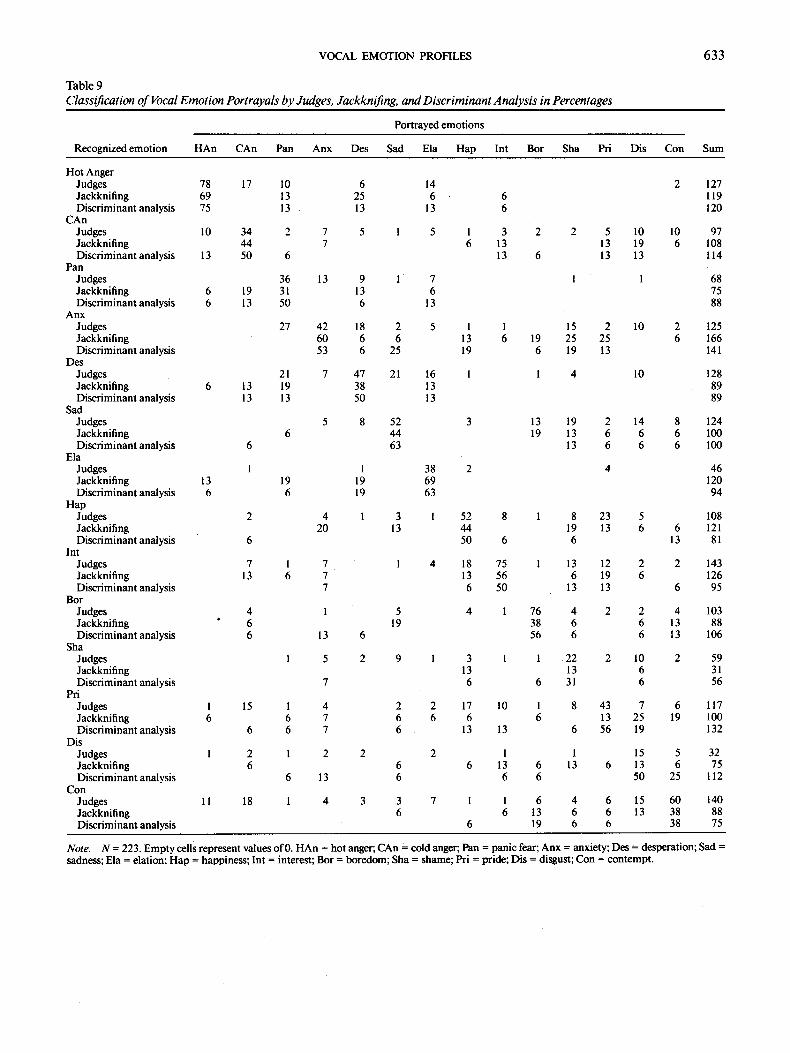
VOCAL EMOTION PROFILES
Table 9 Classification of Vocal Emotion Portrayals by Judges, Jackknifing, and Discriminant Analysis in Percentages
633
Portrayed emotions
Recognized emotion HAn CAn Pan Anx Des Sad Ela Hap Int Bor Sha Pri Dis Con Sum
Hot Anger Judges Jackknifing Discriminant analysis
CAn Judges Jackknifing Discriminant analysis
Pan Judges Jackknifing Discriminant analysis
Anx Judges Jackknifing Discriminant analysis
Des Judges Jackknifing Discriminant analysis
Sad Judges Jackknifing Discriminant analysis
Ela Judges Jackknifing Discriminant analysis
Hap Judges Jackknifing Discriminant analysis
lnt Judges Jackknifing Discriminant analysis
Bor Judges Jackknifing Discriminant analysis
Sha Judges Jackknifing Discriminant analysis
Pri Judges Jackknifing Discriminant analysis
Dis Judges Jackknifing Discriminant analysis
Con Judges Jackknifing Discriminant analys~s
78 17 10 6 14 2 127 69 13 25 6 6 119 75 13 13 13 6 120
10 34 2 7 5 1 5 1 3 2 2 5 10 10 97 44 7 6 13 13 19 6 108
13 50 6 13 6 13 13 114
36 13 9 1 7 i 1 68 6 19 31 13 6 75 6 13 50 6 13 88
27 42 18 2 5 1 1 15 2 10 2 125 60 6 6 13 6 19 25 25 6 166 53 6 25 19 6 19 13 141
21 7 47 21 16 1 I 4 10 128 6 13 19 38 13 89
13 13 50 13 89
5 8 52 3 13 19 2 14 8 124 6 44 19 13 6 6 6 100
6 63 13 6 6 6 100
1 1 38 2 4 46 13 19 19 69 120 6 6 19 63 94
2 4 1 3 1 52 8 1 8 23 5 108 20 13 44 19 13 6 6 121
6 50 6 6 13 81
7 1 7 1 4 18 75 1 13 12 2 2 143 13 6 7 13 56 6 19 6 126
7 6 50 13 13 6 95
4 1 5 4 1 76 4 2 2 4 103 6 19 38 6 6 13 88 6 13 6 56 6 6 13 106
1 5 2 9 1 3 1 1 22 2 lO 2 59 13 13 6 31
7 6 6 31 6 56
15 1 4 2 2 17 10 1 8 43 7 6 117 6 7 6 6 6 6 13 25 19 100
6 6 7 6 13 13 6 56 19 132
2 1 2 2 2 1 1 15 5 32 6 6 6 13 6 13 6 13 6 75
6 13 6 6 6 50 25 112
18 1 4 3 3 7 I 1 6 4 6 15 60 140 6 6 13 6 6 13 38 88
6 19 6 6 38 75
I 6
1
11
Note. N = 223. Empty cells represent values of 0. HAn= hot anger; CAn = cold anger; Pan = panic fear; Anx = anxiety; Des = desperation; Sad = sadness; Ela = elation; Hap = happiness; Int = interest; Bor = boredom; Sha = shame; Pri = pride; Dis = disgust; Con = contempt.
634 BANSE AND SCHERER
the stimulus similar to hot anger or despair. Typicality may also be a feature of more abstract emotion classes, such as positive versus negative emotions, negative emotions that have a com- mon "negativity cue" which prevents confusion with a positive or neutral emotion.
Understanding the Process of Emotion Inference From Vocal Expression
Because in this research both encoding and decoding were studied in parallel it was possible to regress the judges' emotion inferences on the various acoustic variables to derive first hypotheses on the use of these parameters in the judges' infer- ence processes. The highly significant results showed that a siz- able proportion of the variance is explained by a set of about 9- 10 variables, demonstrating that it is possible to determine the nature of the vocal cues that judges use in identifying a speaker's emotional state from vocal information. Future researchers will need to develop this approach further, ideally using a modified Brunswikian lens model, including path-analytic evaluation as suggested by Scherer ( 1978, 1989).
The comparison between the performance of human judges with statistical classification routines provides a promising ap- proach to elucidate the inference mechanism at work by opti- mizing the selection and combination of acoustic parameters used by human judges. In the present study this approach yielded a powerful result: Not only were the hit rates for correct recognition very similar but also, more important, there is a remarkable resemblance between the error patterns in the con- fusion matrices. If these results can be replicated in future work, the importance of the 16 acoustic cues, found to be optimal in the jackknifing procedure, would be underlined. Although in the present case rather simplistic cue combination rules were used for the inference model, one could imagine the develop- ment of much more sophisticated tools, for example, the ones developed in artificial intelligence work, in this domain.
Perspectives for Future Work
The desiderata for future work include intercultural ap- proaches, stronger ties to emotion theory, better anchoring in voice and speech production research, and the joint examina- tion of facial and vocal expression.
As for other aspects in the study of emotion, the investigation of the relative importance of universal, psychobiological factors versus sociocultural specificity can greatly further our under- standing of the vocal differentiation of emotion. This is partic- ularly true because language differences between cultures may have a very powerful impact on vocal, particularly prosodic, parameters involved in the expression of emotion. Thus, studies that include both encoders and decoders from different cul- tures-systematically chosen for differences in language struc- ture and communication style--could greatly advance our un- derstanding of the relative importance of the (psychobiological) push and the (sociocultural) pull factors on vocal emotion ex- pression. It would be of particular interest to examine vocal emotion expression in languages that use some of the parame-
ters involved in emotion expression (such as fundamental frequency ) in their phonological system (e.g., tone languages).
Much of the research in this area has been rather atheoretical and has, in consequence, been lacking the cumulativeness for which one strives in well-defined research areas. The present study has yielded some indications that a firm anchoring in emotion theory, at least of the componential variety, is possible and allows the systematic test of theoretical predictions. Further efforts along these lines will be required, particularly with re- spect to the definition of the various emotional states and their interrelationships• For example, the issue of families of emo- tions, as exemplified by the pairs used in the present research, will need to be addressed in much more detail to disentangle the relative effects of arousal and quality or valence differences on vocal parameters. To go beyond the demonstration of em- pirical correlations, such approaches need to take into account the intricate links between the function of the emotional state (including appraisal and action tendencies) and the corre- sponding physiological changes that directly affect the voice and speech mechanisms.
Unfortunately, there has been little interchange between physiologically and acoustically oriented voice scientists and psychologists who study vocal emotion expression. Such links need to be established if we want to trace and model the mech- anisms and processes whereby emotion-generated changes in the somatic and autonomic systems affect voice production (and thus ultimately the acoustic parameters we measure in the speech signal). Although the present study extended earlier work by including more acoustic parameters, it should be noted that the selection and definition of the acoustic parameters is still in its early stages. Many of the parameters used, particularly those related to the energy distribution in the spectrum, are only first approximations in trying to get at emotion-specific acoustic changes. Because there is little established knowledge with respect to the effects ofphysiologlcal arousal on voice pro- duction and the consequent changes in the acoustic speech sig- nal (Borden & Harris, 1984; Scherer, 1986), the measures used are largely based on speculatmn or empirical approxlmatmn. In addition to refining the voice parameters, more effort needs to be expended on developing reliable quantitative parameters for the measurement of suprasegmental features of speech, such as rhythm, accentuation, and intonation. Although such parame- ters have been used only rarely in this research area, the results that do exist suggest that prosodic parameters may play a major role in vocal emotion differentiation (Ladd, Silverman, Tolk- mitt, Bergmann, & Scherer, 1985; Scherer, Ladd, & Silverman, 1984; Tischer, 1994). Advances in measuring the pertinent differences in emotion-specific voice and speech signals are likely to strongly improve the ability of statistical models to ac- curately discriminate various emotional states.
Finally, it would be most desirable to achieve a convergence between two research traditions that have been pursued in iso- lation so far: the study of facial and of vocal emotion expression. One could argue (Scherer, 1994) that although each modality may have specific signal characteristics (with respect to both the underlying machinery and communicative use), spontaneous expressions, in the sense of affect bursts, are likely to be multimodal phenomena, requiring an integrated research ap-
VOCAL EMOTION PROFILES 635
proach. This is all the more so because it can be shown that changes in the innervat ion of specific facial muscles strongly affect the acoustic characteristics, particularly in the spectrum, of concurrent vocalizations (Scherer, 1994). Furthermore, once one adopts a componential approach to emotion (Scherer, 1984, 1992b), the jo in t study of facial and vocal phenomena seems much more promising (for example, by allowing cross- checks of predictions for the two modalit ies) than the study of each channel separately. In addition, the observed discrepancies between the two modalities may provide pointers to control and regulation strategies in social contexts.
In view of the technological breakthroughs with respect to the computer-aided analysis of emotional expression and the slowly but steadily increasing interest in theoretically based cross-modal research, there is some hope that, more than a cen- tury after Darwin 's pioneering efforts, this research domain may be ripe for another major thrust in addressing the funda- mental issues concerning the externalization and social com- municat ion of emotion.
References
Arndt, H., & Janney, R. W. ( 1991 ). Verbal, prosodic, and kinesic emo- tive contrasts in speech. Journal of Pragmatics, 15, 521-549.
Bezooijen, R. van (1984). The characteristics and recognizability of vocal expression of emotions. Drodrecht, The Netherlands: Foris.
Borden, G. J., & Harris, K. S. (1984). Speech science primer: Physiol- ogy, acoustics, and perception of speech. Baltimore: Williams & Wilkins.
Cacioppo, J. 1"., Klein, D. J., Berntson, G. C., & Hatfield, E. (1993). The psychophysiology of emotion. In M. Lewis & J. M. Haviland (Eds.), Handbook of emotions (pp. 119-142). New York: Guilford Press.
Catli, C., & Janney, R. W. (1994). Toward a pragmatics of emotive com- munication. Journal of Pragmatics, 22, 325-373.
Cosmides, L. (1983). Invariances in the acoustic expression of emotion during speech. Journal of Experimental Psychology: Human Percep- tion and Performance, 9, 864-881.
Darwin, C. ( 1965 ). The expressioh of the emotions in man and animals. Chicago: University of Chicago Press. (Original work published 1872)
Efron, D. (1972). Gesture, race, and culture. The Hague: Mouton. (Original work published 1941 )
Ekman, P. (1992). An argument for basic emotions. Cognition and Emotion, 6(3/4), 169-200.
Ekman, P., & Friesen, W. V. (1969). The repertoire of nonverbal behav- ior: Categories, origins, usage, and coding. Semiotica, 1, 49-98.
Ellgring, H. ( 1995 ). Facialexpression in emotion encoding. Manuscript in preparation,
Frick, R. W. (1985). Communicating emotion: The role of prosodic features. Psychological Bulletin, 97, 412-429.
Gerrards-Hesse, A., Spies, K., & Hesse, E W. (1994). Experimental inductions of emotional states and their effectiveness: A review. Brit- ish Journal of Psychology, 85, 55-78.
Goffman, E. (1959). The presentation of self in everyday life. Garden City, NY: Doubleday Anchor.
Goffman, E. (1978). Response cries. Language, 54, 787-815. Hammarberg, B., Fritzell, B., Gaut~n, J., Sundberg, J., & Wedin, L.
(1980). Perceptual and acoustic correlates of abnormal voice quali- ties. Acta Otolaryngologica, 90, 441-451.
Jiirgens, U. (1988). Central control of monkey calls. In D. Todt, P.
Goedeking, & D. Symmes (Eds.), Primate vocal communication (pp. 162-170). Berlin. Springer.
Kappas, A., Hess, U., & Scherer, K. R. ( 1991 ). Voice and emotion. In B. Rim6 & R. S. Feldman (Eds.), Fundamentals of nonverbal behavior (pp. 200-238). Cambridge, England: Cambridge University Press.
ladd, D. R., Silverman, K. E. A., Tolkmitt, E, Bergmann, G., & Scherer, K. R. (1985). Evidence for the independent function of in- tonation contour type, voice quality, and F0 range in signaling speaker affect. Journal of the Acoustical Society of A merica, 78, 435- 444.
Marler, P., & Tenaza, R. (1977). Signaling behavior of apes with special reference to vocalization. In T. A. Sebeok (Ed.), How animals com- manicate (pp. 965-1033 ). Bloomington: Indiana University Press.
Marty, A. (1908). Untersuchungen zur allgemeinen Grundlegung der Grammatik und Sprachphilosophie [Investigations on the general foundations of grammar and the philosophy of language]. Halle/ Saale, Germany: Niemeyer.
Morton, E. S. (1977). On the occurrence and significance of motiva- tional-structural rules in some bird and mammal sounds. American Naturalist, 111, 855-869.
Murray, I. R., & Arnott, J. L. (1993). Toward a simulation of emotion in synthetic speech: A review of the literature on human vocal emo- tion. Journal of the Acoustical Society of America, 93, 1097- I 108.
Pittam, J., & Scherer, K. R. (1993). Vocal expression and communica- tion of emotion. In M. Lewis & J. M. Haviland (Eds.), Handbook of emotions (pp. 185-198 ). New York: Guilford Press.
Ploog, D. (1988). Neurobiology and pathology of subhuman vocal communication and human speech. In D. Todt, P. Goedeking, & D. Symmes (Eds.), Primate vocal communication (pp. 195-212 ). Ber- lin: Springer.
Rozin, P., Haidt, J., & McCauley, C. R. (1993). Disgust. In M. Lewis & J. M. Haviland (Eds.), Handbook of emotions (pp. 575-594). New York: Guilford Press.
Scherer, K. R. (1978). Personality inference from voice quality: The loud voice of extroversion. European Journal of Social Psychology, 8, 467-487.
Scherer, IC R. (1979). Non-linguistic indicators of emotion and psy- chopathology. In C. E. Izard (Ed.), Emotions in personality andpsy- chopathology (pp. 495-529 ). New York: Plenum.
Scherer, K. R. (1984). On the nature and function of emotion: A com- ponent process approach. In K. R. Scherer & P. Ekman (Eds.), Ap- proaches to emotion (pp. 293-318). Hillsdale, NJ: Erlbaum.
Scherer, K. R. ( 1985 ). Vocal affect signalling: A comparative approach. In J. Rosenblatt, C. Beer, M. Busnel,& P. J. B. Slater (Eds.), Advances in the study of behavior (pp. 189-244). New York: Academic Press.
Scherer, K. R. (1986). Vocal affect expression: A review and a model for future research. Psychological Bulletin, 99, 143- ! 65.
Scherer, K. R. ( 1988 ). On the symbolic functions of vocal affect expres- sion. Journal of Language and Social Psychology, 7, 79-100.
Scherer, K. R. (1989). Vocal correlates of emotion. In A. Manstcad & H. Wagner (Eds.), Handbook of psychophysiology: Emotion and so- cial behavior ( pp. 165-197 ). London: Wiley.
Scherer, K. R. (1992a). On social representations of emotional experi- ence: Stereotypes, prototypes, or archetypes? In M. v. Cranach, W. Doise, & G. Mugny (Eds.), Social representations and the social bases of knowledge (pp. 30-36 ). Bern, Switzerland: Huber.
Scherer, K. R. (1992b). What does facial expression express? In K. Strongman (Ed.), International review of studies on emotion (Vol. 2, pp. 139-165 ). Chichester, England: Wiley.
Scherer, K. R. (1993). Interpersonal expectations, social influence, and emotion transfer. In P. D. Blanck (Ed.), Interpersonal expectations." Theory, research, and application (pp. 316-336). Cambridge, En- gland: Cambridge University Press.
636 BANSE AND SCHERER
Scherer, K. R. (1994). Affect bursts. In S. H. M. van Goozen, N. E. van de Poll, & J. A. Sergeant (Eds.), Emotions: Essays on emotion theory (pp. 161-196). Hillsdale, NJ: Erlbaum.
Scherer, K. R., Bansc, R., Wallbott, H. G., & Goidbeck, T. ( 1991 ). Vo- cal cues in emotion encoding and decoding. Motivation and Emotion, 15, 123-148.
Soberer, K. R., & Kappas, A. ( 1988 ). Primate vocal expression of affec- tive state. In D. Todt, P. Goedeking, & D. Symmes (Eds.), Primate vocal communication (pp. ! 71-194). Berlin: Springer.
Scherer, K. R., Ladd, D. R., & Silverman, K. E. A. (1984). Vocal cues to speaker affect: Testing two models. Journal of the Acoustical Soci- ety of America, 76, 1346-1356.
Scherer, K. R., London, H., & Wolf, J. (1973). The voice of confidence: Paralinguistic cues and audience evaluation. Journal of Research in Personality, 7, 31-44.
Seherer, K. R., & Wallbott, H. G. (1994). Evidence for universality and cultural variation of differential emotion response patterning. Journal of Personality and Social Psychology, 66, 310-328.
Scherer, K. R., Walibott, H. G., & Summerfield, A. B. (Eds,). (1986). Experiencing emotion: A crosscultural study Cambridge, England: Cambridge University Press.
Standke, R. (1992). Methoden der digitalen Sprachverarbeitung in der vokalen Kommunikationsforschung [Methods of digital speech anal-
ysis in research on vocal communication ]. Frankfurt, Germany: Pe- ter Lang.
Stein, N., & Oatley, K. (1992). Cognition & Emotion [Special issue], 6 (3&4) .
Stemmler, G. (1989). The autonomic differentiation of emotions revis- ited: Convergent and discriminant validation. Psychophysiology, 26, 617-632.
Tischer, B. (1994). Die vokale Kommunikation yon Gefdhlen [The vo- cal communication of emotions]. Weinheim, Germany: Beltz.
Wallbott, H. G. ( 1995 ). Bodily expression of emotion. Manuscript sub- mitted for publication.
Wallbott, H. G., & Ricci-Bitti, P. (1993). Decoders' processing of emo- tional facial expression: A top-down or bottom-up mechanism? Eu- ropean Journal of Social Psychology, 23, 427-443.
Wallbott, H. G., & Scherer, K. R. (1986). Cues and channels in emotion recognition. Journal of Personality and Social Psychology, 51, 690- 699.
Wundt, W. ( 1905 ). Grundziige der physiolOgischen Psychologie( 5th ed.) [ Fundamentals of physiological psychology ]. Leipzig, Germany: Engelmann.
Received October 12, 1994 Revision received June 16, 1995
Accepted June 19, 1995 •


![Acoustic and psychoacoustic aspects of vocal · PDF fileSTL-QPSR 2-31] 994 Acoustic and psychoacoustic aspects of vocal vibrato Johan sundberg Abstract This article reviews research](https://img.pdfslide.net/doc/110x75/5a9e0aef7f8b9a29228ccf45/acoustic-and-psychoacoustic-aspects-of-vocal-2-31-994-acoustic-and-psychoacoustic.jpg)