Embed Size (px)
Citation preview
GEOLOGICAL SURVEY OF FINLAND MARINE GEOLOGY 10.1.2017
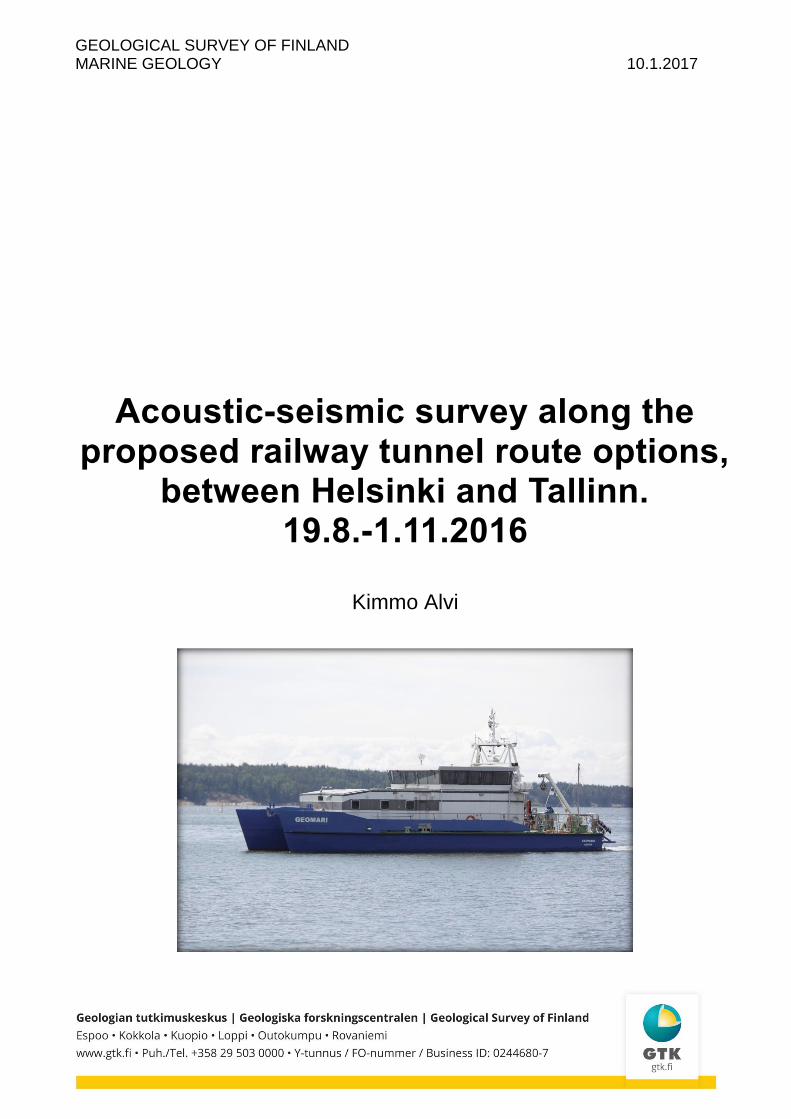
Acoustic-seismic survey along the proposed railway tunnel route options,
between Helsinki and Tallinn. 19.8.-1.11.2016
Kimmo Alvi
GEOLOGICAL SURVEY OF FINLAND MARINE GEOLOGY 10.1.2017
Geological survey of Finland
Betonimiehenkuja 4
PL. 96, 02151 Espoo
Commissioned by:
Uudenmaan liitto
Contact information:
Kimmo Alvi, Geologist
tel. +358 29 503 2115

GEOLOGICAL SURVEY OF FINLAND 10.1.2017
GEOLOGIAN TUTKIMUSKESKUS KUVAILULEHTI
10.01.2017/ Diaari nro GTK74/03.02/2016
Tekijät
Kimmo Alvi Raportin laji
Asiakasraportti
Toimeksiantaja
Uudenmaan liitto
Raportin nimi
Acoustic-seismic survey along the proposed railway tunnel route options, between Helsinki and Tallinn.
Tiivistelmä Geologian tutkimuskeskus suoritti Helsingin ja Tallinnan välisen, suunnitellun rautatietunnelin reittivaihtoehtojen akustis- seimiset luotaukset 19.8. – 1.11.2016. Työ tehtiin Uudenmaan liiton toimeksiannosta. Luotausten tarkoitus oli selvittää kiteisen kalliopinnan syvyys tunnelireitillä.
Aineisto kerättiin luotaamalla 2-3 rinnakaista linjaa 100- 150 m etäisyydellä toisistaan. Tulokset on esitetty akustisina poikkileikkauksina kaikilta reittivaihtoehdoilta. tulosten perusteella laadittiin myös kiteisen kalliopinnan syvyyskartta, sekä pintamaalajikartta luotausalueelta. Poikkileikkaukset ja kartat on liitetty digitaalisena tämän raportin liitteenä olevalle CD levykkeelle.
Kalliopinnan syvyys pystyttiin selvittämään lähes kaikilta luotauslinjoilta, lukuun ottamatta joitain Viron rannikon läheisiä alueita. Siellä paksu sedimenttipeite ja akustiset häiriöt estivät paikoin signaalin tukeutumisen, eikä kiteisen kalliopinnan syvyyttä saatu tulkittua kattavasti. Tuloksia tulisi täydentää mahdollisuuksien mukaan jo olemassa olevalla aineistolla.
Kallionpinnan geoteknisiä ominaisuuksia ei voida tulkita pelkän akustisen aineiston perusteella. Joitain arvioita voidaan tehdä topgrafisiin piirteisiin perustuen. Tunnelireitillä on nähtävissä useita kalliopainaumia, jotka saattavat edustaa laajempia murros- ja heikkousvyöhykkeitä. Tämän raportin tuloksia voidaan käyttää mahdollisten tarkempien jatkotutkimusten kohdentamiseen.
Asiasanat (kohde, menetelmät jne.)
Acoustic survey, Gulf of Finland, Crystalline basement
Maantieteellinen alue (maa, lääni, kunta, kylä, esiintymä)
Suomenlahti
Karttalehdet
Muut tiedot
Merenmittauslupa T- 037-16 22.7.2016 (AM13753)
Arkistosarjan nimi
Arkistotunnus
Kokonaissivumäärä
24 Kieli
englanti Hinta
Julkisuus
Luottamuksellinen
Yksikkö ja vastuualue
MRG Merigeologia yksikkö Hanketunnus
50401-100572
Allekirjoitus/nimen selvennys
Jyrki Rantataro Allekirjoitus/nimen selvennys
Kimmo Alvi
GEOLOGICAL SURVEY OF FINLAND 10.1.2017
TABLE OF CONTENTS
1 Introduction 1
2 Geological setting of the tunnel area 3
3 Research methods and equipment 4
4 Data processing and interpretation 6
5 Results 10
6 Discussion 16
7 Summary 19
APPENDICES
APPENDICES 1.1 - 1.16 Interpreted acoustic profiles
APPENDIX 2 Crystalline basement depth map, 1:250 000
APPENDIX 3 Marine geological map, 1:250 000
CD ROM - Report & appendices in PDF format
- Crystalline basement depth map in Geo tiff format.
- Marine geological map in ArcGis shp format.
- Interpreted acoustic profiles in XYZ ascii files (25m point density).
- Interpreted cross sections of different route options in XYZ ascii files (25m point density).
GEOLOGICAL SURVEY OF FINLAND 10.1.2017
1 INTRODUCTION
This report presents the results of acoustic-seismic survey between cities of Helsinki and Tallinn. The work was commissioned by Uudenmaan Liitto and it is part of the project which aims towards constructing a railway tunnel under the Gulf of Finland, between Helsinki and Tallinn.
The survey was done by the Geological Survey of Finland (GTK) between 19.8 – 1.11. 2016 with R/V Geomari.
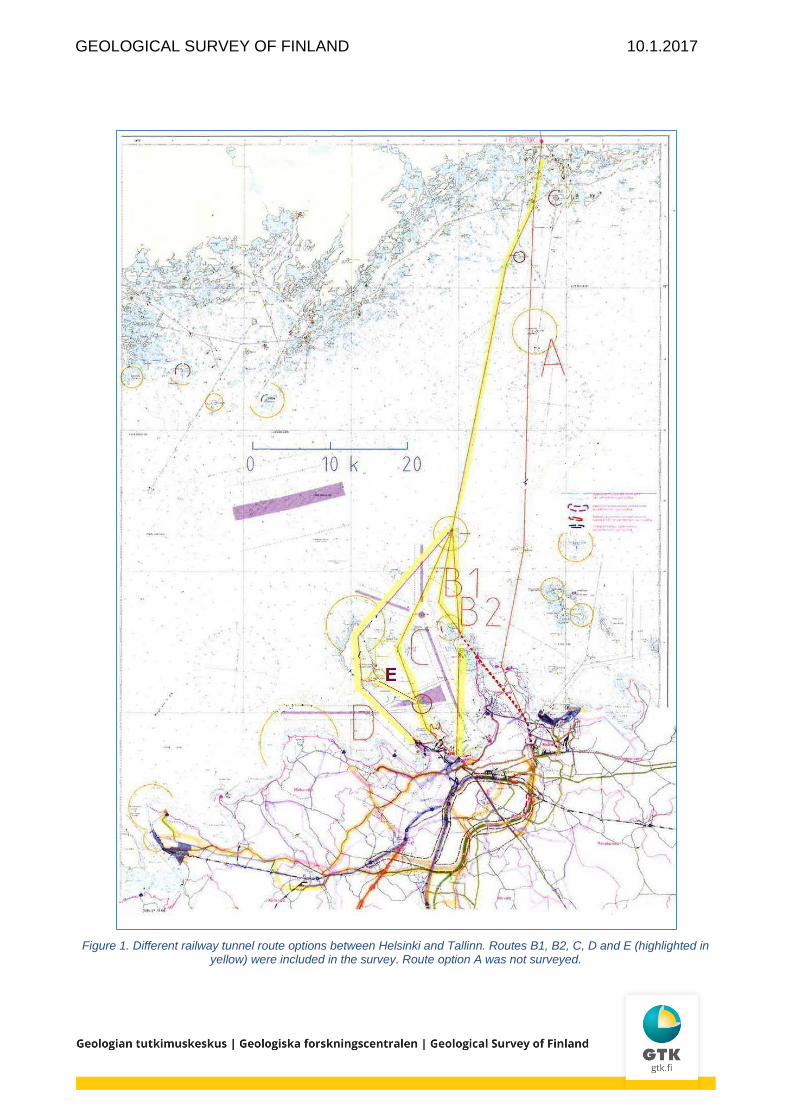
The aim of this work is to establish the depth of the crystalline basement along the proposed railway tunnel route options as presented in figure 1. Route coordinates are presented in table 1.
Information about the depth of the crystalline basement is needed for preliminary plans for tunnel construction. This report does not provide any detailed information about the geotechnical qualities of the basement rocks. The results in this survey should be considered as a tool for preliminary construction plans and also as basis for any possible further, more detailed studies.
Similar study was made in the Estonian segment of the tunnel zone in 2012 by the Estonian Geological Survey (EGK) (Suuroja et al. 2012). Aim of that work was to carry out a study on the soil and bedrock construction conditions by reviewing data from Estonian databases. Results of this current work overlap and complement those presented by Suuroja et al.
Table 1. Different route option coordinates (from S to N) in ETRS89- GK25FIN.
*starts from North of Aegna Island.
**section between route option C and Naissaar (see fig. 1).
route B1* route B2 route C route D route E**
X Y X Y X Y X Y X Y
25486388 6609595 25486123 6593493 25485247 6593918 25480487 6595777 25480942 6600504
25483728 6613261 25486388 6607054 25484265 6594918 25473857 6602429 25475465 6602740
25485462 6622857 25486388 6609595 25483318 6595856 25473772 6603266
25492315 6657173 25485462 6622857 25482257 6596922 25473604 6609179
25495777 6664626 25492315 6657173 25478407 6607315 25485462 6622857
25496630 6670875 25495777 6664626 25485462 6622857 25492315 6657173
25496630 6670875 25492315 6657173 25495777 6664626
25495777 6664626 25496630 6670875
25496630 6670875
GEOLOGICAL SURVEY OF FINLAND 10.1.2017
Figure 1. Different railway tunnel route options between Helsinki and Tallinn. Routes B1, B2, C, D and E (highlighted in yellow) were included in the survey. Route option A was not surveyed.
GEOLOGICAL SURVEY OF FINLAND 10.1.2017
2 GEOLOGICAL SETTING OF THE TUNNEL AREA
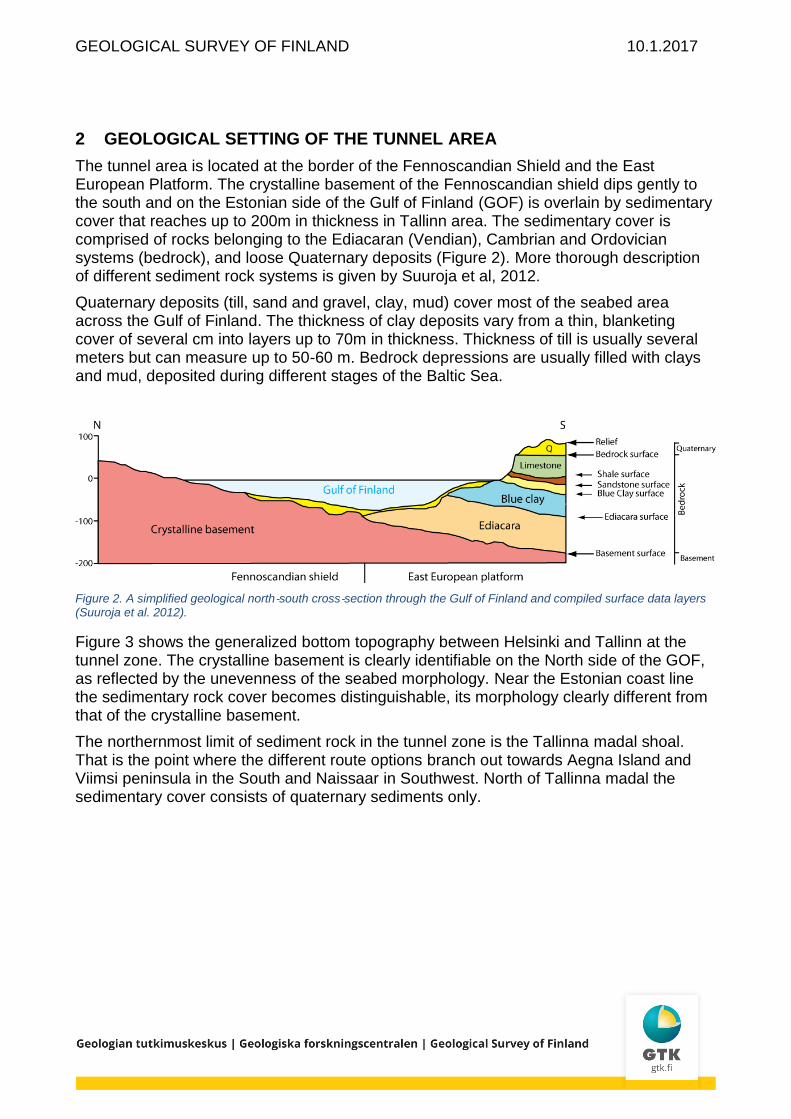
The tunnel area is located at the border of the Fennoscandian Shield and the East European Platform. The crystalline basement of the Fennoscandian shield dips gently to the south and on the Estonian side of the Gulf of Finland (GOF) is overlain by sedimentary cover that reaches up to 200m in thickness in Tallinn area. The sedimentary cover is comprised of rocks belonging to the Ediacaran (Vendian), Cambrian and Ordovician systems (bedrock), and loose Quaternary deposits (Figure 2). More thorough description of different sediment rock systems is given by Suuroja et al, 2012.
Quaternary deposits (till, sand and gravel, clay, mud) cover most of the seabed area across the Gulf of Finland. The thickness of clay deposits vary from a thin, blanketing cover of several cm into layers up to 70m in thickness. Thickness of till is usually several meters but can measure up to 50-60 m. Bedrock depressions are usually filled with clays and mud, deposited during different stages of the Baltic Sea.
Figure 2. A simplified geological north‐south cross‐section through the Gulf of Finland and compiled surface data layers (Suuroja et al. 2012).
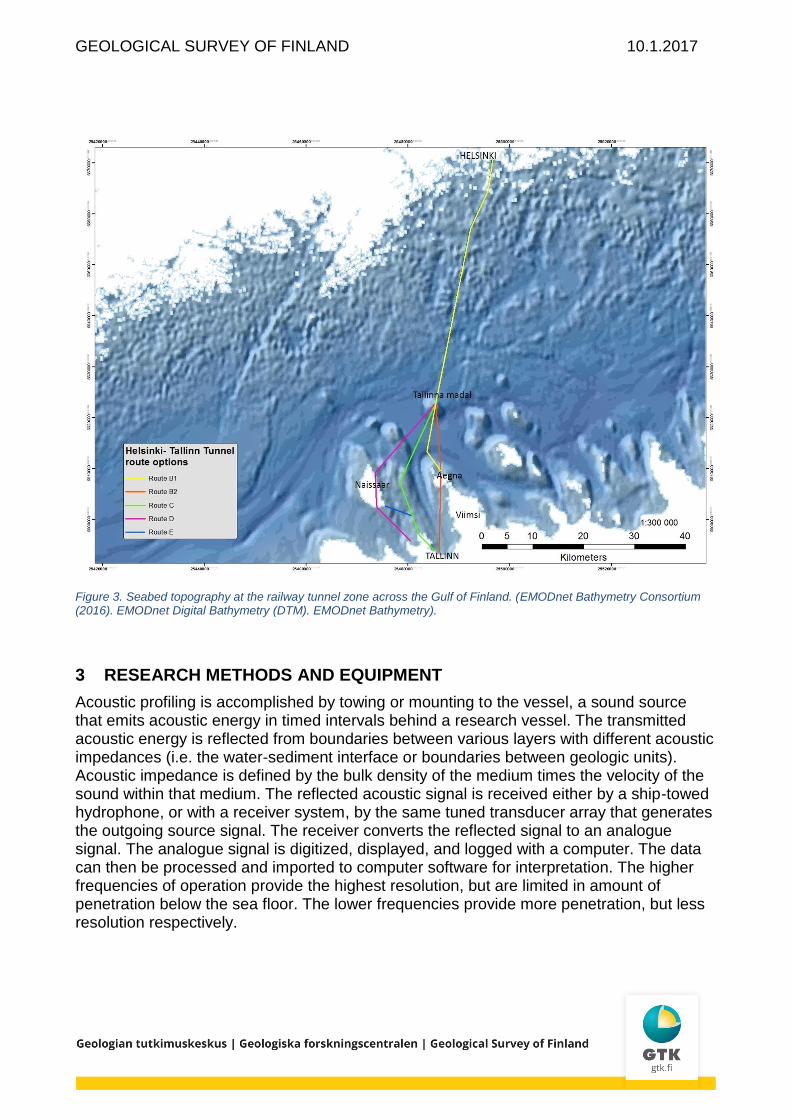
Figure 3 shows the generalized bottom topography between Helsinki and Tallinn at the tunnel zone. The crystalline basement is clearly identifiable on the North side of the GOF, as reflected by the unevenness of the seabed morphology. Near the Estonian coast line the sedimentary rock cover becomes distinguishable, its morphology clearly different from that of the crystalline basement.
The northernmost limit of sediment rock in the tunnel zone is the Tallinna madal shoal. That is the point where the different route options branch out towards Aegna Island and Viimsi peninsula in the South and Naissaar in Southwest. North of Tallinna madal the sedimentary cover consists of quaternary sediments only.
GEOLOGICAL SURVEY OF FINLAND 10.1.2017
Figure 3. Seabed topography at the railway tunnel zone across the Gulf of Finland. (EMODnet Bathymetry Consortium (2016). EMODnet Digital Bathymetry (DTM). EMODnet Bathymetry).
3 RESEARCH METHODS AND EQUIPMENT
Acoustic profiling is accomplished by towing or mounting to the vessel, a sound source that emits acoustic energy in timed intervals behind a research vessel. The transmitted acoustic energy is reflected from boundaries between various layers with different acoustic impedances (i.e. the water-sediment interface or boundaries between geologic units). Acoustic impedance is defined by the bulk density of the medium times the velocity of the sound within that medium. The reflected acoustic signal is received either by a ship-towed hydrophone, or with a receiver system, by the same tuned transducer array that generates the outgoing source signal. The receiver converts the reflected signal to an analogue signal. The analogue signal is digitized, displayed, and logged with a computer. The data can then be processed and imported to computer software for interpretation. The higher frequencies of operation provide the highest resolution, but are limited in amount of penetration below the sea floor. The lower frequencies provide more penetration, but less resolution respectively.
GEOLOGICAL SURVEY OF FINLAND 10.1.2017
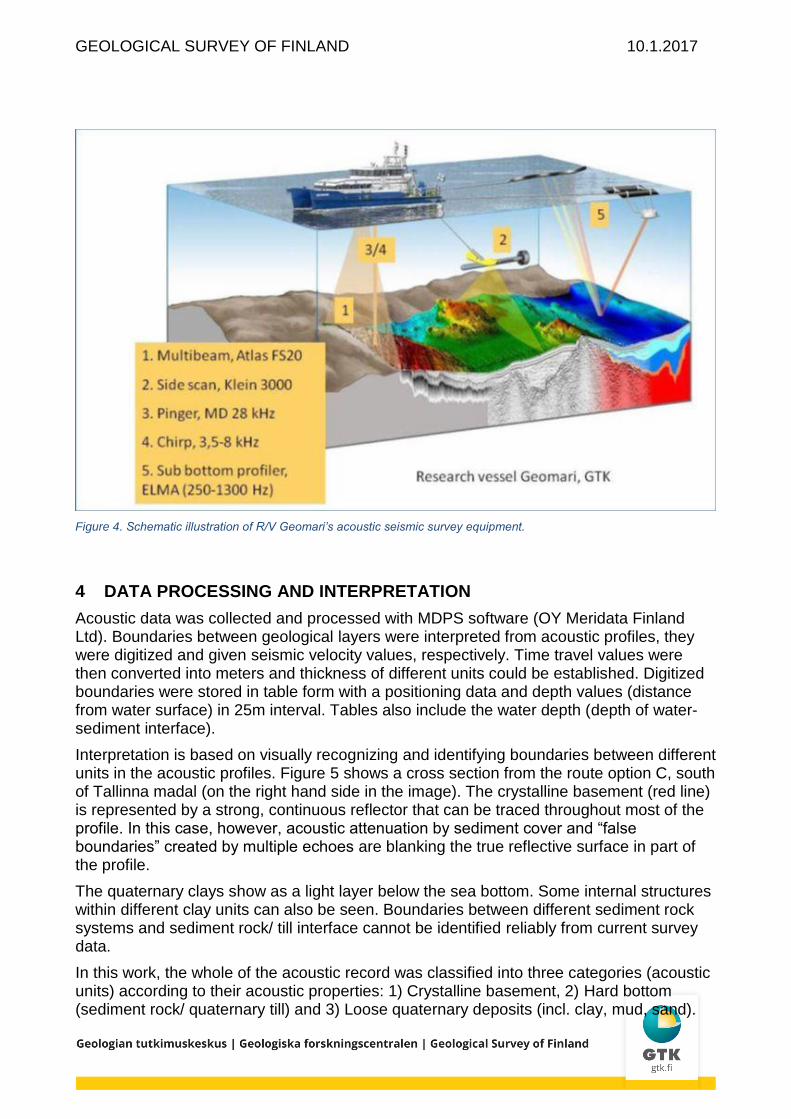
Description of survey equipment onboard R/V Geomari
1. Atlas Fansweep 20-200 multibeam o Frequency 200 kHz o Coverage up to 12 times water depth, operator selectable o Depth range 0,5-300 m o Accuracy 0,05 m ± 0,2 % depth for coverage up to 6 times water depth o Ping rate up to 16 Hz o Resolution 1440 soundings per ping o Reson SVP 15T sound velocity profiler and Micro SV C-keel probe
2. Klein System 3000 side scan sonar o Frequency 100 kHz / 500 kHz o Horizontal beam width 0,7° / 0,21° o Vertical beam width 40° o Maximum range 600m / 150m
3. MD 28 kHz echo sounder o Frequency 28 kHz o Beam angle 24° (-3 dB) o Transmission power 1,5 kW o Impedance 120 ohm
4. Massa TR-61A Chirp o Frequency range 3,5 – 8 kHz o Input power max. 500 W
5. Bolt Air gun 20- 100 Hz
6. ELMA reflection seismic
o Frequency 250-1300 Hz o Single channel o Sound source
Electric input 100 J
2 pulses per second
acoustic output 135 dB (re 1 uBar / 1 m) o Hydrophone
Active 6 m / 24 elements
Preamplifier 24 dB
GEOLOGICAL SURVEY OF FINLAND 10.1.2017
Figure 4. Schematic illustration of R/V Geomari’s acoustic seismic survey equipment.
4 DATA PROCESSING AND INTERPRETATION
Acoustic data was collected and processed with MDPS software (OY Meridata Finland Ltd). Boundaries between geological layers were interpreted from acoustic profiles, they were digitized and given seismic velocity values, respectively. Time travel values were then converted into meters and thickness of different units could be established. Digitized boundaries were stored in table form with a positioning data and depth values (distance from water surface) in 25m interval. Tables also include the water depth (depth of water- sediment interface).
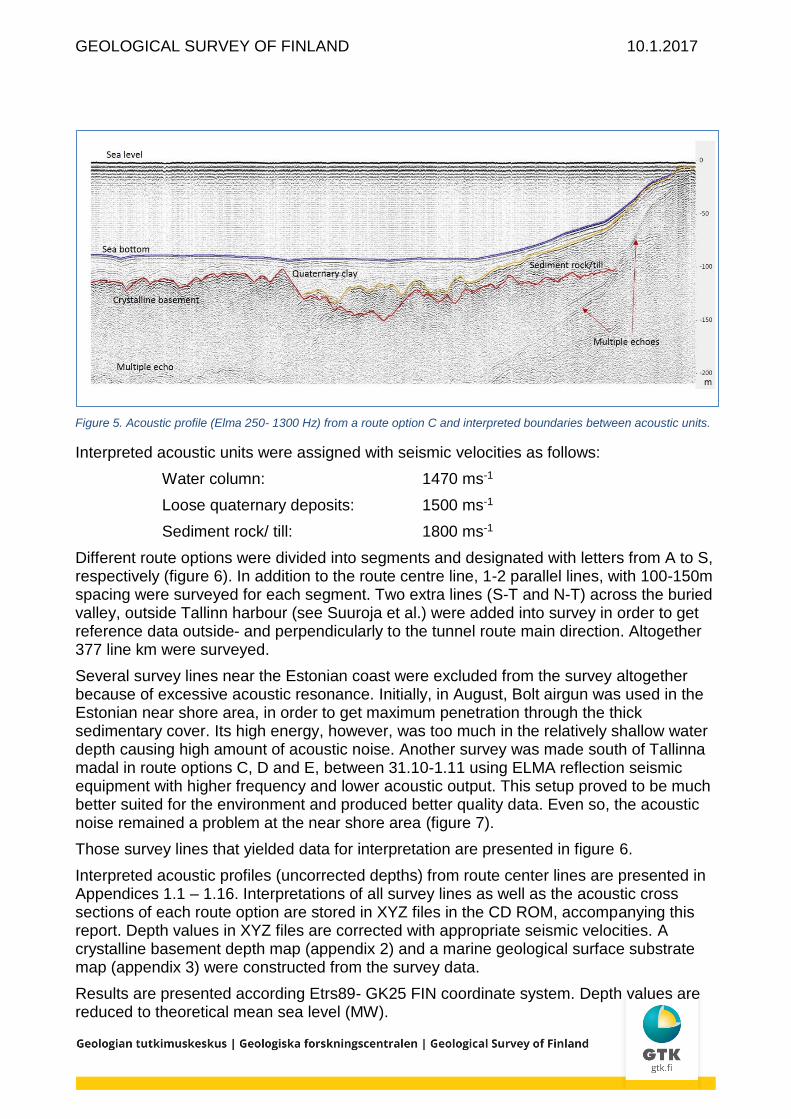
Interpretation is based on visually recognizing and identifying boundaries between different units in the acoustic profiles. Figure 5 shows a cross section from the route option C, south of Tallinna madal (on the right hand side in the image). The crystalline basement (red line) is represented by a strong, continuous reflector that can be traced throughout most of the profile. In this case, however, acoustic attenuation by sediment cover and “false boundaries” created by multiple echoes are blanking the true reflective surface in part of the profile.
The quaternary clays show as a light layer below the sea bottom. Some internal structures within different clay units can also be seen. Boundaries between different sediment rock systems and sediment rock/ till interface cannot be identified reliably from current survey data.
In this work, the whole of the acoustic record was classified into three categories (acoustic units) according to their acoustic properties: 1) Crystalline basement, 2) Hard bottom (sediment rock/ quaternary till) and 3) Loose quaternary deposits (incl. clay, mud, sand).
GEOLOGICAL SURVEY OF FINLAND 10.1.2017
Figure 5. Acoustic profile (Elma 250- 1300 Hz) from a route option C and interpreted boundaries between acoustic units.
Interpreted acoustic units were assigned with seismic velocities as follows:
Water column: 1470 ms-1
Loose quaternary deposits: 1500 ms-1
Sediment rock/ till: 1800 ms-1
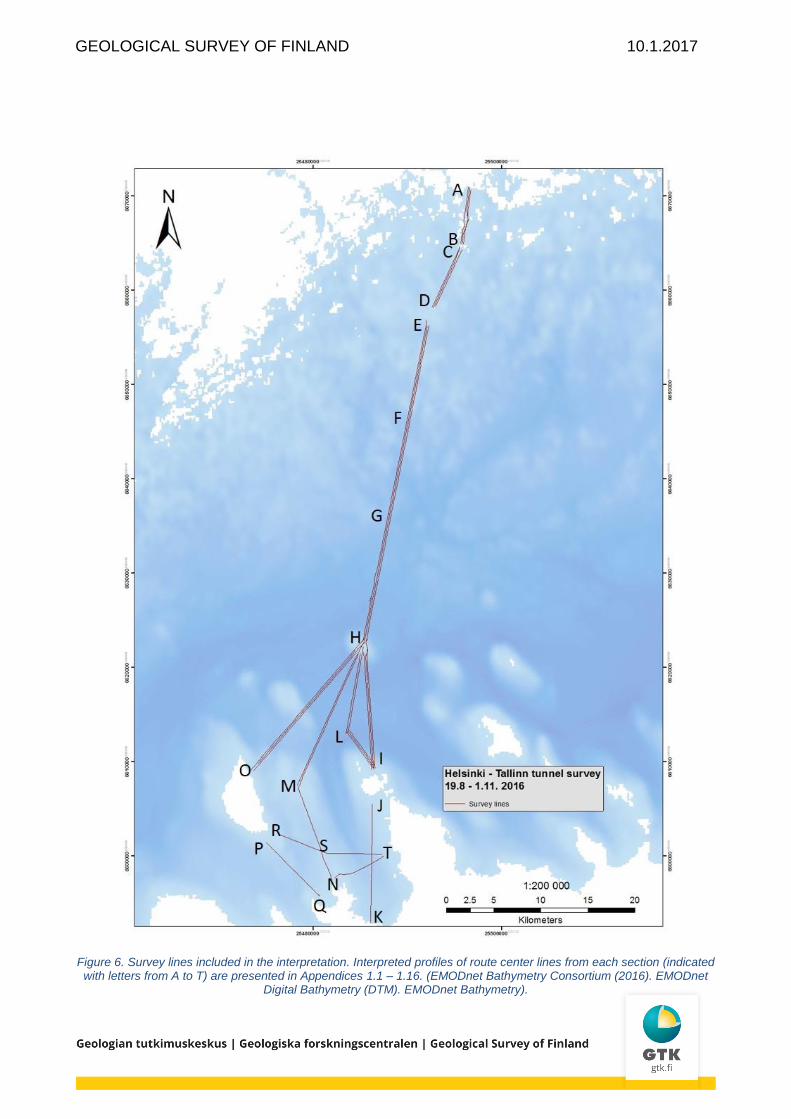
Different route options were divided into segments and designated with letters from A to S, respectively (figure 6). In addition to the route centre line, 1-2 parallel lines, with 100-150m spacing were surveyed for each segment. Two extra lines (S-T and N-T) across the buried valley, outside Tallinn harbour (see Suuroja et al.) were added into survey in order to get reference data outside- and perpendicularly to the tunnel route main direction. Altogether 377 line km were surveyed.
Several survey lines near the Estonian coast were excluded from the survey altogether because of excessive acoustic resonance. Initially, in August, Bolt airgun was used in the Estonian near shore area, in order to get maximum penetration through the thick sedimentary cover. Its high energy, however, was too much in the relatively shallow water depth causing high amount of acoustic noise. Another survey was made south of Tallinna madal in route options C, D and E, between 31.10-1.11 using ELMA reflection seismic equipment with higher frequency and lower acoustic output. This setup proved to be much better suited for the environment and produced better quality data. Even so, the acoustic noise remained a problem at the near shore area (figure 7).
Those survey lines that yielded data for interpretation are presented in figure 6.
Interpreted acoustic profiles (uncorrected depths) from route center lines are presented in Appendices 1.1 – 1.16. Interpretations of all survey lines as well as the acoustic cross sections of each route option are stored in XYZ files in the CD ROM, accompanying this report. Depth values in XYZ files are corrected with appropriate seismic velocities. A crystalline basement depth map (appendix 2) and a marine geological surface substrate map (appendix 3) were constructed from the survey data.
Results are presented according Etrs89- GK25 FIN coordinate system. Depth values are reduced to theoretical mean sea level (MW).
GEOLOGICAL SURVEY OF FINLAND 10.1.2017
Figure 6. Survey lines included in the interpretation. Interpreted profiles of route center lines from each section (indicated with letters from A to T) are presented in Appendices 1.1 – 1.16. (EMODnet Bathymetry Consortium (2016). EMODnet
Digital Bathymetry (DTM). EMODnet Bathymetry).
GEOLOGICAL SURVEY OF FINLAND 10.1.2017
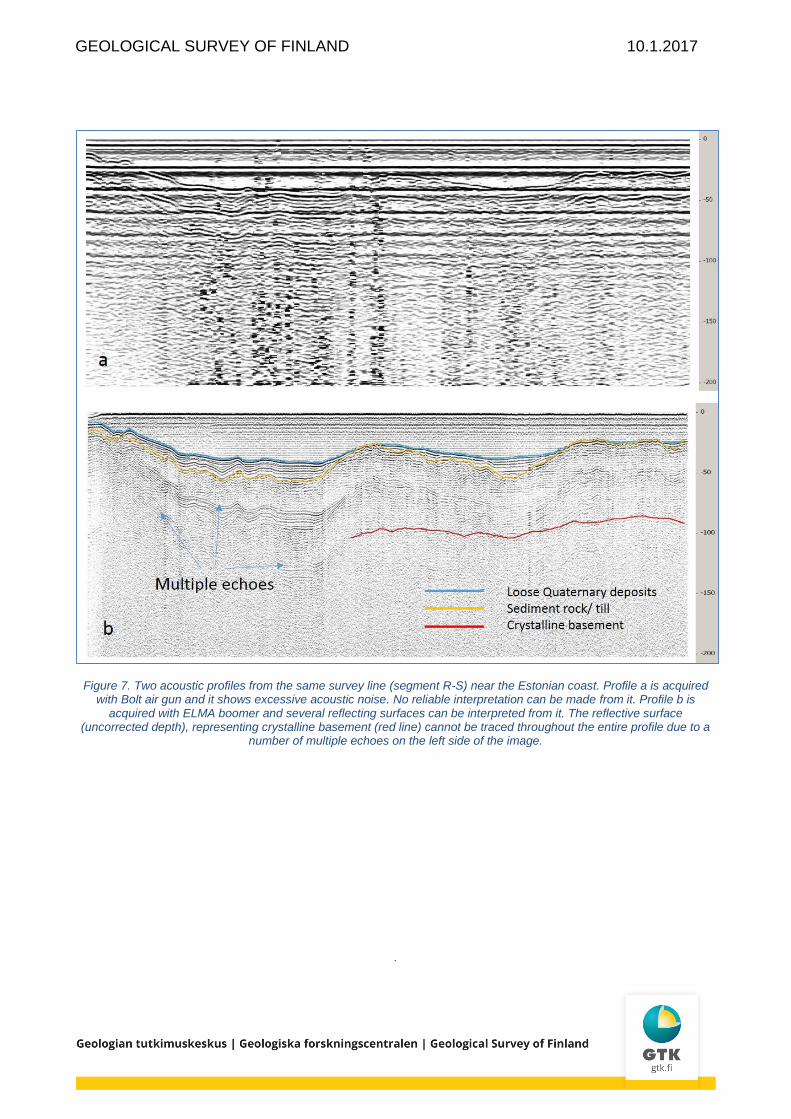
Figure 7. Two acoustic profiles from the same survey line (segment R-S) near the Estonian coast. Profile a is acquired with Bolt air gun and it shows excessive acoustic noise. No reliable interpretation can be made from it. Profile b is
acquired with ELMA boomer and several reflecting surfaces can be interpreted from it. The reflective surface (uncorrected depth), representing crystalline basement (red line) cannot be traced throughout the entire profile due to a
number of multiple echoes on the left side of the image.
.
GEOLOGICAL SURVEY OF FINLAND 10.1.2017
5 RESULTS
The survey provides an excellent view into topography- and depth of the crystalline basement, thickness of sedimentary cover and the horizontal distribution of surface sediments along different tunnel route options and across the GOF. For the most part, the recorded data is highly detailed and different acoustic units easily recognizable in acoustic profile data. The resolution of low frequency equipment (Boomer and Air Gun) allow vertical accuracy of ±1-3m.
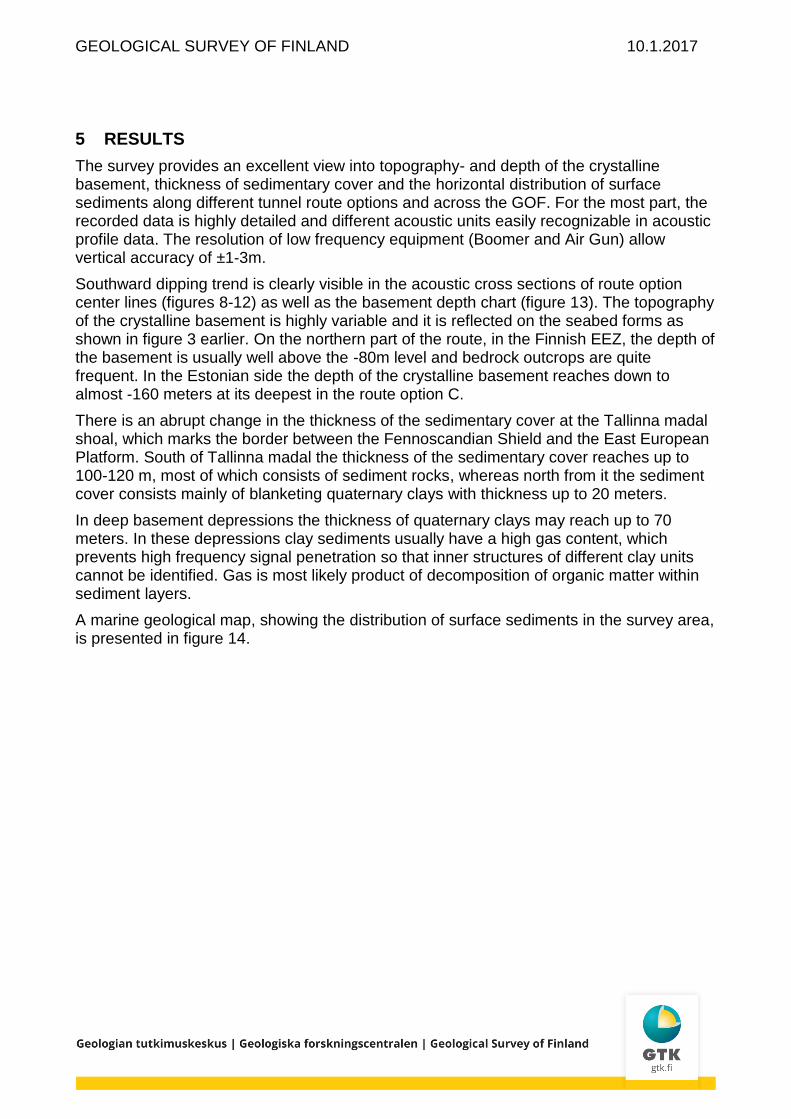
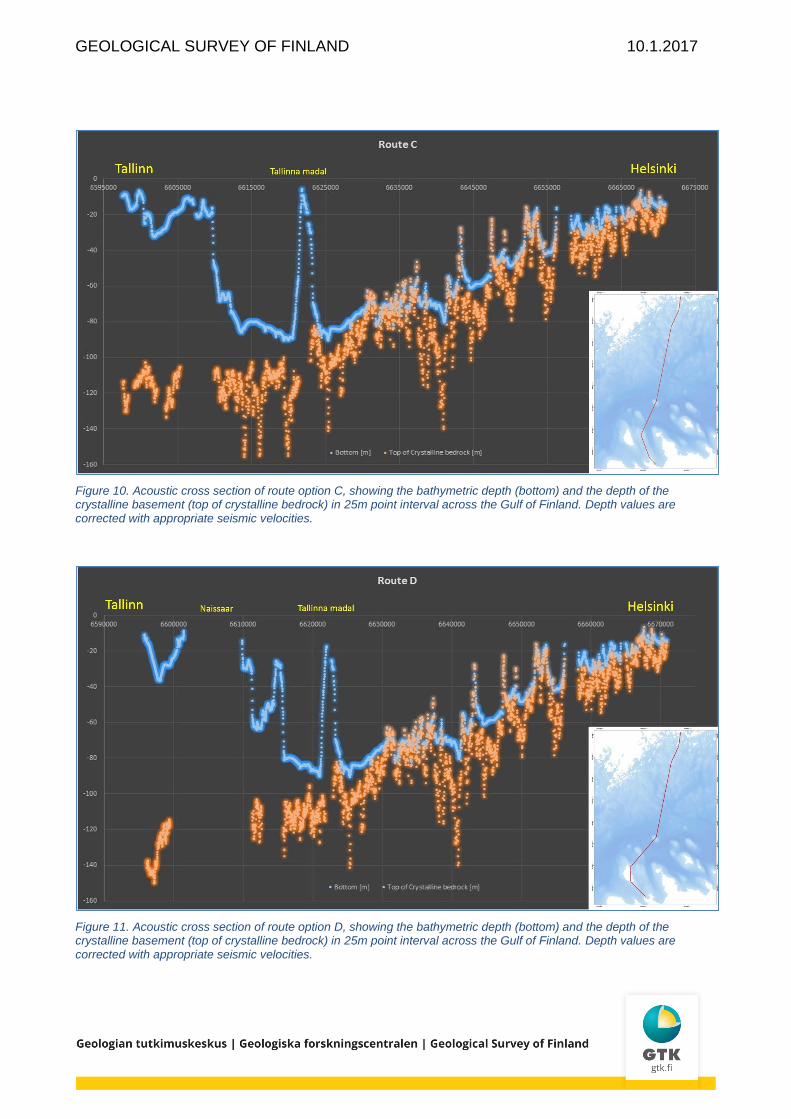
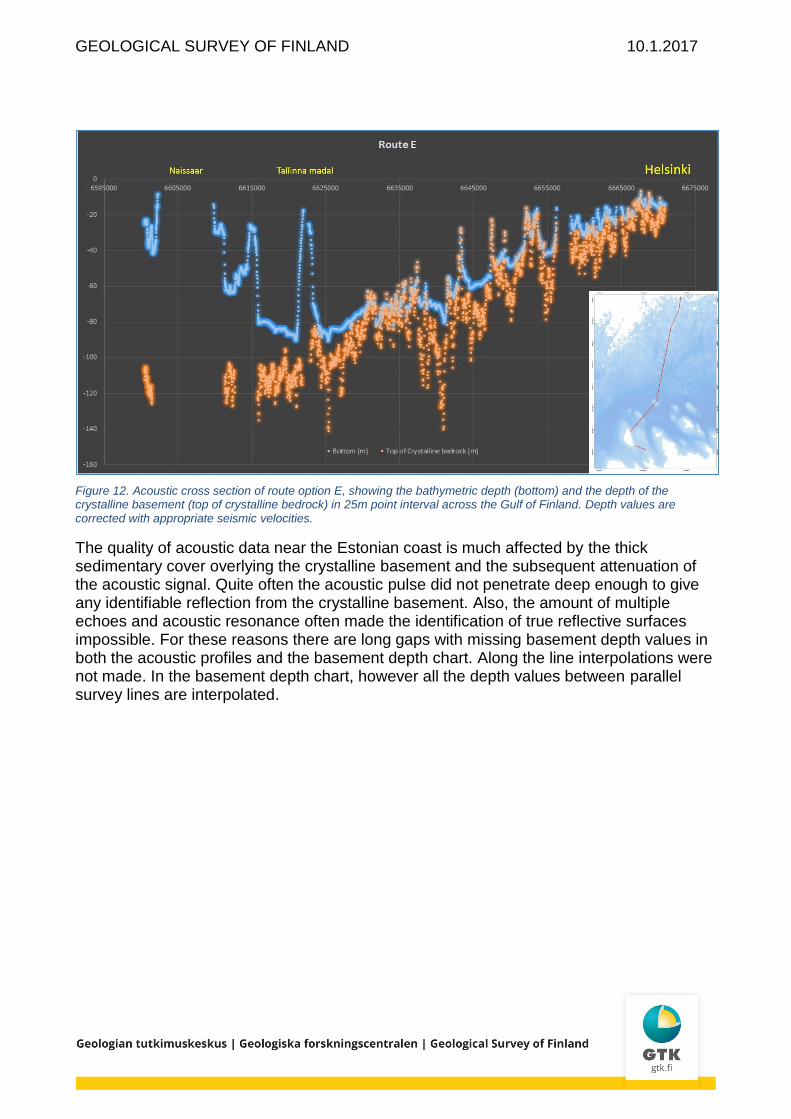
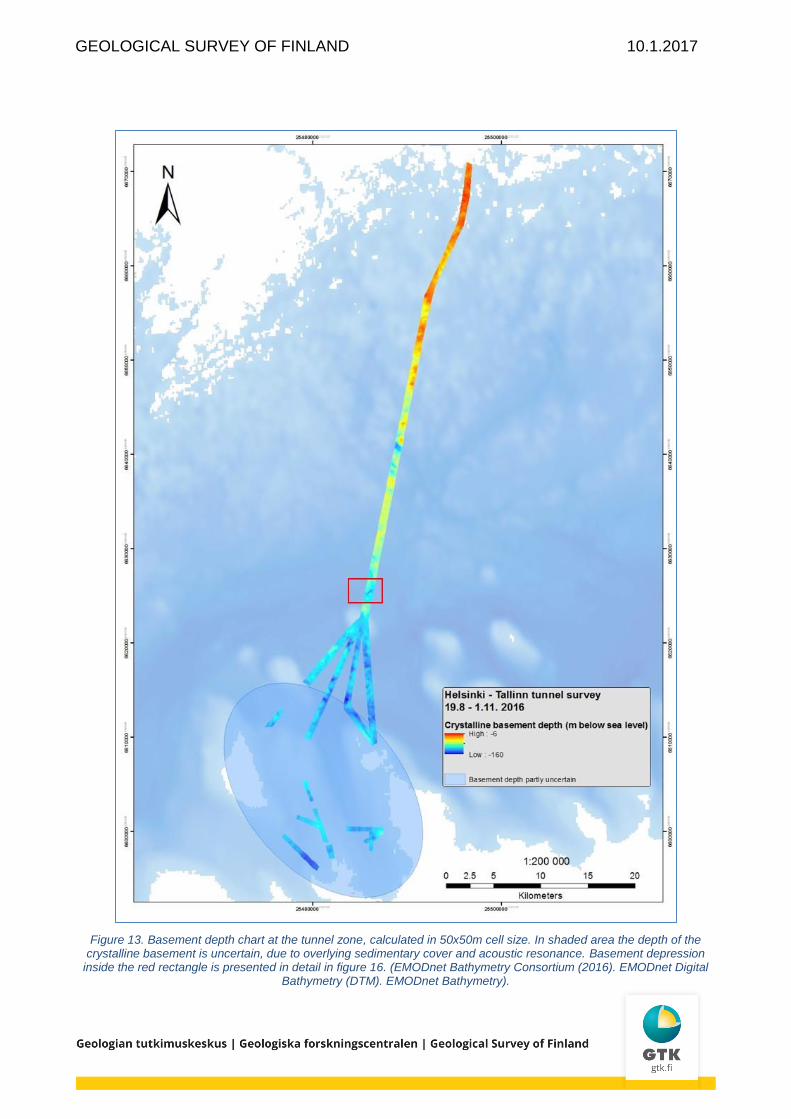
Southward dipping trend is clearly visible in the acoustic cross sections of route option center lines (figures 8-12) as well as the basement depth chart (figure 13). The topography of the crystalline basement is highly variable and it is reflected on the seabed forms as shown in figure 3 earlier. On the northern part of the route, in the Finnish EEZ, the depth of the basement is usually well above the -80m level and bedrock outcrops are quite frequent. In the Estonian side the depth of the crystalline basement reaches down to almost -160 meters at its deepest in the route option C.
There is an abrupt change in the thickness of the sedimentary cover at the Tallinna madal shoal, which marks the border between the Fennoscandian Shield and the East European Platform. South of Tallinna madal the thickness of the sedimentary cover reaches up to 100-120 m, most of which consists of sediment rocks, whereas north from it the sediment cover consists mainly of blanketing quaternary clays with thickness up to 20 meters.
In deep basement depressions the thickness of quaternary clays may reach up to 70 meters. In these depressions clay sediments usually have a high gas content, which prevents high frequency signal penetration so that inner structures of different clay units cannot be identified. Gas is most likely product of decomposition of organic matter within sediment layers.
A marine geological map, showing the distribution of surface sediments in the survey area, is presented in figure 14.

GEOLOGICAL SURVEY OF FINLAND 10.1.2017
Figure 8. Acoustic cross section of route option B1, showing the bathymetric depth (bottom) and the depth of the crystalline basement (top of crystalline bedrock) in 25m point interval across the Gulf of Finland. Depth values are corrected with appropriate seismic velocities.
Figure 9. Acoustic cross section of route option B2, showing the bathymetric depth (bottom) and the depth of the crystalline basement (top of crystalline bedrock) in 25m point interval across the Gulf of Finland. Depth values are corrected with appropriate seismic velocities.
GEOLOGICAL SURVEY OF FINLAND 10.1.2017
Figure 10. Acoustic cross section of route option C, showing the bathymetric depth (bottom) and the depth of the crystalline basement (top of crystalline bedrock) in 25m point interval across the Gulf of Finland. Depth values are corrected with appropriate seismic velocities.
Figure 11. Acoustic cross section of route option D, showing the bathymetric depth (bottom) and the depth of the crystalline basement (top of crystalline bedrock) in 25m point interval across the Gulf of Finland. Depth values are corrected with appropriate seismic velocities.
GEOLOGICAL SURVEY OF FINLAND 10.1.2017
Figure 12. Acoustic cross section of route option E, showing the bathymetric depth (bottom) and the depth of the crystalline basement (top of crystalline bedrock) in 25m point interval across the Gulf of Finland. Depth values are corrected with appropriate seismic velocities.
The quality of acoustic data near the Estonian coast is much affected by the thick sedimentary cover overlying the crystalline basement and the subsequent attenuation of the acoustic signal. Quite often the acoustic pulse did not penetrate deep enough to give any identifiable reflection from the crystalline basement. Also, the amount of multiple echoes and acoustic resonance often made the identification of true reflective surfaces impossible. For these reasons there are long gaps with missing basement depth values in both the acoustic profiles and the basement depth chart. Along the line interpolations were not made. In the basement depth chart, however all the depth values between parallel survey lines are interpolated.
GEOLOGICAL SURVEY OF FINLAND 10.1.2017
Figure 13. Basement depth chart at the tunnel zone, calculated in 50x50m cell size. In shaded area the depth of the crystalline basement is uncertain, due to overlying sedimentary cover and acoustic resonance. Basement depression
inside the red rectangle is presented in detail in figure 16. (EMODnet Bathymetry Consortium (2016). EMODnet Digital Bathymetry (DTM). EMODnet Bathymetry).
GEOLOGICAL SURVEY OF FINLAND 10.1.2017
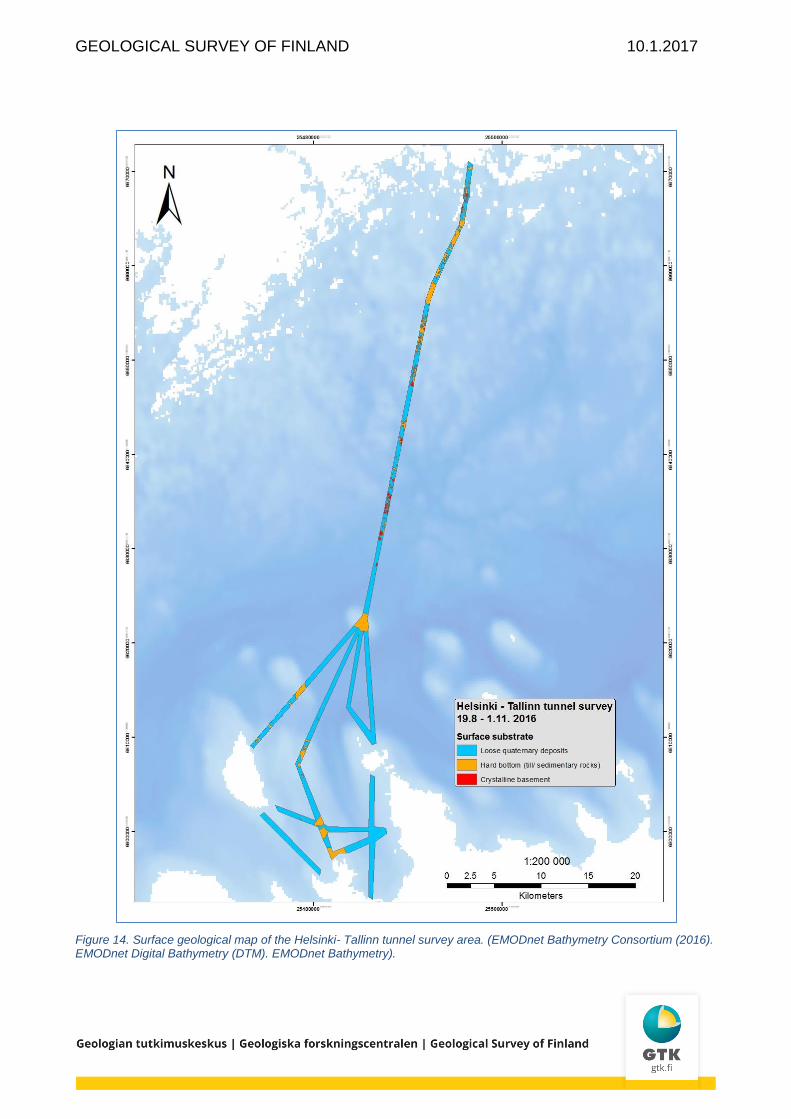
Figure 14. Surface geological map of the Helsinki- Tallinn tunnel survey area. (EMODnet Bathymetry Consortium (2016). EMODnet Digital Bathymetry (DTM). EMODnet Bathymetry).
GEOLOGICAL SURVEY OF FINLAND 10.1.2017
6 DISCUSSION
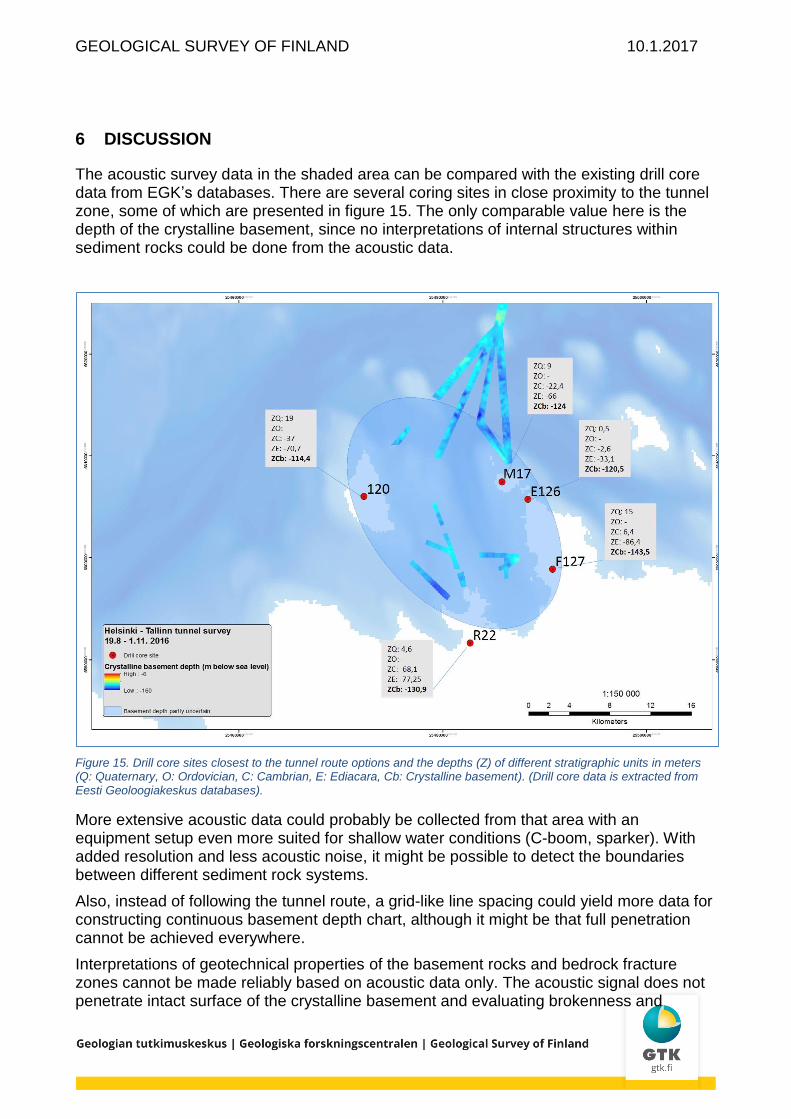
The acoustic survey data in the shaded area can be compared with the existing drill core data from EGK’s databases. There are several coring sites in close proximity to the tunnel zone, some of which are presented in figure 15. The only comparable value here is the depth of the crystalline basement, since no interpretations of internal structures within sediment rocks could be done from the acoustic data.
Figure 15. Drill core sites closest to the tunnel route options and the depths (Z) of different stratigraphic units in meters (Q: Quaternary, O: Ordovician, C: Cambrian, E: Ediacara, Cb: Crystalline basement). (Drill core data is extracted from Eesti Geoloogiakeskus databases).
More extensive acoustic data could probably be collected from that area with an equipment setup even more suited for shallow water conditions (C-boom, sparker). With added resolution and less acoustic noise, it might be possible to detect the boundaries between different sediment rock systems.
Also, instead of following the tunnel route, a grid-like line spacing could yield more data for constructing continuous basement depth chart, although it might be that full penetration cannot be achieved everywhere.
Interpretations of geotechnical properties of the basement rocks and bedrock fracture zones cannot be made reliably based on acoustic data only. The acoustic signal does not penetrate intact surface of the crystalline basement and evaluating brokenness and
GEOLOGICAL SURVEY OF FINLAND 10.1.2017
fragmentation from an acoustic image is subject to misinterpretations and speculative, at best.
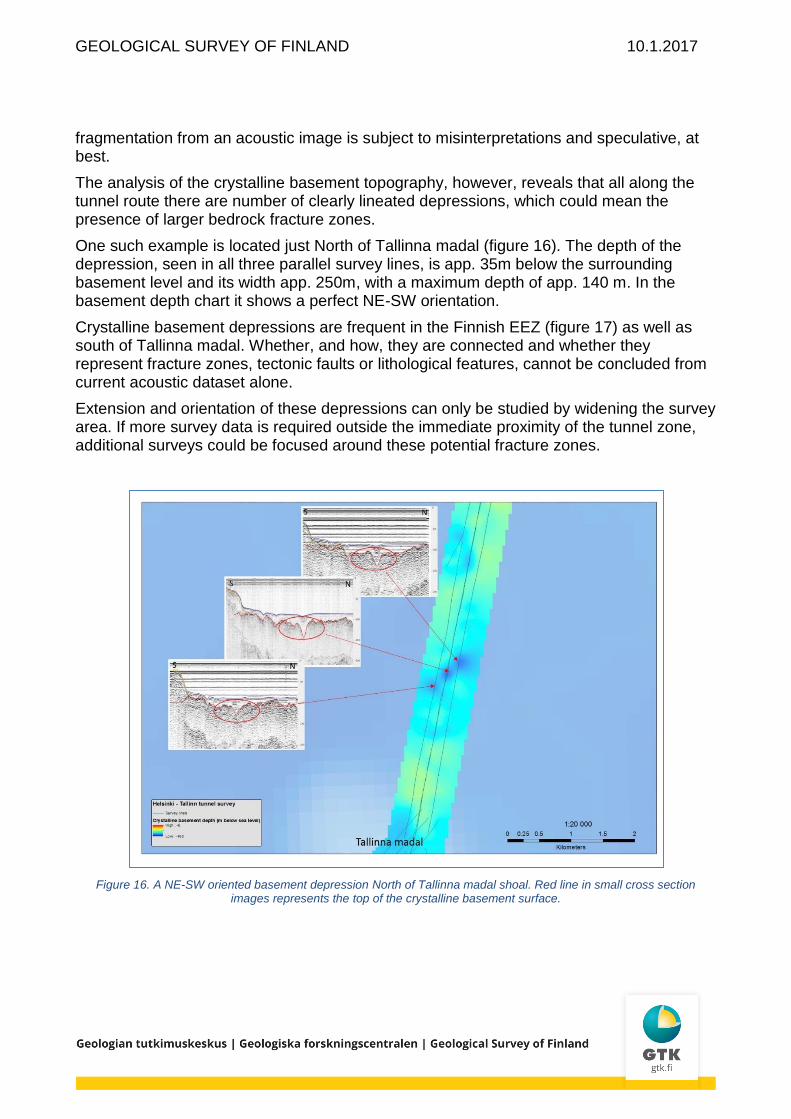
The analysis of the crystalline basement topography, however, reveals that all along the tunnel route there are number of clearly lineated depressions, which could mean the presence of larger bedrock fracture zones.
One such example is located just North of Tallinna madal (figure 16). The depth of the depression, seen in all three parallel survey lines, is app. 35m below the surrounding basement level and its width app. 250m, with a maximum depth of app. 140 m. In the basement depth chart it shows a perfect NE-SW orientation.
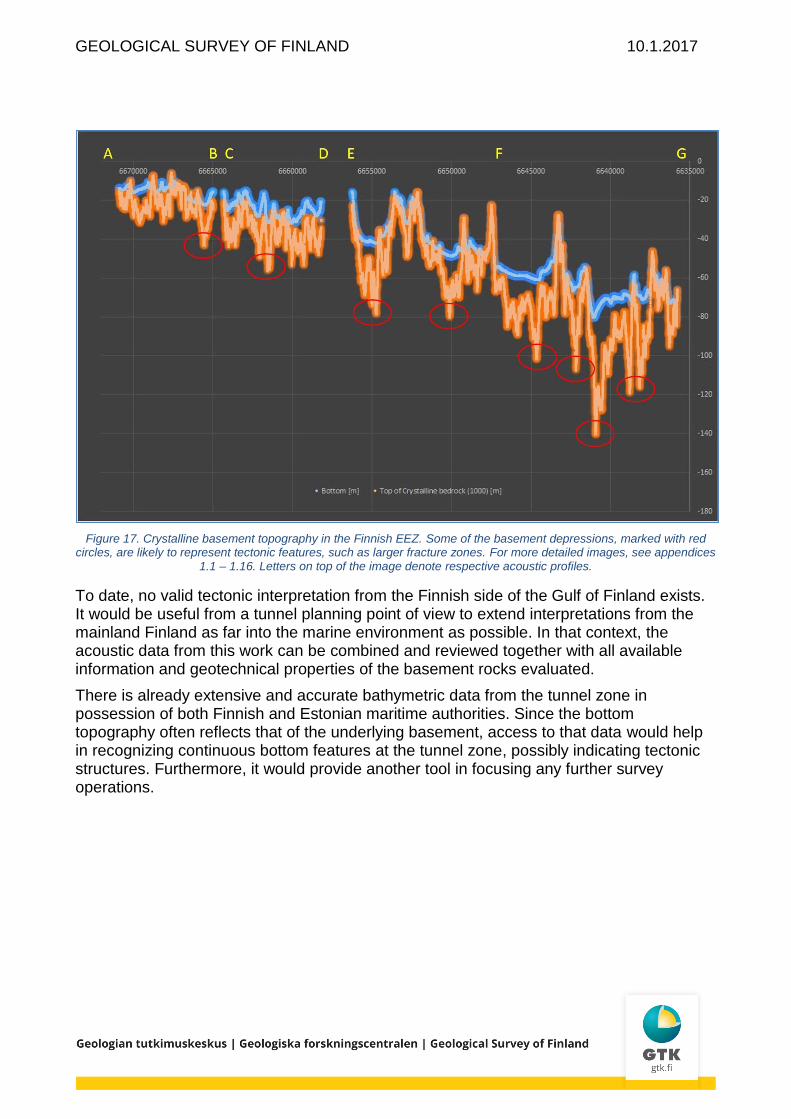
Crystalline basement depressions are frequent in the Finnish EEZ (figure 17) as well as south of Tallinna madal. Whether, and how, they are connected and whether they represent fracture zones, tectonic faults or lithological features, cannot be concluded from current acoustic dataset alone.
Extension and orientation of these depressions can only be studied by widening the survey area. If more survey data is required outside the immediate proximity of the tunnel zone, additional surveys could be focused around these potential fracture zones.
Figure 16. A NE-SW oriented basement depression North of Tallinna madal shoal. Red line in small cross section images represents the top of the crystalline basement surface.
GEOLOGICAL SURVEY OF FINLAND 10.1.2017
Figure 17. Crystalline basement topography in the Finnish EEZ. Some of the basement depressions, marked with red circles, are likely to represent tectonic features, such as larger fracture zones. For more detailed images, see appendices
1.1 – 1.16. Letters on top of the image denote respective acoustic profiles.
To date, no valid tectonic interpretation from the Finnish side of the Gulf of Finland exists. It would be useful from a tunnel planning point of view to extend interpretations from the mainland Finland as far into the marine environment as possible. In that context, the acoustic data from this work can be combined and reviewed together with all available information and geotechnical properties of the basement rocks evaluated.
There is already extensive and accurate bathymetric data from the tunnel zone in possession of both Finnish and Estonian maritime authorities. Since the bottom topography often reflects that of the underlying basement, access to that data would help in recognizing continuous bottom features at the tunnel zone, possibly indicating tectonic structures. Furthermore, it would provide another tool in focusing any further survey operations.
GEOLOGICAL SURVEY OF FINLAND 10.1.2017
7 SUMMARY
Geological Survey of Finland conducted acoustic-seismic survey of the proposed Helsinki- Tallinn railway tunnel route. The work was done with R/V Geomari between 19.8. - 1.11. 2016. The purpose of the work was to interpret the depth of the crystalline basement from the acoustic data along the different route options.
Data was collected from 2-3 parallel lines with 100- 150m line spacing. Some survey lines near the Estonian coast were excluded from interpretation because of excessive acoustic resonance. Results are presented in the form of acoustic cross sections, crystalline basement depth map and a marine geological surface substrate map. Interpreted cross sections from all survey lines were exported in tables and stored in the CD ROM, accompanying this report.
The depth of the crystalline basement was established for most survey lines with good accuracy. Near the Estonian coast the thick sediment cover prevented penetration in certain locations and the basement depth could not be interpreted throughout all lines.
Geotechnical interpretations cannot be made from acoustic data only, except for crude estimates of large scale fracture zones, based on basement topography. In order to study these potential fracture zones more closely, additional survey is needed.
The results in this report should be used as a basis for further, more detailed geotechnical studies.
GEOLOGICAL SURVEY OF FINLAND 10.1.2017
References:
Suuroja, S., Suuroja, K., Ploom, K., Kask, A., Soosalu, H. 2012. Tallin- Helsinki- Tunnel soil- and bedrock construction conditions. Compilation of a geological database for the possible Tallinn- Helsinki tunnel area (in Estonian EEZ). Geological Survey of Estonia.