Embed Size (px)
Citation preview

WINTER 2016 SAUDI ARAMCO JOURNAL OF TECHNOLOGY
ABSTRACT
The evaluation of carbonate reservoirs is challenging for dif-
ferent reasons related to stratigraphic and structural features’
heterogeneities. One of the major challenges is the evaluation
of a fracture’s nature, intensity, aperture and extension.
Near and far field evaluation techniques have been utilized
to achieve advanced fracture evaluation and modeling, the
latter being a key factor in successful carbonate reservoir
development.
Resistivity images and cores help in the quantitative anal-
ysis of the near wellbore fracture’s intensity and aperture,
while high resolution seismic data can help to evaluate major
structural features at a larger scale. It is essential to bridge
the gap between the borehole and field scales to further en-
hance evaluation of these fractures.
By using an acquired sonic log and special processing,
deep shear wave imaging (DSWI) can take cross-dipole shear
wave components and use them to “image” reflectors up to
70 ft away from the borehole, whether they are intersecting
the borehole or not. This radial distance coverage — which
was the radius of this investigation — can be even greater
depending on many parameters.
The combination of resistivity imaging and acoustic DSWI
techniques offers a great value added to fractured carbonate
reservoir evaluation. This article discusses a case study and
the lessons learned in a challenging evaluation well where
both techniques were deployed to validate this process with
the goal of enhancing petrophysical and reservoir characteri-
zation models.
Future work will involve the integration of results
achieved using the DSWI technique with both borehole seis-
mic and surface seismic data to enhance the fracture model
and ultimately optimize well placement as well as reservoir
performance.
INTRODUCTION
This introduction presents the concepts, techniques and ap-
plications of far field acoustic imaging of formations away
from a borehole using full waveform acoustic logging data,
as detailed in existing published papers1. The technique has
unique advantages over surface seismic imaging or vertical
seismic profiling, as it provides a higher resolution and better
placement of near borehole structures. Very often it enables
the imaging of acoustic reflectors that cannot be seen by any
seismic technique.
Single-wave imaging (SWI) was first investigated by
Hornby (1989)2, who used acoustic P-waves generated by
a monopole source for this purpose. This type of imaging
can be used to determine an imaged structure’s dip, but the
Acoustics Deep Shear Wave Imaging (DSWI) Analysis in Fractured Carbonate Reservoirs
Mohamed L. Zeghlache, Andre S. Silva, Mohamed Gouda and Ahmed H. Abouzaid
Saudi Aramco: Company General Use
Fig. 1. Acoustic tool in the vicinity of the fracture, transmitter and receiver gathers used for the construction of up-going and down-going reflections1.
Above Bed
Common Receiver
Direct Arrivals Source Array
Receiver Array
Direct Arrivals
Below Bed
Fig. 1. Acoustic tool in the vicinity of the fracture, transmitter and receiver gathers used for the construction of up-going and down-going reflections1.

SAUDI ARAMCO JOURNAL OF TECHNOLOGY WINTER 2016
method does not provide any azimuthal information due to
the uniform radiation of the monopole source and the receiv-
ers of the tool that record omni-directional acoustic energy.
Recent efforts to overcome the restrictions of the monopole
source3 have focused on using azimuthal receivers — with
the omni-directional firing source — for directional sensitiv-
ity, though this limits its use to high frequencies — above 10
kHz — because of the tool size.
The azimuthal acoustic measurement requires both a
directional source and receivers, similar to acoustic dipole
tools. In addition to resolving azimuthal features, dipole
measurements for imaging enable a deeper investigation into
the formation. Orientation, strength and the frequency band
of the dipole source — 2 kHz to 3 kHz for a dipole signal
vs. 10 kHz to 15 kHz for a monopole signal — help achieve
the imaging objective.
Tang and Patterson (2009)4 analyzed in detail the differ-
ent properties of the shear body waves generated by a dipole
source into a formation and studied their implications for
SWI. They modeled and described the propagation of shear
waves from a dipole source into a formation, the reflection
of those waves from borehole structures, and the projection
of these reflected components on the dipole receivers. Most
significantly, they also developed a procedure for estimating reflector azimuth using both in-line (XX and YY) and cross-line components (XY and YX) recorded by a dipole tool, and they demonstrated the viability of this technique on sev-eral field data examples.
Signal processing techniques used to enhance reflection data, procedures for determining reflector azimuth and the applications of these techniques and procedures to real and recent field data acquired in deviated boreholes drilled through a carbonate reservoir, accompanied with other logs, are all described in this article.
PROCESSING METHODOLOGY
The objective of the processing workflow is to map reflec-tors and distances to acoustic discontinuities, fractures, and boundaries around a borehole, determine their extent along a borehole, and gather information about their azimuthal directivity, e.g., the strike of a boundary or fracture. Based on this, dipole SWI analysis can be separated into three ma-jor steps: (a) reflection enhancement, (b) reflectors azimuthal analysis, and (c) migration. The particular order of these steps may depend on the data itself, and all specific tech-niques used for each of those steps may be used in any order
Saudi Aramco: Company General Use
Fig. 2. Radiation patterns of a dipole source in a borehole: (a) illustration of SH and SV waves being radiated by a dipole source directed along axis X in the XZ plane; (b) finite difference calculations of SH and SV amplitudes vs. vertical distance along receiver lines 1 and 2, correspondingly; (c) radiation patterns from the wave data compared to theoretical patterns1.
(a) Dipole source in borehole (b) Calculated shear wave
(c) Radiation Pattern
Fig. 2. Radiation patterns of a dipole source in a borehole: (a) illustration of SH and SV waves being radiated by a dipole source directed along axis X in the XZ plane; (b) finite difference calculations of SH and SV amplitudes vs. vertical distance along receiver lines 1 and 2, correspondingly; (c) radiation patterns from the wave data compared to theoretical patterns1.

WINTER 2016 SAUDI ARAMCO JOURNAL OF TECHNOLOGY
or in combination with techniques from other steps. Details of each step are explained next.
Cross-Diploe Wave Separation
As shown in Fig. 1, during acoustic logging, the signal that is recorded on receivers consists of both direct modes (shown in red) and reflected body waves that come from acoustic discontinuities and boundaries (reflectors) in the formation (shown in green). In the particular case of dipole acoustic logging, direct modes may consist of the borehole guided flexural mode in addition to refracted compressional waves and borehole guided Stoneley waves if the tool is off center. Direct modes are several orders of magnitude higher than re-flected waves, and in the case of SWI, every possible attempt should be made to eliminate or minimize those modes and enhance the reflected signal. The following techniques can be used separately or in combination to improve the signal-to-noise ratio (SNR) of reflected waves.
Separation of reflections from direct arrivals. Because direct waves have a deterministic nature, their slowness along the receiver array can be estimated. One approach to improving
SNR is to estimate the direct waves and subtract them from the total data; the residual data should contain the reflected waves. This method works well in cases where the reflected and direct wave move-outs are different. Alternatively, we can use an FK filter on the data that each of the receivers collected for the whole depth range. The direct waves’ ar-rival time for a single receiver does not vary significantly for different depths. Consequently, those events tend to group around the low values of K in the FK domain and can be re-moved by muting the values with low K in that domain.
Separation of reflected signal into up-going and down-go-ing reflections. The direct wave subtraction described in the previous paragraph must account for the position of the tool relative to the bed. As explained in Tang et al. (2007)5, to effectively estimate the reflections for the tool above the bed requires the use of a common receiver gather, which is formed for different source positions and fixed receiver positions — a transmitter gather is often used for thin-bed slowness analysis. At the same time, the common transmitter gather, i.e., the usual arrangement routinely used in acous-tic slowness processing, is used to estimate reflections when the tool is located below the bed. Up-going and down-going reflected wavefields are obtained by processing the receiver gathers.
Reflected signal stacking. Further reflection data enhance-ment and improvement of SNR can be achieved if the ap-proximate dip information for the target is available, as outlined in Tang et al. (2007)5. This stacking process can use an approximate or even an inaccurate dip value. The process also can be iterative, i.e., we can first use a roughly esti-mated angle to obtain the structural image of the formation, get our next estimation of angle from this image, and repeat the process to refine the result. The initial estimate for the dip angle can be obtained from the dip log or based on mi-gration results from a single receiver. Alternatively, common midpoint stacking may be used for structures that are nearly parallel to the borehole, and dip move-out stacking may be used if the structure’s angle varies considerably along the depth interval of interest.
Cross-Dipole Shear Wave Image Analysis
As shown in Fig. 2, a dipole source aligned along the X axis in the XZ plane radiates two types of shear waves into the formation. The first is the vertically polarized shear, SV, aligned with the dipole source; the second is the horizontally polarized shear, SH, which is perpendicular to the source along the YZ plane. The formation radiation pattern of both SV and SH components can be analyzed by finite-difference modeling, as shown in the upper right-hand side of Fig. 2. Although the SV radiates shear energy, it has a null or blind spot at 90°. This is in stark contrast with the SH mode,
Saudi Aramco: Company General Use
Fig. 3. SH and SV reflections acquired on dipole receivers from an inclined reflector1.
Fig. 3. SH and SV reflections acquired on dipole receivers from an inclined reflector1.
SAUDI ARAMCO JOURNAL OF TECHNOLOGY WINTER 2016
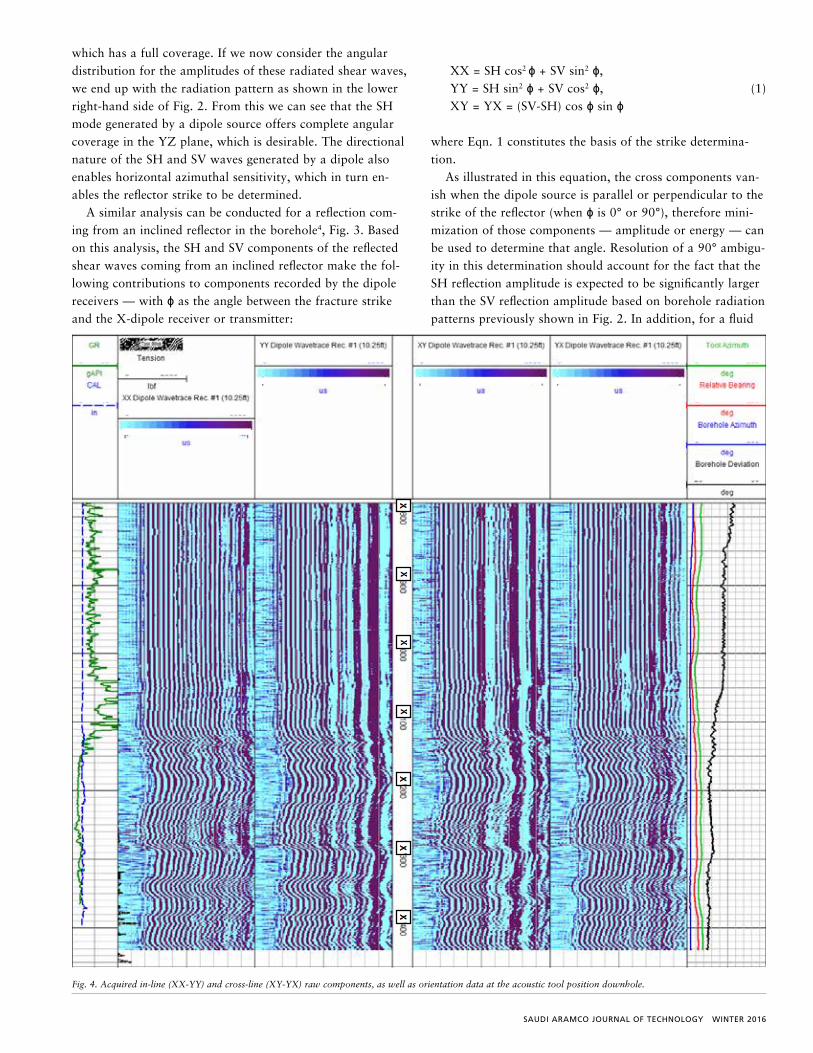
which has a full coverage. If we now consider the angular distribution for the amplitudes of these radiated shear waves, we end up with the radiation pattern as shown in the lower right-hand side of Fig. 2. From this we can see that the SH mode generated by a dipole source offers complete angular coverage in the YZ plane, which is desirable. The directional nature of the SH and SV waves generated by a dipole also enables horizontal azimuthal sensitivity, which in turn en-ables the reflector strike to be determined.
A similar analysis can be conducted for a reflection com-ing from an inclined reflector in the borehole4, Fig. 3. Based on this analysis, the SH and SV components of the reflected shear waves coming from an inclined reflector make the fol-lowing contributions to components recorded by the dipole receivers — with ɸ as the angle between the fracture strike and the X-dipole receiver or transmitter:
XX = SH cos2 ɸ + SV sin2 ɸ,YY = SH sin2 ɸ + SV cos2 ɸ, (1)XY = YX = (SV-SH) cos ɸ sin ɸ
where Eqn. 1 constitutes the basis of the strike determina-tion.
As illustrated in this equation, the cross components van-ish when the dipole source is parallel or perpendicular to the strike of the reflector (when ɸ is 0° or 90°), therefore mini-mization of those components — amplitude or energy — can be used to determine that angle. Resolution of a 90° ambigu-ity in this determination should account for the fact that the SH reflection amplitude is expected to be significantly larger than the SV reflection amplitude based on borehole radiation patterns previously shown in Fig. 2. In addition, for a fluid
Saudi Aramco: Company General Use
Fig. 4. Acquired in-line (XX-YY) and cross-line (XY-YX) raw components, as well as orientation data at the acoustic tool position downhole.
Fig. 4. Acquired in-line (XX-YY) and cross-line (XY-YX) raw components, as well as orientation data at the acoustic tool position downhole.

WINTER 2016 SAUDI ARAMCO JOURNAL OF TECHNOLOGY
filled fracture, the SH wave parallel is completely reflected
while part of the SV wave energy is partially transmitted
through the fracture due to conversion. Equation 1 can also
be used to rotate dipole components in one particular direc-
tion to obtain SH and SV reflections coming from that direc-
tion. This is particularly useful in the case of deviated wells
where reflections can be extracted coming from the high or
low side of the borehole to detect horizontal layering.
Migration
Reflections — both SH and/or SV — can be migrated using
near field slowness to obtain the image of the structures
around the formation. The migrated data represents a 2D
map of the formation; one dimension of this map is the
distance away from the borehole, and the other is the tool
position along it. Different features of the boundaries shown
on this map, such as dip, continuity, etc., can be analyzed to
provide information about geologic structures.
DEEP SHEAR WAVE IMAGING (DSWI) IN A DEVIATED BOREHOLE — CASE STUDY
A well in a carbonate formation was picked for this study to
evaluate the major features (reflectors) up to 70 ft away from
the deviated borehole using the DSWI processing techniques
previously described to map the near borehole environment
for fractures, faults and/or bedding boundaries, as well as
the nature of their extension far away from the borehole.
Therefore, the initial logging plan was to acquire the full-
wave acoustic dataset plus high resolution resistivity images.
Within the radius extending 70 ft away from the borehole,
Saudi Aramco: Company General Use
Fig. 5. Migrated (XX) DSWI in the vertical plane, with and up-going and down-going SH reflections shown to the left and right, respectively. A major feature intersected by the drilled deviated borehole is seen up to 25 ft away from the borehole and with almost 20° relative bed to the deviated borehole. By magnifying the intersection point, the high resolution resistivity imager shows the event in detail near the borehole as a set of conductive fractures with varying angles and directions. Such a gather of features acts as a major reflector, which is resolved clearly on DSWI.
20°
Fig. 5. Migrated (XX) DSWI in the vertical plane, with and up-going and down-going SH reflections shown to the left and right, respectively. A major feature intersected by the drilled deviated borehole is seen up to 25 ft away from the borehole and with almost 20° relative bed to the deviated borehole. By magnifying the intersection point, the high resolution resistivity imager shows the event in detail near the borehole as a set of conductive fractures with varying angles and directions. Such a gather of features acts as a major reflector, which is resolved clearly on DSWI.

SAUDI ARAMCO JOURNAL OF TECHNOLOGY WINTER 2016
other reflectors — not intersecting the borehole — can be
also monitored, and they show what can be considered as a
major feature away from the borehole. The following sec-
tions explain the different phases of this analysis.
Pre-analysis
Figure 4 displays raw in-line and cross-line dipole compo-
nents (XX, YY, XY and YX) in Tracks 2, 3, 4 and 5, re-
spectively, while the orientation curves at the acoustic tool
downhole position are displayed in the last track for the pur-
pose of pre-processing quality control. As the final result of
this analysis is azimuthal dependent, the importance of de-
tailed investigation of orientation with a device that acquires
raw data throughout the logged interval is clear, especially
when considering a deviated borehole. The DSWI, used in
combination with the post-processed resistivity imaging and
azimuthal acoustic anisotropy (as assistive tools), will bring
the benefit of optimum monitoring of reflectors, especially
those that have been intersected by the drilled borehole.
Resistivity imaging of raw data was also investigated for
quality and consistency, given the conductive borehole acqui-
sition environment.
Analysis and Integration
Applying the previously mentioned processing techniques,
and to obtain proper migrated images that clearly differenti-
ate between reflector types, fractures/faults or bed boundar-
ies, the two orthogonal planes (XX and YY) were processed
with different parameters. This occurred after the initial
DSWI processing step, which showed both types of reflectors
Saudi Aramco: Company General Use
Fig. 6. Migrated (XX) DSWI in the vertical plane, correlated to the monopole down-going and up-going reflections shown to the left and right, respectively (plot at the upper right). Azimuthal anisotropy analysis also shows alterations in the shear waves adjacent to this event, (plot at the lower right).

WINTER 2016 SAUDI ARAMCO JOURNAL OF TECHNOLOGY
on both axes, at different depth intervals and with a differ-
ent relative dip to the deviated borehole. The next step was
to refer each reflector type to one of the axes for better inter-
pretation of the reflector’s nature and its dip relative to the
drilled borehole.
Figure 5 shows the vertical plane processed (XX) migrated
image in a radial extent up to 70 ft away from the borehole,
the area within which visible fractures are being mapped,
Track 4. To the left and right of the (XX) migrated image
are the vertical plane up-going and down-going dipole SH
reflections, Tracks 3 and 5, respectively, displayed in trav-
eltime units. In this interval, the borehole deviation ranges
between 40° to 45°, Track 1. A major feature is seen to be
intersected by the drilled borehole, with almost 20° of inci-
dent angle; 70° was used as the true dip angle in the stacking
of the reflected SH signals while processing, so this feature
dips approximately 20° relative to the drilled borehole. The
true dip of this event to the drilled borehole is clearly shown
in the interpretation of the borehole resistivity image. The
scale of the magnified dynamic resistivity image is displayed
to show the correlation with the DSWI at the point of inter-
section. This provides more evidence of the value of having
the means to integrate near and far borehole resistivity and
the DSWI imagers.
Saudi Aramco: Company General Use
Fig. 6. Migrated (XX) DSWI in the vertical plane, correlated to the monopole down-going and up-going reflections shown to the left and right, respectively (plot at the upper right). Azimuthal anisotropy analysis also shows alterations in the shear waves adjacent to this event, (plot at the lower right). Fig. 7. Migrated (XX) DSWI at different intervals. Events away from the borehole are apparent parallel to the main reflector (intersected by the borehole), while the dotted traces are showing the almost nonparallel and scattered nature of these features.
Fig. 7. Migrated (XX) DSWI at different intervals. Events away from the borehole are apparent parallel to the main reflector (intersected by the borehole), while the dotted traces are showing the almost nonparallel and scattered nature of these features.

SAUDI ARAMCO JOURNAL OF TECHNOLOGY WINTER 2016
In addition to the DSWI and resistivity imager combina-tion, we analyzed the data recorded with monopole firing to produce a separation of the up-going and down-going reflec-tions, as well as direct monopole arrivals.
In the center section of Fig. 6, Stoneley reflectivity, for both up-going and down-going waves, tends to indicate the continuity of the event that has been highlighted by shear wave imaging — around X650 ft. DSWI is often “blind” close to the borehole because of the removal of the direct
wave data during processing. Note that close to the bore-hole, the shear wave exhibits anisotropy, Fig. 7 (outer right).
Looking at the vertical plane image across deeper intervals in the borehole, some events that extend almost to the end of the recorded wave trace are not fully characterized and seem to not intersect the borehole. These features, shown on both migrated images (dotted black traces) and up-going and down-going reflections (dotted red traces), exhibit a dip close to one of the reflection events previously discussed, Fig. 5.
Saudi Aramco: Company General Use
Fig. 8. Migrated (YY) DSWI, horizontal plane. Major reflectors (bed boundaries) are almost 40° relative to the 45° deviated borehole. Resistivity image shows the low-angle true dip of these strata. Interval X490 to X560 is magnified to examine the high resolution resistivity image.
40°
Fig. 8. Migrated (YY) DSWI, horizontal plane. Major reflectors (bed boundaries) are almost 40° relative to the 45° deviated borehole. Resistivity image shows the low-angle true dip of these strata. Interval X490 to X560 is magnified to examine the high resolution resistivity image.

WINTER 2016 SAUDI ARAMCO JOURNAL OF TECHNOLOGY
Saudi Aramco: Company General Use
50° 50°
50°
Fig. 9. Deeper interval, migrated (YY) DSWI, horizontal plane. Series of parallel reflectors (bed boundaries) are visible with an almost 50° relative dip to the drilled deviated borehole. The true dip of these strata is the same as the dip of shallower ones (Fig. 8). The change in relative dip is due to the dropped borehole deviation from 45° to almost 35°, on average.
SAUDI ARAMCO JOURNAL OF TECHNOLOGY WINTER 2016
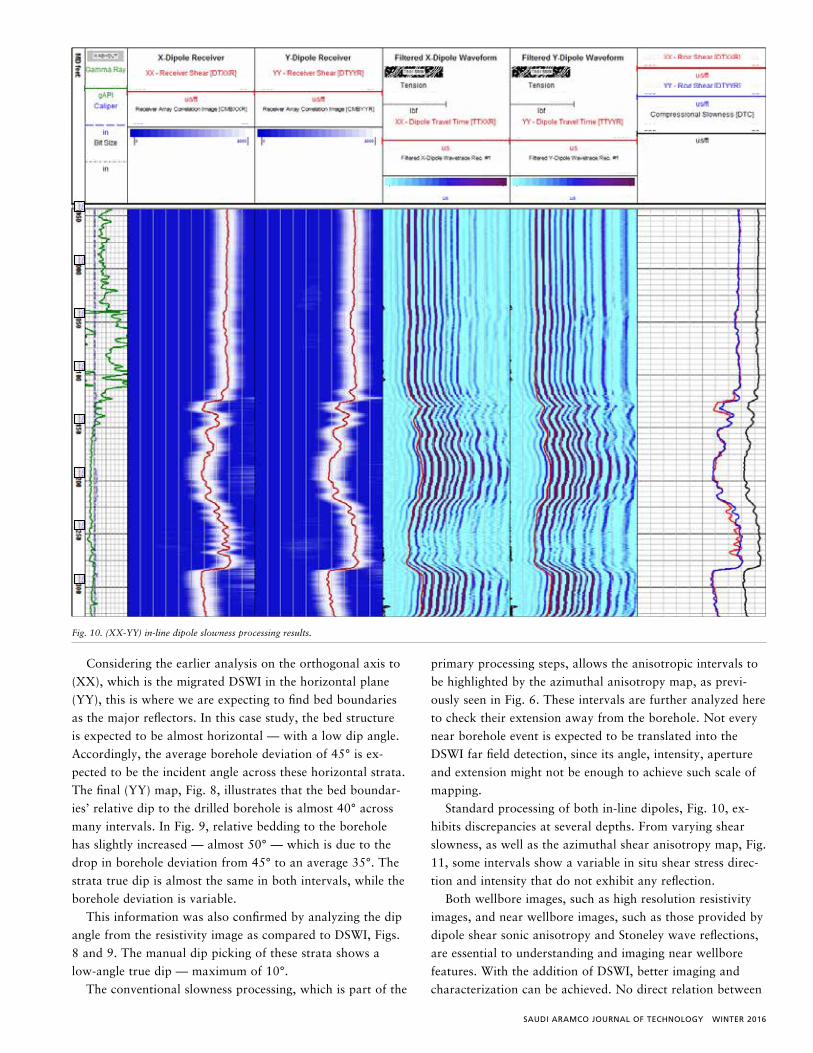
Considering the earlier analysis on the orthogonal axis to
(XX), which is the migrated DSWI in the horizontal plane
(YY), this is where we are expecting to find bed boundaries
as the major reflectors. In this case study, the bed structure
is expected to be almost horizontal — with a low dip angle.
Accordingly, the average borehole deviation of 45° is ex-
pected to be the incident angle across these horizontal strata.
The final (YY) map, Fig. 8, illustrates that the bed boundar-
ies’ relative dip to the drilled borehole is almost 40° across
many intervals. In Fig. 9, relative bedding to the borehole
has slightly increased — almost 50° — which is due to the
drop in borehole deviation from 45° to an average 35°. The
strata true dip is almost the same in both intervals, while the
borehole deviation is variable.
This information was also confirmed by analyzing the dip
angle from the resistivity image as compared to DSWI, Figs.
8 and 9. The manual dip picking of these strata shows a
low-angle true dip — maximum of 10°.
The conventional slowness processing, which is part of the
primary processing steps, allows the anisotropic intervals to
be highlighted by the azimuthal anisotropy map, as previ-
ously seen in Fig. 6. These intervals are further analyzed here
to check their extension away from the borehole. Not every
near borehole event is expected to be translated into the
DSWI far field detection, since its angle, intensity, aperture
and extension might not be enough to achieve such scale of
mapping.
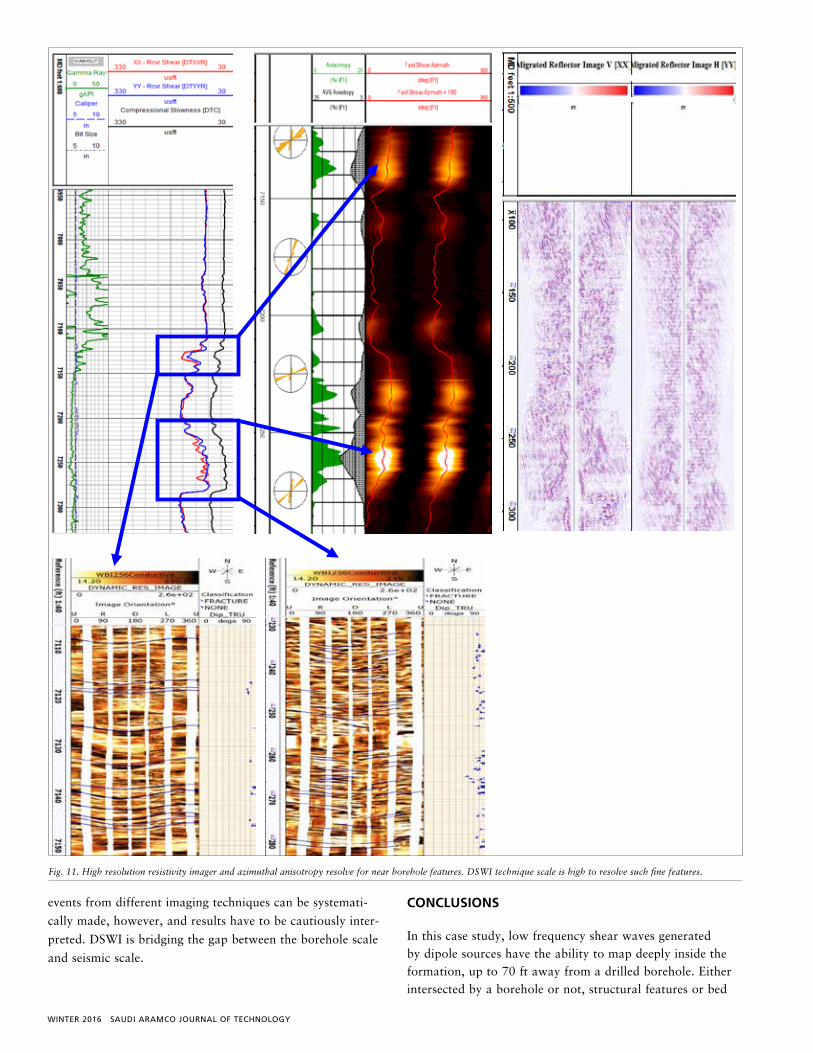
Standard processing of both in-line dipoles, Fig. 10, ex-
hibits discrepancies at several depths. From varying shear
slowness, as well as the azimuthal shear anisotropy map, Fig.
11, some intervals show a variable in situ shear stress direc-
tion and intensity that do not exhibit any reflection.
Both wellbore images, such as high resolution resistivity
images, and near wellbore images, such as those provided by
dipole shear sonic anisotropy and Stoneley wave reflections,
are essential to understanding and imaging near wellbore
features. With the addition of DSWI, better imaging and
characterization can be achieved. No direct relation between
Saudi Aramco: Company General Use
Fig. 9. Deeper interval, migrated (YY) DSWI, horizontal plane. Series of parallel reflectors (bed boundaries) are visible with an almost 50° relative dip to the drilled deviated borehole. The true dip of these strata is the same as the dip of shallower ones (Fig. 8). The change in relative dip is due to the dropped borehole deviation from 45° to almost 35°, on average.
Fig. 10. (XX-YY) in-line dipole slowness processing results.
Fig. 10. (XX-YY) in-line dipole slowness processing results.
WINTER 2016 SAUDI ARAMCO JOURNAL OF TECHNOLOGY
events from different imaging techniques can be systemati-
cally made, however, and results have to be cautiously inter-
preted. DSWI is bridging the gap between the borehole scale
and seismic scale.
CONCLUSIONS
In this case study, low frequency shear waves generated by dipole sources have the ability to map deeply inside the formation, up to 70 ft away from a drilled borehole. Either intersected by a borehole or not, structural features or bed
Saudi Aramco: Company General Use
Fig. 11. High resolution resistivity imager and azimuthal anisotropy resolve for near borehole features. DSWI technique scale is high to resolve such fine features.
Fig. 11. High resolution resistivity imager and azimuthal anisotropy resolve for near borehole features. DSWI technique scale is high to resolve such fine features.

SAUDI ARAMCO JOURNAL OF TECHNOLOGY WINTER 2016
boundaries can be mapped. The integration of this mapping with near borehole imaging techniques enables a more de-tailed analysis. This case study investigates this combination in a deviated borehole, considering as well the optimization of available tools to explore geological features and het-erogeneities in a borehole’s near and far environment. The DSWI technique has the advantage of mapping features that might be difficult to resolve with seismic analysis, given that the frequency scale of DSWI provides visibility over more details as well as higher resolution.
ACKNOWLEDGMENTS
The authors would like to thank the management of Saudi Aramco and Baker Hughes for their support and permission to publish this article.
This article was presented at the SPE Kingdom of Saudi Arabia Annual Technical Symposium and Exhibition, Dammam, Saudi Arabia, April 25-28, 2016.
REFERENCES
1. Bolshakov, A.O., Patterson, D.J. and Lan, C.: “Deep Fracture Imaging Around the Wellbore Using Dipole Acoustic Logging,” SPE paper 146769, presented at the SPE Annual Technical Conference and Exhibition, Denver, Colorado, October 30-November 2, 2011.
2. Hornby, B.E.: “Imaging of Near-Borehole Structure Using Full-Waveform Sonic Data,” Geophysics, Vol. 54, Issue 6, June 1989, pp. 747-757.
3. Haldorsen, J.B.U., Borland, W., Al Rougha, H.A.B., Sultan, A. and Meehan, R.: “Azimuthal Sonic Imaging,” paper presented at the 67th EAGE Annual Conference and Exhibition, Madrid, Spain, June 13-16, 2005.
4. Tang, X.M. and Patterson, D.J.: “Single-Well S-Wave Imaging Using Multicomponent Dipole Acoustic-Log Data,” Geophysics, Vol. 74, Issue 6, November-December 2009, pp. WCA211-WCA223.
5. Tang, X.M., Zheng, Y. and Patterson, D.J.: “Processing Array Acoustic Logging Data to Image Near-Borehole Geologic Structures,” Geophysics, Vol. 72, Issue 2, March 2007, pp. E87-E97.
WINTER 2016 SAUDI ARAMCO JOURNAL OF TECHNOLOGY
BIOGRAPHIES
Mohamed L. Zeghlache is currently a Senior Petrophysicist in the Southern Area Petrophysical Unit with Saudi Aramco’s Reservoir Description and Simulation Department. Since joining Saudi Aramco, he has been responsible for formation evaluation
and well placement for Ghawar carbonate oil fields and Central Arabia clastic oil fields; he is also a member of the South Ghawar Asset Team. Mohamed has 14 years of experience in the oil and gas industry and has worked with both Schlumberger and Halliburton in various positions, including as a Wireline Field Engineer, Log Analyst and Business Development and Technical Advisor.
He has authored several Society of Petroleum Engineers (SPE) papers.
Mohamed received his M.S. degree in Reservoir Engineering and Field Development from the French Petroleum Institute, Paris, France.
Andre S. Silva is a Senior Petroleum Engineer working in Saudi Aramco’s Reservoir Description Department. He is currently serving as the Lead Petrophysicist for the Southern Area Petrophysics Unit. Andre’s experience includes time spent working at
Halliburton Energy Service and Baker Atlas.He has authored several technical papers. Andre is
a member of the Society of Petroleum Engineers (SPE) and the Society of Petrophysicists and Well Log Analysts (SPWLA).
In 1990, he received a B.S. degree in Geology from the University of Rio de Janeiro, Rio de Janeiro, Brazil, in 1990.
Mohamed Gouda is currently a Geoscience Advisor and the Wellbore Imaging Team Lead of the Geoscience and Petroleum Engineering Department at Baker Hughes Saudi Arabia. He has more than 16 years of experience in the oil industry, working
in various technical and managerial positions in the areas of mud logging and logging while drilling (LWD) field operations, petrophysics, geology, reservoir engineering and borehole geomechanics. Mohamed’s field of focus includes formation evaluation and LWD applications, geology and wellbore imaging with different technologies.
He is the author or coauthor of more than five published papers covering many aspects of drilling,
Mohamed is a member of the Society of Petroleum Engineers (SPE) and the Society of Petrophysicists and Well Log Analysts (SPWLA).
He received his B.S. degree in Geology and Chemistry at Cairo University, Giza, Egypt.
Ahmed H. Abouzaid is currently a Petrophysics Team Leader at Baker Hughes – Reservoir Development Services in Saudi Arabia. He has more than 14 years of experience in the oil industry, working in various technical positions in the areas of operation
geology, petrophysics, rock physics and seismic petrophysics. Ahmed has completed several integrated studies for clastics carbonate reservoirs in the Middle East, i.e., Egypt, Kuwait, the Kingdom of Saudi Arabia, Pakistan, Iran, Syria, Sudan and Libya.
He is a member of the Society of Petroleum Engineers (SPE) and the Society of Petrophysicists and Well Log Analysts (SPWLA).
Ahmed received his B.S. degree in Geology from South Valley University, Qena, Egypt.