Embed Size (px)
Citation preview

ACP Market ReportFourth Quarter 2020

Table of Contents
Fourth Quarter Highlights ........................................................................................................................................................................... 3
U.S. Wind Power Capacity Growth ..................................................................................................................................................... 5 • Quarterly U.S. Wind Power Capacity Installations ................................................................................................................... 6 • U.S. Annual and Cumulative Wind Power Capacity Installations .................................................................................. 7 • Wind Power Capacity Installations in 2020 ................................................................................................................................... 8 • Top Owners of 2020 Wind Power Additions ................................................................................................................................. 9 • Wind Power Capacity Under Construction or in Advanced Development ........................................................... 10 • Operational Wind Power Capacity, by State ................................................................................................................................ 11 • Wind Power Capacity Under Construction and in Advanced Development, by State ................................. 12 • Wind Power Pipeline, by State .............................................................................................................................................................. 13 • Wind Power Pipeline, Top States ........................................................................................................................................................ 14
U.S. Offshore Wind Energy Activity ................................................................................................................................................. 15 • Fourth Quarter Offshore U.S Wind Energy Activity ............................................................................................................... 16
Wind Power Procurement Activity ................................................................................................................................................... 17 • Wind Power Capacity Offtake Status ............................................................................................................................................... 18 • Quarterly Wind Power Purchase Agreements .......................................................................................................................... 19
Wind Turbine Market Trends .................................................................................................................................................................. 20 • Wind Turbine Manufacturer Market .................................................................................................................................................. 21
U.S. Utility Solar and Battery Storage Market ............................................................................................................................... 22 • U.S. Annual and Cumulative Utility Solar Power Capacity Growth ............................................................................ 23 • Operational Utility Solar Power, by State ...................................................................................................................................... 24 • U.S. Annual and Cumulative Utility Battery Storage Capacity Growth .................................................................... 25 • Operational Utility Battery Storage Capacity, by State ........................................................................................................ 26
American Clean Power | ACP Market Report Fourth Quarter 2020 2

Fourth Quarter Highlights
American Clean Power | ACP Market Report Fourth Quarter 2020 3

2020 Wind Project Installations • The U.S. wind industry installed 10,593 MW of new
wind power capacity in the fourth quarter of 2020, the highest quarter on record. In fact, more wind was installed at the end of 2020, then any other year except 2012.
• 2020 was a banner year for the wind industry. Developers commissioned 16,913 MW, representing an 85 percent increase over 2019.
• Project owners commissioned 54 new projects across 20 states in the fourth quarter. Texas led with 2,197 MW installed, followed by Wyoming (895 MW), Oklahoma (866), Iowa (861 MW), and Missouri (786 MW).
• There are now 122,468 MW of operating wind power capacity in the United States, with over 60,000 wind turbines operating across 41 states and two U.S. territories.
Wind Capacity Under Construction and in Advanced Development
• Projects totaling 34,757 MW were under construction (17,302 MW) or in advanced development (17,455 MW) at the end of December.
• Projects totaling 3,334 MW started construction in the fourth quarter and 500 MW entered advanced development.
• There are currently 10 states with over 1,000 MW in the near-term pipeline. Federal waters host 26% of the total development pipeline, followed by Texas (13%), Wyoming (10%), Oklahoma (7%), and Kansas (5%).
Wind Power Procurement Activity • Project developers and power purchasers reported
700 MW of new PPAs in the fourth quarter, bringing PPA activity for the year to 5,444 MW.
• Corporate PPA activity declined this quarter, with only one announcement of 200 MW.
Turbine Technology Trends • GE Renewable Energy led turbine installations in
2020, capturing 53% of the market through December. Vestas ranks second with 35%, followed by Siemens Gamesa Renewable Energy with 10% and Nordex USA with 3%.
• Project owners completed 2,899 MW of partial repowerings in 2020. GE Renewable Energy led this market segment as well, repowering 2,086 MW. Vestas repowered 774 MW and Siemens Gamesa repowered 39 MW in the year.
Fourth Quarter Highlights
American Clean Power | ACP Market Report Fourth Quarter 2020 4

U.S. Wind Power Capacity Growth
American Clean Power | ACP Market Report Fourth Quarter 2020 5

Quarterly U.S. Wind Power Capacity Installations• The U.S. wind industry commissioned 10,593 MW of wind power capacity in the fourth quarter of 2020, the highest quarter on record. • Wind capacity additions were up 94% in the fourth quarter of 2020 compared to the same period last year. This year broke the record for capacity installations.• More wind power was installed in the fourth quarter of 2020 than any other year except for 2012.
U.S. WIND POWER CAPACITY GROWTH
5391,118
1,912
2217 333 520
2,000
406
841
1,821
704
1,050
1,213
0
619
1,661
310 351
626 899
2,554
673
1,207
1,834
70419
1,603
895534 612
1,927 1,934
3,299 3,230
8,382
1,016
3,603
4,998
6,480
4,125
5,9455,465
10,593
0
2000
4000
6000
8000
10000
12000
2010 2011 2012 2013 2014 2015 2016 2017 2018 2019 2020
Chart Title
Q1 Q2 Q3 Q4
12,000
10,000
8,000
6,000
4,000
2,000
0
Win
d P
ower
Cap
acity
(MW
)
American Clean Power | ACP Market Report Fourth Quarter 2020 6

U.S. Annual and Cumulative Wind Power Capacity Growth • Wind power installations set a new highwater mark in 2020 as the industry commissioned 16,913 MW. • There are now 122,468 MW of wind energy operating in the United States, with over 60,000 wind turbines spinning across 41 states and two U.S. territories.
U.S. WIND POWER CAPACITY GROWTH
0
2000
4000
6000
8000
10000
12000
14000
16000
18000
2000 2001 2002 2003 2004 2005 2006 2007 2008 2009 2010 2011 2012 2013 2014 2015 2016 2017 2018 2019 2020
Annual Gross Capacity Installations
Annual Gross Capacity Installations
9,046
16,000
14,000
12,000
10,000
8,000
6,000
4,000
2,000
0
120,000
100,000
80,000
60,000
40,000
20,000
0
40,346
122,468
Cum
ulative Wind P
ower C
apacity (MW
)A
nnua
l Win
d P
ower
Cap
acity
Add
ition
s (M
W)
Annual Gross Capacity Installations Cumulative Capacity
73,891
American Clean Power | ACP Market Report Fourth Quarter 2020 7

Wind Repowers• Project owners partially repowered 31 wind phases in 2020. After repowering these projects now total 2,899 MW.• Partial repowering activity was flat in 2020 compared to 2019, though 130% higher than 2018.• GE Renewable Energy dominated this market, repowering projects totaling 2,086 MW. Vestas followed by repowering 774 MW, including many full nacelle
replacements of legacy Clipper turbines.
U.S. WIND POWER CAPACITY GROWTH
72%
27%
1%
GE Renewable Energy Vestas Siemens Gamesa
7,017 7,5889,137
16,9132,077 1,269
3,008
2,899
0
5,000
10,000
15,000
20,000
25,000
2017 2018 2019 2020
New Installs Repowered Capacity
Cap
acity
(MW
)
NEW INSTALLS AND PARTIAL REPOWERING WIND REPOWERINGS, BY OEM
American Clean Power | ACP Market Report Fourth Quarter 2020 8

Wind Power Capacity Installations in 2020U.S. WIND POWER CAPACITY GROWTH
• Developers installed 54 new wind projects, totaling 10,593 across 20 states during the fourth quarter of 2020. • Texas led with 2,197 MW installed, followed by Wyoming (895 MW), Oklahoma (866), Iowa (861 MW), and Missouri (786 MW). • Year-to-date the industry has added 90 projects across 26 states totaling 16,913 MW. Texas leads installations for the year (4,235 MW), followed by Iowa
(1,498 MW) and Wyoming (1,123 MW).
RICT
MA
HI28
ALMS
AR
LA
GA
KYVA
NC
SC
FL
NV
AZ350
DEMD
NH
NJ
TN
UT
VT
PR
AK
MO1,028
IL1,059
IN651
WI MI493
NY
IA1,498
MN455
KS896
ND343
CA111
CO910
ID
NE393
NM770
SD774
OH126
OK866
PA
TX4,235
OR310
WA287
WY1,123
GU
■ 1 to 100MW ■ >100 MW to 250MW ■ 250MW to 500MW ■ >500MW to 1,000MW ■ >1,000MW
Federal Waters
ME73MT
80
WV56
American Clean Power | ACP Market Report Fourth Quarter 2020 9

Top Owners of 2020 Wind Power Additions• Three companies added more than 5,540 MW to their portfolios this year—NextEra, Xcel Energy, and Berkshire Hathaway Energy. NextEra leads the group
after bringing online 13 wind projects totaling 2,898 MW. • Xcel delivered five projects this year, including New Mexico’s largest wind farm to date, the 522 MW Sagamore Wind project and the second largest single
phase wind project, Cheyenne Ridge (496 MW). • Berkshire Hathaway brought nine projects online in 2020, eight of which came online in the fourth quarter with a combined capacity of 1,162 MW. • The top ten owners of 2020 represent 62% of the wind power capacity brought online.
U.S. WIND POWER CAPACITY GROWTH
NextEra Energy2,898
Xcel Energy1,420
Berkshire Hathaway Energy1,223
ENGIE1,108
RWE Renewables
720
Alliant Energy684
Orsted Wind Power
676
Liberty Power
597
Global Infrastructure
Partners569
ALLETE513
Rest of Owners6,505
Chart TitleNextEra Energy Xcel Energy Berkshire Hathaway Energy ENGIE
RWE Renewables Alliant Energy Orsted Wind Power Liberty Power
Global Infrastructure Partners ALLETE Rest of Owners
American Clean Power | ACP Market Report Fourth Quarter 2020 10
RI 75CT 5
MA 120
HI233
ALMS
AR
LA
GA
KYVA
NC 208
SC
FL
NV152
AZ618
DE 2MD 191
NH 214
NJ 9
TN 29
UT391
VT149
PR 125
AK64
MO1,987
IL6,409
IN2,968
WI746 MI
2,681
NY1,987
IA11,660
MN4,299
KS7,016
ND3,989
CA5,922
CO4,692
ID973
NE2,531
NM2,723
SD2,305
OH864
OK9,048
PA1,459
TX33,133
OR3,737
WA3,395
WY2,738
■ 1 to 500MW ■ >500MW to 1,000MW ■ >1,000MW to 2,500MW ■ >2,500MW to 5,000MW ■ >5,000MW to 10,000MW ■ >10,000MW
Federal Waters
ME996MT
880
WV742
Operational Wind Power Capacity, by StateU.S. WIND POWER CAPACITY GROWTH
• The addition of Sagamore Wind (523 MW) allows New Mexico to claim the second largest, single-phase wind project in the country. Texas’ Maverick Creek (492 MW), also placed-in-service this quarter, is the fourth largest, single-phase wind project.
• Currently, 20 states have over 1,000 MW of installed capacity.
American Clean Power | ACP Market Report Fourth Quarter 2020 11

Wind Power Capacity Under Construction or in Advanced Development
U.S. WIND POWER CAPACITY GROWTH
• At the end of December 2020, there were 34,757 MW of wind power capacity in the near-term pipeline, including 17,302 MW under construction and 17,445 MW in advanced development. Total pipeline activity decreased by 20% from the previous quarter due to the record level of commissioning in 2020.
• Despite continued disruptions from COVID-19, project developers announced 3,834 in combined new development activity in the fourth quarter of 2020, with projects totaling 3,334 MW starting construction and an additional 500 MW entering advanced development.
• Developers continue to report challenges raising tax equity for projects in development. Tax equity supply is reported to be tight, due to economic uncertainty, tighter lending standards, and more limited capital allocations.
15,231
18,279
23,28021,344
23,97725,819
29,634 28,731
33,512
37,857 38,056
35,000
39,086
41,775
46,728
44,136 44,94243,628 43,575
34,757
0
5,000
10,000
15,000
20,000
25,000
30,000
35,000
40,000
45,000
50,000
1Q 2016 2Q 2016 3Q 2016 4Q 2016 1Q 2017 2Q 2017 3Q 2017 4Q 2017 1Q 2018 2Q 2018 3Q 2018 4Q 2018 1Q 2019 2Q 2019 3Q 2019 4Q 2019 1Q 2020 2Q 2020 3Q 2020 4Q 2020
Grand Total Under Construction Advanced Development
Win
d P
ower
Cap
acity
(MW
)
WIND POWER PIPELINE OVER TIME
American Clean Power | ACP Market Report Fourth Quarter 2020 12

Wind Power Pipeline, by StateU.S. WIND POWER CAPACITY GROWTH
RICT
MA
HI
ALMS
180
LA
GA
KY
VA77
NC
SC
FL
NV
AZ
DEMD
NH
NJ
TN
UT
VT
PR
AK
MO448
IL1,175
IN500
WI MI775
NY1,650
IA433
MN1,100
KS1,672
ND299
CA421
CO455
ID
NE1,111
NM1,656
SD1,101
OH511
OK2,590
PA
TX4,756
OR241
WA600
WY3,551
■ 1 to 250MW ■ >250MW to 500MW ■ >500 MW to 1,000MW ■ >1,000 MW to 2,000MW ■ >2,000MW
FederalWaters9,079
ME27MT
240
WV110
American Clean Power | ACP Market Report Fourth Quarter 2020 13

3,991
3,496
3,000
2,640 2,623
Invenergy Orsted WindPower
PowerCompany of
Wyoming
Dominion Apex CleanEnergy
Capacity (MW)
Wind Power Pipeline, Top StatesU.S. WIND POWER CAPACITY GROWTH
• The 34,757 MW of combined construction and advanced development activity is spread across 177 project phases in 26 states and 15 project phases in federal waters. • Federal waters host 9,079 MW of total development activity, representing 26% of the total development pipeline. • Texas hosts more activity than any other state with 13% of the pipeline, followed by Wyoming (10%), Oklahoma (7%), Kansas (5%), and New Mexico (4%). • A total of 14 states have over 1,000 MW of wind capacity in the pipeline. • Invenergy is currently the top developer of projects under construction or in advanced development, followed by Orsted and Power Company of Wyoming.
3,406
3,551
2,590
729
556
207
212
911
773
9,079
1,350
943
1,100
1,443
963
200
328
0 1,000 2,000 3,000 4,000 5,000 6,000 7,000 8,000 9,000 10,000
Federal Waters
Texas
Wyoming
Oklahoma
Kansas
New Mexico
New York
Illinois
Nebraska
South Dakota
Under Construction Advanced Development
TOP DEVELOPERS OF NEAR-TERM WIND PIPELINE TOP STATES
Wind Power Capacity (MW)
3,406
3,551
2,590
729
556
207
212
911
773
9,079
1,350
943
1,100
1,443
963
200
328
0 1,000 2,000 3,000 4,000 5,000 6,000 7,000 8,000 9,000 10,000
Federal Waters
Texas
Wyoming
Oklahoma
Kansas
New Mexico
New York
Illinois
Nebraska
South Dakota
Under Construction Advanced Development
American Clean Power | ACP Market Report Fourth Quarter 2020 14

U.S. Offshore Wind Energy ActivityOffshore Wind Updates
American Clean Power | ACP Market Report Fourth Quarter 2020 15
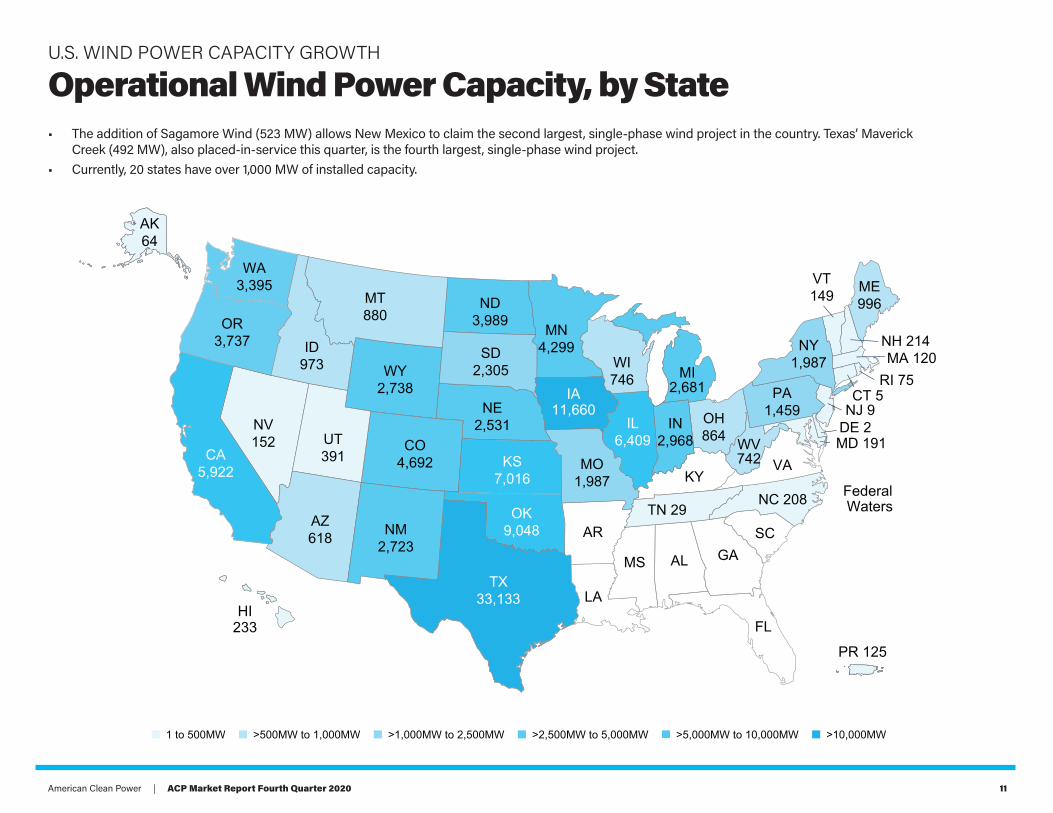
Fourth Quarter U.S. Offshore Wind Energy ActivityU.S. OFFSHORE WIND ENERGY ACTIVITY
• In October Rhode Island announced a competitive request for proposals for up to 600 MW of new offshore wind power.
• On October 29, Gov. Larry Hogan of MD, Gov. Ralph Northam of VA, and Gov. Roy Cooper of NC announced the execution of an offshore wind MOU to partner on coordination of supply chain and administrative processes and regional promotion of the technology—The Southeast and Mid-Atlantic Regional Transformative Partnership for Offshore Wind Energy Resources (SMART-POWER)
• In November, Massachusetts approved contracts for the 804 MW Mayflower Wind Offshore project. The combined price for energy and RECs is $77.76/MWh on a nominal levelized basis for both the Phase 1 and Phase 2 PPAs.
• Vineyard Wind announced in early December that it would temporarily withdraw is construction and operations plan for its 800 MW project off the coast of Massachusetts. Early in 2021, Vineyard rescinded its withdrawal.
• In December, Avangrid Renewables submitted a construction and operations plan (COP) to federal regulators for the first 800 MW phase of its Kitty Hawk offshore wind project, which could eventually grow to 2.4 GW or more if two other phases are eventually built. The first phase aims to start construction by 2024.
• Dominion Energy filed a COP for the 2,640 MW Coastal Virginia Offshore Wind project with BOEM in mid-December. The project is expected to create 900 construction jobs and 1,100 operations jobs.
NY
PA
NJ
VA
NC
MD
MACT
DE
RI
Atlantic Shores O�shore Wind
Ørsted, PSEG
Ocean Wind (1,100 MW)
Vineyard Wind 1(800 MW)
Bay State Wind
Empire Wind (816 MW)
Skipjack Wind Farm (120 MW)
Unnamed Dominion Energy Project (2,640 MW)
Sunrise Wind (880 MW)
MarWin (269 MW)
Avangrid Renewables
Coastal Virginia O�shore Wind (12 MW)
Revolution Wind (704 MW)
May�ower Wind (804 MW)
Equinor
South Fork Wind Farm (130 MW)
Vineyard WindPark City Wind (804 MW)
American Clean Power | ACP Market Report Fourth Quarter 2020 16

Wind Power Procurement Activity
American Clean Power | ACP Market Report Fourth Quarter 2020 17

Wind Power Offtake StatusWIND POWER PROCUREMENT ACTIVITY
• Long-term PPAs remain the most popular offtake mechanism for wind energy, accounting for 55% of new wind power capacity commissioned in the fourth quarter.
• Direct utility ownership of wind power continues to grow, as four utilities commissioned 4,918 MW in 2020. Dominion and AEP lead these direct ownership additions.
• Hedge contracts account for 8% of capacity installed year-to-date, tied to projects in Illinois, Kansas, and Texas. • Over 16 GW of projects underway have a PPA in place, representing just over half of the current pipeline. Utility ownership accounts for 22% of capacity underway,
while merchant hedge and merchant activity represent 2%. The 25% balance have not yet reported an offtake structure. • Utility purchasers (through direct ownership and PPAs) currently account for 70% of capacity under construction or in advanced development. Dominion Energy
leads utilities with over 2,652 MW underway, followed AEP and Eversource Energy.
UTILITYDIRECT
OWNERSHIP (MW)LONG-TERM
CONTRACT (MW)TOTAL
Dominion 2,652 2,652
AEP 1,484 1,484
Eversource Energy 1,245 1,245
Xcel Energy 728 453 1,181
National Grid 1,037 1,037
Top Utilities by Near-Term Wind Project Pipeline
0%
20%
40%
60%
80%
100%
Online 2020 Under construction or advanced development
Power Purchase Agreement Direct Utility Ownership Hedge Contract Merchant Unknown
0%
20%
40%
60%
80%
100%
Online 2020 Under construction or advanced development
Power Purchase Agreement Direct Utility Ownership Hedge Contract Merchant Unknown
8,830 MW
25%
7,480 MW
22%
1,284 MW
8%
885 MW 5%
4,918 MW
29%
9,296 MW
55%
530 MW 3%
647 MW 2%
16,916 MW
49%
805 MW 2%
0%
20%
40%
60%
80%
100%
Online 2020 Under construction or advanced development
Power Purchase Agreement Direct Utility Ownership Hedge Contract Merchant Unknown
American Clean Power | ACP Market Report Fourth Quarter 2020 18

Wind Power Purchase AgreementsWIND POWER PROCUREMENT ACTIVITY
• PPA announcements this quarter continued to be down noticeably from quarterly levels throughout 2018 and 2019, partially due to uncertainty caused by COVID-19. • Project developers and power purchasers announced 700 MW of new PPAs in the fourth quarter, bringing PPA activity for the year to 5,444 MW. • McDonalds Corporation was the only corporation to announce a PPA from October to December. The burger chain signed a PPA for 200 MW from Caddo Wind Farm. • In a reversal from the third quarter utility PPA activity picked up again—two utilities announced wind power contracts totaling 450 MW.
0
500
1000
1500
2000
2500
3000
2013 2013 2013 2013 2014 2014 2014 2014 2015 2015 2015 2015 2016 2016 2016 2016 2017 2017 2017 2017 2018 2018 2018 2018 2019 2019 2019 2019 2020 2020 2020 2020
Utility PPA Corporate or Other Non-Utility PPA Undisclosed Purchaser Column1
0
500
1000
1500
2000
2500
3000
2013 2013 2013 2013 2014 2014 2014 2014 2015 2015 2015 2015 2016 2016 2016 2016 2017 2017 2017 2017 2018 2018 2018 2018 2019 2019 2019 2019 2020 2020 2020 2020
Utility PPA Corporate or Other Non-Utility PPA Undisclosed Purchaser Column1
American Clean Power | ACP Market Report Fourth Quarter 2020 19
Wind Turbine Market Trends
American Clean Power | ACP Market Report Fourth Quarter 2020 20

8,777
5,803
1,680
451
202
0 1,000 2,000 3,000 4,000 5,000 6,000 7,000 8,000 9,000 10,000
GE
Vestas
SGRE
Nordex
Goldwind
Project Capacity (MW)
8,777
5,803
1,680
451
202
0 1,000 2,000 3,000 4,000 5,000 6,000 7,000 8,000 9,000 10,000
GE
Vestas
SGRE
Nordex
Goldwind
Project Capacity (MW)
(1%)
(3%)
(10%)
(53%)
(35%)
Wind Turbine Manufacturer MarketWIND TURBINE MARKET TRENDS
2020 Installations• GE Renewable Energy (GE) led 2020 wind power capacity installations,
capturing 53% of new turbine capacity.
• Vestas ranked second with 35% of installations, followed by Siemens Gamesa Renewable Energy (SGRE) with 10%. Nordex USA represented the remaining 3%.
• On a capacity basis, the majority (71%) of turbines installed in the year are rated between 2 MW to less than 3 MW, while 28%are rated over 3 MW. There are now thirteen projects utilizing 4 MW class turbines totaling 2,229 MW operating in the U.S.
• GE’s 2.82-127 model was the most popular turbine installed this year, accounting for 28% of capacity additions, followed by Vestas’ V120-2.2 andthe GE 2.5-127.
Construction and Advanced Development• For land-based wind projects, GE and Vestas account for 82% of projects
under construction and in advanced development that have reported an OEM. GE currently represents 49% of this market, Vestas represents 33%, and Nordex captures 13%.
• Considering offshore wind projects, SGRE is supplying 68% of projects where an OEM has been reported. GE increased its market share in the fourth quarter capturing 32% of the market.
• Approximately 34% of all projects under construction or in advanced development have not yet reported a turbine manufacturer to ACP.
2020 CAPACITY INSTALLATIONS, BY OEM NEAR-TERM PIPELINE CAPACITY, BY OEM
8,073
5,334
9082,067
9,263
2,020
4,366
2,726
0
2,000
4,000
6,000
8,000
10,000
12,000
14,000
GE Vestas SGRE Nordex Undisclosed
Land-Based Wind Offshore Wind
Win
d P
ower
Cap
acity
(MW
)
8,073
5,334
9082,067
9,263
2,020
4,366
2,726
0
2,000
4,000
6,000
8,000
10,000
12,000
14,000
GE Vestas SGRE Nordex Undisclosed
Land-Based Wind Offshore Wind
American Clean Power | ACP Market Report Fourth Quarter 2020 21

U.S. Utility Solar and Battery Storage Market
American Clean Power | ACP Market Report Fourth Quarter 2020 22

0
5,000
10,000
15,000
20,000
25,000
30,000
35,000
40,000
45,000
50,000
0
2,000
4,000
6,000
8,000
10,000
12,000
2010 2011 2012 2013 2014 2015 2016 2017 2018 2019 2020
CU
MU
LATI
VE C
APAC
ITY
(MW
)
ANN
UAL
CAP
ACIT
Y AD
DITI
ON
S (M
W)
U.S. UTILITY SOLAR AND STORAGE MARKET
U.S. Annual and Cumulative Utility Solar Power Capacity• Wind, solar, and energy storage set annual capacity addition records in 2020. Utility solar additions more than doubled from 2019 as the industry installed 11,158 MW.
This marks a 37% improvement on the previous record set in 2016.• There are now 47,318 MW of operating utility solar power capacity in the country. Cumulative capacity grew 31% year-over-year.• Operating utility solar projects can power the equivalent of 11 million American homes.
Source: ACP, EIA
0
5,000
10,000
15,000
20,000
25,000
30,000
35,000
40,000
45,000
50,000
0
2,000
4,000
6,000
8,000
10,000
12,000
2010 2011 2012 2013 2014 2015 2016 2017 2018 2019 2020
CU
MU
LATI
VE C
APAC
ITY
(MW
)
ANN
UAL
CAP
ACIT
Y AD
DITI
ON
S (M
W)
0
5,000
10,000
15,000
20,000
25,000
30,000
35,000
40,000
45,000
50,000
0
2,000
4,000
6,000
8,000
10,000
12,000
2010 2011 2012 2013 2014 2015 2016 2017 2018 2019 2020
CU
MU
LATI
VE C
APAC
ITY
(MW
)
ANN
UAL
CAP
ACIT
Y AD
DITI
ON
S (M
W)
Annual Gross Capacity Installations Cumulative Capacity
American Clean Power | ACP Market Report Fourth Quarter 2020 23

Operational Utility Solar Power, by StateU.S. UTILITY SOLAR AND STORAGE MARKET
• Forty-seven states and D.C. have operational utility solar power capacity. California leads the solar market with over 13 GW of installed capacity, more than double second placed Texas.
• Nearly 30% of installed utility solar power is in California, followed by Texas (11%), North Carolina (11%), Florida (8%), and Nevada (5%).• In 2020, Texas led solar power additions with 2,852 MW installed. California was in second with 1,726 MW and Florida rounded out the podium with 1,714 MW installed.
Source: ACP, EIA
State Prior-2020 Capacity (MW) 2020 Additions (MW) Total Capacity (MW)
Texas 2,454 2,852 5,306California 11,504 1,726 13,230Florida 2,150 1,714 3,864Virginia 646 844 1,489Georgia 1,470 664 2,134North Carolina 4,567 457 5,024South Carolina 663 400 1,063Arizona 1,846 293 2,138Utah 917 279 1,196Oregon 401 185 585Remaining States 9,543 1,745 11,289
Total 36,160 11,158 47,318
American Clean Power | ACP Market Report Fourth Quarter 2020 24

U.S. Annual and Cumulative Utility Battery Storage Capacity U.S. UTILITY SOLAR AND STORAGE MARKET
• In 2020 battery energy storage broke annual capacity records. Utility battery storage increased over 300% from 2019 as the industry installed 734 MW. • There are now 1,756 MW of operating utility battery energy storage capacity in the U.S. Cumulative capacity grew 72% year-over-year.
Source: ACP, EIA
0
200
400
600
800
1,000
1,200
1,400
1,600
1,800
2,000
0
100
200
300
400
500
600
700
800
2010 2011 2012 2013 2014 2015 2016 2017 2018 2019 2020
CU
MU
LATI
VE C
APAC
ITY
(MW
)
ANN
UAL
CAP
ACIT
Y AD
DIT
ION
S (M
W)
0
5,000
10,000
15,000
20,000
25,000
30,000
35,000
40,000
45,000
50,000
0
2,000
4,000
6,000
8,000
10,000
12,000
2010 2011 2012 2013 2014 2015 2016 2017 2018 2019 2020
CU
MU
LATI
VE C
APAC
ITY
(MW
)
ANN
UAL
CAP
ACIT
Y AD
DITI
ON
S (M
W)
0
5,000
10,000
15,000
20,000
25,000
30,000
35,000
40,000
45,000
50,000
0
2,000
4,000
6,000
8,000
10,000
12,000
2010 2011 2012 2013 2014 2015 2016 2017 2018 2019 2020
CU
MU
LATI
VE C
APAC
ITY
(MW
)
ANN
UAL
CAP
ACIT
Y AD
DITI
ON
S (M
W)
American Clean Power | ACP Market Report Fourth Quarter 2020 25

Operational Utility Battery Storage, by StateU.S. UTILITY SOLAR AND STORAGE MARKET
• Thirty-four states have operational utility battery storage capacity. California hosts the most battery storage with 876 MW of installed capacity, followed by Texas (134 MW), Illinois (133 MW), Massachusetts (81 MW) and Hawaii (63 MW)
• In 2020, California installed the most battery storage additions, bringing online 621 MW. Massachusetts came in second with 48 MW, with Texas coming in third with 20 MW.
• Ten states installed utility-scale battery storage facilities in 2020, with six of those states installing 10 MW or more.
Source: ACP, EIA
State Prior-2020 Capacity (MW) 2020 Additions (MW) Total Capacity (MW)
California 255 621 876Massachusetts 33 48 81Texas 114 20 134New York 33 12 45Indiana 28 10 38Oklahoma 0 10 10North Carolina 1 9 10Georgia 1 1 2Colorado 11 1 12Washington 6 1 7Remaining States 541 0 541
Total 1,022 734 1,756
American Clean Power | ACP Market Report Fourth Quarter 2020 26

American Clean Power is the voice of companies from across the clean power sector that are
powering America’s future, providing cost-effective solutions to the climate crisis while creating
jobs, spurring massive investment in the U.S. economy and driving high-tech innovation across
the nation. We are uniting the power of America’s renewable energy industry to advance our
shared goals and to transform the U.S. power grid to a low-cost, reliable, and renewable power
system. Learn more about the benefits clean power brings to America at www.cleanpower.org.
Twitter / @USCleanPower
LinkedIn / American Clean Power Association