Embed Size (px)
Citation preview

Acquiring socio-economic and business data for neighborhood analysisOpen a web browser and go to:
http://tinyurl.com/tufts-census
Barbara Parmenter
Tufts Geospatial Services

US Census Bureau Collection Methods
Three basic methods of collection Census (100%) Survey (sample) Administrative records

Two Types of Census by the US Decennial census: population and housing
On the 0’s (2000, 2010) Economic census: business and industry
On the 2’s and 7’s (2002, 2007, 2012)
Census = the enumeration of entire population or universe of collection units such as housing units or businesses

Survey Types
Data collected from sample of population, that represents the full population
American Community Survey - monthly Current Population Survey - monthly Survey of Income and Program
Participation - monthly American Housing Survey - every 2
years

Most important for Neighborhood scale analysis:Decennial Census
Once every 10 years 100% count* Very small sampling error Basic information on
population, race/Hispanic ethnicity, age, family structure, housing units, owner/renter housing tenure
American Community Survey Released yearly with
rolling multi-year averages Sample survey High sampling error for
small areas (e.g., neighborhood level)
Detailed information on income, education, commute, place of birth, etc.

Census Geography

Census Blocks

Census Block Groups
Census Tracts

We will focus on:
The American Community Survey (ACS)
How to map census / ACS data in Social Explorer
Understanding sampling error for the ACS
Using Reference USA to get business data for a neighborhood

Let’s take a look at the 2010 Census form…

American Community Survey
Continuous monthly survey Began in 2005 It has replaced the decennial census long
form

Look at the American Community Survey Questionnaire

Think about how people would respond to these questions Accuracy of answers? Would you know when your house was built? Do you know how much you spent for heating
costs? Concerns about privacy?
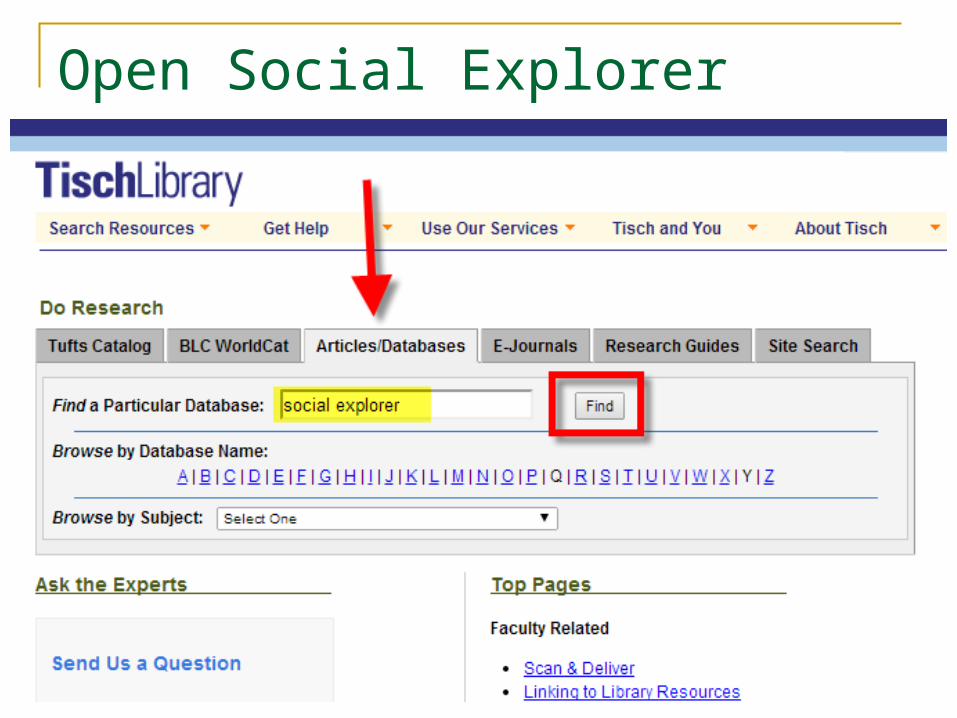
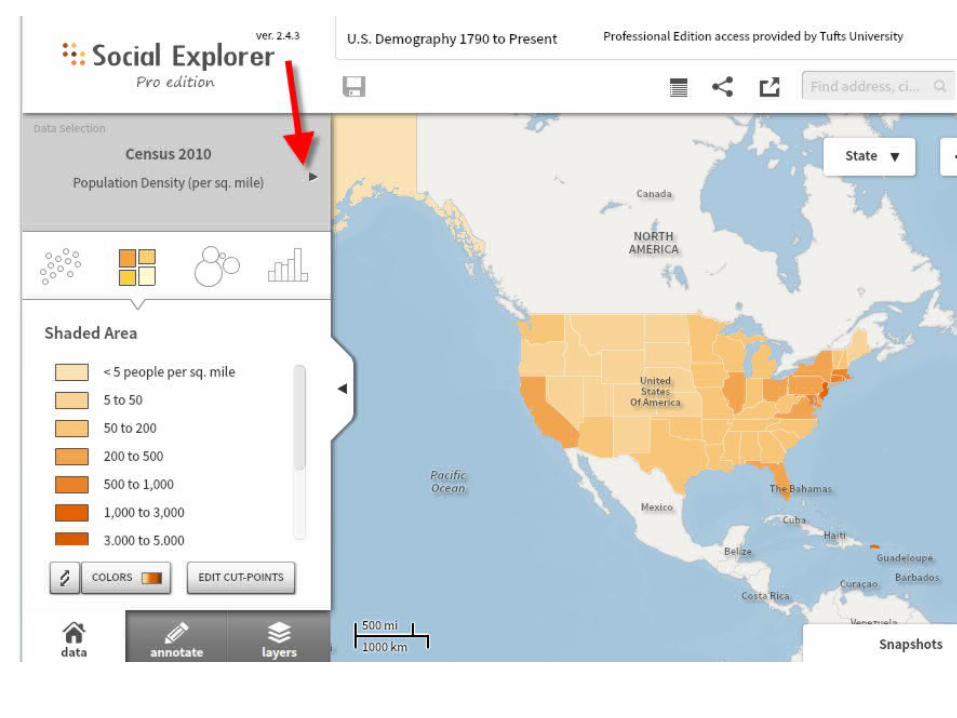
Open Social Explorer

Open Social Explorer

Open Social Explorer

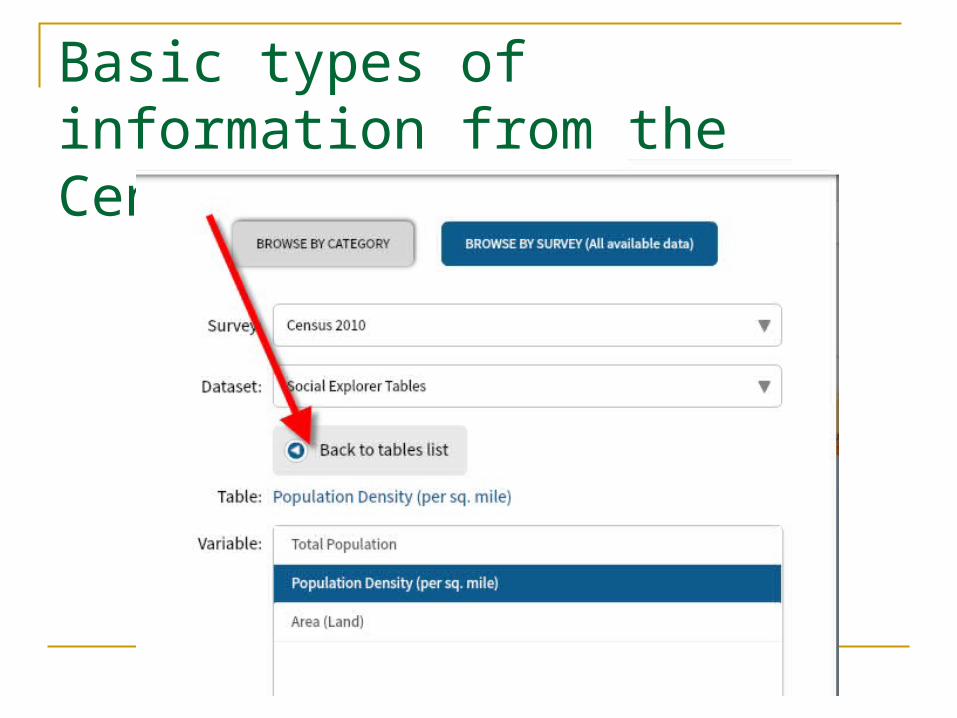
Basic types of information from the Census 100% SF1 data

Explore the basic types of information from the Census 2010 100% data

More Census 2010….
This is all data from the 100% Census

Explore mapping population 85 and older

Explore mapping population 85 and older…

Explore mapping population 85 and older…
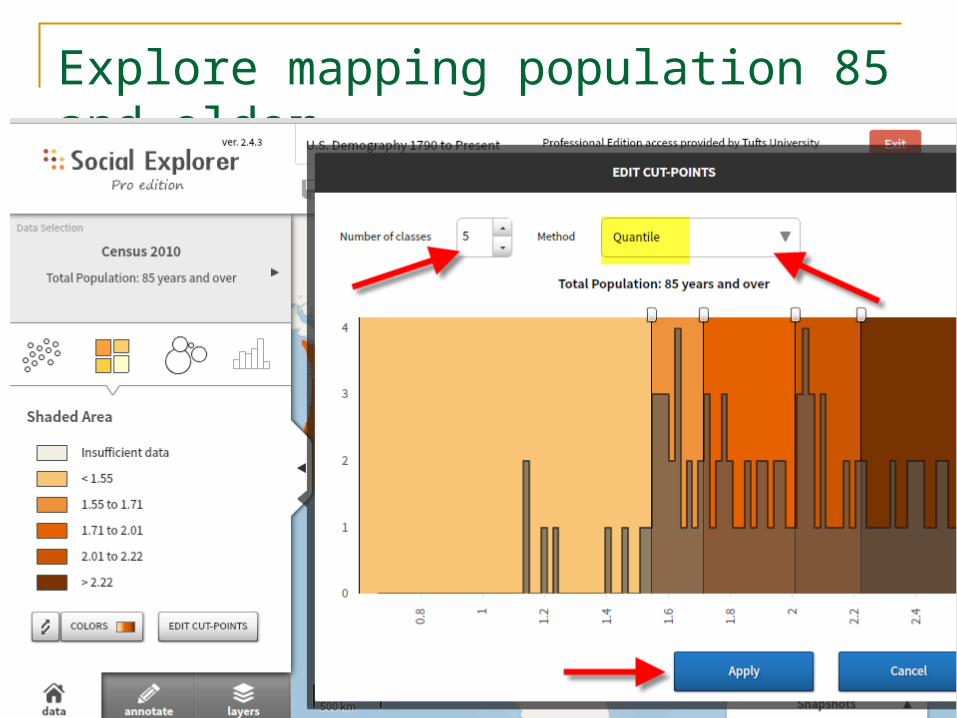
Explore mapping population 85 and older…

Population 85+ by state…

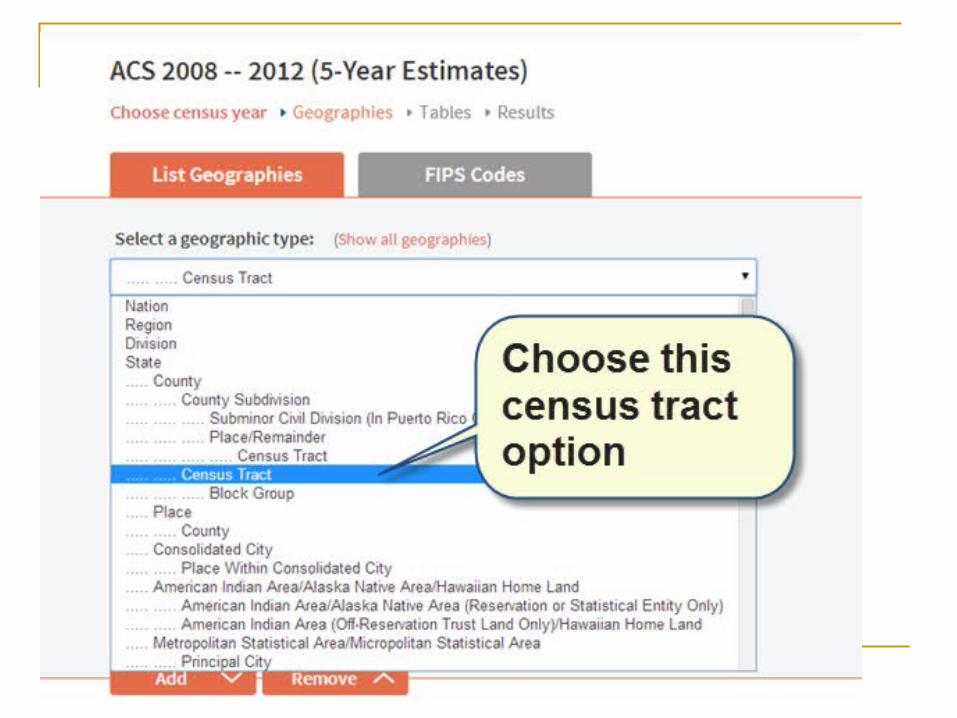
Change preferred geography to census tracts

Population 85+ by census tract…

Zoom in to a smaller area either using the zoom in tool (+) or typing in a place name

Boston 85 and over by census tract…

Now let’s look at ACS data…

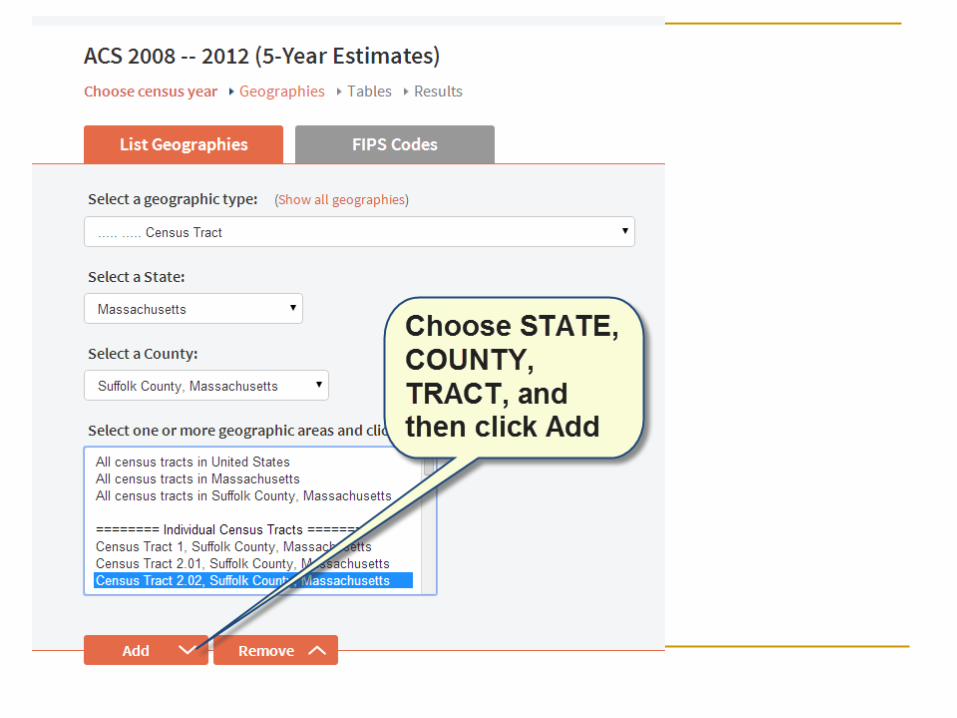
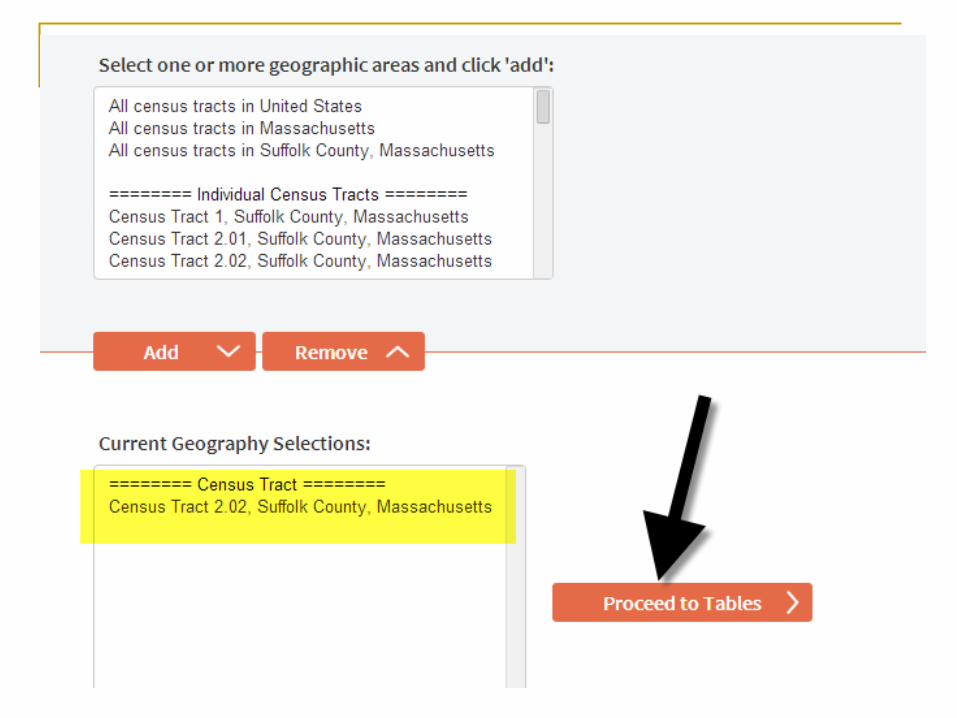
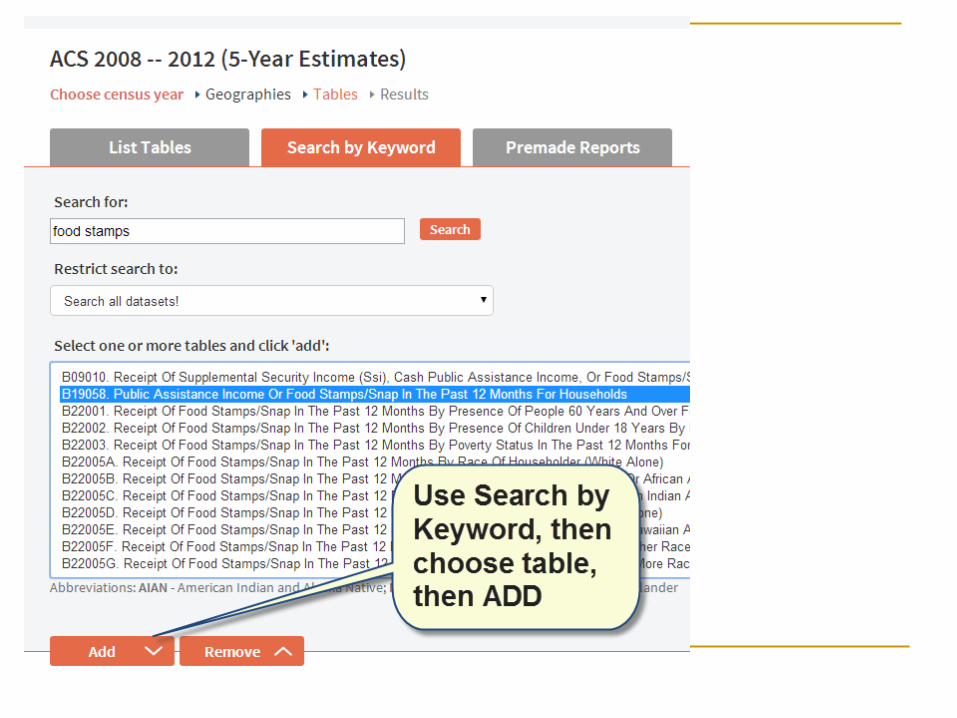
ACS 2008-2012 (5 year estimates)
Explore the different data you can find here
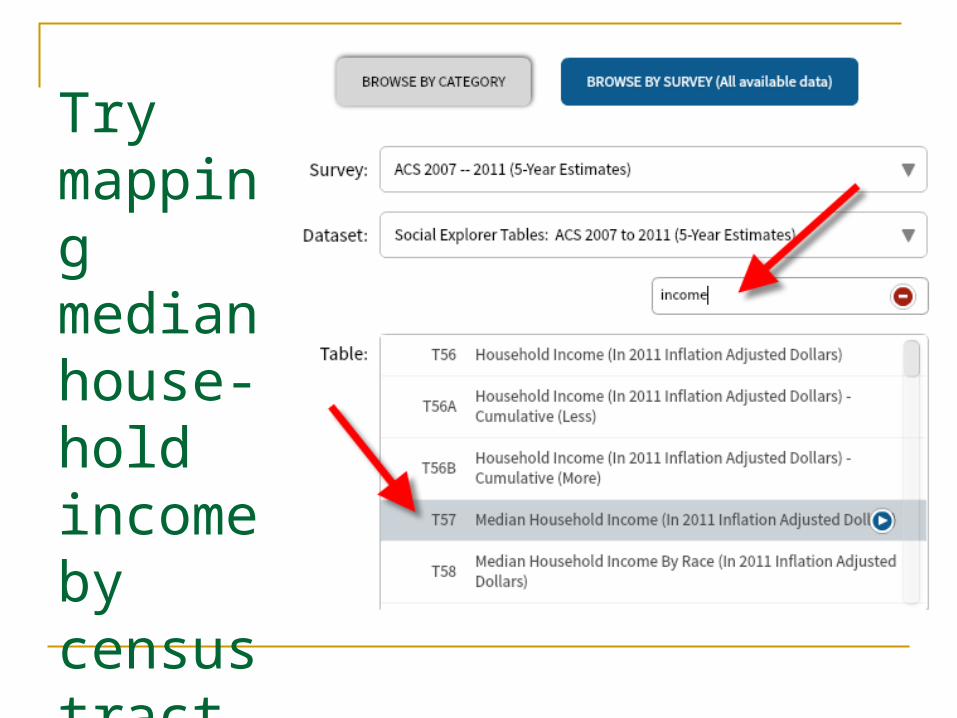
Try mapping median house-hold incomeby census tract


Saving your maps…
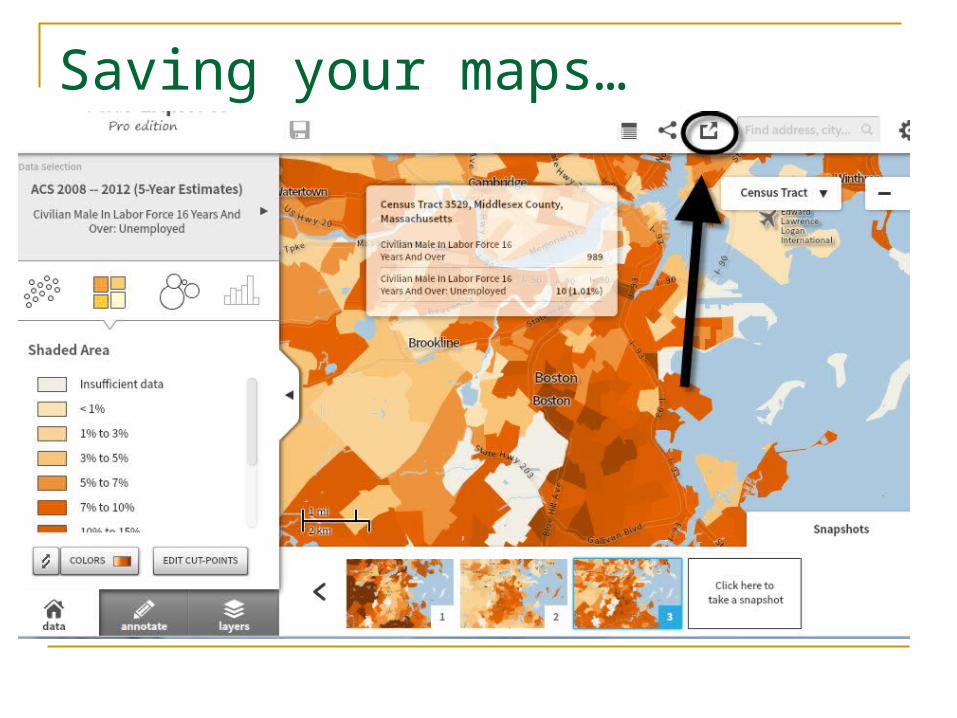
Saving your maps…

Saving your maps…options

Saving your maps…Download
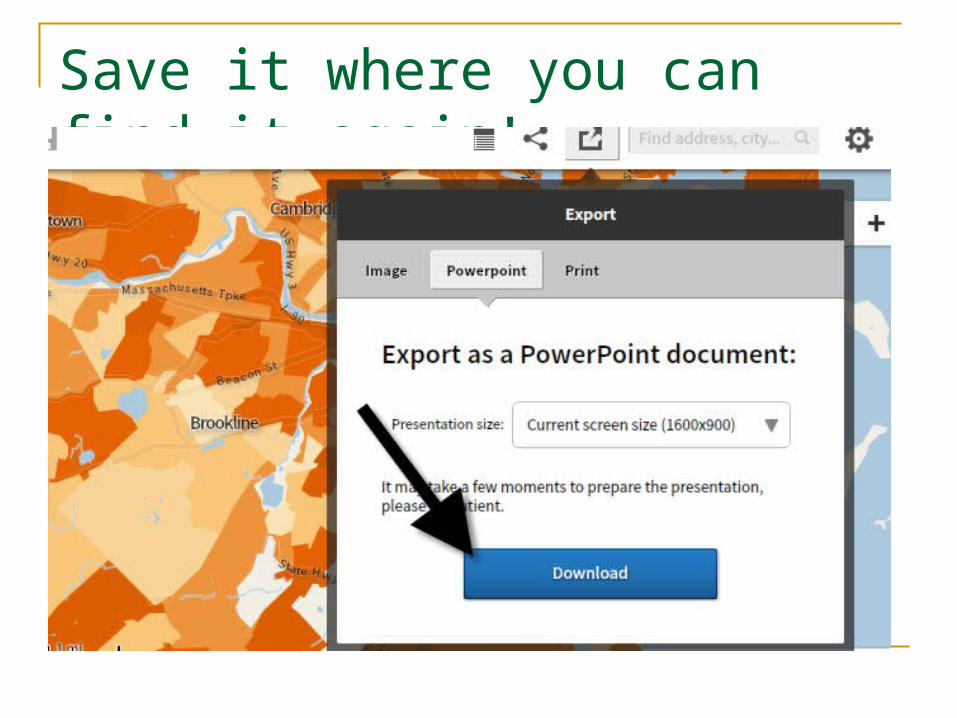
Save it where you can find it again!

Understanding the ACS “5 year estimates”
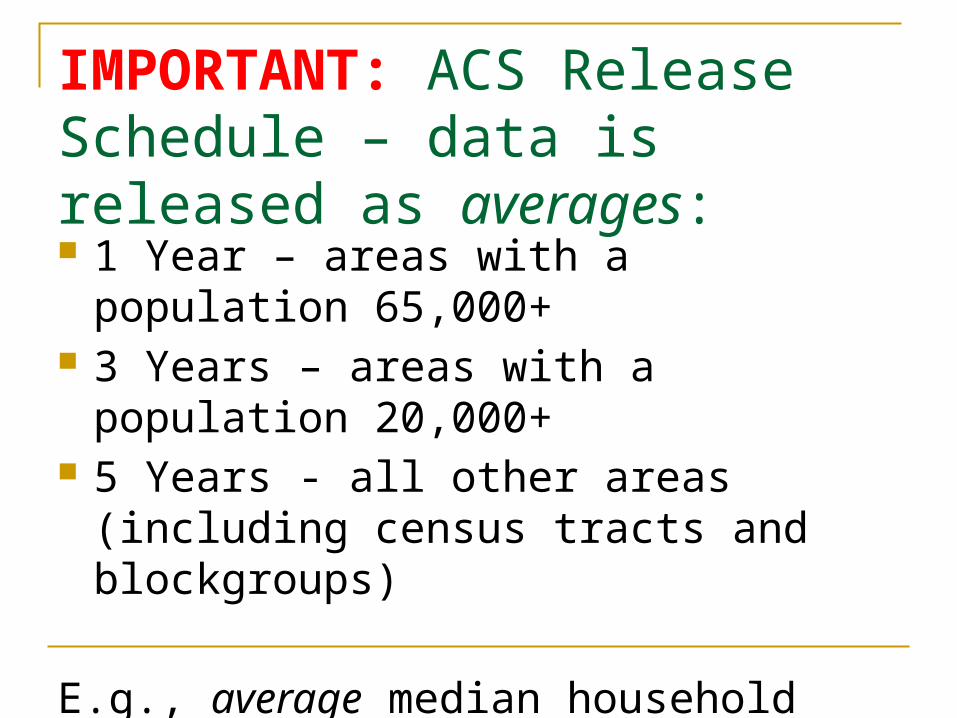
IMPORTANT: ACS Release Schedule – data is released as averages: 1 Year – areas with a population 65,000+ 3 Years – areas with a population 20,000+ 5 Years - all other areas (including census
tracts and blockgroups)
E.g., average median household income for 2008-2012 (released December, 2013)

Huh????

Let’s see an ACS 1-year estimate…

Zoom out and map by County…
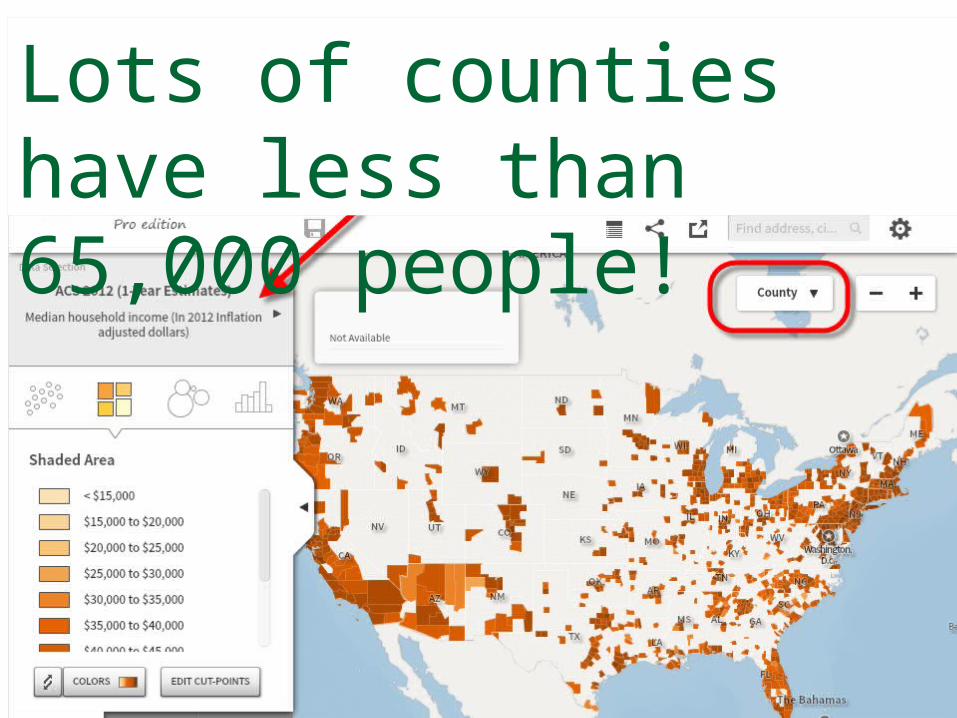
Lots of counties have less than 65,000 people!

IMPORTANT: ACS Release Schedule – data is released as averages: 1 Year – areas with a population 65,000+ 3 Years – areas with a population 20,000+ 5 Years - all other areas (including census
tracts and blockgroups)
E.g., average median household income for 2008-2012 (released December, 2013)
Try mapping the most recent ACS 3-year estimates
Median household income by county
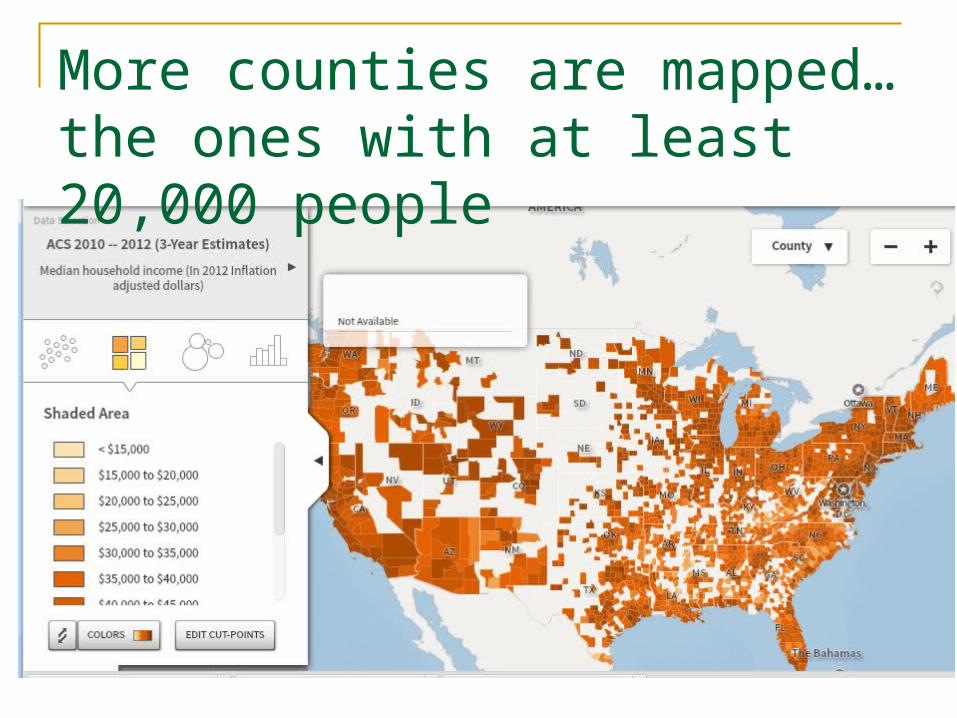
More counties are mapped…the ones with at least 20,000 people

IMPORTANT: ACS Release Schedule – data is released as averages: 1 Year – areas with a population 65,000+ 3 Years – areas with a population 20,000+ 5 Years - all other areas (including census
tracts and blockgroups)
E.g., average median household income for 2008-2012 (released December, 2013)

Now map median household by county using the ACS 5-year 2008-2012 estimates…

And while you’re at it, map 5 classes by quantiles…

ACS 5-year estimates – median household income by county
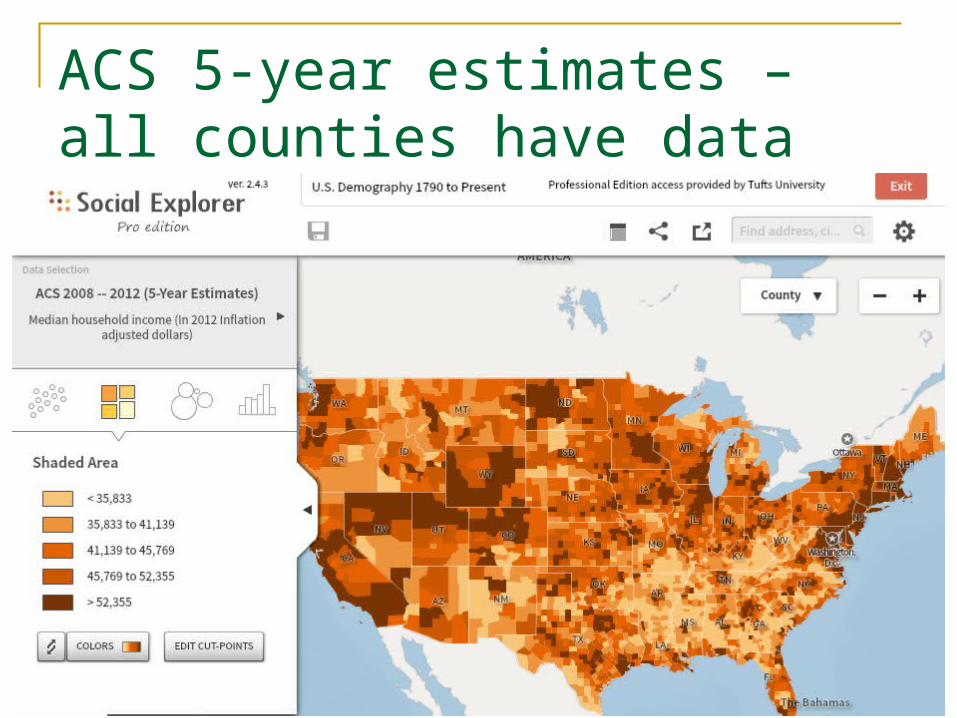
ACS 5-year estimates – all counties have data

IMPORTANT: ACS Release Schedule – data is released as averages: 1 Year – areas with a population 65,000+ 3 Years – areas with a population 20,000+ 5 Years - all other areas (including census
tracts and blockgroups)
E.g., average median household income for 2008-2012 (released December, 2013)

To map by tract you HAVE to use the ACS 5-year estimates!!
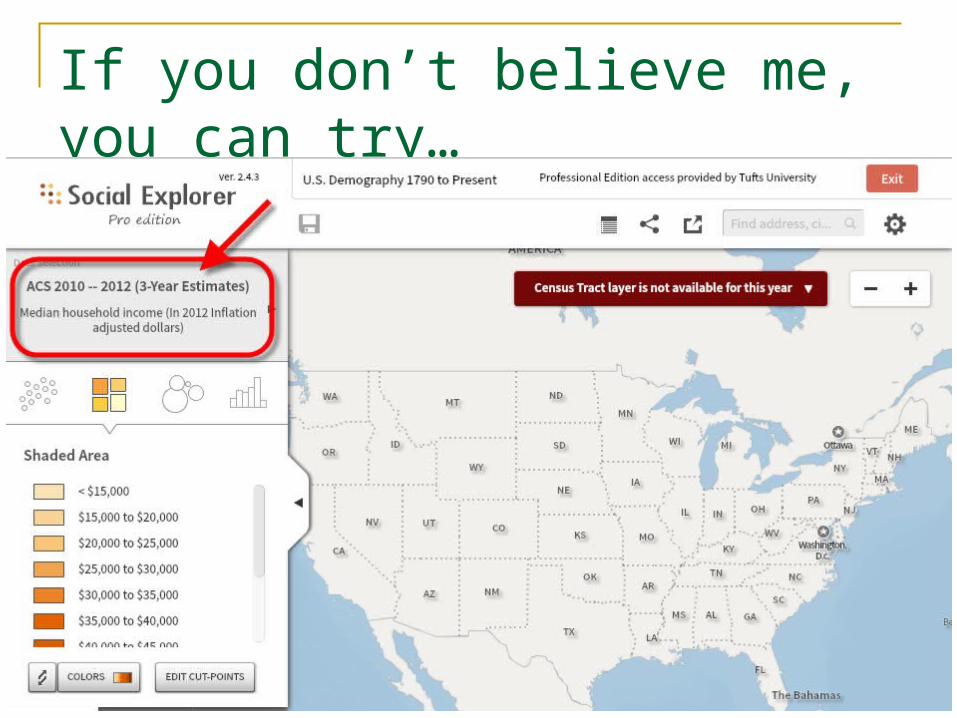
If you don’t believe me, you can try…

So get to using the 5 year estimates
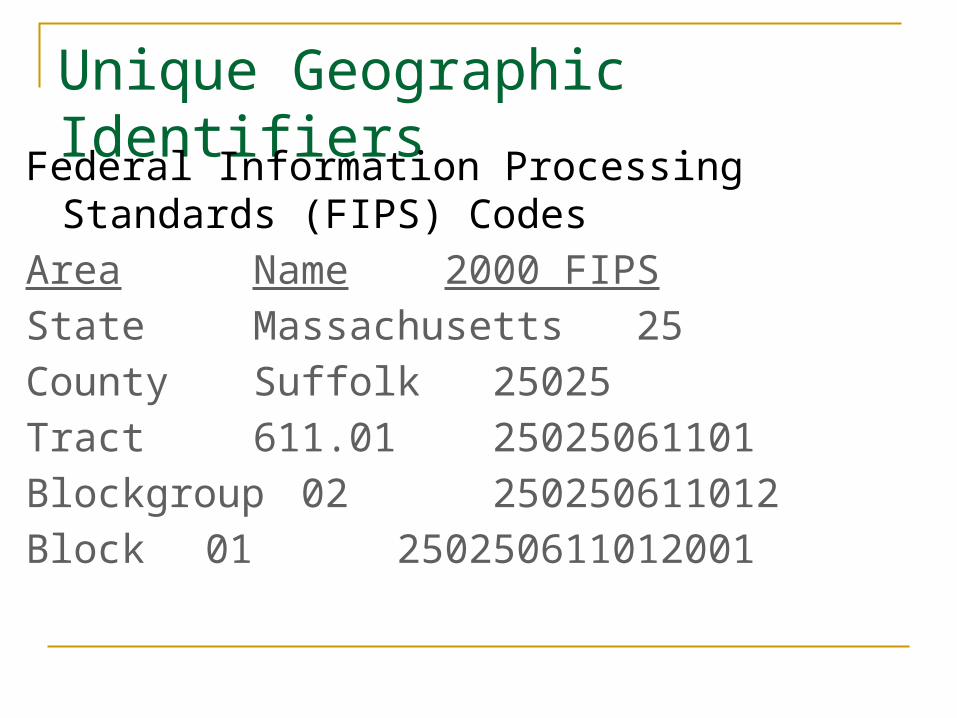
Unique Geographic Identifiers
Federal Information Processing Standards (FIPS) Codes
Area Name 2000 FIPS
State Massachusetts 25
County Suffolk 25025
Tract 611.01 25025061101
Blockgroup 02 250250611012
Block 01 250250611012001
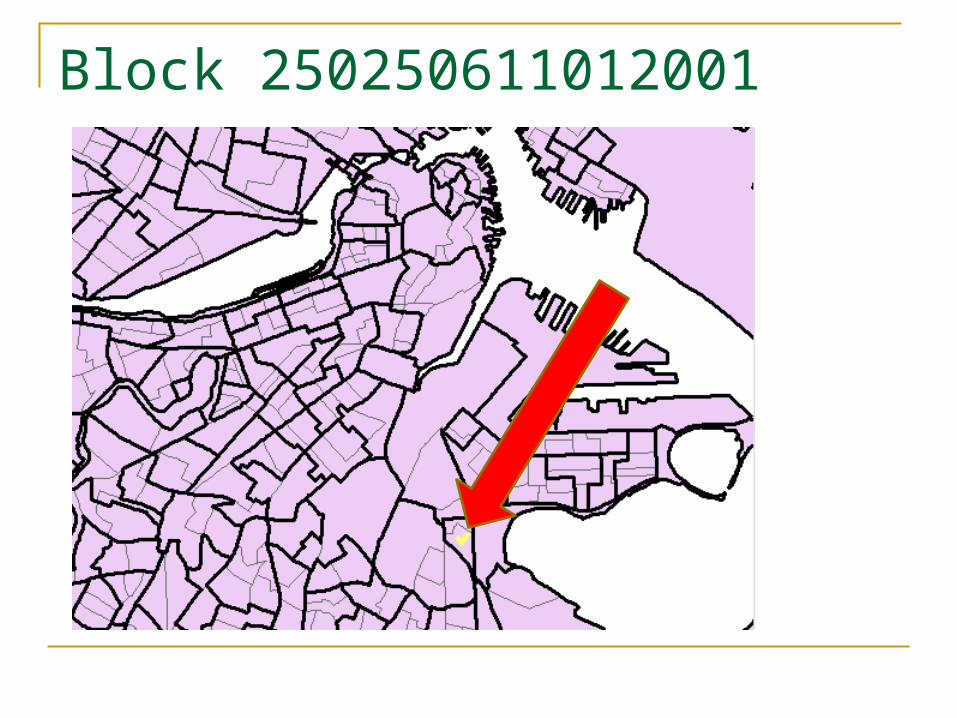
Block 250250611012001

Some other important definitions to understand

Housing Unit
A house, an apartment, a mobile home or trailer, a group of rooms, or a single room occupied as separate living quarters, or if vacant, intended for occupancy as separate living quarters.
Separate living quarters are those in which the occupants live separately from any other individuals in the building and which have direct access from outside the building or through a common hall. For vacant units, the criteria of separateness and direct access are applied to the intended occupants whenever possible.
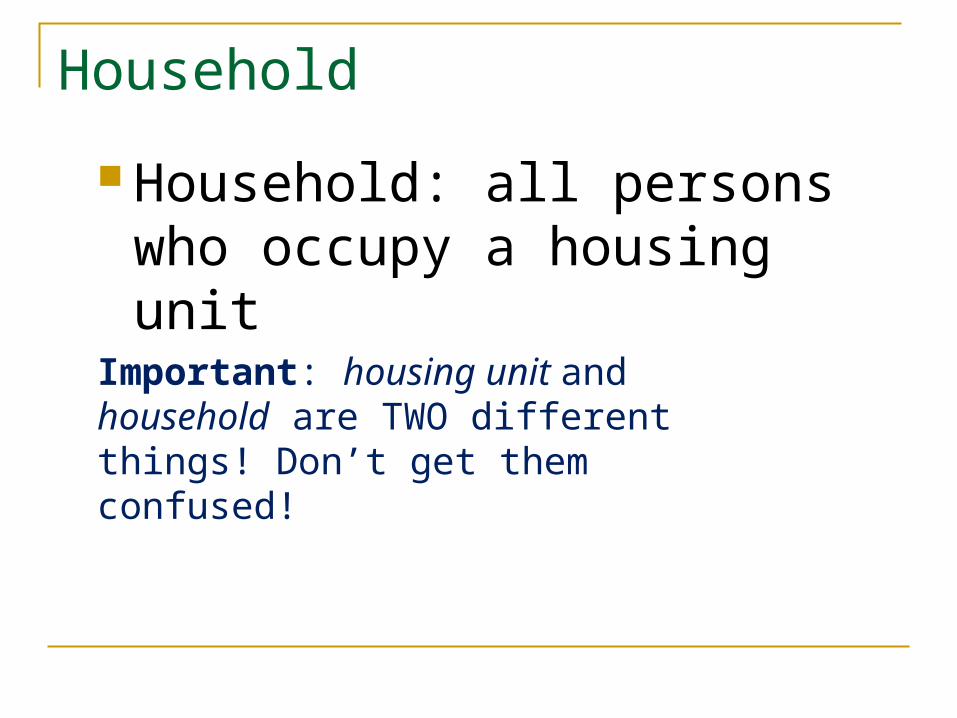
Household
Household: all persons who occupy a housing unit
Important: housing unit and household are TWO different things! Don’t get them confused!

Two Types of Households
Family Household: householder plus all persons in the household related by blood, marriage, or adoptionCan also include: Subfamily Example: householder’s son and
daughter-in-law Nonrelative Example: roomers, boarders
Nonfamily Household: persons living alone or with nonrelatives only
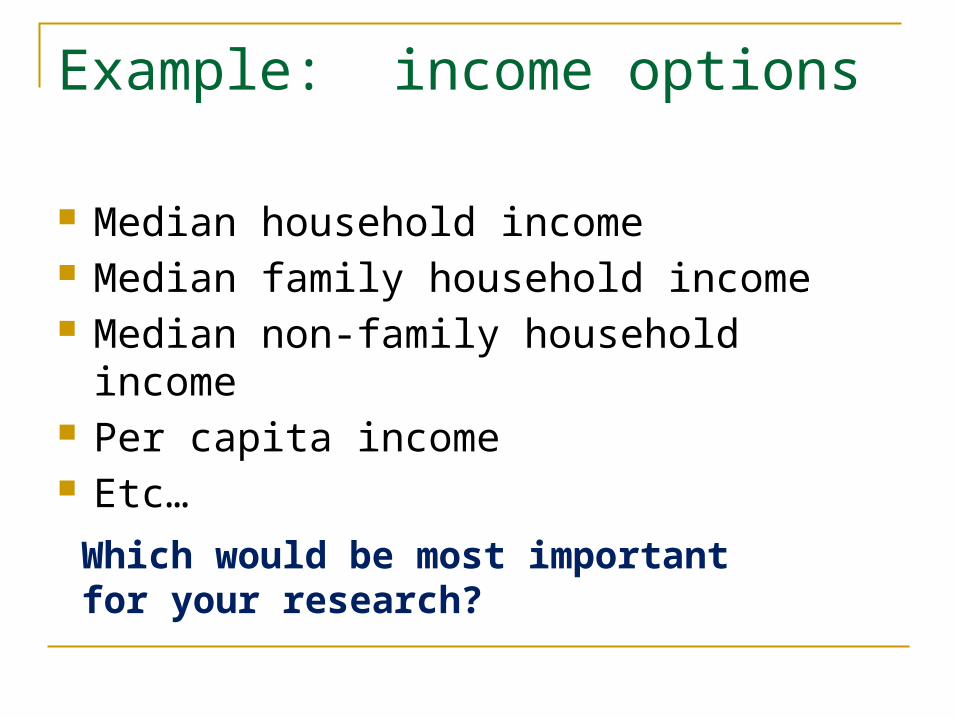
Example: income options
Median household income Median family household income Median non-family household income Per capita income Etc…
Which would be most important for your research?

The “universe” for each variable The total number of units, e.g., individuals,
households, businesses, in the population of interest.
This is important for understanding percentages
Know your “universe”! Make sure you understand what is the universe.

Barnstable County, MA

Barnstable County, MA

Making reports in Social Explorer
Go back to Social Explorer
Zoom in to Boston or another area, or zoom into an address to find your census tract of interest

Let’s make a report about a neighborhood…


Use the point option and point to your census tract of interest, and the adjoining tracts…
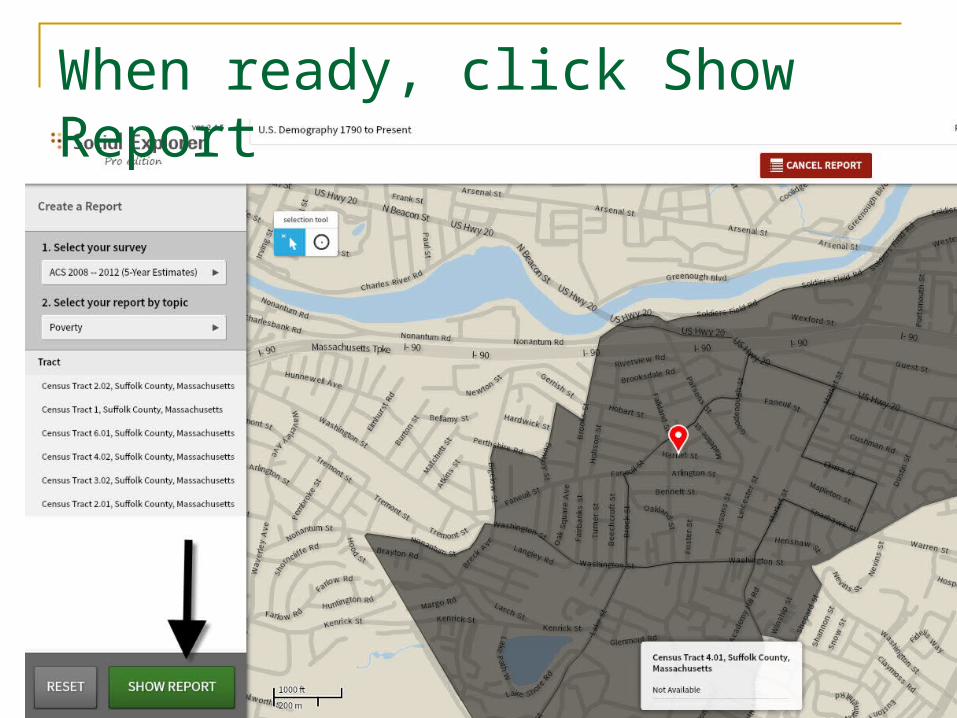
When ready, click Show Report

Note the report has the details for every tract we selected…

Use the Excel tab to download a report
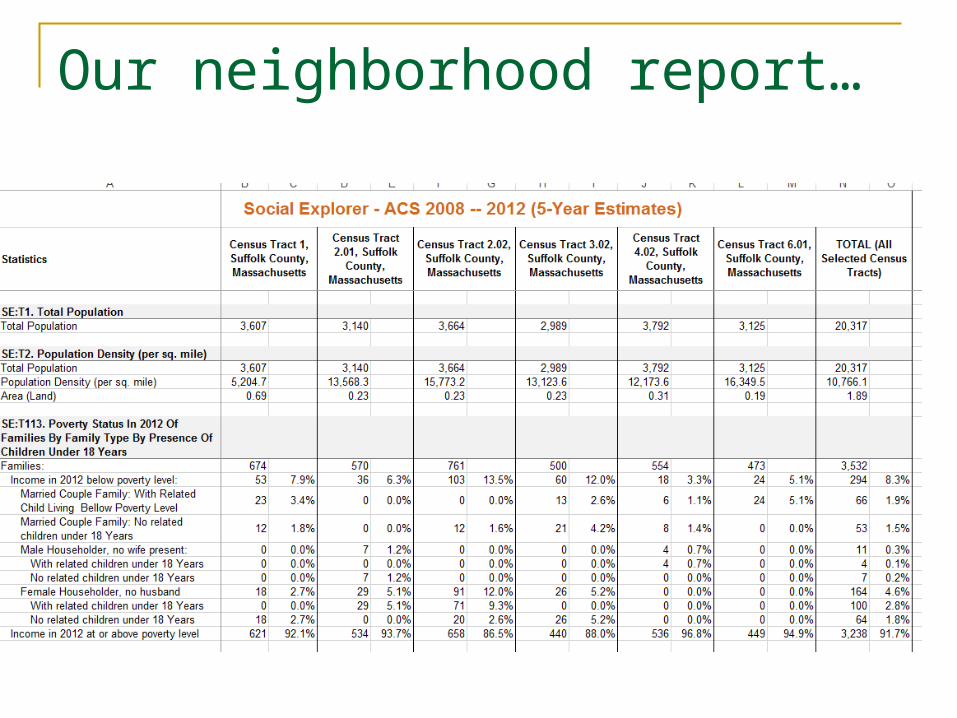
Our neighborhood report…

Our neighborhood report…tract of interest

Our neighborhood report…totals for all tracts in our selection

Warning: there is a BIG problem for neighborhood level analysis…

The decennial census data at the census block, block group and tract level is very reliable – why?
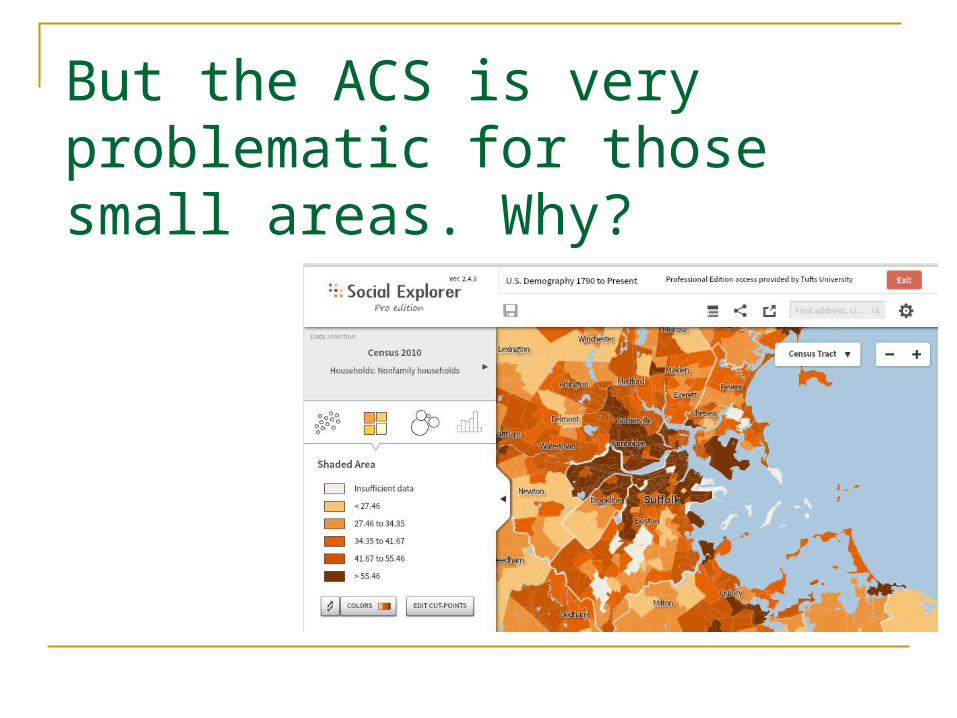
But the ACS is very problematic for those small areas. Why?

ACS and Margin of Error
Means of transportation for commute – Tract Level - ACS 2005-2009 5 year estimatesUniverse is workers 16 and over
Workers 16 and Over

So let’s understand the margin of error…

What is Sampling Error?
Definition
The uncertainty associated with an estimate that is based on data gathered from a sample of the population rather than the full population
84

Illustration of Sampling ErrorEstimate average number of children per household for a population with 3 households living in a block:
Household A has 1 child
Household B has 2 children
Household C has 3 children
The block average based on the full population is two children per household: (1+2+3)/3
85

Conceptualizing Sampling ErrorThree different samples of 2 households:
1. Households A and B (1 child, 2 children)
2. Households B and C (2 children, 3 children)3. Households A and C (1 child, 3 children)
Three different averages based on which sample is used:
4. (1 + 2) / 2 = 1.5 children
5. (2 + 3) / 2 = 2.5 children
6. (1 + 3) / 2 = 2 children
86

Sampling Error
Census 2010 is a 100% survey so has smaller error
ACS data is based on samples – error is larger
The smaller the geography, the larger the error (because the sample is smaller)
Especially true for variables that sample a small number of people, e.g., bike commuters

ACS and Margin of Error
Means of transportation for commute – Tract Level - ACS 2005-2009 5 year estimatesUniverse is workers 16 and over
Workers 16 and Over
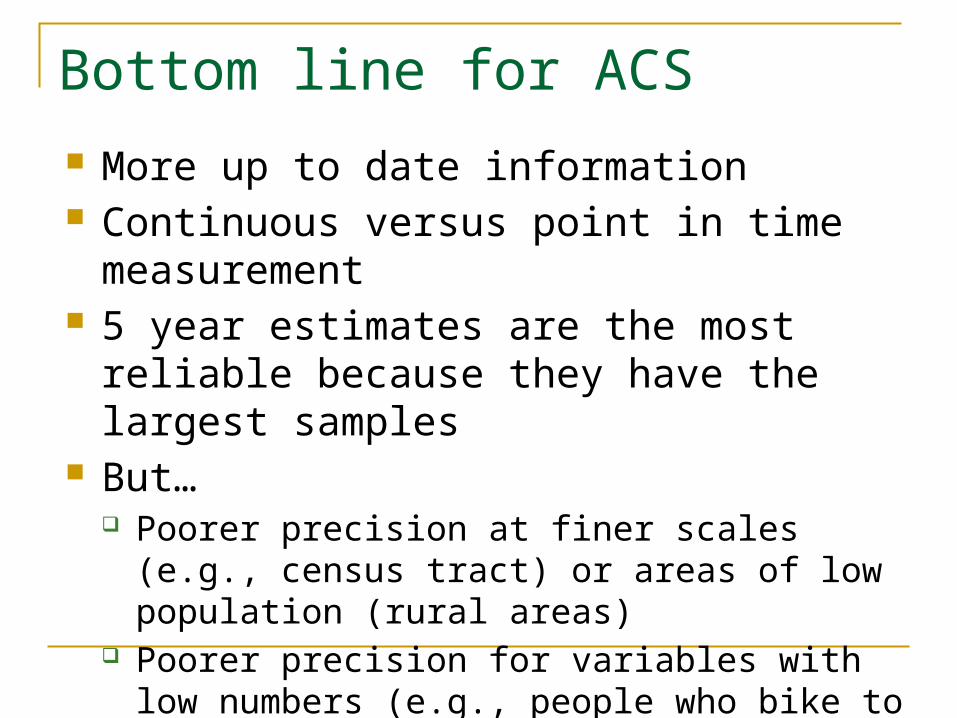
Bottom line for ACS More up to date information Continuous versus point in time
measurement 5 year estimates are the most reliable
because they have the largest samples But…
Poorer precision at finer scales (e.g., census tract) or areas of low population (rural areas)
Poorer precision for variables with low numbers (e.g., people who bike to work)

How can I see the margin of error?
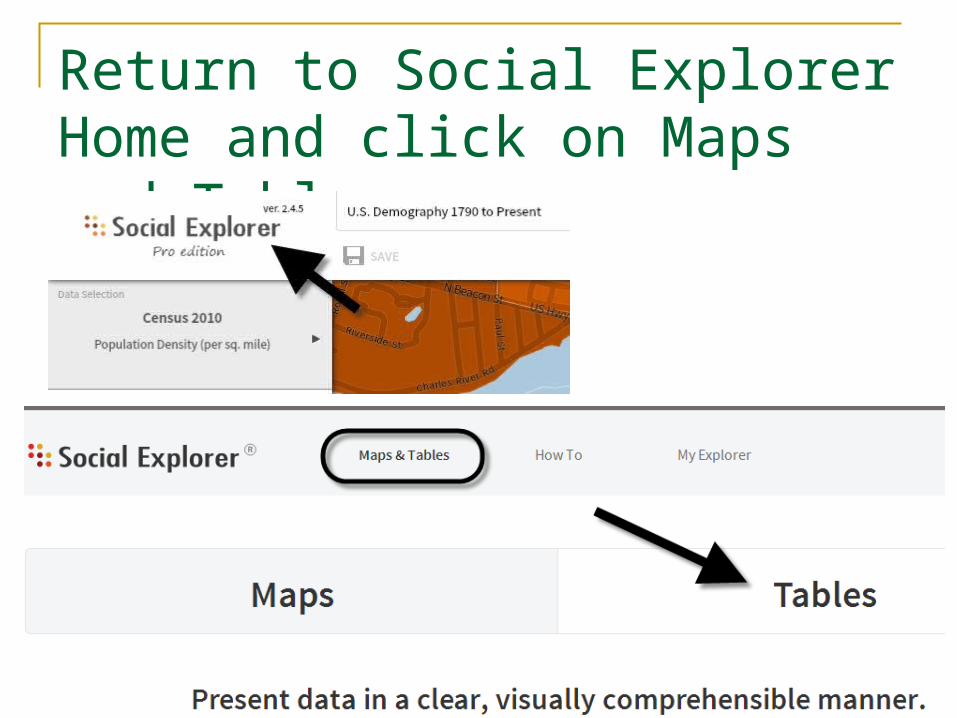
Return to Social Explorer Home and click on Maps and Tables…
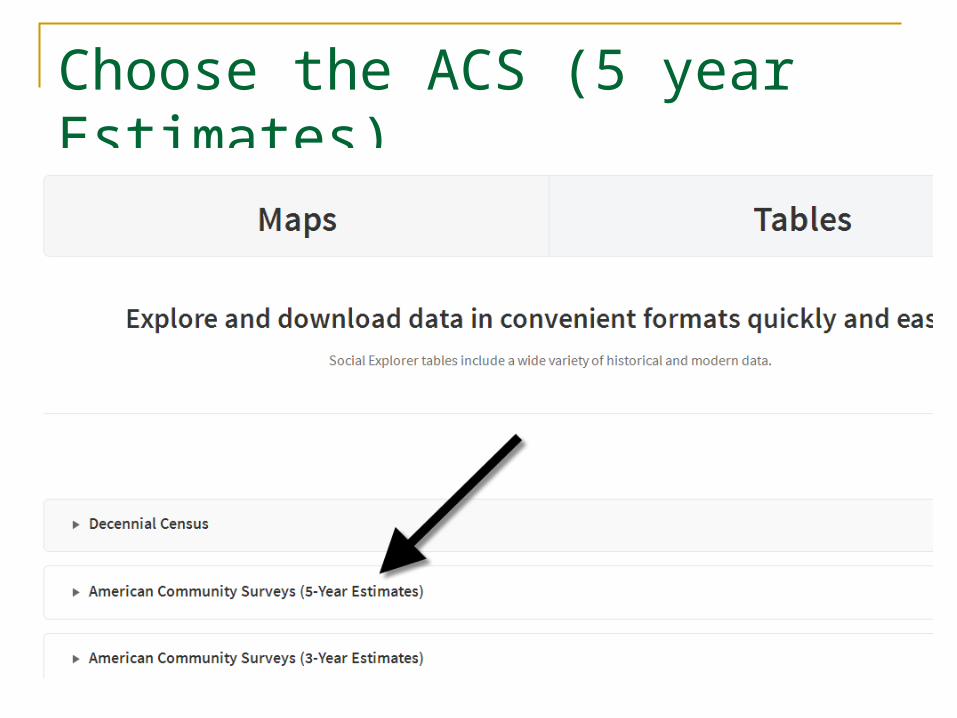
Choose the ACS (5 year Estimates)

Choose 2008-1012 and click on Begin Report


Open Excel file, enable editing and/or save a copy…

Add columns for CV, MOE, Lower, and Higher

105
Measures Associated with Sampling Error Standard Error (SE)
Coefficient of Variation (CV)
Margin of Error (MOE)

106
Standard Error (SE or Std. Error) Definition
A measure of the variability of an estimate due to sampling
Depends on variability in the population and sample size
The Census Bureau calculates the Standard Error for its estimates.
107
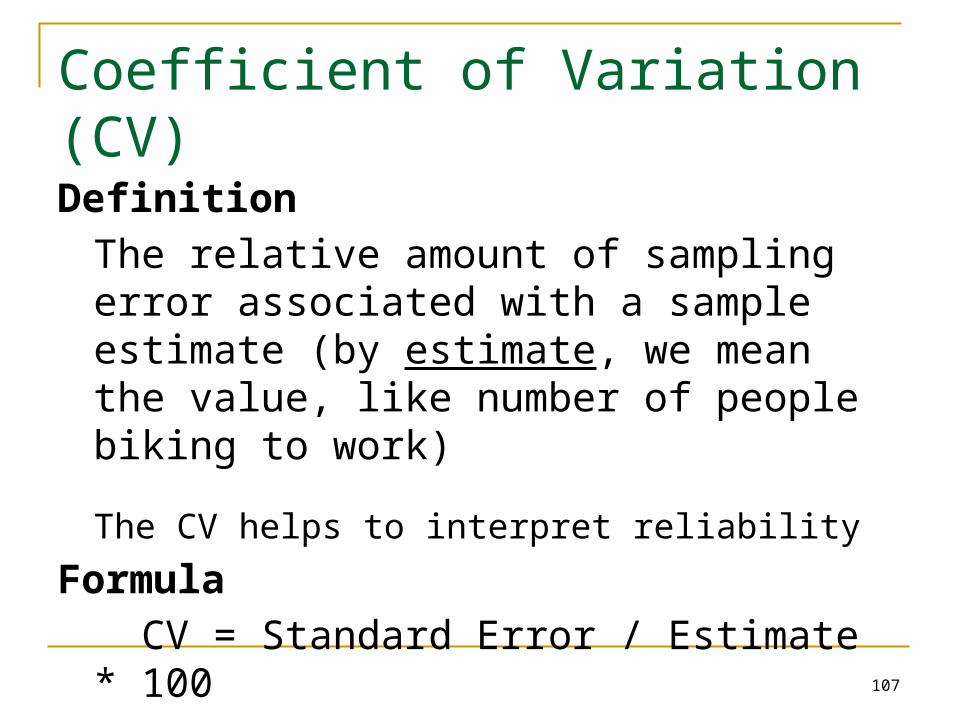
Coefficient of Variation (CV)
Definition
The relative amount of sampling error associated with a sample estimate (by estimate, we mean the value, like number of people biking to work)
The CV helps to interpret reliability
Formula
CV = Standard Error / Estimate * 100

Calculating the CV…
CV = (Std. Error / Estimate) * 100

CV% is a measure of reliability. So what is a good CV %? No agreement
Depends on purpose
Census case studies: less than 15% may be reliable
15-30% - not reliable, be very careful
Over 30% - not reliable, use with extreme caution

Our CV’s calculated for Census Tract public assistance…

111
Margin of Error (MOE) at 90% confidence level
Definition
If we sampled the population many times, we could be confident that 90% of the time, the true value for the population would fall between our upper and lower margin of error
Census Formula for MOEMargin of Error = SE * 1.645 (for 90%
confidence level)
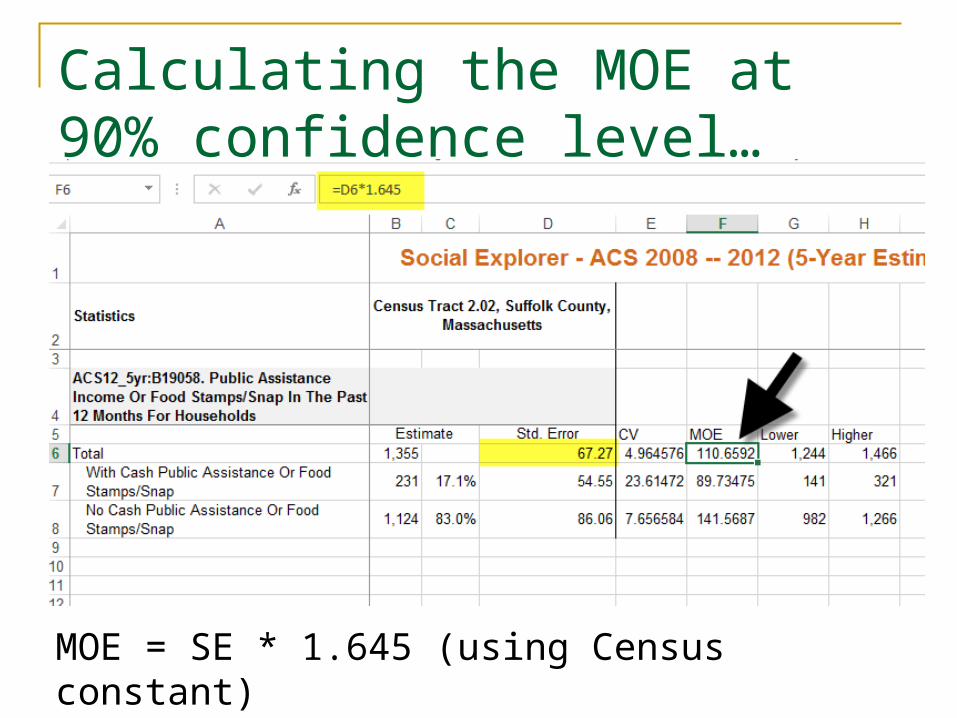
Calculating the MOE at 90% confidence level…
MOE = SE * 1.645 (using Census constant)

Calculating the lower limit of the MOE at 90% confidence level…
Lower limit = the estimate minus the MOE

Calculating the upper limit of the MOE at 90% confidence level…
Upper limit = the estimate plus the MOE

What have you learned?

Take home points There are two major Census Bureau products
used for neighborhood analysis: The Decennial Census
Basic data By block, block group, and tract Once a decade, one point in time
The American Community Survey Lots of interesting data By tract – but high sampling error! More up to date – 5-year rolling estimates

Policy Map is another mapping tool…
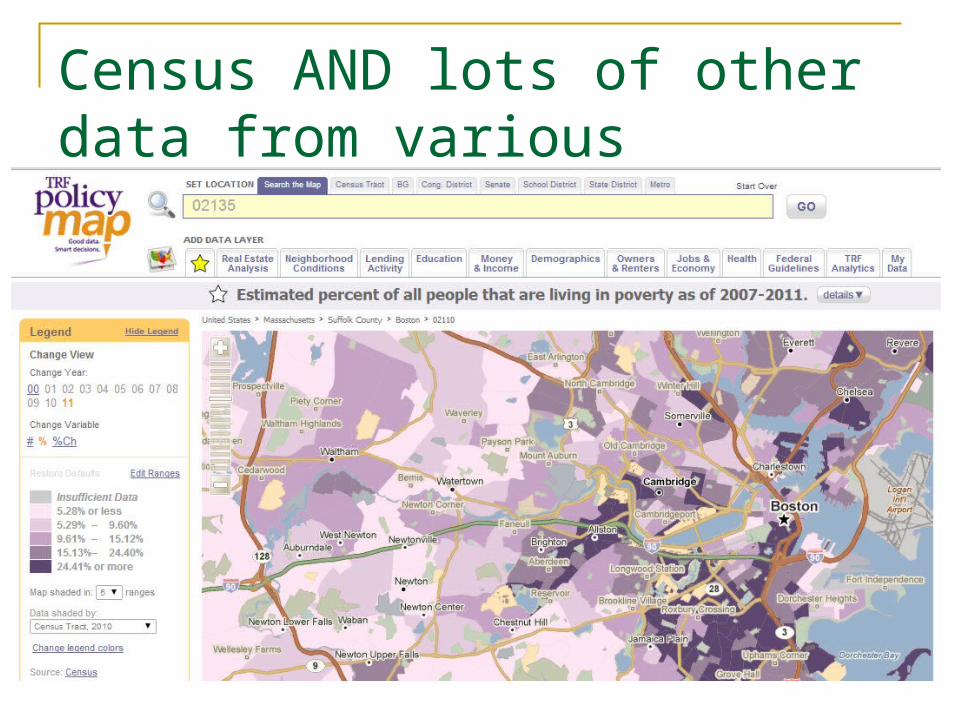
Census AND lots of other data from various agencies and organizations…

Census AND lots of other data from various agencies and organizations…

Also accessed through Tisch Library’s databases…
Take home points Social Explorer is a useful mapping,
presentation, and reporting tool for current and historical census data
Policy Map is another interesting tool for current and recent census data, as well as other policy-related data
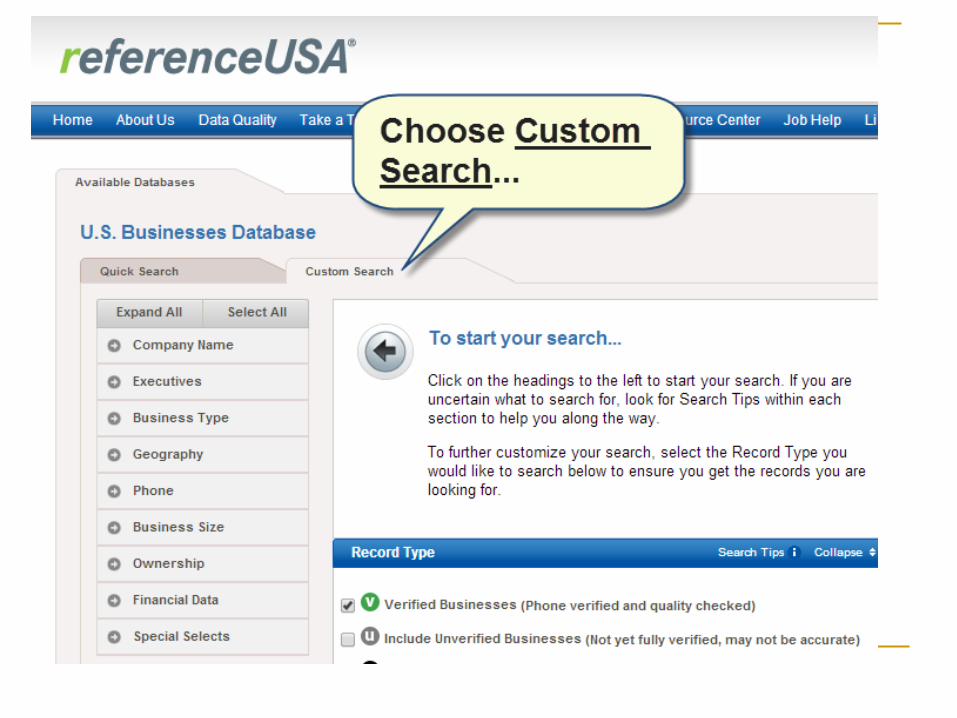
Acquiring business data for your neighborhood using Reference USAAlso through Tisch Library - Databases


Scroll down the results list and you’ll find it…


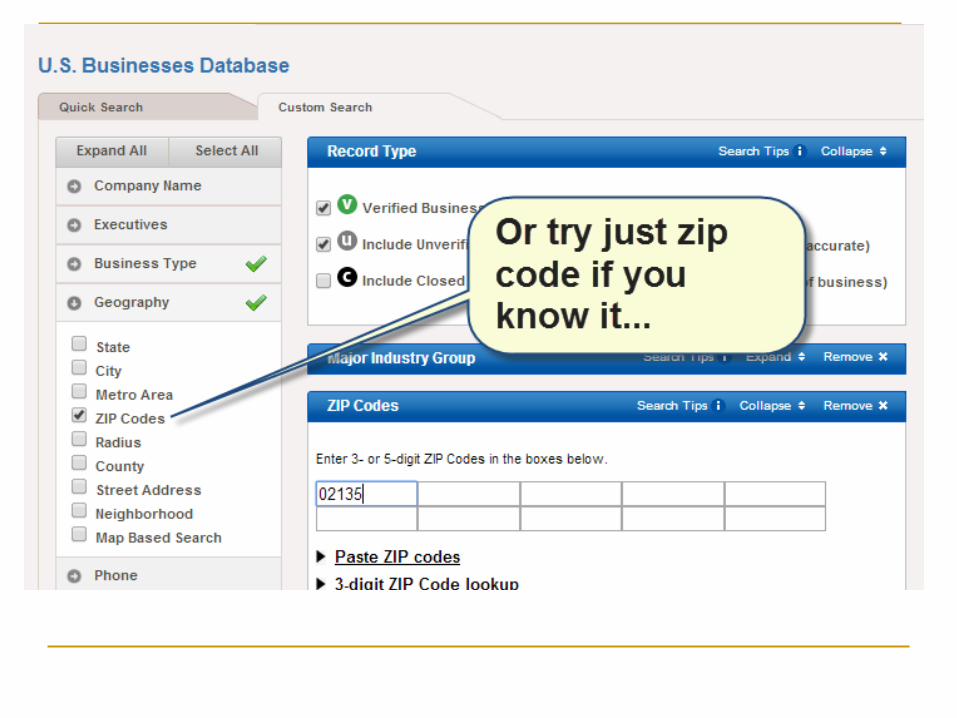
We are going to acquire business data using: Geography - options include
Radius from an address Zip code
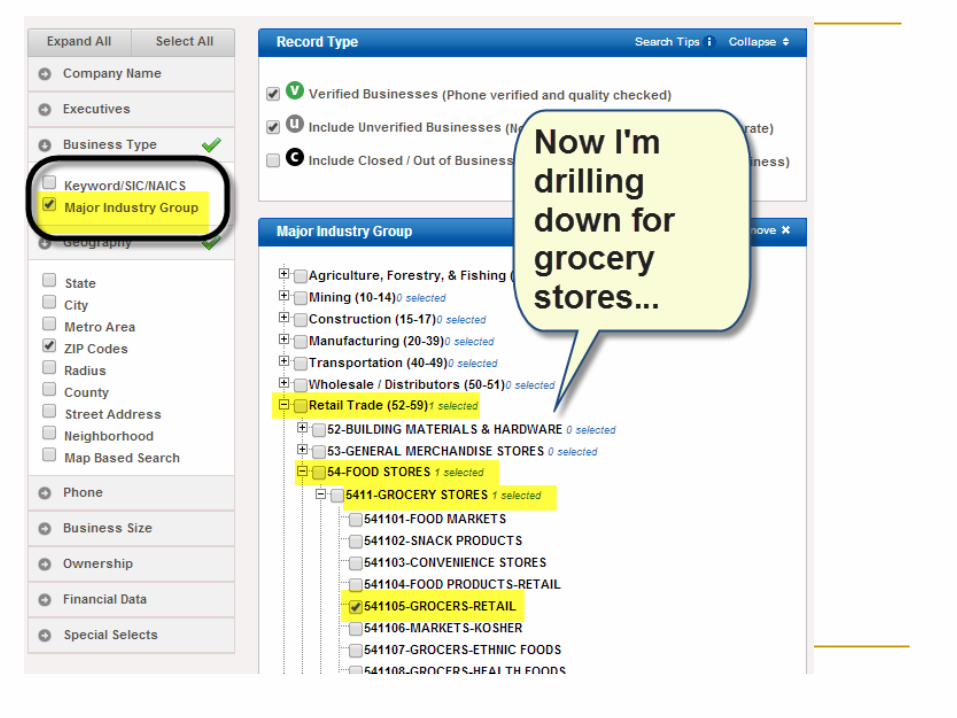
Type of business Using industry groupings, e.g., retail – food –
grocery stores


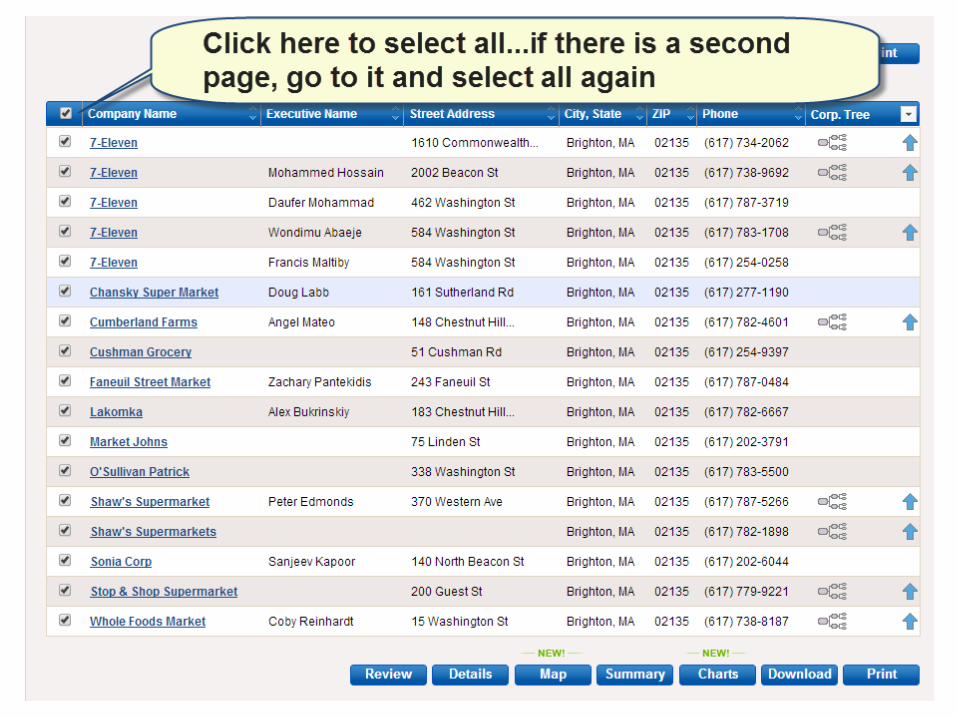


Download Excel file to desktop…

Open Excel file and look through it

Use SAVE AS to save to a name and place where you can find it again…

Note: there is a 50 record download limit for our license of Reference USA (per Excel file)

Mapping your business data in Google Maps
Requires a google account
If you don’t have one, sit with someone who does…

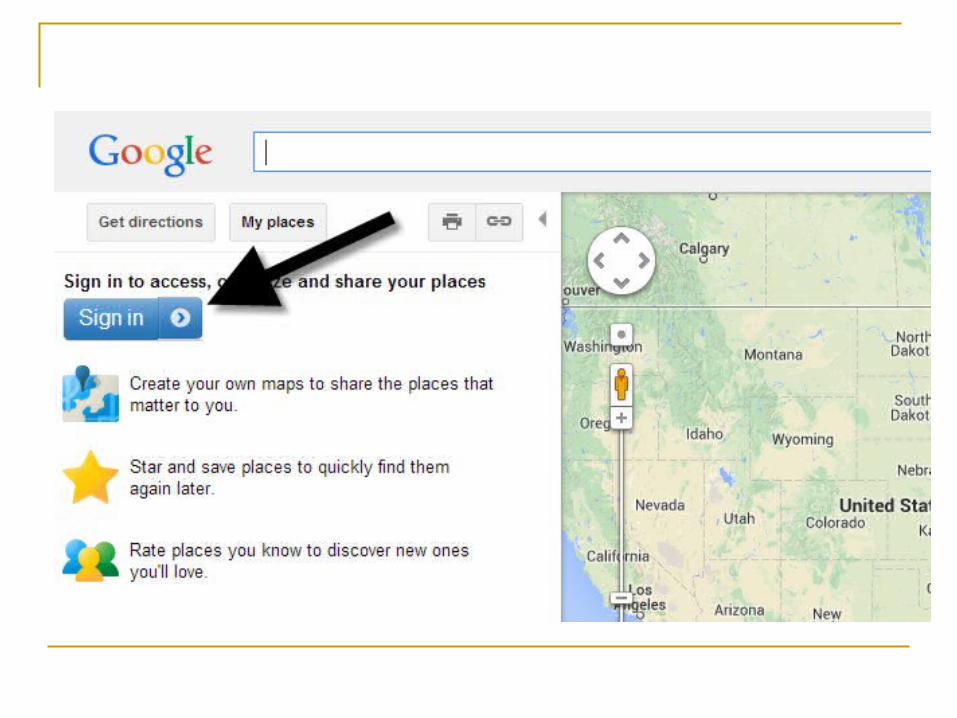
Open a web browser and go to maps.google.com, then click on settings tool

Click on My Places and sign in with your google account
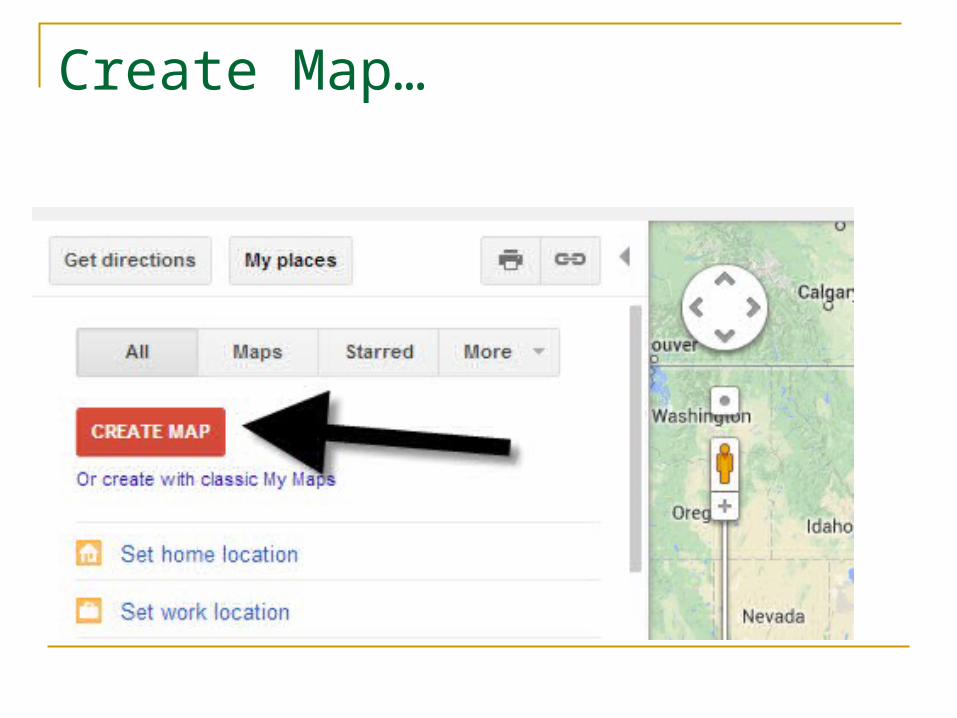
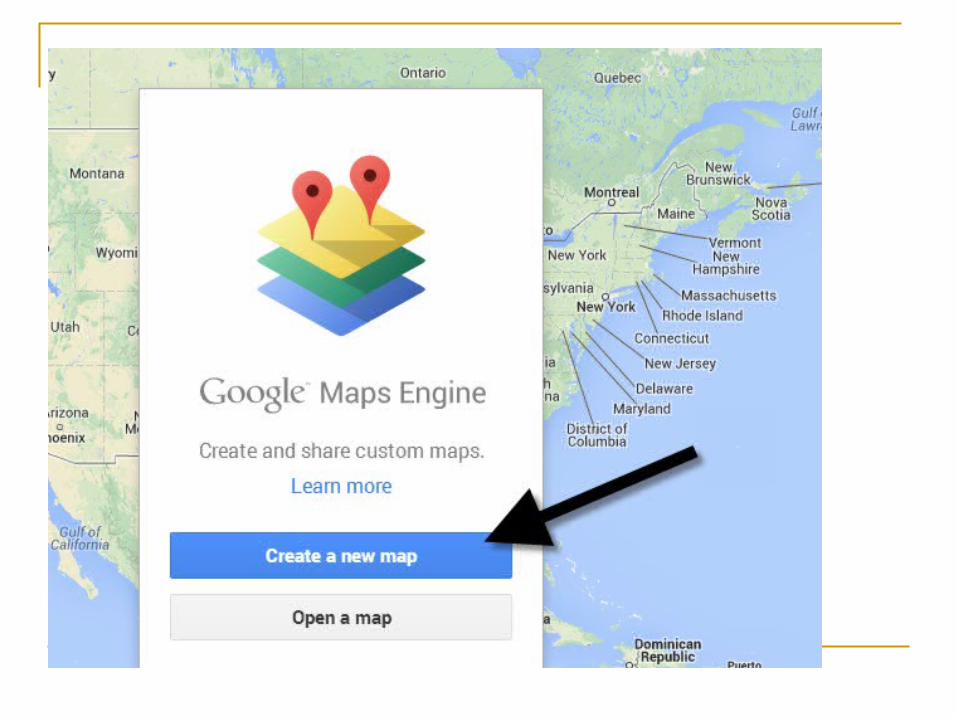
Create Map…
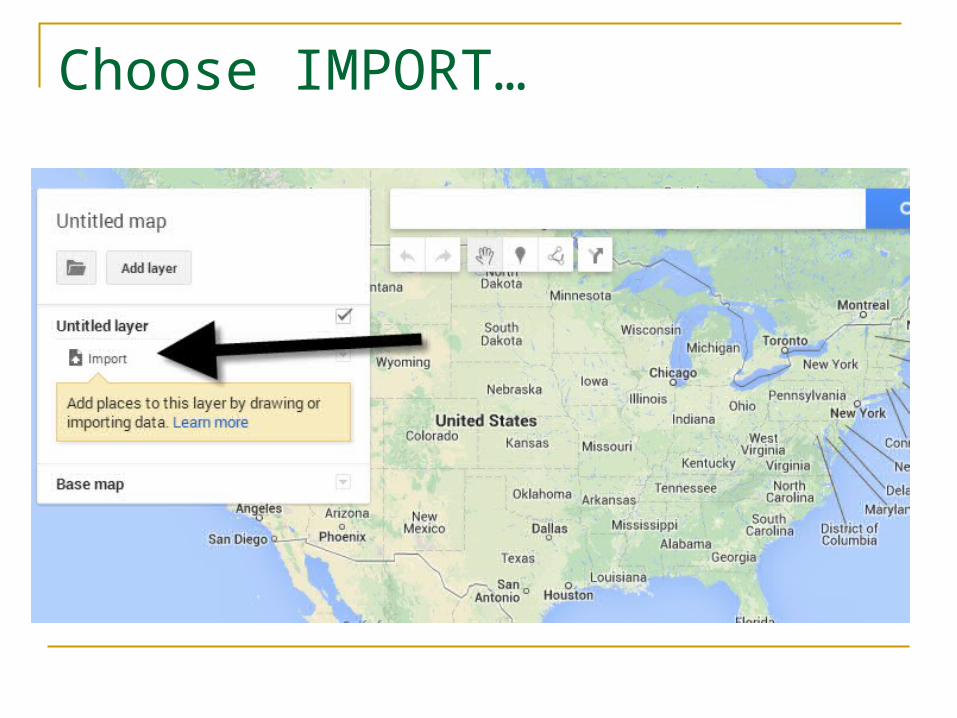
Choose IMPORT…


First choose the address information…

Next choose something for the map label…

My map…

My map…with store info
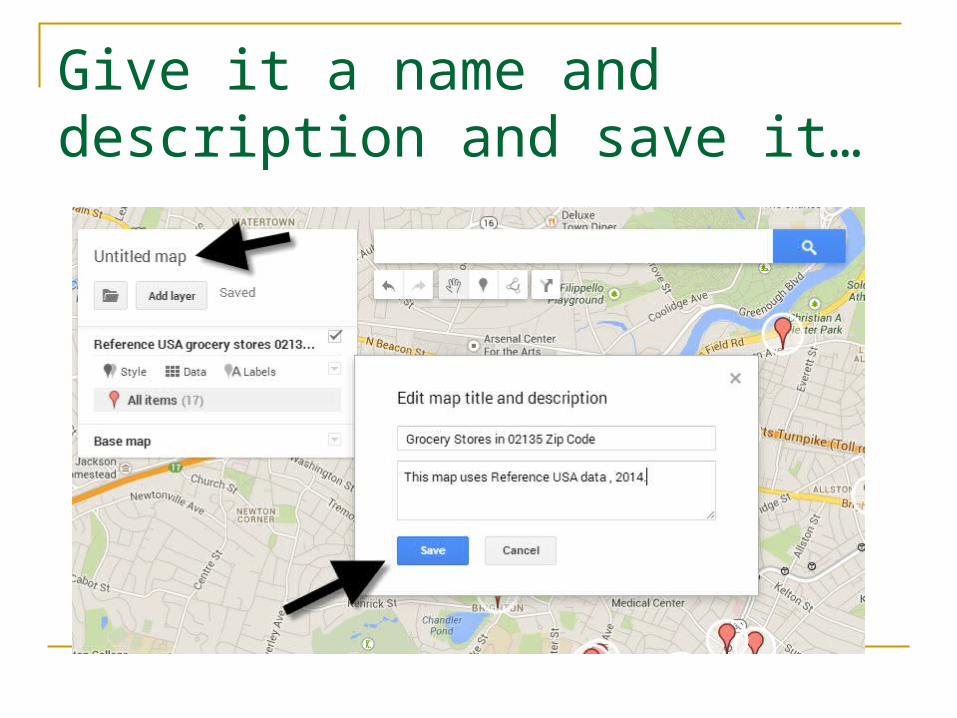
Give it a name and description and save it…

Share it as you like…

Whew!!! What you have learned… Social Explorer for Census and American
Community Survey (ACS) data (historical and current, maps and tables)
About sampling error in the ACS
Policy Map for some other types of data
Reference USA for business and services data
Google Maps for mapping Reference USA data