Embed Size (px)
Citation preview

ACQUISITION OF CARAUSTAR INDUSTRIESSignificantly Enhances Margins and Free Cash Flow
Strengthening its Leadership in Industrial Packaging
December 20, 2018 – P.2
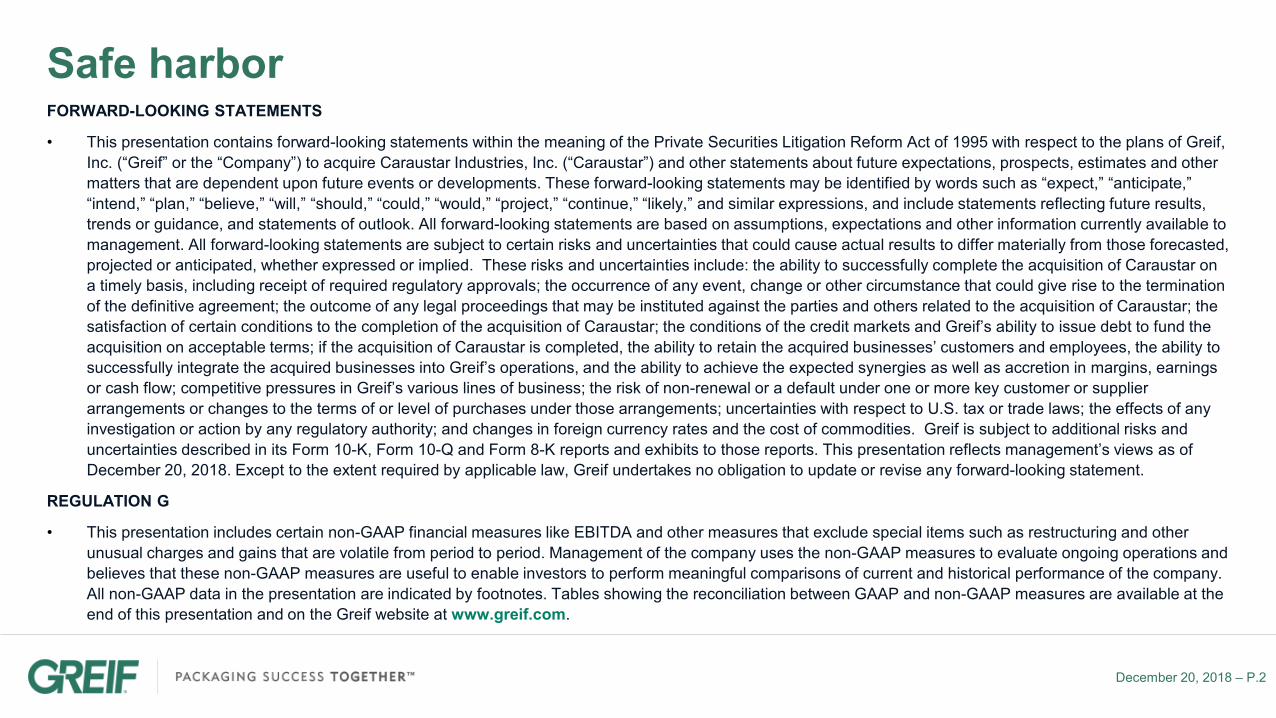
Safe harborFORWARD-LOOKING STATEMENTS
• This presentation contains forward-looking statements within the meaning of the Private Securities Litigation Reform Act of 1995 with respect to the plans of Greif, Inc. (“Greif” or the “Company”) to acquire Caraustar Industries, Inc. (“Caraustar”) and other statements about future expectations, prospects, estimates and other matters that are dependent upon future events or developments. These forward-looking statements may be identified by words such as “expect,” “anticipate,” “intend,” “plan,” “believe,” “will,” “should,” “could,” “would,” “project,” “continue,” “likely,” and similar expressions, and include statements reflecting future results, trends or guidance, and statements of outlook. All forward-looking statements are based on assumptions, expectations and other information currently available to management. All forward-looking statements are subject to certain risks and uncertainties that could cause actual results to differ materially from those forecasted, projected or anticipated, whether expressed or implied. These risks and uncertainties include: the ability to successfully complete the acquisition of Caraustar on a timely basis, including receipt of required regulatory approvals; the occurrence of any event, change or other circumstance that could give rise to the termination of the definitive agreement; the outcome of any legal proceedings that may be instituted against the parties and others related to the acquisition of Caraustar; the satisfaction of certain conditions to the completion of the acquisition of Caraustar; the conditions of the credit markets and Greif’s ability to issue debt to fund the acquisition on acceptable terms; if the acquisition of Caraustar is completed, the ability to retain the acquired businesses’ customers and employees, the ability to successfully integrate the acquired businesses into Greif’s operations, and the ability to achieve the expected synergies as well as accretion in margins, earnings or cash flow; competitive pressures in Greif’s various lines of business; the risk of non-renewal or a default under one or more key customer or supplier arrangements or changes to the terms of or level of purchases under those arrangements; uncertainties with respect to U.S. tax or trade laws; the effects of any investigation or action by any regulatory authority; and changes in foreign currency rates and the cost of commodities. Greif is subject to additional risks and uncertainties described in its Form 10-K, Form 10-Q and Form 8-K reports and exhibits to those reports. This presentation reflects management’s views as of December 20, 2018. Except to the extent required by applicable law, Greif undertakes no obligation to update or revise any forward-looking statement.
REGULATION G
• This presentation includes certain non-GAAP financial measures like EBITDA and other measures that exclude special items such as restructuring and other unusual charges and gains that are volatile from period to period. Management of the company uses the non-GAAP measures to evaluate ongoing operations and believes that these non-GAAP measures are useful to enable investors to perform meaningful comparisons of current and historical performance of the company. All non-GAAP data in the presentation are indicated by footnotes. Tables showing the reconciliation between GAAP and non-GAAP measures are available at the end of this presentation and on the Greif website at www.greif.com.
December 20, 2018 – P.3
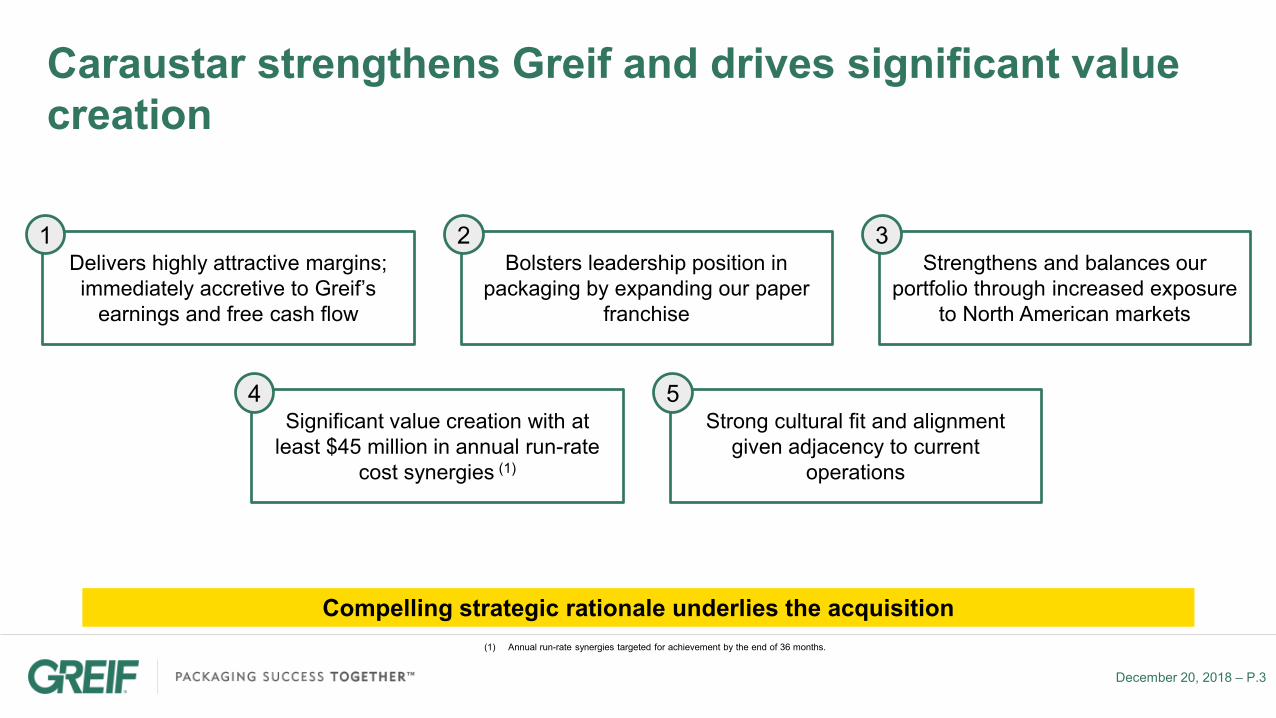
Caraustar strengthens Greif and drives significant value creation
Delivers highly attractive margins; immediately accretive to Greif’s
earnings and free cash flow
1Bolsters leadership position in
packaging by expanding our paper franchise
2Strengthens and balances our
portfolio through increased exposure to North American markets
3
Significant value creation with at least $45 million in annual run-rate
cost synergies (1)
4Strong cultural fit and alignment
given adjacency to current operations
5
(1) Annual run-rate synergies targeted for achievement by the end of 36 months.
Compelling strategic rationale underlies the acquisition
December 20, 2018 – P.4
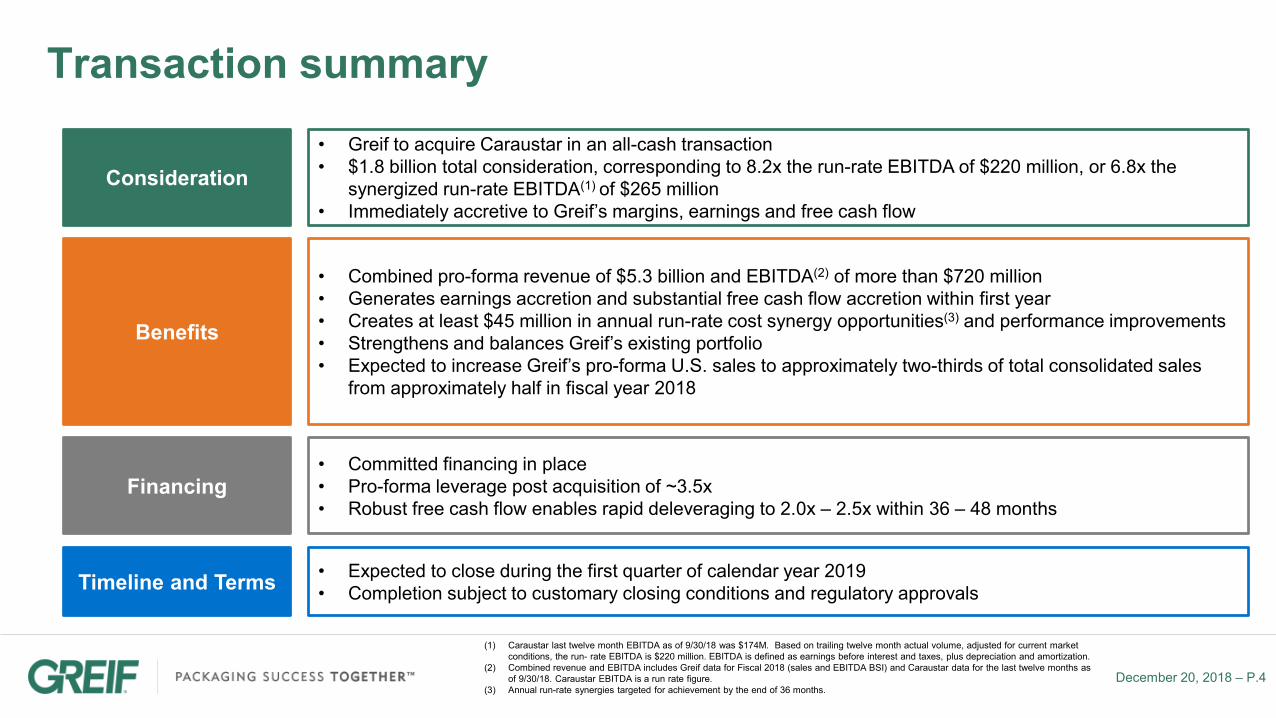
Transaction summary
Consideration• Greif to acquire Caraustar in an all-cash transaction• $1.8 billion total consideration, corresponding to 8.2x the run-rate EBITDA of $220 million, or 6.8x the
synergized run-rate EBITDA(1) of $265 million• Immediately accretive to Greif’s margins, earnings and free cash flow
Benefits
• Combined pro-forma revenue of $5.3 billion and EBITDA(2) of more than $720 million• Generates earnings accretion and substantial free cash flow accretion within first year• Creates at least $45 million in annual run-rate cost synergy opportunities(3) and performance improvements• Strengthens and balances Greif’s existing portfolio• Expected to increase Greif’s pro-forma U.S. sales to approximately two-thirds of total consolidated sales
from approximately half in fiscal year 2018
Timeline and Terms • Expected to close during the first quarter of calendar year 2019 • Completion subject to customary closing conditions and regulatory approvals
Financing• Committed financing in place• Pro-forma leverage post acquisition of ~3.5x• Robust free cash flow enables rapid deleveraging to 2.0x – 2.5x within 36 – 48 months
(1) Caraustar last twelve month EBITDA as of 9/30/18 was $174M. Based on trailing twelve month actual volume, adjusted for current market conditions, the run- rate EBITDA is $220 million. EBITDA is defined as earnings before interest and taxes, plus depreciation and amortization.
(2) Combined revenue and EBITDA includes Greif data for Fiscal 2018 (sales and EBITDA BSI) and Caraustar data for the last twelve months as of 9/30/18. Caraustar EBITDA is a run rate figure.
(3) Annual run-rate synergies targeted for achievement by the end of 36 months.
December 20, 2018 – P.5
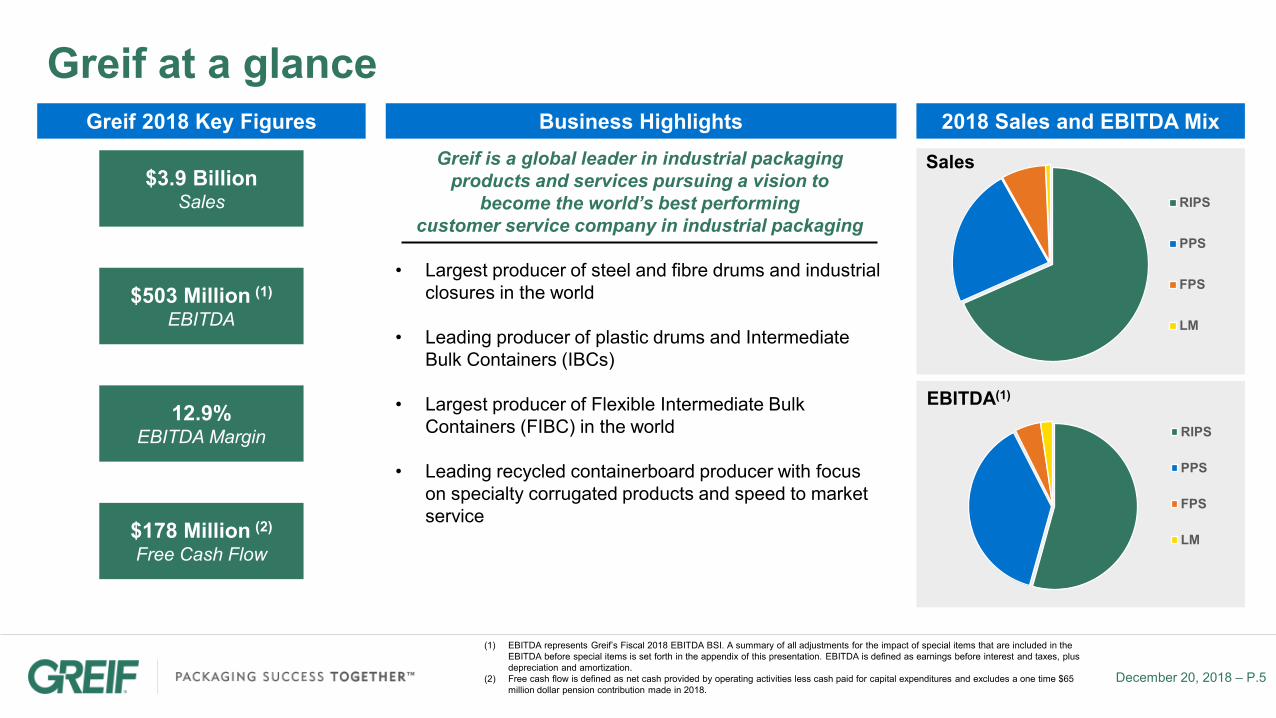
Greif at a glanceGreif 2018 Key Figures Business Highlights
$3.9 BillionSales
$503 Million (1)
EBITDA
12.9%EBITDA Margin
$178 Million (2)
Free Cash Flow
2018 Sales and EBITDA Mix
SalesGreif is a global leader in industrial packaging products and services pursuing a vision to
become the world’s best performingcustomer service company in industrial packaging
• Largest producer of steel and fibre drums and industrial closures in the world
• Leading producer of plastic drums and Intermediate Bulk Containers (IBCs)
• Largest producer of Flexible Intermediate Bulk Containers (FIBC) in the world
• Leading recycled containerboard producer with focus on specialty corrugated products and speed to market service
RIPS
PPS
FPS
LM
RIPS
PPS
FPS
LM
EBITDA(1)
(1) EBITDA represents Greif’s Fiscal 2018 EBITDA BSI. A summary of all adjustments for the impact of special items that are included in the EBITDA before special items is set forth in the appendix of this presentation. EBITDA is defined as earnings before interest and taxes, plus depreciation and amortization.
(2) Free cash flow is defined as net cash provided by operating activities less cash paid for capital expenditures and excludes a one time $65 million dollar pension contribution made in 2018.

December 20, 2018 – P.6
Caraustar at a glanceKey Caraustar Figures (1) Business Highlights
$1.4 BillionSales
$220 MillionEBITDA
16.0%EBITDA Margin
$177 Million2
Free Cash Flow
Caraustar is a leading vertically-integrated paperboard manufacturer that operates across four primary
segments in North America
• Leader in uncoated recycled paperboard and Tube & Core products
• Diverse mix of specialty products, customers and end markets, manufactured to a wide range of specifications and volumes across categories
• Vertically integrated platform, from recycled fiber processing to recycled paperboard production to industrial / consumer converting operations
• Scalable platform for further growth; proven acquisition track record
(1) Caraustar data for the last twelve months as of 9/30/18. EBITDA is a run rate figure.(2) Free cash flow defined as run-rate EBITDA less capex.
Geographic Footprint
Headquarters
Recycled Fiber (23)
Mills (12)
Industrial Products (45)
Consumer Products (7)

December 20, 2018 – P.7
Caraustar business and product overview
Recovered Fiber
Specialty
Brokerage
Fee Based
Mills
Uncoated Recycled Paperboard (URB)
Coated Recycled Paperboard (CRB)
Industrial Products
Tube & Core
Construction Products
Protective Packaging
Adhesives
Consumer Packaging
Folding Cartons
Food Service
Paper mill cores
Film cores
Yarn carriers
Construction cores
Other cores
Other products
Industrial End Markets
Frozen/perishablefoods
Household, hardware,auto
Dry foods
Pharma & healthcare
Other folding carton
Consumer End Markets
Vertically integrated system…. …That serves a variety of markets
December 20, 2018 – P.8
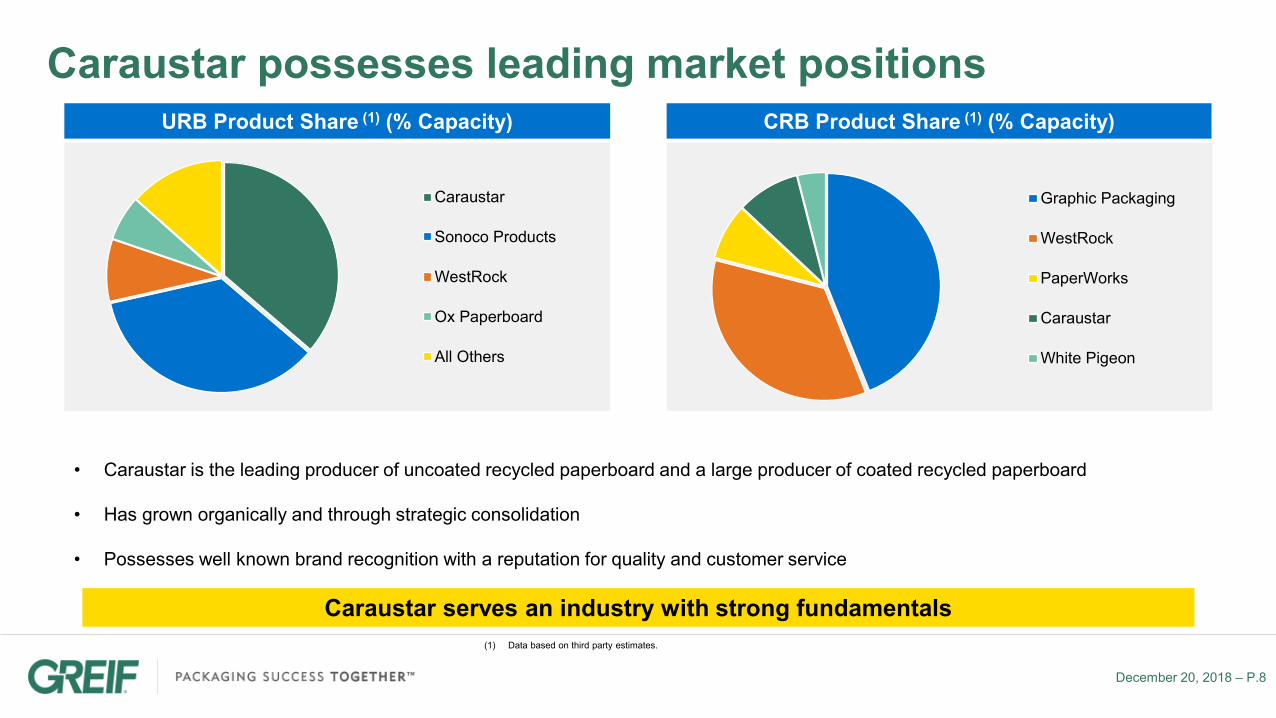
Caraustar possesses leading market positions
• Caraustar is the leading producer of uncoated recycled paperboard and a large producer of coated recycled paperboard
• Has grown organically and through strategic consolidation
• Possesses well known brand recognition with a reputation for quality and customer service
Caraustar serves an industry with strong fundamentals(1) Data based on third party estimates.
CRB Product Share (1) (% Capacity)
Graphic Packaging
WestRock
PaperWorks
Caraustar
White Pigeon
URB Product Share (1) (% Capacity)
Caraustar
Sonoco Products
WestRock
Ox Paperboard
All Others
December 20, 2018 – P.9
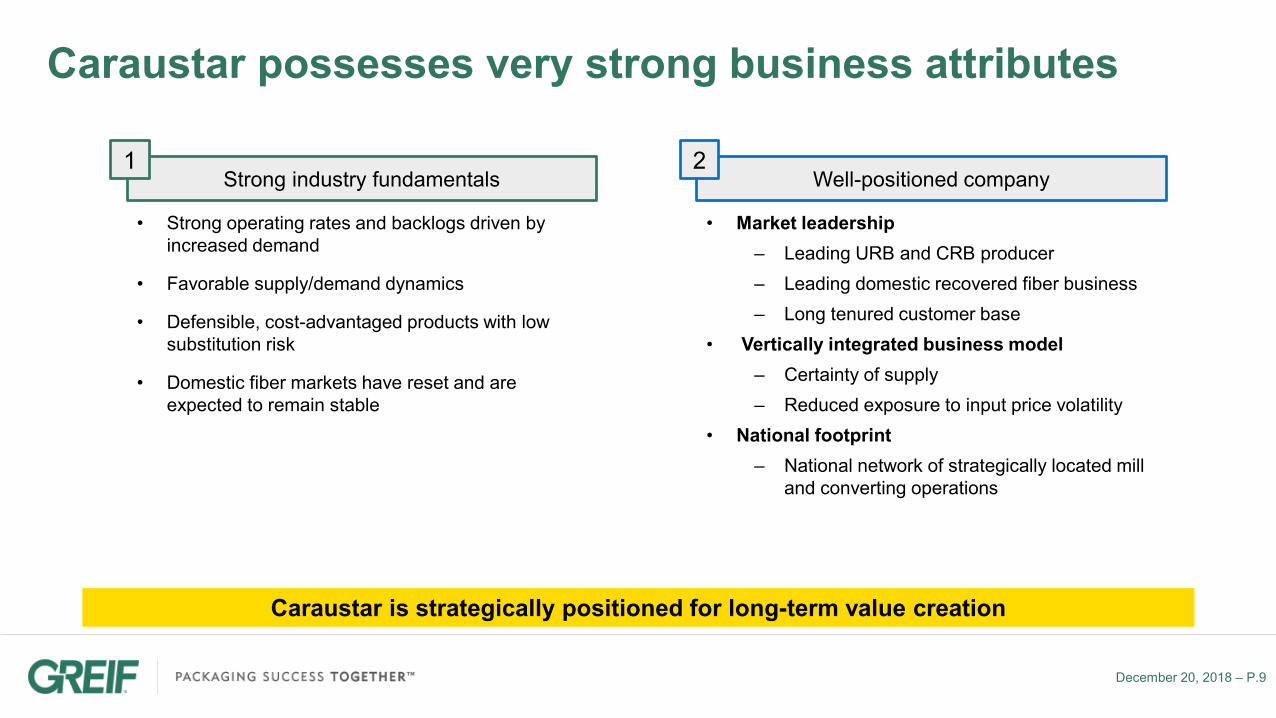
Caraustar possesses very strong business attributes
Strong industry fundamentals1
• Strong operating rates and backlogs driven by increased demand
• Favorable supply/demand dynamics
• Defensible, cost-advantaged products with low substitution risk
• Domestic fiber markets have reset and are expected to remain stable
Well-positioned company 2
• Market leadership‒ Leading URB and CRB producer‒ Leading domestic recovered fiber business‒ Long tenured customer base
• Vertically integrated business model‒ Certainty of supply‒ Reduced exposure to input price volatility
• National footprint‒ National network of strategically located mill
and converting operations
Caraustar is strategically positioned for long-term value creation

December 20, 2018 –P.10
Favorable industry fundamentals support profit growthURB Industry Operating Rates CRB Industry Operating Rates
75%
80%
85%
90%
95%
100%
2013 2014 2015 2016 2017 201875%
80%
85%
90%
95%
100%
2013 2014 2015 2016 2017 2018
(1) Based on third party historical data. OCC index represents U.S. southeast pricing.
December 20, 2018 –P.11
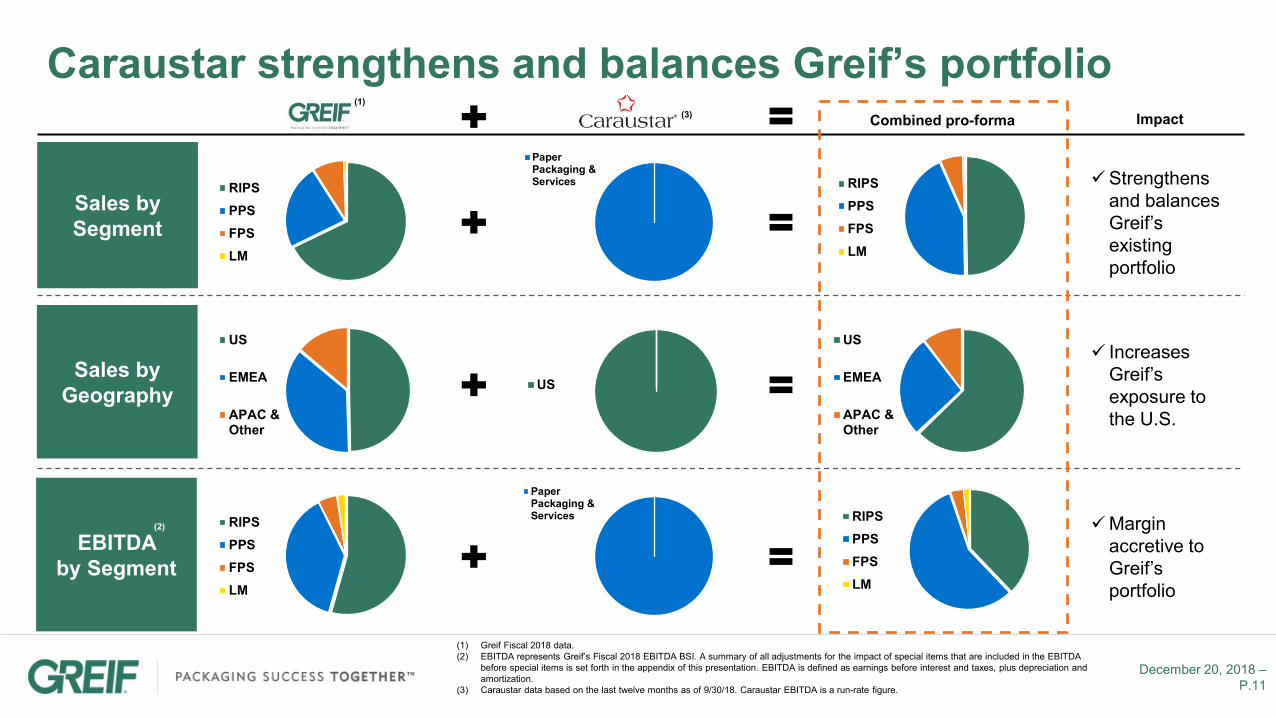
Caraustar strengthens and balances Greif’s portfolio
RIPSPPSFPSLM
Impact
US
EMEA
APAC &Other
RIPSPPSFPSLM
PaperPackaging &Services
US
PaperPackaging &Services
US
EMEA
APAC &Other
Sales by Segment
Sales by Geography
EBITDA by Segment
Combined pro-forma
Strengthens and balances Greif’s existing portfolio
Increases Greif’s exposure to the U.S.
Margin accretive to Greif’s portfolio
(1) Greif Fiscal 2018 data.(2) EBITDA represents Greif’s Fiscal 2018 EBITDA BSI. A summary of all adjustments for the impact of special items that are included in the EBITDA
before special items is set forth in the appendix of this presentation. EBITDA is defined as earnings before interest and taxes, plus depreciation and amortization.
(3) Caraustar data based on the last twelve months as of 9/30/18. Caraustar EBITDA is a run-rate figure.
(1)(3)
RIPSPPSFPSLM
(2)RIPSPPSFPSLM

December 20, 2018 –P.12
Significant synergies and performance improvements identified
• Identified full run-rate synergies of at least $45 million of cost synergies(1) and other performance improvements by end of 36 months
• Pace of synergy capture
‒ ~$15M by end of 12 months
‒ ~$25M by end of 24 months
‒ ~$45M by end of 36 months
• Detailed integration kicked off
‒ Management teams cooperating to develop plan for smooth integration
‒ Most key leaders being fully retained
‒ Similar experiences (e.g. adjacent portfolios with similar sales models) shared
‒ Expected one-time costs of roughly $77M that will be spread out over three years, including $13M of contingency
Clear line of sight to capturing identified synergies
Corporate/segment SG&A Procurement/sourcing Transportation
Other fixed costs Operational improvements
Identified synergies of ~$45M
(1) Annual run-rate synergies targeted for achievement by the end of 36 months.
Highlights
December 20, 2018 –P.13
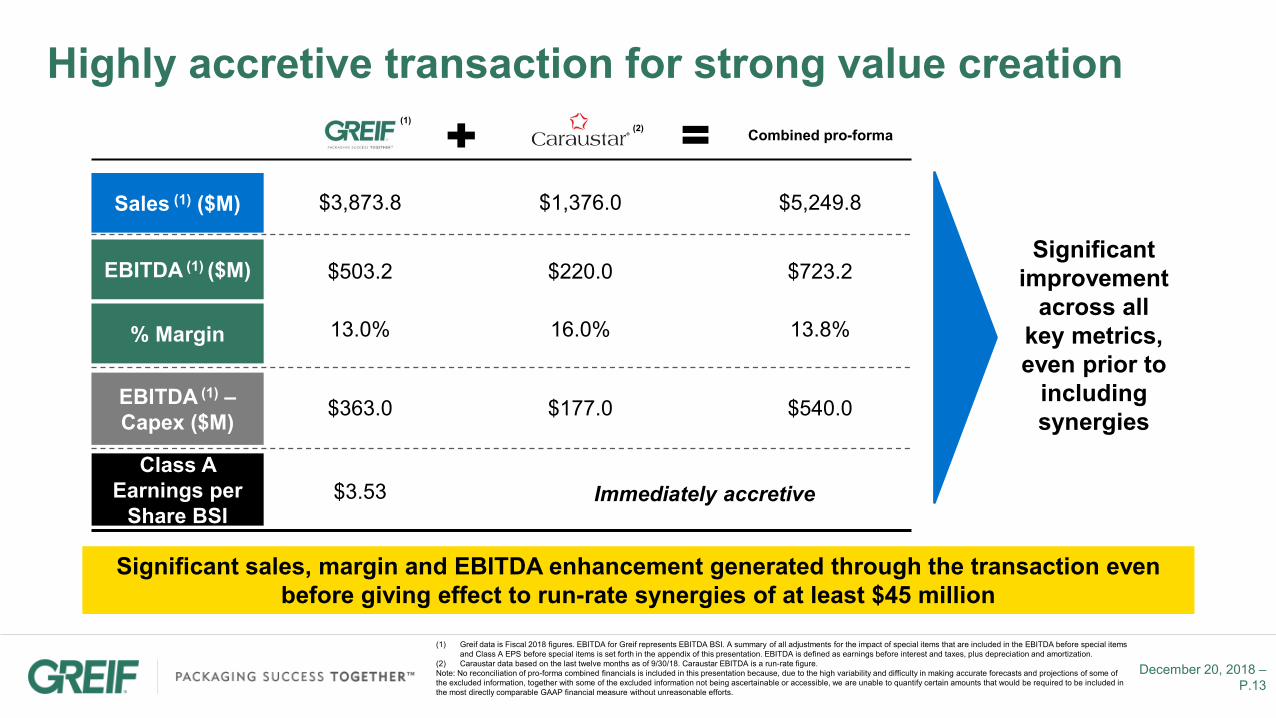
Highly accretive transaction for strong value creation
Significant sales, margin and EBITDA enhancement generated through the transaction even before giving effect to run-rate synergies of at least $45 million
Combined pro-forma
Sales (1) ($M)
EBITDA (1) ($M)
% Margin
EBITDA (1) –Capex ($M)
$3,873.8
$503.2
13.0%
$363.0
$1,376.0
$220.0
16.0%
$177.0
$5,249.8
$723.2
13.8%
$540.0
Significant improvement
across all key metrics, even prior to
including synergies
(1)(2)
(1) Greif data is Fiscal 2018 figures. EBITDA for Greif represents EBITDA BSI. A summary of all adjustments for the impact of special items that are included in the EBITDA before special items and Class A EPS before special items is set forth in the appendix of this presentation. EBITDA is defined as earnings before interest and taxes, plus depreciation and amortization.
(2) Caraustar data based on the last twelve months as of 9/30/18. Caraustar EBITDA is a run-rate figure.Note: No reconciliation of pro-forma combined financials is included in this presentation because, due to the high variability and difficulty in making accurate forecasts and projections of some of the excluded information, together with some of the excluded information not being ascertainable or accessible, we are unable to quantify certain amounts that would be required to be included in the most directly comparable GAAP financial measure without unreasonable efforts.
Class A Earnings per
Share BSI$3.53 Immediately accretive

December 20, 2018 –P.14
Robust free cash flow allows for rapid deleveragingCombined Company leverage ratio
~3.5x
2.5x
At Close Within 36 - 48 months
2.0x – 2.5x
After dividends, Greif will prioritize debt pay down until leverage ratio returns to 2.0x – 2.5x
Financing Overview
• Financing fully committed by a group of commercial banks providing additional term loans and bridge financing to a planned issuance of unsecured notes
• Existing 2019 Senior Notes to be taken out in conjunction with acquisition

December 20, 2018 –P.15
Compelling strategic combination
(1) Annual run-rate synergies targeted for achievement by the end of 36 months.
In industrial packaging, be the best performing customer service company in the world
Delivers highly attractive margins; immediately accretive to Greif’s
earnings and free cash flow
1Bolsters leadership position in
packaging by expanding our paper franchise
2Strengthens and balances our
portfolio through increased exposure to North American markets
3
Significant value creation with at least $45 million in annual run-rate
cost synergies (1)
4Strong cultural fit and alignment
given adjacency to current operations
5

APPENDIX
December 20, 2018 –P.17
Non – GAAP financial measures
Non-GAAP measures are intended to supplement and should be read together with our financial results. They should not be considered an alternative or substitute for, and should not be considered superior to, our reported financial results. Accordingly, users of this financial information should not place undue reliance on these non-GAAP financial measures.

December 20, 2018 –P.18
GAAP to Non-GAAP reconciliation:Segment and Consolidated Earnings Before Interest, Taxes, Depreciation & Amortization Before Special Items ($ Millions)
December 20, 2018 –P.19
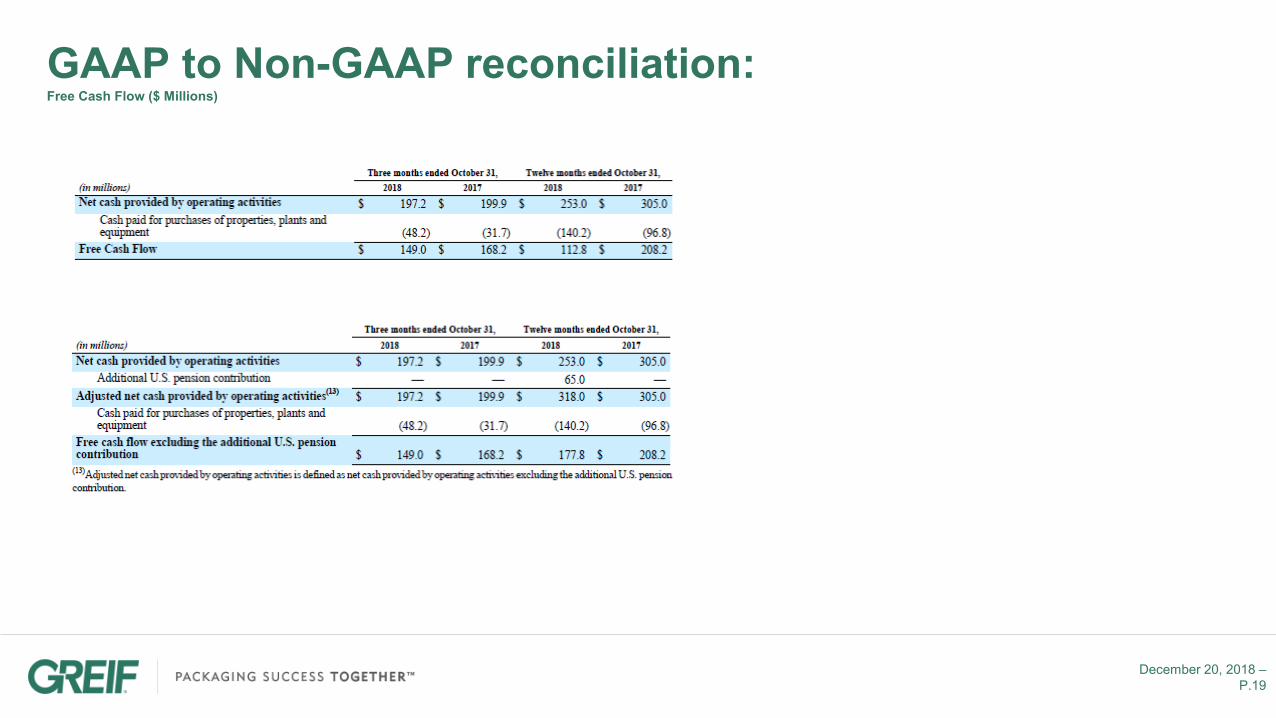
GAAP to Non-GAAP reconciliation:Free Cash Flow ($ Millions)

December 20, 2018 –P.20
GAAP to Non-GAAP reconciliation:Net Income and Class A Earnings Per Share Excluding Special Items – various time periods ($ Millions and $/sh)

December 20, 2018 –P.21
Net debt to trailing four quarter EBITDA BSI reconciliation:Q1 2016 Q2 2016 Q3 2016 Q4 2016 Q1 2017 Q2 2017 Q3 2017 Q4 2017 Q1 2018 Q2 2018 Q3 2018 Q4 2018
Short Term Borrowings 44.1 59.4 55.2 51.6 38.9 35.5 18.3 14.5 8.1 8.8 5.5 2.9 Current Portion of Long-term Debt 22.2 317.7 300.3 - - 15.0 16.3 15.0 15.0 15.0 15.0 19.4 Long Term Debt 1,112.1 777.0 758.6 974.6 1,074.8 1,033.6 1,033.7 937.8 1,010.8 1,020.5 1,020.1 887.8
TOTAL DEBT 1178.4 1154.1 1114.1 1026.2 1113.7 1084.1 1068.3 967.3 1033.9 1044.3 1040.6 910.1Less: Cash and Cash Equivalents 65.3 89.6 94.3 103.7 106.8 87.0 94.6 142.3 94.3 108.2 100.9 94.2
NET DEBT 1,113.1 1,064.5 1,019.8 922.5 1,006.9 997.1 973.7 825.0 939.6 936.1 939.7 815.9
Operating Profit 17.6 82.8 71.6 53.6 42.1 81.5 90.5 61.9 65.5 87.7 114.0 103.3Less: Other (income) expense, net 3.0 1.7 2.7 1.6 3.6 3.2 1.4 3.8 7.7 2.5 4.8 3.4Less: Equity (earnings) losses of unconsolidated affiliates, net of tax 0.0 0.0 (0.8) 0.0 0.0 0.0 (0.3) (1.7) 0.0 (0.8) (1.0) (1.2)Less: Non cash pension settlement charge 0.0 0.0 0.0 0.0 0.0 (1.1) 1.0 1.5 0.0 0.0 0.4 0.9Plus: Depreciation, depletion and amortization expense 32.3 32.0 31.5 31.9 30.7 31.0 27.7 31.1 31.7 32.4 32.4 30.4
EBITDA 46.9 113.1 101.2 83.9 69.2 108.2 116.1 89.4 89.5 118.4 142.2 130.6Restructuring charges 2.3 5.4 10.2 9.0 (0.3) 5.1 3.9 4.0 4.1 6.0 3.7 4.8Acquisition-related costs 0.0 0.1 0.0 0.1 0.0 0.0 0.0 0.7 0.2 0.0 0.5 0.0Non-cash asset impairment charges 39.1 1.7 4.1 6.5 1.9 2.0 2.0 14.9 2.9 0.4 0.8 4.2Non-cash pension settlement charge 0.0 0.0 0.0 0.0 23.5 1.1 1.0 1.5 0.0 0.0 0.4 0.9(Gain) loss on disposal properties, plants equipment, and businesses, net (0.9) (10.7) (2.0) 17.8 (0.5) (3.7) (1.9) 7.4 (4.6) (1.5) (1.3) 1.0Impact of Venezuela devaluation of inventory on cost of products sold 0.0 0.0 0.0 0.0 0.0 0.0 0.0 0.0 0.0 0.0 0.0 0.0Venezuela devaluation other (income) 0.0 0.0 0.0 0.0 0.0 0.0 0.0 0.0 0.0 0.0 0.0 0.0Timberland gains 0.0 0.0 0.0 0.0 0.0 0.0 0.0 0.0 0.0 0.0 0.0 0.0
EBITDA BSI 87.4 109.6 113.5 117.3 93.8 112.7 121.1 117.9 92.1 123.3 146.3 141.5
DEBT RATIO CALCULATIONQ1-16 Q2-16 Q3-16 Q4-16 Q1-17 Q2-17 Q3-17 Q4-17 Q1-18 Q2-18 Q3-18 Q4-18
Trailing 4 Qtr EBITDA BSI 404.1 409.2 414.5 427.8 434.2 437.3 444.9 445.5 443.8 454.4 479.6 503.2
Short Term Borrowings 44.1 59.4 55.2 51.6 38.9 35.5 18.3 14.5 8.1 8.8 5.5 2.9Current Portion of Long-term Debt 22.2 317.7 300.3 - - 15.0 16.3 15.0 15.0 15.0 15.0 19.4 Long Term Debt 1,112.1 777.0 758.6 974.6 1,074.8 1,033.6 1,033.7 937.8 1010.8 1020.5 1020.1 887.8TOTAL DEBT 1,221.7 1,197.4 1,157.4 1,069.5 1,157.0 1,127.4 1,111.6 1,010.6 1,077.2 1,087.6 1,083.9 953.4
EBITDA BSI MULTIPLE 3.02x 2.93x 2.79x 2.50x 2.66x 2.58x 2.50x 2.27x 2.43x 2.39x 2.26x 1.89x
Cash and Cash Equivalents (65.3) (89.6) (94.3) (103.7) (106.8) (87.0) (94.6) (142.3) (94.3) (108.2) (100.9) (94.2)
NET DEBT 1,113.1 1,064.5 1,019.8 922.5 1,006.9 997.1 973.7 825.0 939.6 936.1 939.7 815.9 EBITDA BSI MULTIPLE 2.75x 2.60x 2.46x 2.16x 2.32x 2.28x 2.19x 1.85x 2.12x 2.06x 1.96x 1.62x

December 20, 2018 –P.22
Note: pro-forma combined financials
No reconciliation of pro-forma combined financials is included in this presentation because, due to the high variability and difficulty in making accurate forecasts and projections of some of the excluded information, together with some of the excluded information not being ascertainable or accessible, we are unable to quantify certain amounts that would be required to be included in the most directly comparable GAAP financial measure without unreasonable efforts.