Embed Size (px)
Citation preview

Acquisition of El Monte RV
2020 Goal of $50M NPAT
Digital Platform Growth
thl Investor Presentation
21 December 2016

DISCLAIMER
2
This announcement contains forward-looking statements and projections. These reflect thl’s current expectations, based on what it
thinks are reasonable assumptions. The statements are based on information available to thl at the date of this announcement and
are not guarantees or predictions of future performance. For any number of reasons, the future could be different and the assumptions
on which the forward looking statements and projections are based could be wrong. thl gives no warranty or representation as to its
future financial performance or any future matter. Except as required by law or NZX listing rules, thl is not obliged to update this
announcement after its release, even if things change materially.
This announcement has been prepared for publication in New Zealand and may not be released or distributed in the United States.
This announcement is for information purposes only and does not constitute financial advice. It is not an offer of securities, or a
proposal or invitation to make any such offer, and may not be relied upon in connection with any purchase of thl securities. Past
performance information given in this announcement is given for illustrative purposes only and should not be relied upon as an
indication of future performance.
This announcement may contain a number of non-GAAP financial measures. Because they are not defined by GAAP or IFRS, thl’s
calculation of these measures may differ from similarly titled measures presented by other companies and they should not be
considered in isolation from, or construed as an alternative to, other financial measures determined in accordance with GAAP.
This announcement does not take into account any specific investors objectives and does not constitute financial or investment advice.
Investors are encouraged to make an independent assessment of thl.
The information contained in this announcement should be read in conjunction with thl’s latest financial statements, which are
available at: www.thlonline.com

KEY HIGHLIGHTS
3
El Monte (USA)
• Acquisition of El Monte Rents Inc., which operates El
Monte RV Rental and Sales business for an
enterprise value of NZ$93.5M (including transaction
costs).2
• Acquisition funded by NZ$82.2M of debt and 3.4M thl
shares.
• Acquisition EBIT multiple of 10.8x compared to thl
trading multiple of 11.9x (as at 30 November 2016).
• Implied multiple of 5.5x, based on forecast FY20
operating earnings.
• Significant synergies in fleet and operations expected
to be realised over the coming three years.
• Targeted improvement of return on funds employed
(ROFE) from 8% to 19% over the forecast period.
Roadtrippers
• US$6.0M investment made in Roadtrippers USA (top
travel company app), 22.5% ownership (paid in cash
and intellectual property assets).
• 50/50 thl/Roadtrippers joint venture created for New
Zealand and Australia.
• thl’s GeoZone business sold to the joint venture for
US$1.0M paid in joint venture shares.
• These two transactions result in an effective sale of
the GeoZone business for US$2.0M (with a gain on
sale of $1.2M).
Mighway
• Commitment to launch Mighway in North America in
the first quarter of the calendar year 2017.
New NPAT goal set of $50M1 to be achieved in FY20
EPS accretion in FY20 of circa 18cps over FY16Note 1: All figures presented in NZD unless stated otherwise
Note 2: NZD:USD FX conversion rate of 0.71 has been applied for the estimation of acquisition costs.
Note 3: Enterprise Value is prior to any purchase price adjustments for working capital, fleet and non-fleet assets, and other items at the effective date.

STRATEGIC INTENT – GLOBAL POSITION AND PLATFORM
4
• With the acquisition of El Monte, thl is well positioned as the global leader in RV rentals.
• thl will continue to invest in the core business, whilst recognising how we scale into lower capital
opportunities in both the digital services space and sharing economy.
• thl is now positioned as a truly global player with a reorientation further towards the northern
hemisphere.
“We are positively resetting the expectations for thl. These
transactions leverage our current business, skills and balance sheet.
We are making the right steps to be truly global in our platform.”
- Rob Campbell, Chairman thl

TAKING THE NEW ZEALAND PROPOSITION TO THE USA
5
BU
ILD
/ B
UY
RE
NT
SE
LL
NZ USABuilding off our core
capability
Utilising our
operational IP in
rental and sales
Road Bear model is
retained (great
flexibility and ROFE)
USA combined
business reflects the
New Zealand fleet
rotation and
business model
External
Dealers Dealers

NZ$M FY16 FY20
Current Business
(non USA) EBIT32.2 53
USA Business
EBIT12.4 31
Group support
services and other(5.9) (6)
Group EBIT 38.7 78
Share in JV and
associates2.0 6
Interest and tax (16.3) (34)
NPAT 24.4 50
ROFE 15% 19%
thl EPS1 21cps 39cps
TARGET $50M NPAT BY FY20
6
KEY ASSUMPTIONS:
• Forecasts include minimal yield growth.
• Current growth plans for the “core” remain a
focus.
• New growth from the North American
acquisition and synergy realisation.
• Modest growth from new initiatives:
• Mighway - including USA operation; and
• Roadtrippers.
• Current FX, tax and inflation rates.
• Interest rates reflect current expectations and
thl hedging policies.
• Group support costs reduce as a % of revenue
as thl achieves economies of scale.
• El Monte is expected to be loss-making during
the first six months post acquisition, primarily
due to the low season.
• The acquisition is expected to be EPS accretive
when measured for CY17.
ROFE REMAINS A KEY OBJECTIVE
Note 1: Basic EPS is calculated as NPAT divided by forecast shares on issue.

EL MONTE ACQUISITION
7

STRATEGIC INTENT - EL MONTE PURCHASE
8
The acquisition of El Monte enables thl to:
• Capitalise on strong growth in the North American tourism market;
• Be a clear number two in the North American RV rental market;
• Develop a broad-based RV and sales rentals business in the USA, with a similar business model to
that in NZ;
• Leverage overhead and infrastructure both ‘in country’ and within thl group support services; and
• Continued global diversification and growth in the rental and sales market.

EL MONTE TRANSACTION OVERVIEW
9
• The transaction is primarily debt funded, with US$8M of the purchase price being funded
by the issue of 3,384,266 shares in thl, which following the settlement will represent 2.8%
of thl’s ordinary shares on issue. The number of thl shares to be issued is fixed and is
based on an agreed exchange rate (0.7410) and the thl volume weighted average share
price of the 3 months prior to the negotiation of the purchase price ($3.19).
• Structured as an acquisition of shares with a Section 338 election treating the transaction
as an asset sale for US tax purposes.
Deal
Structure
Purchase
Price
Other items
• Enterprise value: US$65.3M (NZ$91.9M).
• ‘Underwrite’ on fleet values (if not sold at agreed values) of up to US$0.9M.
• Six property leases of 10 years to be entered into with entities related to the vendors.
• Vendors, Tucker and Todd Schork, to remain in the business for a period of up to 12
months to assist with transition.
Valuation
metrics
• Financial year to June 2016 EBIT multiple of 10.8x (based on pro forma FY16).
• Multiple includes reduced salary cost associated with vendor’s family.
• Pro forma historical EPS accretion of 2.3 cents1.
Acquisition
• Acquisition of El Monte RV Rentals and Sales.
• Transaction effective date: 1 January 2017.
• The acquisition is expected to settle on 6 January 2017 (NZ time) and is only subject to usual
closing conditions that thl expects to be satisfied prior to settlement.
Note 1: Based on pro forma FY16.

$M
Year ending30 June 2016
(USD)
31 December
2017 (CY17)
(USD)
30 June 2020
(USD)
30 June 2016
(NZD)
30 April 2016
(CAD)
30 June 2016
(AUD)
Purchase price
/ EV65.3m 65.3m 65.3m 459.3m 60.1m 317.4m
NTOA 46.3m2 n/a n/a 224.1m 41.5m 163.6m
EBIT 6.0m3 6.6m 11.9m 38.7m 4.9m 17.2m
EV / NTOA 1.4x n/a n/a 2.0x 1.5x 1.9x
EV / EBIT 10.8x 9.9x 5.5x 11.9x 12.2x 18.4x
ACQUISITION METRICS - COMPARABLE COMPANY ANALYSIS1
10
1Market data as at 30 November 2016 and most recent published debt figures.
2Estimated net tangible operating assets as at 31 December 2016.
3Non-GAAP pro-forma EBIT adjusted for market property leases and vendor family costs.

FUNDING
11
• The total acquisition cost is expected to be
financed using $58.4M of new US
denominated debt and the issue of thl shares
to the vendor.
• The additional debt has been raised from thl’s
existing lenders.
• Interest rates to be hedged in accordance to
thl treasury policy.
• Issuance of 3.4M additional thl shares.
• The covenant structures are in line with the
existing facilities with movements in thresholds
to allow for the acquisition.
• Debt to EBITDA multiple post acquisition at
2.0x is below market comparators such as
Apollo (approximately 2.8x).
• Forecast debt to EBITDA remains within
Moody’s Baa guidelines at financial year ends.
1.4
2.0 1.9
-
0.5
1.0
1.5
2.0
2.5
Jun-16 Jun-17 Jun-18
US
$'m
Debt:EBITDA
Sources and Uses of Funds US$ NZ$
Sources
Additional US$ debt 58.4m 82.2m
Additional shares 8.0m 11.3m
Total 66.4m 93.5m
Uses
Purchase price 65.3m 91.9m
Transaction costs 1.1m 1.6m
Total 66.4m 93.5m
Note 1: USD:NZD conversion rate of 0.71.
Note 2: Number of shares issued is fixed based on a pre-agreed exchange rate. The acquisition cost associated with the shares will be determined post completion.
Note 3: Transaction costs presented are pre tax.

El Monte –The Business
12

BUSINESS OVERVIEW
13
• Family owned business established in El Monte, California in 1970.
• Second largest RV rental operator in North America.
• A fleet of 1,600 vehicles at 30 June 2016, some of which are aged. An opportunity to deliver
improved rental revenue with lower fleet numbers.
• Similar operating model to thl with revenues generated from both RV rentals and RV sales (75% and
25% respectively in FY16).
• 26 branches across the USA (11 operated and 15 franchised).
• Approximately half of rental customers are international (primarily Europe).
• Two of the vendors will remain with the business for a period of up to 12 months post acquisition to
assist with transition.
• Ken Schork (founder and industry leader) will retire after 46 years of leading the business.

BRANCH NETWORK
14
El Monte operated - 11
El Monte franchise - 15
Road Bear operated - 7
California
San Francisco
Los Angeles
• The acquisition of El Monte will increase thl’s reach in the USA.

KEY FACTS: EL MONTE
15
• Higher domestic customer base compared to Road Bear.
• Similar international client base (positive).
• International customers primarily from Europe and the UK.Customer
Locations
Revenue
metrics
• 11 locations operated by El Monte.
• 15 franchisee locations.
• 7 locations the same as Road Bear (opportunity for some future co-location).
• Annualised utilisation under 40%.
• Revenue per customer higher than Road Bear (on average).
• ‘Add on’ revenue similar to Road Bear.
Vehicle
Sales
• Retail sales model from six operated sites.
• No current wholesale dealer sales relationships.
Fleet • Estimated at acquisition: 1,350 down from approximately 1,600 at 30 June 2016.
• 189 counted as inventory for sale on acquisition.
• Average age of 3.7 years.
• Fleet consists of both “C” and “A” class.
• Studio and trailer fleet excluded and will be disposed.

Road Bear El Monte
Fleet rotation under 18 months Fleet rotation over 4+ years (current model)
Customers dominated by international trade Diverse customer spread between international and
domestic
Channel dominated by trade Good spread of channel mix including strong local
store sales and local brand
Swiss German brand with European resonance Established domestic brand with local resonance
Capacity constrained Well located infrastructure with capacity
EL MONTE VS ROAD BEAR
16
El Monte is complementary to the Road Bear business, providing a broader range of fleet (age and style)
and diversification of customer origin and channels.
OPTIMISATION STRATEGY
17
• Family owned business costs removed.
• Property rationalisation opportunities (co-locate some branches on one site).
• Reduces need for future Road Bear infrastructure investment.Synergies
Branch
Network
Market
Position
• Maximise the substantive infrastructure.
• Additional sale locations for Road Bear.
• Franchisee model has potential for thl.
• Positions thl as sensible second player in the market behind Cruise America.
• Enables Road Bear to maintain a premium position with an additional sales
channel (some fleet moves to El Monte after one season in Road Bear).
• Retain current branding.
Vehicle
Sales
• Retail sales sites provide flexibility with the current Road Bear wholesale model.
• RV refurbishment facilities provide Road Bear cost efficiencies.
• Flexibility for El Monte fleet decisions with a combined approach with Road Bear.
Fleet
• Reduce the current El Monte fleet from approximately 1,600 (30 June 2016) to
1,100 over time.
• Improve utilisation significantly.
• Reduce average age of fleet.
• Operating costs will improve with younger fleet.

MARKET POSITION
18
Market position
• North America is the largest global RV market.
• thl will become the second largest RV rental
operator in the USA market post acquisition.
Relative market size
• Road Bear currently has approximately 10%
share in the United States based on fleet
numbers.
• Combined share of total fleet of approximately
28% as a result of fleet rationalisation.
Cruise America
52%
Road Bear / El Monte
28%
Apollo10%
Jucy4%
Escape4%
Best Time RV2%
After transaction
USA FLEET SHARE ONLY
Note 1: information based on thl management’s estimate of vehicle fleet numbers.

RISKS, OPPORTUNITIES AND MITIGATIONS
19
• thl to apply proven acquisition methodology.
• Agreed exit of vendor associated costs.
• thl has retained two of the vendor family members within the business for a period of up to 12
months to assist with the integration of the business with thl and realisation of synergies.
• A USA advisory / review Board will be established including the thl CEO and Chairman and
vendor representatives.
• Strict capital efficiency and associated operating cost benefits are the primary focus.
Transition
Vehicle sale
prices
Funding
• Sale and purchase agreement contains ‘underwrite’ provisions in the event that the sale prices of
inventory vehicles are lower than anticipated.
• Vehicle by vehicle valuation undertaken by thl.
• Conservative sales price assumptions in forecasts.
• thl hedging policy will apply.
• Targeted debt reduction can be controlled by fleet acquisitions.
• Currency risk is mitigated by use of US dollar denominated debt.
Synergy
realisation
• Lease agreements negotiated to align with synergy expectations.
• Further procurement benefits being investigated (opportunity).
Tourism market
conditions
• thl has the ability to reduce vehicle purchases in El Monte by transferring fleet from Road Bear after
one season. It also has the ability to increase sales of vehicles to reduce leverage and ‘right size’ the
business in the event of adverse market conditions (~33% “flex” capability within the fleet).
• Geographical diversification spreads thl’s risk (opportunity).

PRO-FORMA FINANCIAL PERFORMANCE
20
• El Monte has a lower ROFE than Road Bear
reflecting excess fleet and a higher average
age.
• Returns to be improved through fleet
rationalisation (improved capital efficiency), a
focus on higher utilisation and operational
efficiencies.
• Fleet rationalisation strategy assumes initial sell-
down of excess fleet at low margins.
• Key synergies relate to vendor costs (family
employee and associated costs) and property
rationalisation.
• Synergies are expected to be realised over a
three year period as El Monte is fully integrated
with thl.
• Fleet rotation benefits from a combined fleet
management plan aren’t fully realised until FY19.
US$M FY16 CY17 FY20
EBIT El Monte
(pro forma & synergies)1
6.0 6.6 11.9
Purchase price 65.3 65.3 65.3
EBIT multiple 10.8x 9.9x 5.5x
Funds employed2 71.2 62.6 61.6
ROFE El Monte
(pro forma)3
8% 11% 19%
Note 1: Non-GAAP pro-forma EBIT adjusted for market property leases and
vendor family costs.
Note 2: Funds employed based on period end funds adjusted to reflect goodwill
and intangibles post acquisition.
Note 3: ROFE is calculated based on non-GAAP pro-forma EBIT, adjusted for
market property leases and vendor family costs, divided by period end funds
employed.

RETURN – ROFE
21
• Current Road Bear ROFE is unsustainable
without further investment, with an
expectation that ROFE would decline to
approximately 18% on a standalone basis.
• Acquisition of El Monte provides additional
capacity.
• Fleet rationalisation provides an opportunity
to enhance ROFE of El Monte.
• The combined business model is a strong
platform for future growth in ROFE.
Note 1: Financial year figures assume a June year end.
Note 2: ROFE is calculated based on non-GAAP pro-forma EBIT, adjusted for market
property leases and vendor family costs, divided by period end funds employed
Note 3: Funds employed as at financial year end have been adjusted to reflect goodwill
and intangibles post acquisition.
ROFE FY16 FY20
Road Bear ROFE 24% 22%
El Monte ROFE
(pro forma)
8% 19%
Consolidated ROFE
(incl synergies)
14% 20%

Scorecard Measure Target
Increase utilisation. Two years of substantive improvement.
Achieve acceptable ROFE for El Monte. ROFE of 19% by 2020.
Achieve property synergies. Property synergies realised by July 2018.
Reduce fleet size and inventory at
acceptable prices.
390 sales including all inventory fleet by
September 2017.
2017 calendar year EBIT. CY17 EBIT of approximately US$6.6m.
Total thl debt at December 2017. Forecast debt at December 2017 of
approximately NZ$205m.
SCORECARD
22
thl will report on the following scorecard measures in later periods.

OTHER INVESTMENTS
23
Strategic Rationale
• Creating global, scalable digital proposition in self drive tourism market.
• GeoZone performing in NZ and Australian market, but not easily scalable globally.
• Partnering with the global leader, rather than build in-house and compete.
Transaction Details
• US$2M value attributed to GeoZone (NZ$1.2M gain on sale).
• US$5M cash investment in Roadtrippers and US$1M in GeoZone assets for 22.5% shareholding,
including one Board seat.
• Roadtrippers was cash flow positive, but further investment required for next growth plans. thl’s
US$5M investment is considered sufficient to fund next two years.
• JV in NZ and Australia, with modest losses anticipated in FY17 and FY18 while becoming more
established. thl is equity accounting the losses during the next two years through this growth phase.
• thl has beneficial licence terms as a result of this partnership.
ROADTRIPPERS INVESTMENT
24
Strategic Rationale and Transaction Details

The top US road trip travel app
• Travellers discover places, plan trips, read
trip guides, book hotels & seamlessly sync
between web & mobile apps for navigation.
• 2.5M monthly users with 250,000 trips
planned per month.
• $2M in revenue in FY16 100% year on year
revenue growth.
• Australia and NZ launch planned in 2017.
• Proprietary and unique travel geodata set.
ROADTRIPPERS INVESTMENT
25
Roadtrippers has built a proprietary and unique travel geodata set that creates a compelling customer
proposition (Roadtrippers Website and app) on a self drive holiday. That location information also
creates a global dataset business opportunity (Atlas).

The canonical travel geo database
• The Atlas mission is to build the world’s best
travel geo-data tools and APIs. Atlas
harnesses the power of artificial intelligence
to create a new travel data ecosystem at
scale.
• Atlas will evolve into a distributed
marketplace for tourism listings and traveller
insights, and the product that is best placed
to power the data-driven future of travel in
vehicle and voice.
• Atlas is ready to expand on the groundwork
laid by GeoZone through major partnerships,
and to unlock access to the broader tourism
market in Australasia and the USA.
ROADTRIPPERS INVESTMENT
26

MIGHWAY USA
27
Update
• Mighway NZ has shown strong owner acquisition, engagement and improving online metrics.
• El Monte’s infrastructure will be leveraged for Mighway expansion.
• Mighway North American launch in Q1 2017 with a West Coast USA focus at launch.
• The managed dealer model will be the primary channel to market.
• Costs included in new forecast for FY17.

OUTLOOK
28
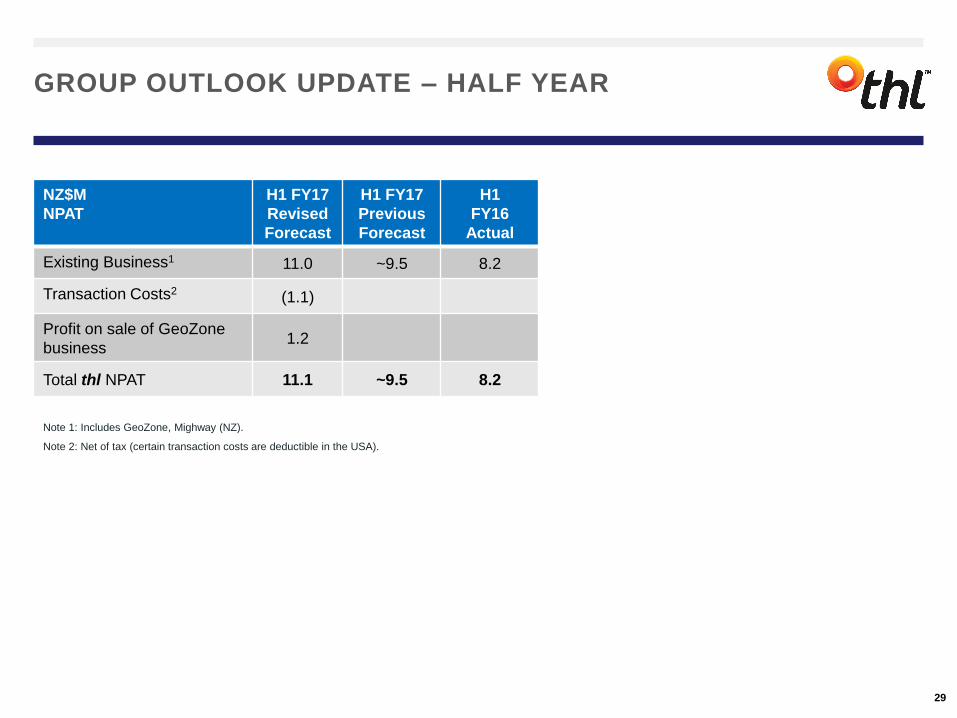
NZ$M
NPAT
H1 FY17
Revised
Forecast
H1 FY17
Previous
Forecast
H1
FY16
Actual
Existing Business1 11.0 ~9.5 8.2
Transaction Costs2(1.1)
Profit on sale of GeoZone
business1.2
Total thl NPAT 11.1 ~9.5 8.2
GROUP OUTLOOK UPDATE – HALF YEAR
29
Note 1: Includes GeoZone, Mighway (NZ).
Note 2: Net of tax (certain transaction costs are deductible in the USA).
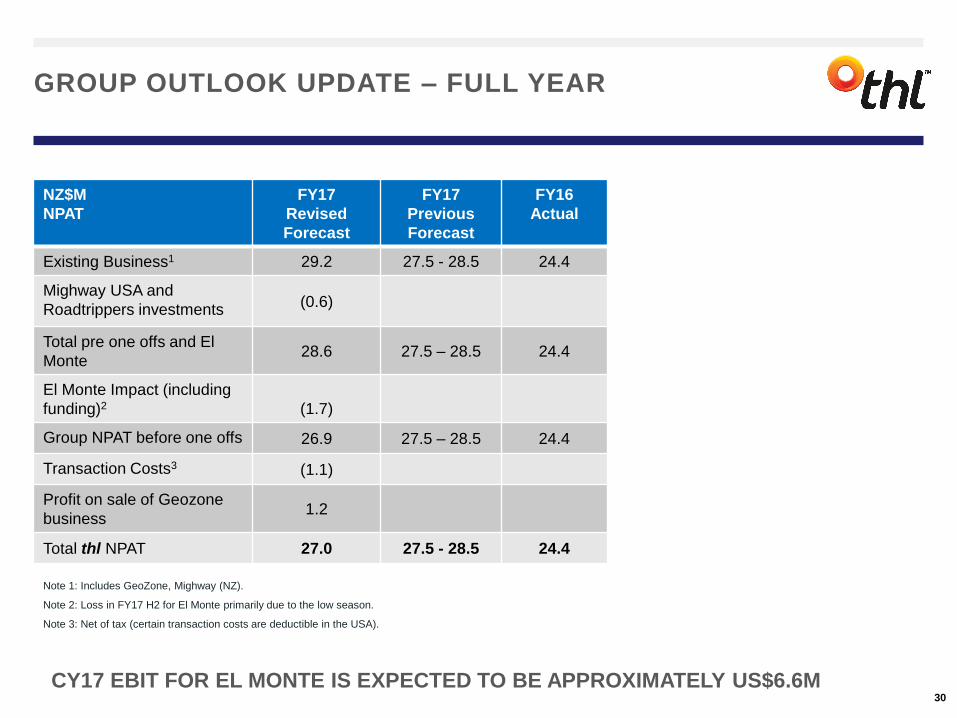
NZ$M
NPAT
FY17
Revised
Forecast
FY17
Previous
Forecast
FY16
Actual
Existing Business1 29.2 27.5 - 28.5 24.4
Mighway USA and
Roadtrippers investments(0.6)
Total pre one offs and El
Monte28.6 27.5 – 28.5 24.4
El Monte Impact (including
funding)2 (1.7)
Group NPAT before one offs 26.9 27.5 – 28.5 24.4
Transaction Costs3 (1.1)
Profit on sale of Geozone
business1.2
Total thl NPAT 27.0 27.5 - 28.5 24.4
GROUP OUTLOOK UPDATE – FULL YEAR
30
Note 1: Includes GeoZone, Mighway (NZ).
Note 2: Loss in FY17 H2 for El Monte primarily due to the low season.
Note 3: Net of tax (certain transaction costs are deductible in the USA).
CY17 EBIT FOR EL MONTE IS EXPECTED TO BE APPROXIMATELY US$6.6M

END
31


![4 Multiprocessor Programming - inf.pucrs.br · For example, following awk script, which you ... npat = "%5d %6.3g %8.3g\n" # print the actual times as given and their speedups printf(npat,1,1.0,t[1])](https://img.pdfslide.net/doc/110x75/5b35a5a87f8b9abc218d78fc/4-multiprocessor-programming-infpucrsbr-for-example-following-awk-script.jpg)