Embed Size (px)
Citation preview
Aswath Damodaran 1
Acquisition Valuation
Aswath Damodaran
Aswath Damodaran 2
Issues in Acquisition Valuation
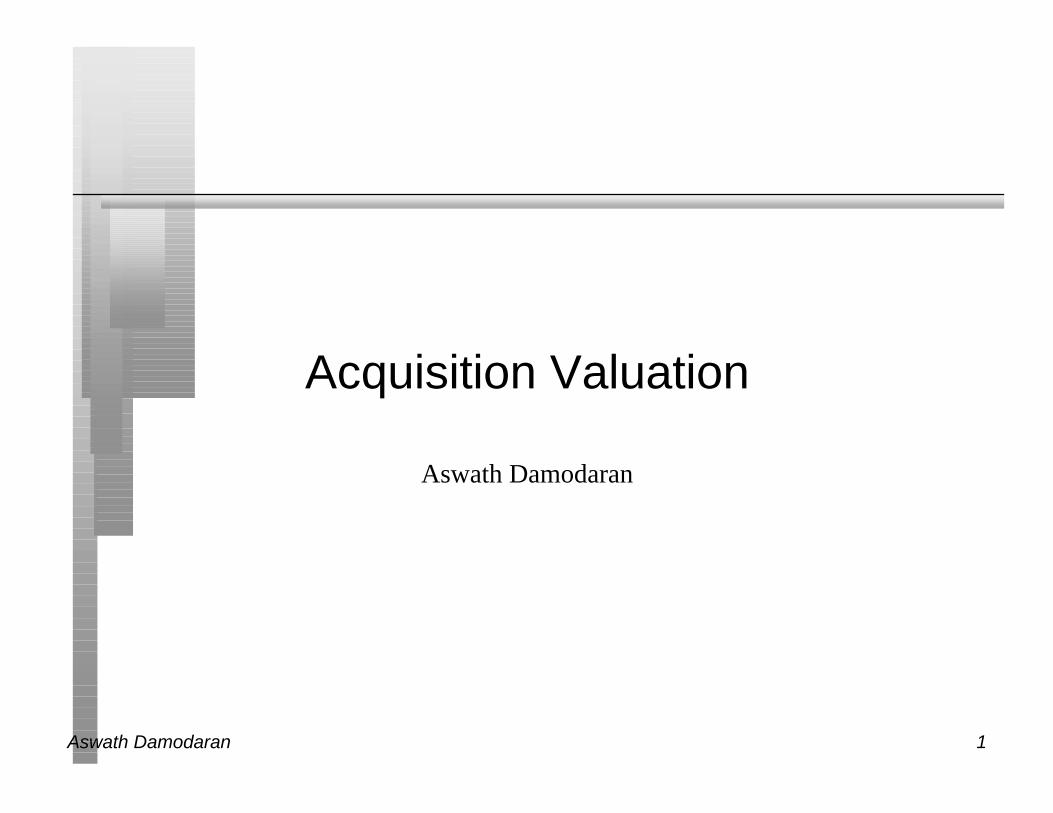
n Acquisition valuations are complex, because the valuation ofteninvolved issues like synergy and control, which go beyond just valuinga target firm. It is important on the right sequence, including
• When should you consider synergy?
• Where does the method of payment enter the process.
n Can synergy be valued, and if so, how?
n What is the value of control? How can you estimate the value?
Aswath Damodaran 3
Steps involved in an Acquisition Valuation
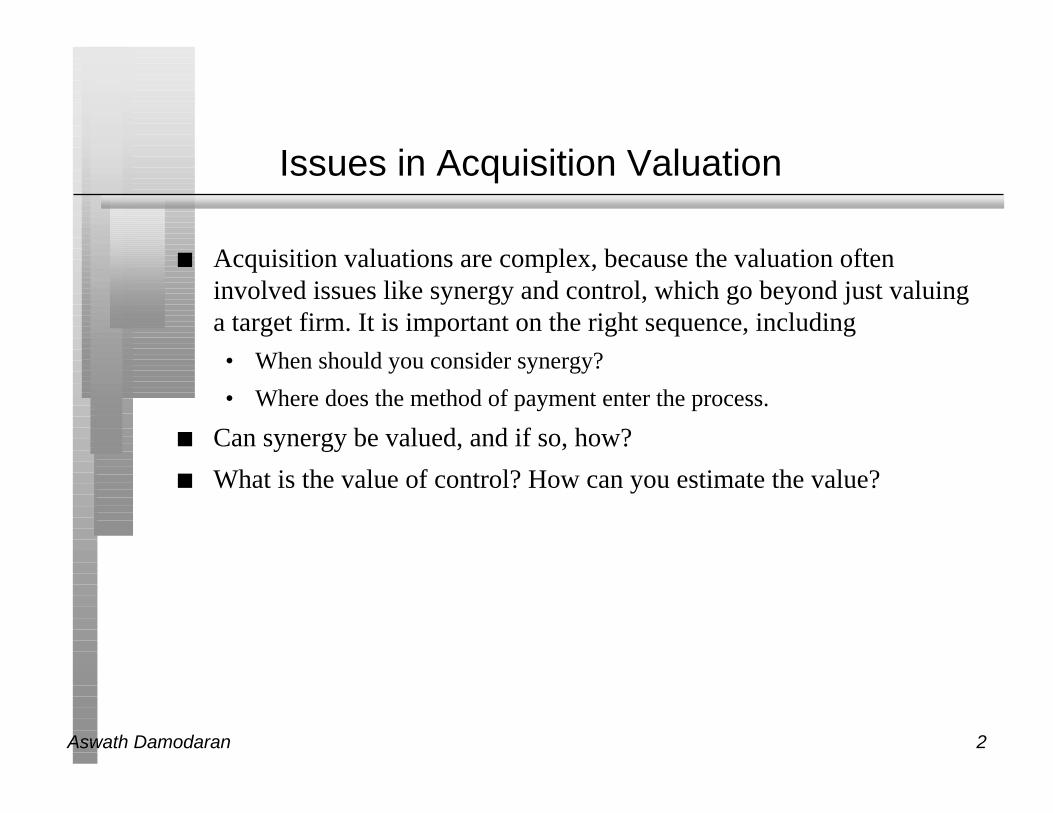
n Step 1: Establish a motive for the acquisition
n Step 2: Choose a targetn Step 3: Value the target with the acquisition motive built in.
n Step 4: Decide on the mode of payment - cash or stock, and if cash,arrange for financing - debt or equity.
n Step 5: Choose the accounting method for the merger/acquisition -purchase or pooling.
Aswath Damodaran 4
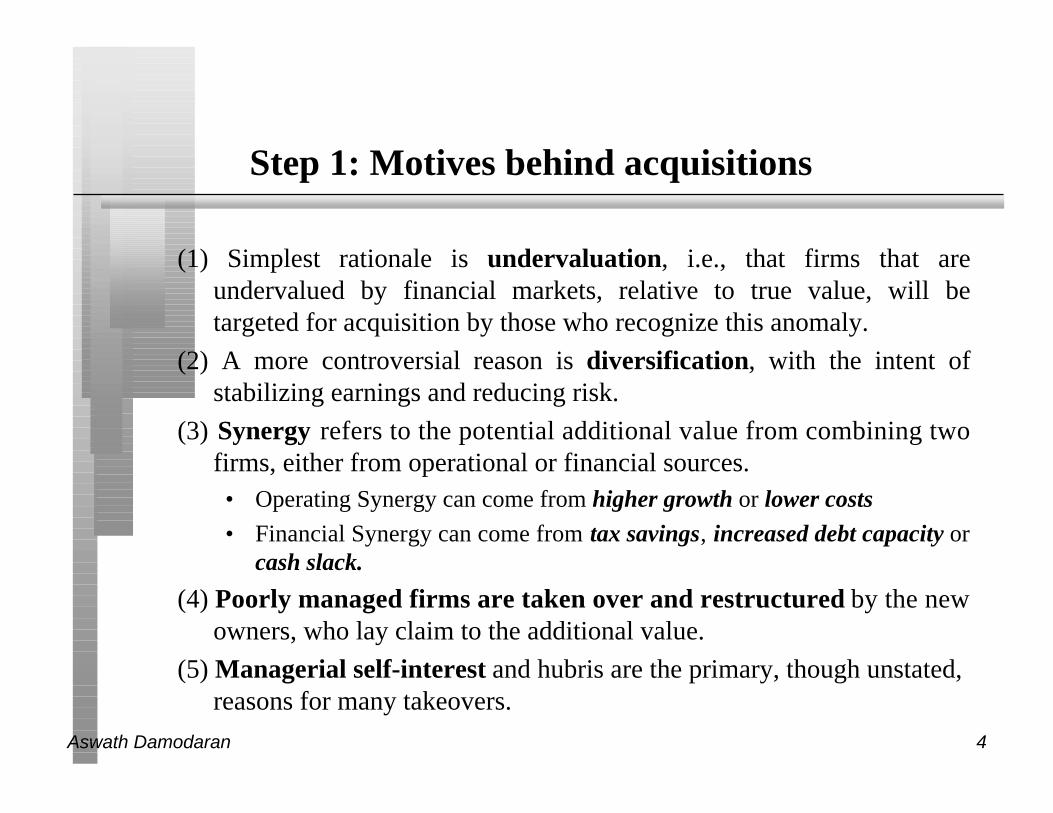
Step 1: Motives behind acquisitions
(1) Simplest rationale is undervaluation, i.e., that firms that areundervalued by financial markets, relative to true value, will betargeted for acquisition by those who recognize this anomaly.
(2) A more controversial reason is diversification, with the intent ofstabilizing earnings and reducing risk.
(3) Synergy refers to the potential additional value from combining twofirms, either from operational or financial sources.• Operating Synergy can come from higher growth or lower costs
• Financial Synergy can come from tax savings, increased debt capacity orcash slack.
(4) Poorly managed firms are taken over and restructured by the newowners, who lay claim to the additional value.
(5) Managerial self-interest and hubris are the primary, though unstated,reasons for many takeovers.
Aswath Damodaran 5
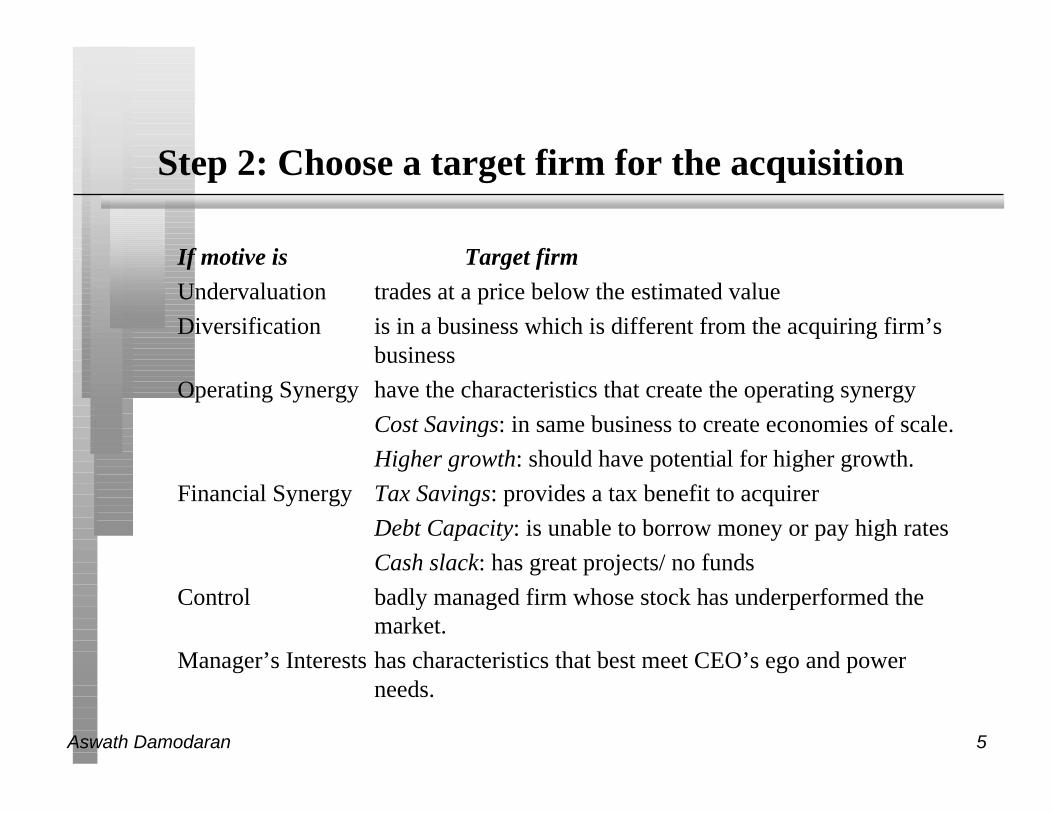
Step 2: Choose a target firm for the acquisition
If motive is Target firm
Undervaluation trades at a price below the estimated value
Diversification is in a business which is different from the acquiring firm’sbusiness
Operating Synergy have the characteristics that create the operating synergy
Cost Savings: in same business to create economies of scale.
Higher growth: should have potential for higher growth.
Financial Synergy Tax Savings: provides a tax benefit to acquirer
Debt Capacity: is unable to borrow money or pay high rates
Cash slack: has great projects/ no funds
Control badly managed firm whose stock has underperformed the market.
Manager’s Interests has characteristics that best meet CEO’s ego and power needs.
Aswath Damodaran 6
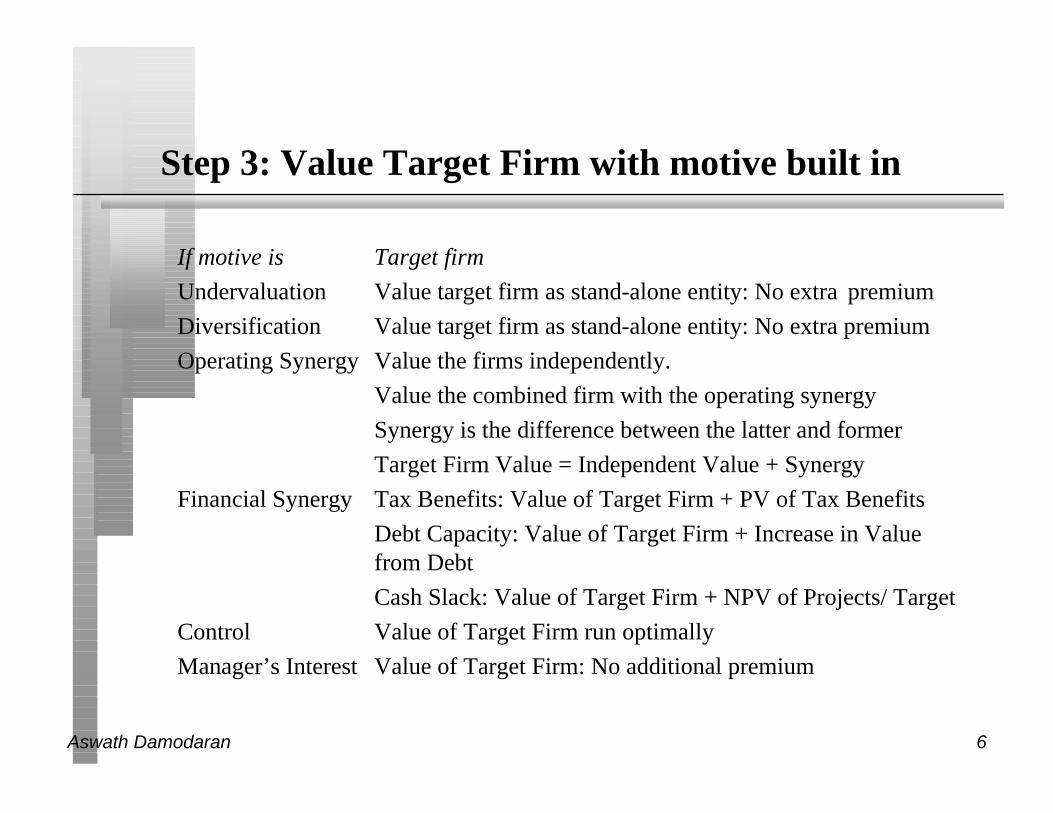
Step 3: Value Target Firm with motive built in
If motive is Target firm
Undervaluation Value target firm as stand-alone entity: No extra premium
Diversification Value target firm as stand-alone entity: No extra premium
Operating Synergy Value the firms independently.
Value the combined firm with the operating synergy
Synergy is the difference between the latter and former
Target Firm Value = Independent Value + Synergy
Financial Synergy Tax Benefits: Value of Target Firm + PV of Tax Benefits
Debt Capacity: Value of Target Firm + Increase in Value from Debt
Cash Slack: Value of Target Firm + NPV of Projects/ Target
Control Value of Target Firm run optimally
Manager’s Interest Value of Target Firm: No additional premium
Aswath Damodaran 7
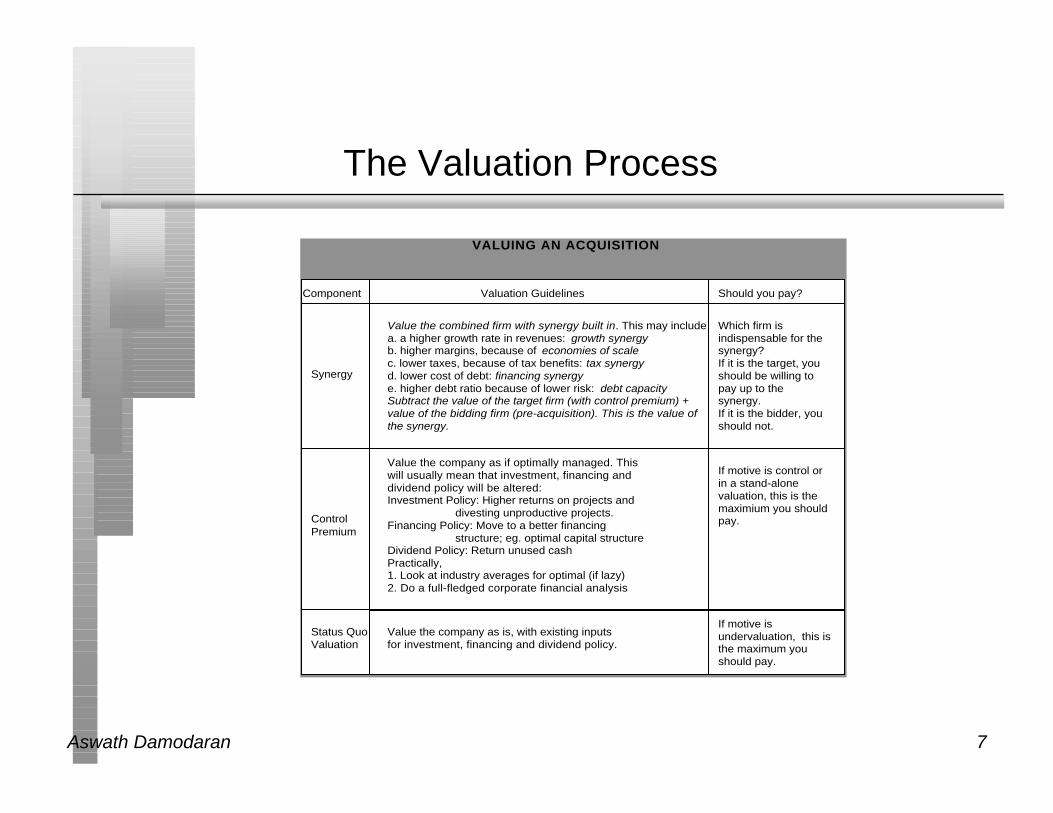
The Valuation Process
Status QuoValuation
ControlPremium
Synergy
Value the company as is, with existing inputsfor investment, financing and dividend policy.
Value the company as if optimally managed. Thiswill usually mean that investment, financing anddividend policy will be altered:Investment Policy: Higher returns on projects and
divesting unproductive projects.Financing Policy: Move to a better financing
structure; eg. optimal capital structureDividend Policy: Return unused cashPractically,1. Look at industry averages for optimal (if lazy)2. Do a full-fledged corporate financial analysis
Value the combined firm with synergy built in. This may includea. a higher growth rate in revenues: growth synergyb. higher margins, because of economies of scalec. lower taxes, because of tax benefits: tax synergyd. lower cost of debt: financing synergye. higher debt ratio because of lower risk: debt capacitySubtract the value of the target firm (with control premium) + value of the bidding firm (pre-acquisition). This is the value of the synergy.
Component Valuation Guidelines Should you pay?
If motive is undervaluation, this is the maximum youshould pay.
If motive is control or in a stand-alone valuation, this is themaximium you should pay.
Which firm is indispensable for the synergy?If it is the target, you should be willing to pay up to the synergy. If it is the bidder, you should not.
VALUING AN ACQUISITION
Aswath Damodaran 8
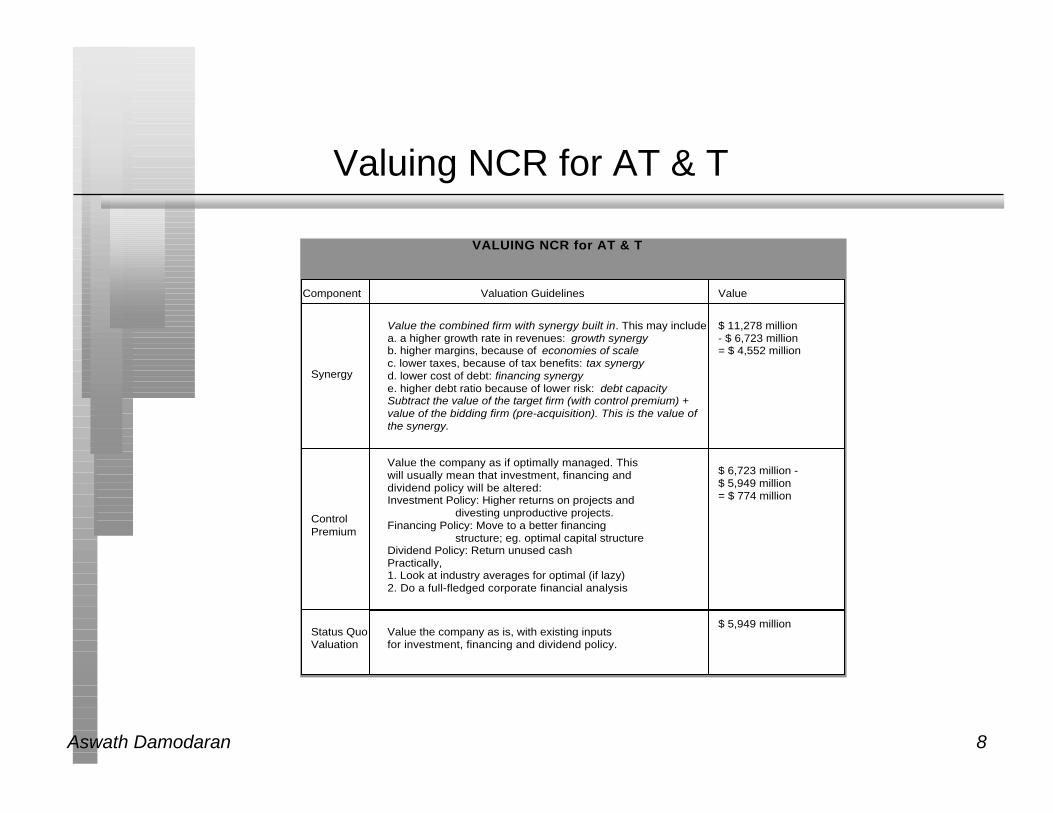
Valuing NCR for AT & T
Status QuoValuation
ControlPremium
Synergy
Value the company as is, with existing inputsfor investment, financing and dividend policy.
Value the company as if optimally managed. Thiswill usually mean that investment, financing anddividend policy will be altered:Investment Policy: Higher returns on projects and
divesting unproductive projects.Financing Policy: Move to a better financing
structure; eg. optimal capital structureDividend Policy: Return unused cashPractically,1. Look at industry averages for optimal (if lazy)2. Do a full-fledged corporate financial analysis
Value the combined firm with synergy built in. This may includea. a higher growth rate in revenues: growth synergyb. higher margins, because of economies of scalec. lower taxes, because of tax benefits: tax synergyd. lower cost of debt: financing synergye. higher debt ratio because of lower risk: debt capacitySubtract the value of the target firm (with control premium) + value of the bidding firm (pre-acquisition). This is the value of the synergy.
Component Valuation Guidelines Value
$ 5,949 million
$ 6,723 million -$ 5,949 million = $ 774 million
$ 11,278 million- $ 6,723 million= $ 4,552 million
VALUING NCR for AT & T
Aswath Damodaran 9
Step 4: Decide on payment mechanism: Cashversus Stock
l Generally speaking, firms which believe that their stock is undervalued will not use stock to do acquisitions.
l Conversely, firms which believe that their stock is over or correctlyvalued will use stock to do acquisitions.
l Not surprisingly, the premium paid is larger when an acquisition isfinanced with stock rather than cash.
l There might be an accounting rationale for using stock as opposed tocash. You are allowed to use pooling instead of purchase.
n There might also be a tax rationale for using stock. Cash acquisitionscreate tax liabilities to the selling firm’s stockholders.
Aswath Damodaran 10
The Exchange Ratio in a Stock for StockExchange
l Correct Exchange Ratio to use in a Valuation = Value per Share ofBidding Firm / Value per Share of Target Firm (with control premiumand target-controlled synergies)
l If the exchange ratio is set too high, there will be a transfer of wealthfrom the bidding firm’s stockholders to the target firm’sstockholders.
l If the exchange ratio is set too low, there will be transfer of wealthfrom the target firm to the bidding firm’s stockholders.
Aswath Damodaran 11
Step 5: Choose an accounting method for themerger
n Purchase Method:– The acquiring firm records the assets and liabilities of the acquired firm at
market value, with goodwill capturing the difference between marketvalue and the value of the assets acquired.
• This goodwill will then be amortized , though the amortization is not taxdeductible. If a firm pays cash on an acquisition, it has to use the purchasemethod to record the transaction.
n Pooling of Interests:– The book values of the assets and liabilities of the merging firms are
added to arrive at values for the combined firm. Since the market value ofthe transaction is not recognized, no goodwill is created or amortized.
– This approach is allowed only if the acquiring firm exchanges its commonstock for common stock of the acquired firm.
– Since earnings are not affected by the amortization of goodwill, thereported earnings per share under this approach will be greater than thereported earnings per share in the purchase approach.
Aswath Damodaran 12
The Value of Control
n The value of control should be inversely proportional to theperceived quality of that management and its capacity to maximizefirm value.
n Value of control will be much greater for a poorly managed firmthat operates at below optimum capacity than it is for a well managedfirm.
n Value of Control = Value of firm, with restructuring - Value of firm,without restructuring
n Negligible or firms which are operating at or close to their optimalvalue
Aswath Damodaran 13
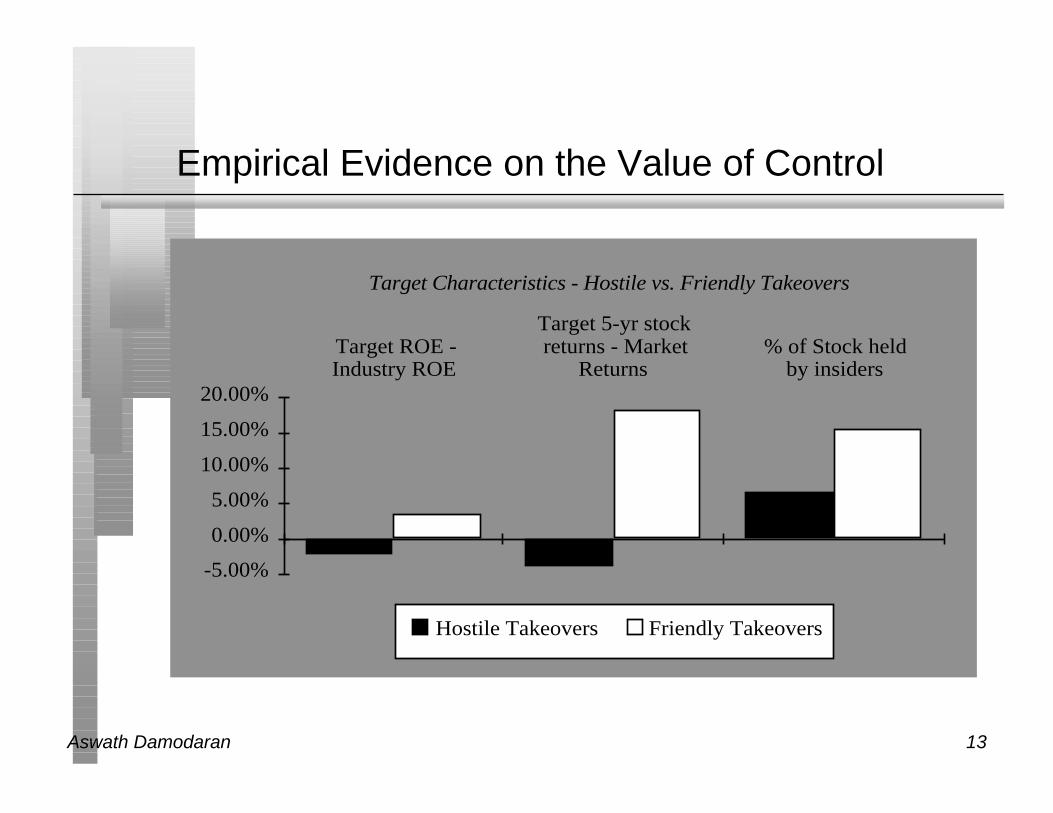
Empirical Evidence on the Value of Control
Target Characteristics - Hostile vs. Friendly Takeovers
-5.00%
0.00%
5.00%
10.00%
15.00%
20.00%
Target ROE -Industry ROE
Target 5-yr stockreturns - Market
Returns% of Stock held
by insiders
Hostile Takeovers Friendly Takeovers
Aswath Damodaran 14
After the hostile takeover..
n Many of the hostile takeovers were followed by an increase inleverage, which resulted in a downgrading of the debt. The leveragewas quickly reduced, however, with proceeds from sale of assets.
n There was no significant change in the amount of capitalinvestment in these firms, but investment was more focused on corebusiness.
n Almost 60% of the takeovers were followed by significantdivestitures, where half or more of the firm was divested. Theoverwhelming majority of the divestitures were of units which were inbusiness areas unrelated to the company's core business, i.e., theyconstituted reversal of earlier corporate diversification.
n There were significant management changes in 17 of the 19 hostiletakeovers, with the entire corporate management team replaced in 7 ofthe takeovers.
Aswath Damodaran 15
Stand Alone Valuation: Digital - Status Quo
n Digital had earning before interest and taxes of $391.38 million in1997, which translated into a• A pre-tax operating margin of 3% on its revenues of $13,046 million
• An after-tax return on capital of 8.51%
n Based upon its beta of 1.15, an after-tax cost of borrowing of 5% and adebt ratio of approximately 10%, the cost of capital for Digital in 1997was• Cost of Equity = 6% + 1.15 (5.5%) = 12.33%
• Cost of Capital = 12.33% (.9) + 5% (.1) = 11.59%
n Digital had capital expenditures of $475 million, depreciation of $ 461million and working capital was 15% of revenues.
n Operating income, net cap ex and revenues are expected to grow 6% ayear for the next 5 years, and 5% thereafter.
Aswath Damodaran 16
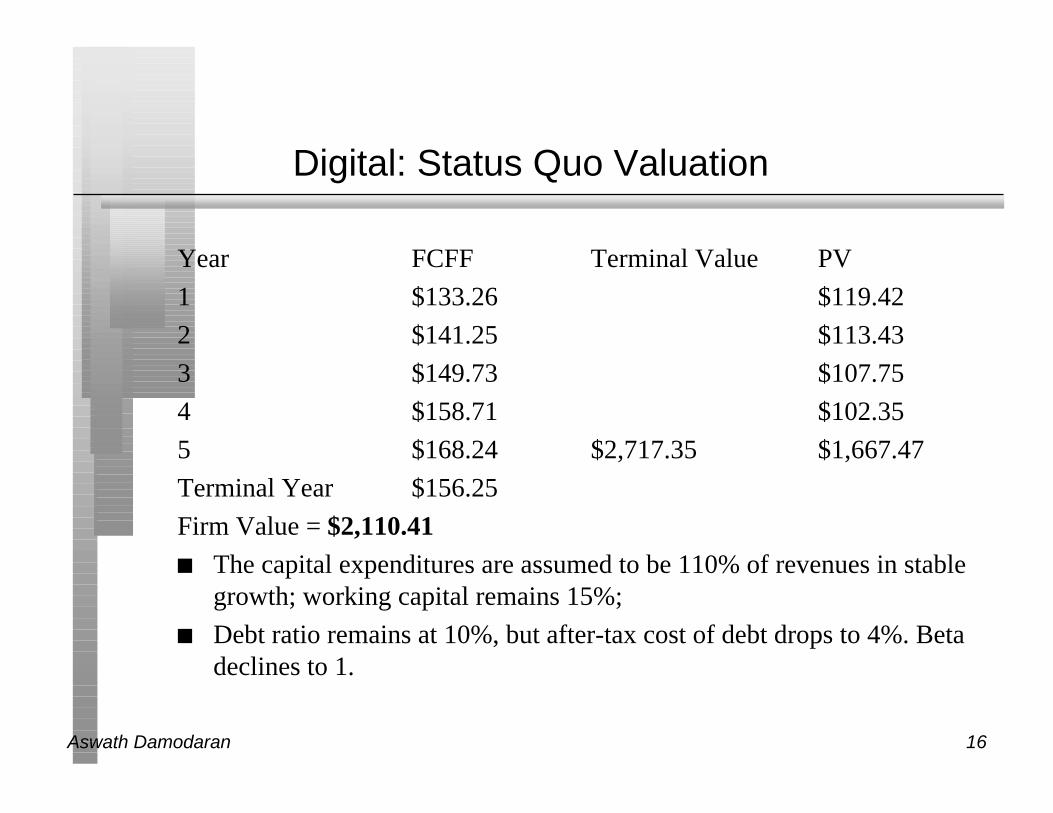
Digital: Status Quo Valuation
Year FCFF Terminal Value PV
1 $133.26 $119.42
2 $141.25 $113.43
3 $149.73 $107.75
4 $158.71 $102.35
5 $168.24 $2,717.35 $1,667.47
Terminal Year $156.25
Firm Value = $2,110.41
n The capital expenditures are assumed to be 110% of revenues in stablegrowth; working capital remains 15%;
n Debt ratio remains at 10%, but after-tax cost of debt drops to 4%. Betadeclines to 1.
Aswath Damodaran 17
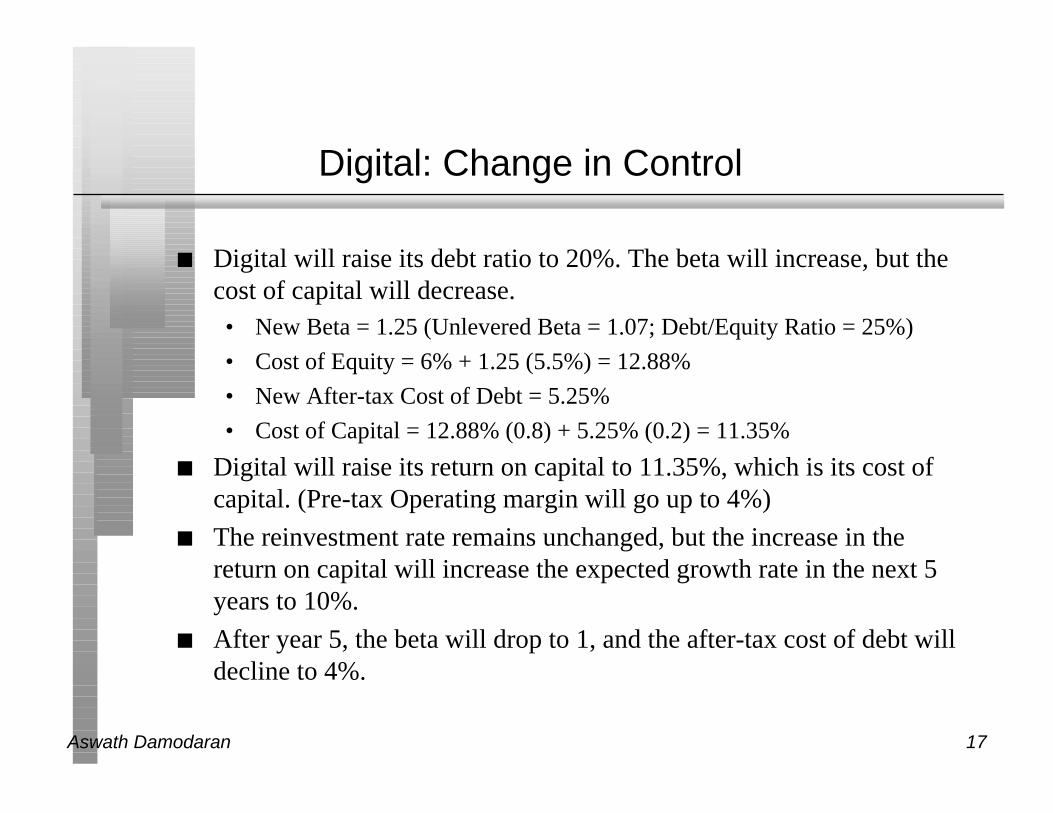
Digital: Change in Control
n Digital will raise its debt ratio to 20%. The beta will increase, but thecost of capital will decrease.• New Beta = 1.25 (Unlevered Beta = 1.07; Debt/Equity Ratio = 25%)
• Cost of Equity = 6% + 1.25 (5.5%) = 12.88%
• New After-tax Cost of Debt = 5.25%
• Cost of Capital = 12.88% (0.8) + 5.25% (0.2) = 11.35%
n Digital will raise its return on capital to 11.35%, which is its cost ofcapital. (Pre-tax Operating margin will go up to 4%)
n The reinvestment rate remains unchanged, but the increase in thereturn on capital will increase the expected growth rate in the next 5years to 10%.
n After year 5, the beta will drop to 1, and the after-tax cost of debt willdecline to 4%.
Aswath Damodaran 18
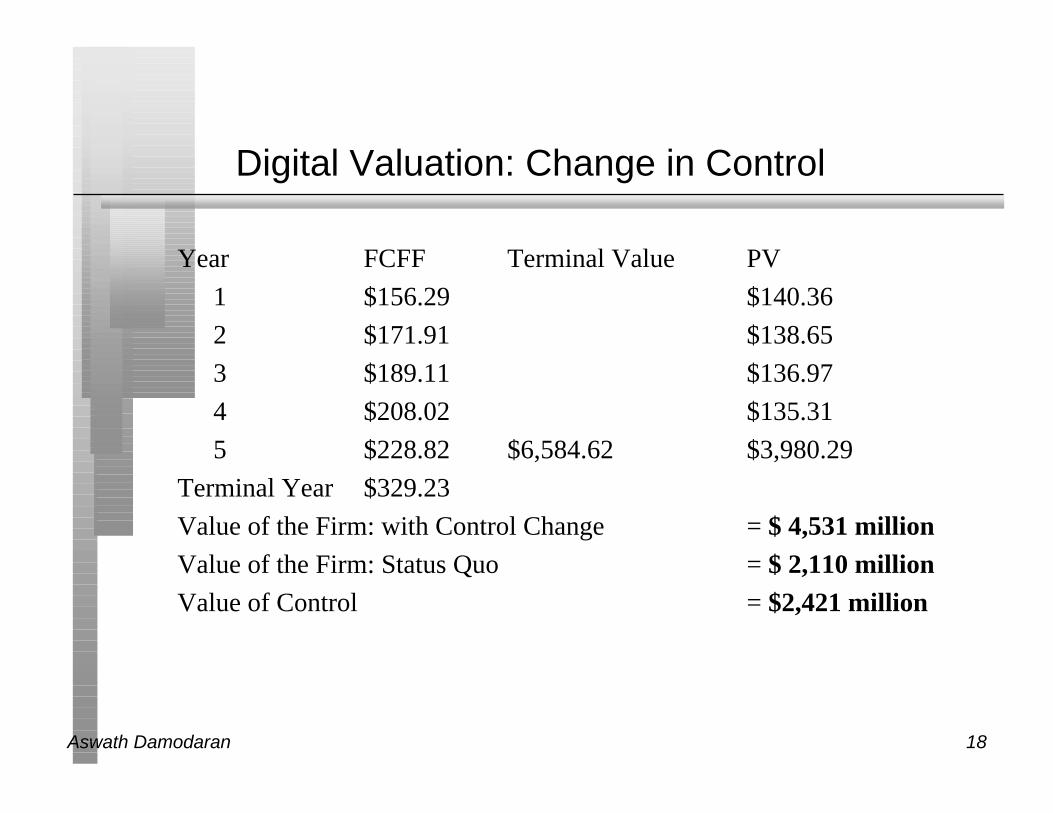
Digital Valuation: Change in Control
Year FCFF Terminal Value PV
1 $156.29 $140.36
2 $171.91 $138.65
3 $189.11 $136.97
4 $208.02 $135.31
5 $228.82 $6,584.62 $3,980.29
Terminal Year $329.23
Value of the Firm: with Control Change = $ 4,531 millionValue of the Firm: Status Quo = $ 2,110 millionValue of Control = $2,421 million
Aswath Damodaran 19
Valuing Synergy
n The key to the existence of synergy is that the target firm controls aspecialized resource that becomes more valuable if combined withthe bidding firm's resources. The specialized resource will varydepending upon the merger:• In horizontal mergers: economies of scale, which reduce costs, or from
increased market power, which increases profit margins and sales.(Examples: Bank of America and Security Pacific, Chase and Chemical)
• In vertical integration: Primary source of synergy here comes fromcontrolling the chain of production much more completely.
• In functional integration: When a firm with strengths in one functionalarea acquires another firm with strengths in a different functional area,the potential synergy gains arise from exploiting the strengths in theseareas.
Aswath Damodaran 20
Valuing operating synergy
(a) What form is the synergy expected to take? Will it reduce costs as apercentage of sales and increase profit margins (as is the case whenthere are economies of scale)? Will it increase future growth (as isthe case when there is increased market power)? )
(b) When can the synergy be reasonably expected to start affectingcashflows? (Will the gains from synergy show up instantaneously afterthe takeover? If it will take time, when can the gains be expected tostart showing up? )
Aswath Damodaran 21
A procedure for valuing synergy
(1) the firms involved in the merger are valued independently, bydiscounting expected cash flows to each firm at the weighted averagecost of capital for that firm.
(2) the value of the combined firm, with no synergy, is obtained byadding the values obtained for each firm in the first step.
(3) The effects of synergy are built into expected growth rates andcashflows, and the combined firm is re-valued with synergy.
Value of Synergy = Value of the combined firm, with synergy - Value ofthe combined firm, without synergy
Aswath Damodaran 22
Synergy Effects in Valuation Inputs
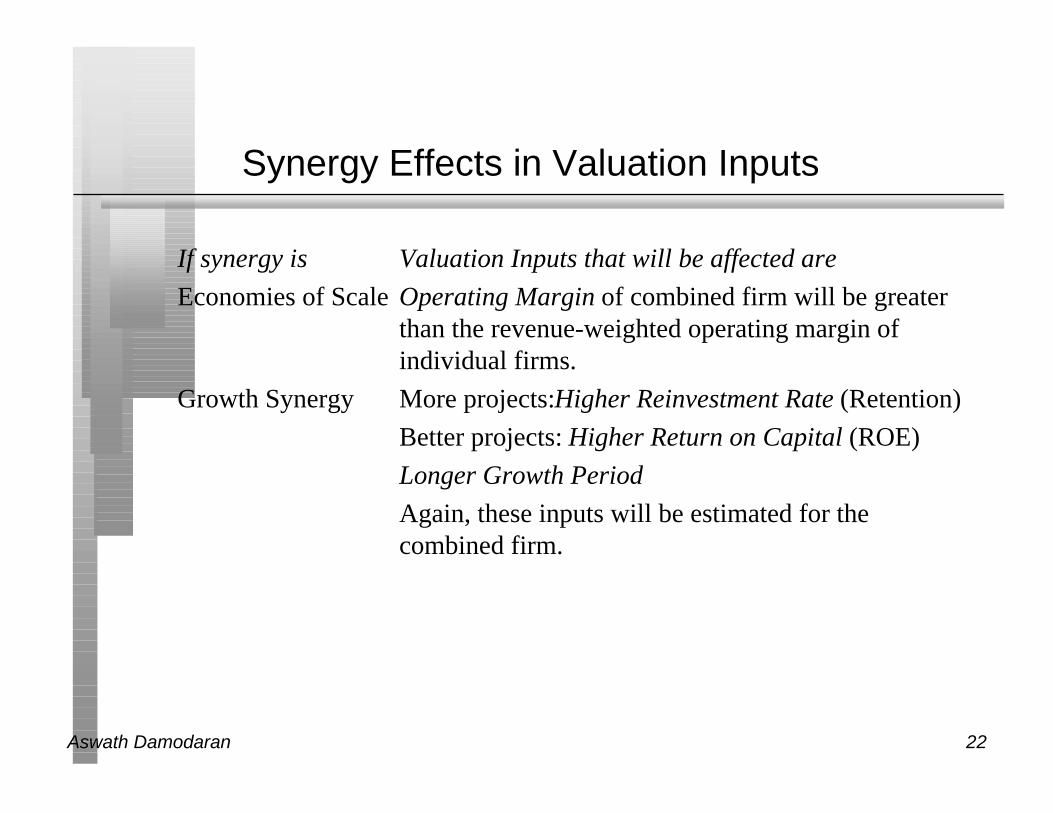
If synergy is Valuation Inputs that will be affected are
Economies of Scale Operating Margin of combined firm will be greaterthan the revenue-weighted operating margin of individual firms.
Growth Synergy More projects:Higher Reinvestment Rate (Retention)
Better projects: Higher Return on Capital (ROE)
Longer Growth Period
Again, these inputs will be estimated for the combined firm.
Aswath Damodaran 23
Valuing Synergy: Compaq and Digital
n In 1997, Compaq acquired Digital for $ 30 per share + 0.945 Compaqshares for every Digital share. ($ 53-60 per share) The acquisition wasmotivated by the belief that the combined firm would be able to findinvestment opportunities and compete better than the firmsindividually could.
Aswath Damodaran 24
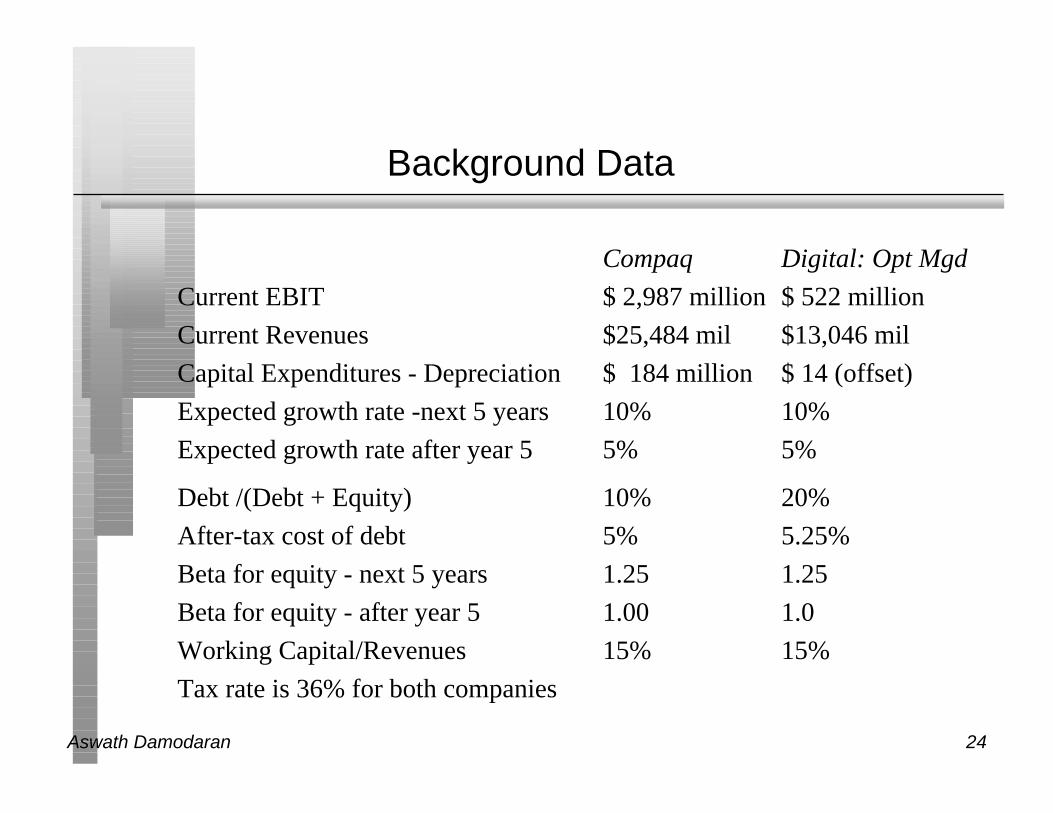
Background Data
Compaq Digital: Opt Mgd
Current EBIT $ 2,987 million $ 522 million
Current Revenues $25,484 mil $13,046 mil
Capital Expenditures - Depreciation $ 184 million $ 14 (offset)
Expected growth rate -next 5 years 10% 10%
Expected growth rate after year 5 5% 5%
Debt /(Debt + Equity) 10% 20%
After-tax cost of debt 5% 5.25%
Beta for equity - next 5 years 1.25 1.25
Beta for equity - after year 5 1.00 1.0
Working Capital/Revenues 15% 15%
Tax rate is 36% for both companies
Aswath Damodaran 25
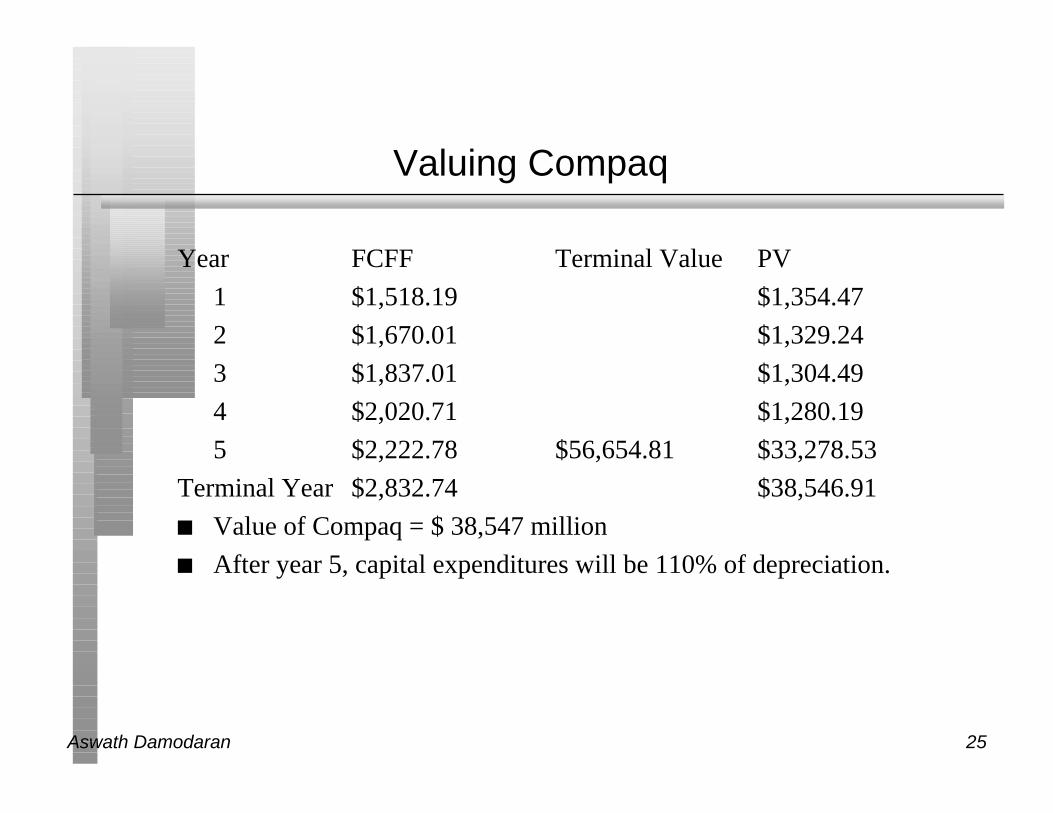
Valuing Compaq
Year FCFF Terminal Value PV
1 $1,518.19 $1,354.47
2 $1,670.01 $1,329.24
3 $1,837.01 $1,304.49
4 $2,020.71 $1,280.19
5 $2,222.78 $56,654.81 $33,278.53
Terminal Year $2,832.74 $38,546.91
n Value of Compaq = $ 38,547 million
n After year 5, capital expenditures will be 110% of depreciation.
Aswath Damodaran 26
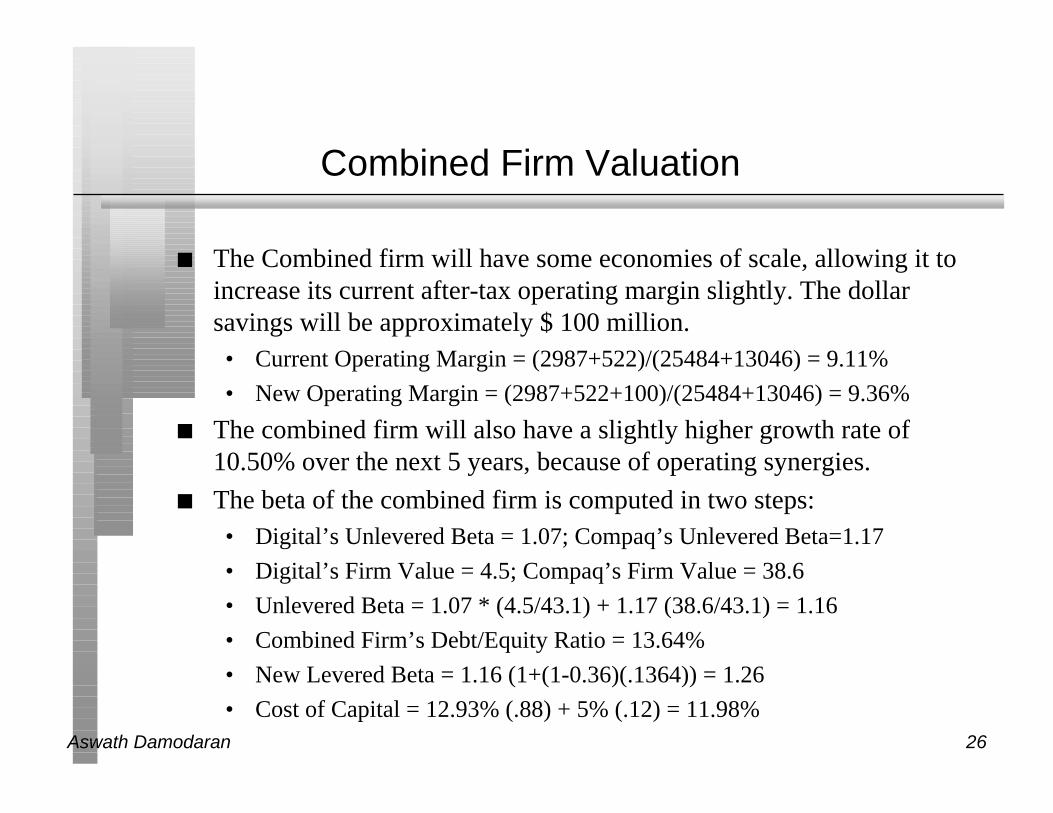
Combined Firm Valuation
n The Combined firm will have some economies of scale, allowing it toincrease its current after-tax operating margin slightly. The dollarsavings will be approximately $ 100 million.• Current Operating Margin = (2987+522)/(25484+13046) = 9.11%
• New Operating Margin = (2987+522+100)/(25484+13046) = 9.36%
n The combined firm will also have a slightly higher growth rate of10.50% over the next 5 years, because of operating synergies.
n The beta of the combined firm is computed in two steps:• Digital’s Unlevered Beta = 1.07; Compaq’s Unlevered Beta=1.17
• Digital’s Firm Value = 4.5; Compaq’s Firm Value = 38.6
• Unlevered Beta = 1.07 * (4.5/43.1) + 1.17 (38.6/43.1) = 1.16
• Combined Firm’s Debt/Equity Ratio = 13.64%
• New Levered Beta = 1.16 (1+(1-0.36)(.1364)) = 1.26
• Cost of Capital = 12.93% (.88) + 5% (.12) = 11.98%
Aswath Damodaran 27
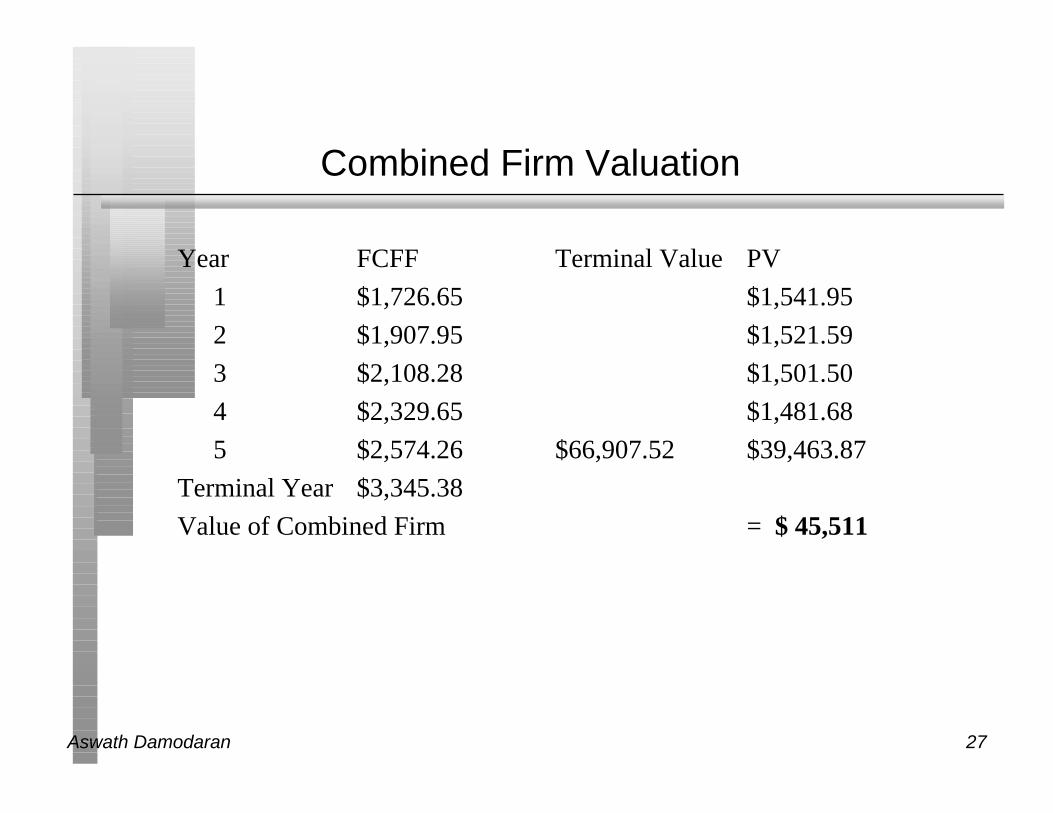
Combined Firm Valuation
Year FCFF Terminal Value PV
1 $1,726.65 $1,541.95
2 $1,907.95 $1,521.59
3 $2,108.28 $1,501.50
4 $2,329.65 $1,481.68
5 $2,574.26 $66,907.52 $39,463.87
Terminal Year $3,345.38
Value of Combined Firm = $ 45,511
Aswath Damodaran 28
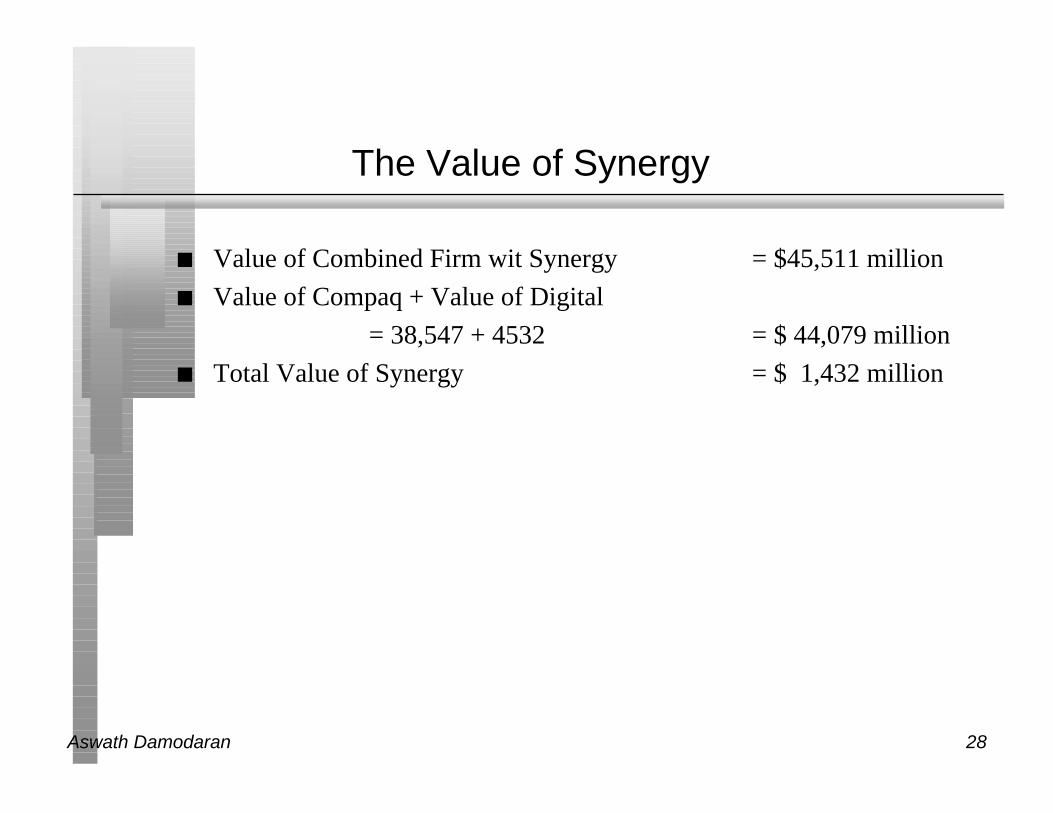
The Value of Synergy
n Value of Combined Firm wit Synergy = $45,511 million
n Value of Compaq + Value of Digital
= 38,547 + 4532 = $ 44,079 million
n Total Value of Synergy = $ 1,432 million
Aswath Damodaran 29
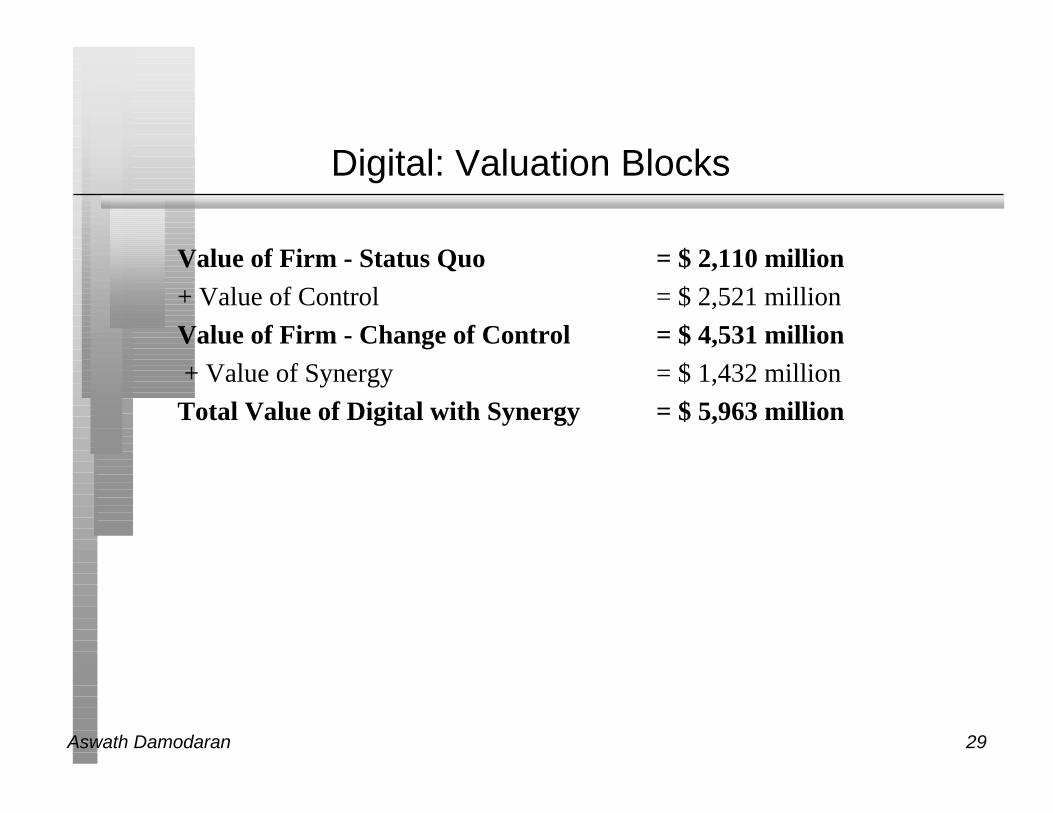
Digital: Valuation Blocks
Value of Firm - Status Quo = $ 2,110 million+ Value of Control = $ 2,521 million
Value of Firm - Change of Control = $ 4,531 million + Value of Synergy = $ 1,432 million
Total Value of Digital with Synergy = $ 5,963 million
Aswath Damodaran 30
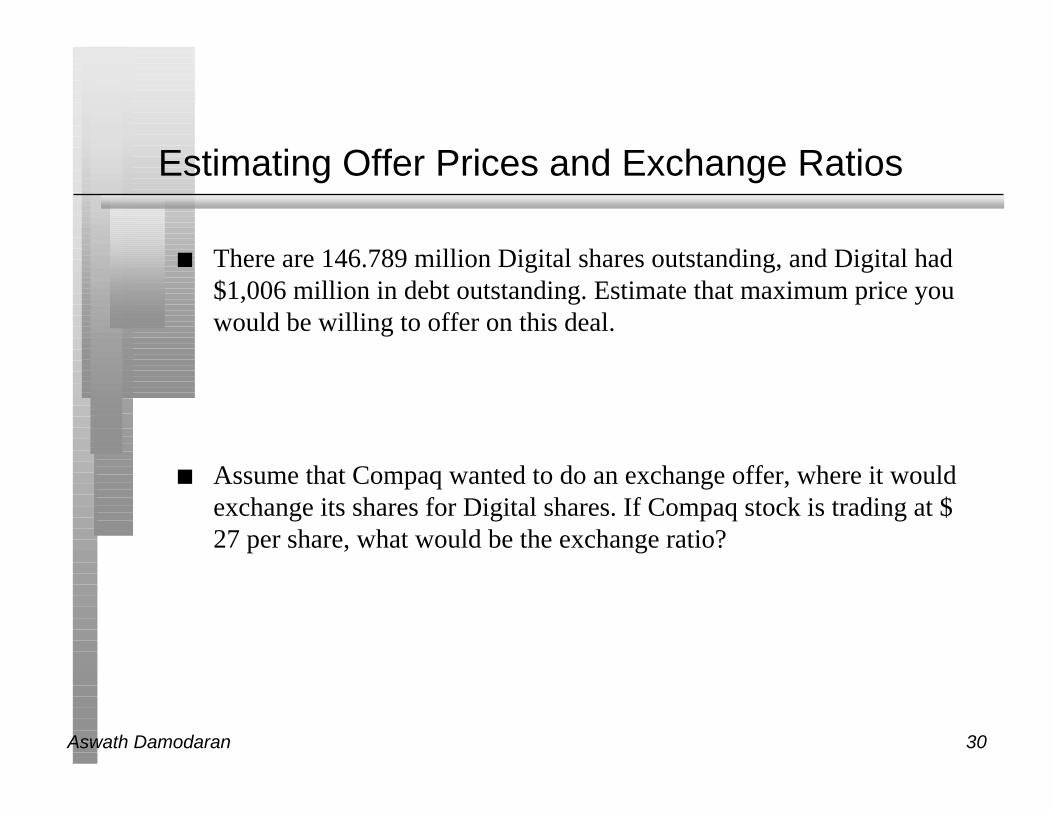
Estimating Offer Prices and Exchange Ratios
n There are 146.789 million Digital shares outstanding, and Digital had$1,006 million in debt outstanding. Estimate that maximum price youwould be willing to offer on this deal.
n Assume that Compaq wanted to do an exchange offer, where it wouldexchange its shares for Digital shares. If Compaq stock is trading at $27 per share, what would be the exchange ratio?
Aswath Damodaran 31
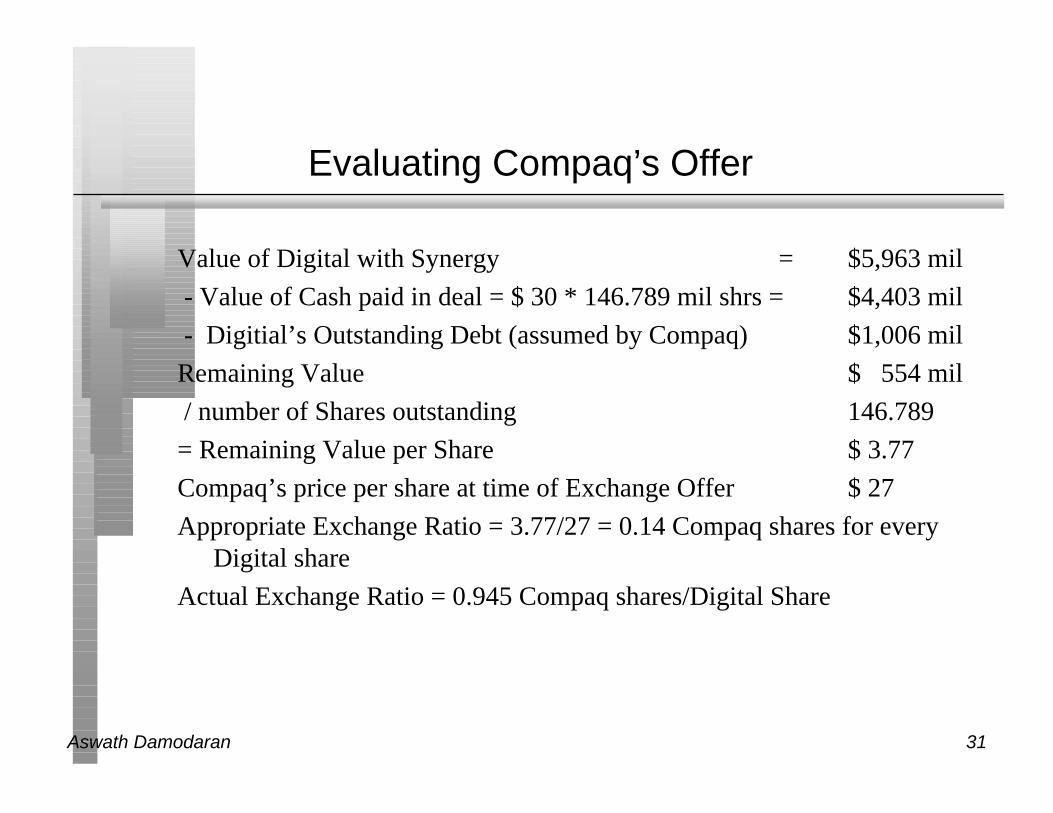
Evaluating Compaq’s Offer
Value of Digital with Synergy = $5,963 mil
- Value of Cash paid in deal = $ 30 * 146.789 mil shrs = $4,403 mil
- Digitial’s Outstanding Debt (assumed by Compaq) $1,006 mil
Remaining Value $ 554 mil
/ number of Shares outstanding 146.789
= Remaining Value per Share $ 3.77
Compaq’s price per share at time of Exchange Offer $ 27
Appropriate Exchange Ratio = 3.77/27 = 0.14 Compaq shares for everyDigital share
Actual Exchange Ratio = 0.945 Compaq shares/Digital Share
Aswath Damodaran 32
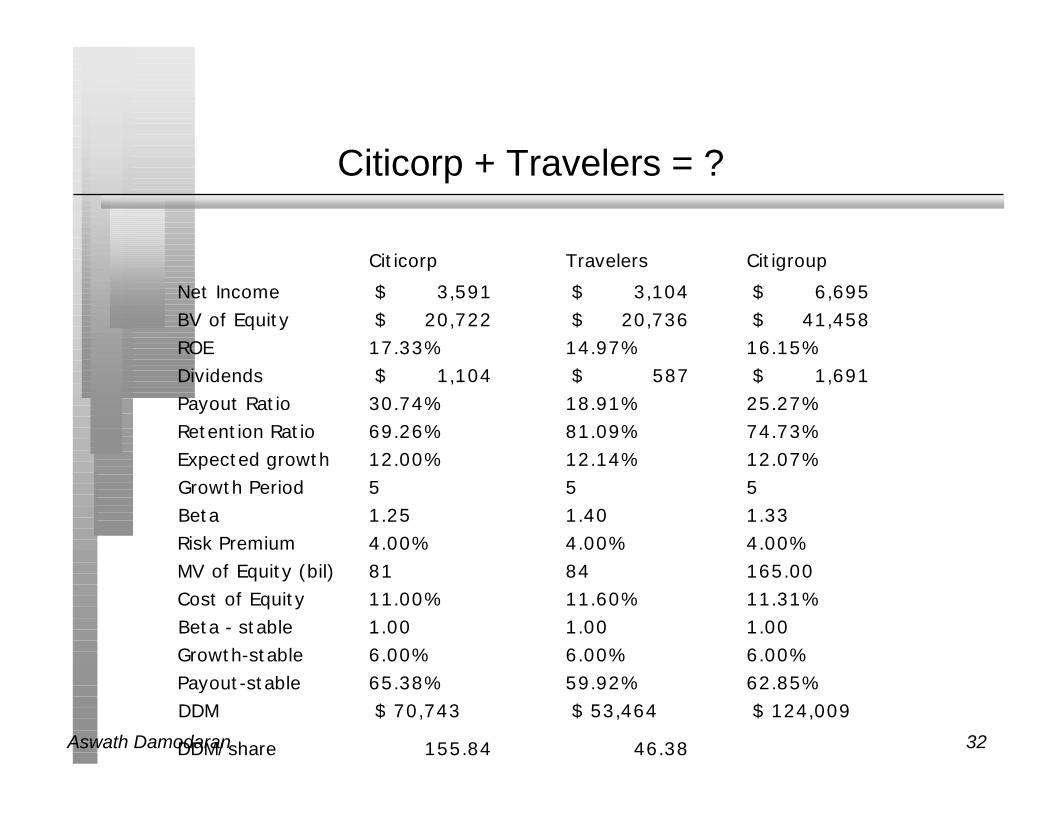
Citicorp + Travelers = ?
Citicorp Travelers Citigroup
Net Income $ 3,591 $ 3,104 $ 6,695 BV of Equity $ 20,722 $ 20,736 $ 41,458 ROE 17.33% 14.97% 16.15%Dividends $ 1,104 $ 587 $ 1,691 Payout Ratio 30.74% 18.91% 25.27%Retention Ratio 69.26% 81.09% 74.73%Expected growth 12.00% 12.14% 12.07%Growth Period 5 5 5Beta 1.25 1.40 1.33Risk Premium 4.00% 4.00% 4.00%MV of Equity (bil) 81 84 165.00Cost of Equity 11.00% 11.60% 11.31%Beta - stable 1.00 1.00 1.00Growth-stable 6.00% 6.00% 6.00%Payout-stable 65.38% 59.92% 62.85%DDM $ 70,743 $ 53,464 $ 124,009
DDM/share 155.84 46.38
Aswath Damodaran 33
The Right Exchange Ratio
n Based upon these numbers, what exchange ratio would you agree to asa Citicorp stockholder?
n The actual exchange ratio was 2.5 shares of Travelers for every share oCiticorp. As a Citicorp stockholder, do you think that this is areasonable exchange ratio?
Aswath Damodaran 34
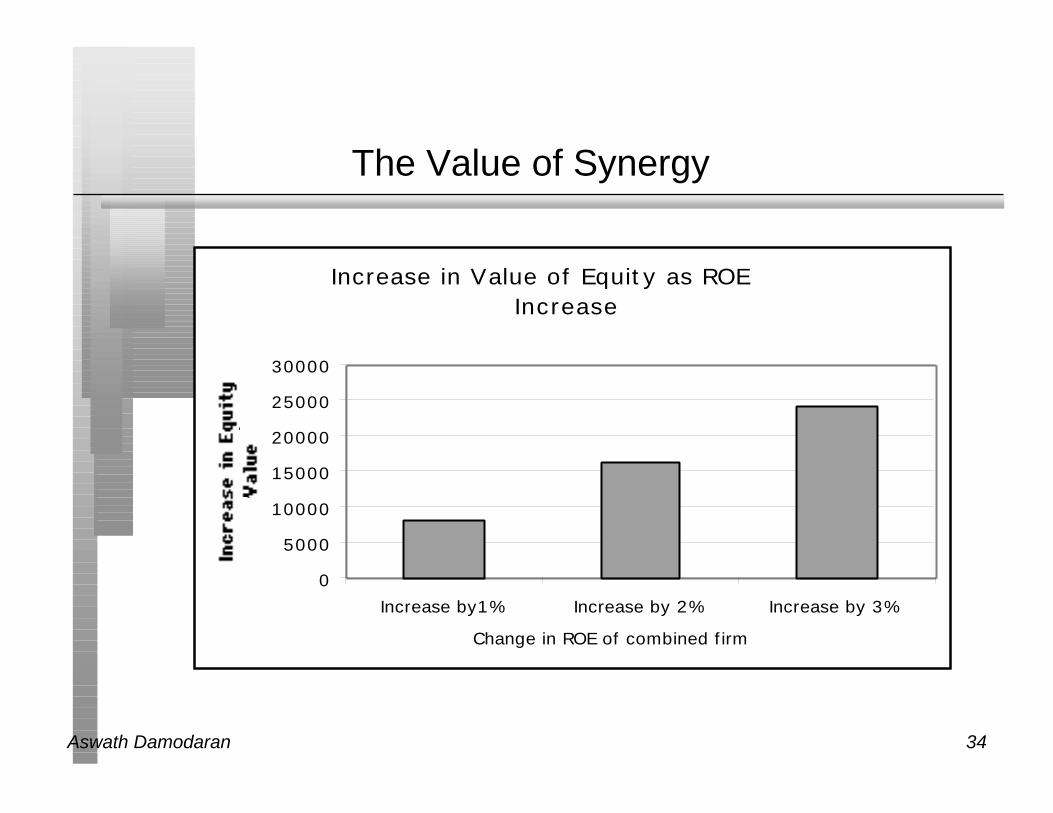
The Value of Synergy
Increase in Value of Equity as ROE Increase
0
5000
10000
15000
20000
25000
30000
Increase by1% Increase by 2% Increase by 3%
Change in ROE of combined firm
Incr
ease
in E
quit
y V
alue
Aswath Damodaran 35
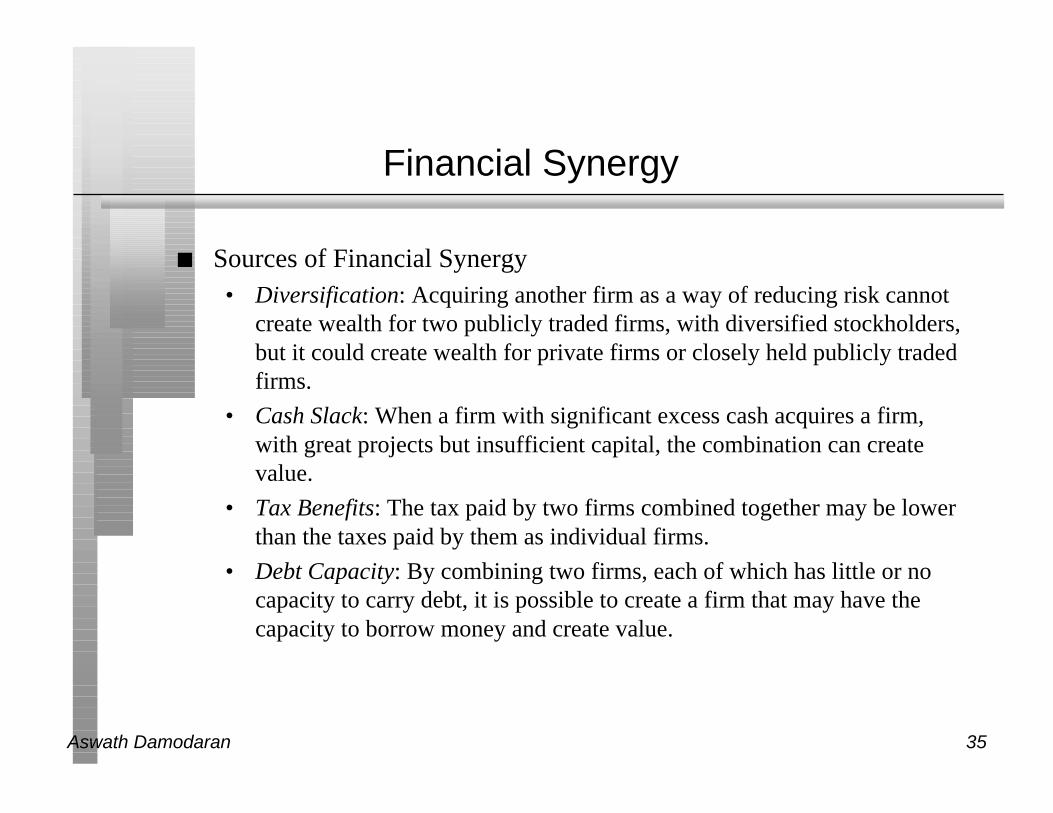
Financial Synergy
n Sources of Financial Synergy• Diversification: Acquiring another firm as a way of reducing risk cannot
create wealth for two publicly traded firms, with diversified stockholders,but it could create wealth for private firms or closely held publicly tradedfirms.
• Cash Slack: When a firm with significant excess cash acquires a firm,with great projects but insufficient capital, the combination can createvalue.
• Tax Benefits: The tax paid by two firms combined together may be lowerthan the taxes paid by them as individual firms.
• Debt Capacity: By combining two firms, each of which has little or nocapacity to carry debt, it is possible to create a firm that may have thecapacity to borrow money and create value.
Aswath Damodaran 36
I. Diversification: No Value Creation?
n A takeover, motivated only by diversification considerations, has noeffect on the combined value of the two firms involved in the takeover.The value of the combined firms will always be the sum of the valuesof the independent firms.
n In the case of private firms or closely held firms, where the ownersmay not be diversified personally, there might be a potential value gainfrom diversification.
Aswath Damodaran 37
II. Cash Slack
n Managers may reject profitable investment opportunities if theyhave to raise new capital to finance them.
n It may therefore make sense for a company with excess cash and noinvestment opportunities to take over a cash-poor firm with goodinvestment opportunities, or vice versa.
n The additional value of combining these two firms lies in the presentvalue of the projects that would not have been taken if they hadstayed apart, but can now be taken because of the availability of cash.
Aswath Damodaran 38
Valuing Cash Slack
l Assume that Netscape has a severe capital rationing problem, thatresults in approximately $500 million of investments, with acumulative net present value of $100 million, being rejected.
l IBM has far more cash than promising projects, and has accumulated$4 billion in cash that it is trying to invest. It is under pressure to returnthe cash to the owners.
l If IBM takes over Netscape Inc, it can be argued that the value of thecombined firm will increase by the synergy benefit of $100 million,which is the net present value of the projects possessed by the latterthat can now be taken with the excess cash from the former.
Aswath Damodaran 39
III. Tax Benefits
(1) If one of the firms has tax deductions that it cannot use because it islosing money, while the other firm has income on which it payssignificant taxes, the combining of the two firms can lead to taxbenefits that can be shared by the two firms. The value of this synergyis the present value of the tax savings that accrue because of thismerger.
(2) The assets of the firm being taken over can be written up to reflectnew market value, in some forms of mergers, leading to higher taxsavings from depreciation in future years.
Aswath Damodaran 40
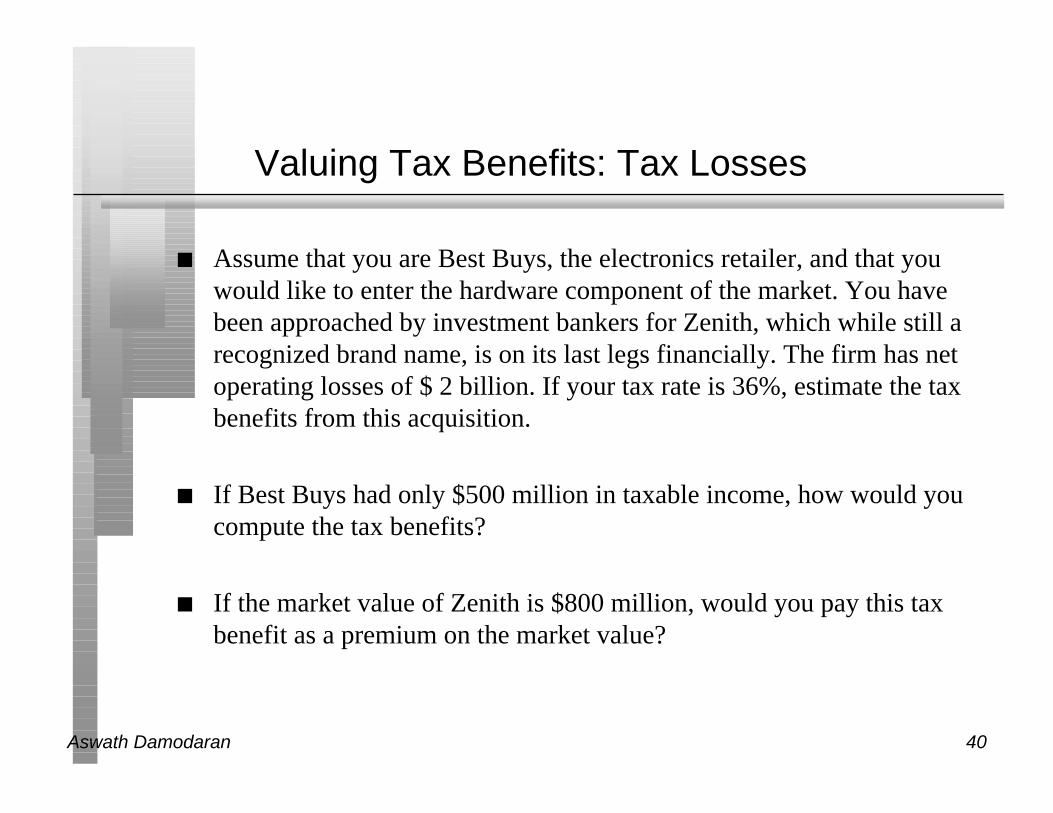
Valuing Tax Benefits: Tax Losses
n Assume that you are Best Buys, the electronics retailer, and that youwould like to enter the hardware component of the market. You havebeen approached by investment bankers for Zenith, which while still arecognized brand name, is on its last legs financially. The firm has netoperating losses of $ 2 billion. If your tax rate is 36%, estimate the taxbenefits from this acquisition.
n If Best Buys had only $500 million in taxable income, how would youcompute the tax benefits?
n If the market value of Zenith is $800 million, would you pay this taxbenefit as a premium on the market value?
Aswath Damodaran 41
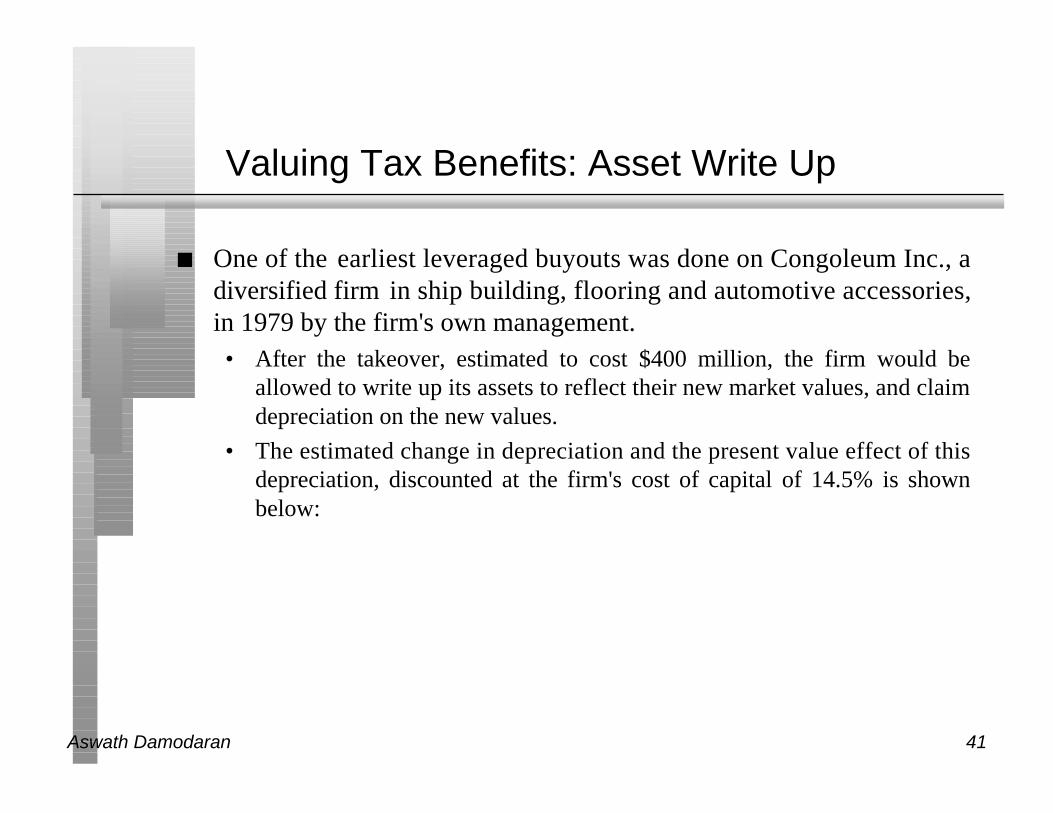
Valuing Tax Benefits: Asset Write Up
n One of the earliest leveraged buyouts was done on Congoleum Inc., adiversified firm in ship building, flooring and automotive accessories,in 1979 by the firm's own management.• After the takeover, estimated to cost $400 million, the firm would be
allowed to write up its assets to reflect their new market values, and claimdepreciation on the new values.
• The estimated change in depreciation and the present value effect of thisdepreciation, discounted at the firm's cost of capital of 14.5% is shownbelow:
Aswath Damodaran 42
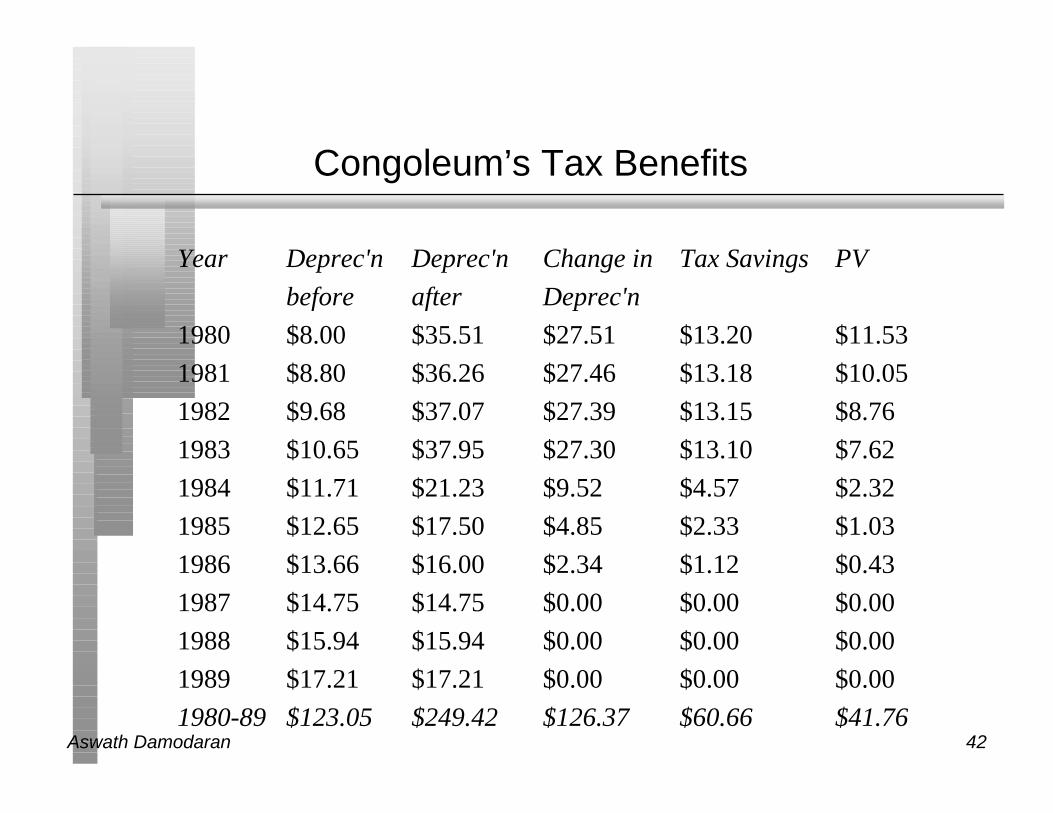
Congoleum’s Tax Benefits
Year Deprec'n Deprec'n Change in Tax Savings PV
before after Deprec'n
1980 $8.00 $35.51 $27.51 $13.20 $11.53
1981 $8.80 $36.26 $27.46 $13.18 $10.05
1982 $9.68 $37.07 $27.39 $13.15 $8.76
1983 $10.65 $37.95 $27.30 $13.10 $7.62
1984 $11.71 $21.23 $9.52 $4.57 $2.32
1985 $12.65 $17.50 $4.85 $2.33 $1.03
1986 $13.66 $16.00 $2.34 $1.12 $0.43
1987 $14.75 $14.75 $0.00 $0.00 $0.00
1988 $15.94 $15.94 $0.00 $0.00 $0.00
1989 $17.21 $17.21 $0.00 $0.00 $0.00
1980-89 $123.05 $249.42 $126.37 $60.66 $41.76
Aswath Damodaran 43
IV. Debt Capacity
n Diversification will lead to an increase in debt capacity and anincrease in the value of the firm.
n Has to be weighed against the immediate transfer of wealth that occursto existing bondholders in both firms from the stockholders.
Aswath Damodaran 44
Valuing Debt Capacity
n When two firms in different businesses merge, the combined firm willhave less variable earnings, and may be able to borrow more (have ahigher debt ratio) than the individual firms.
n In the following example, we will combine two firms, with optimaldebt ratios of 30% each, and end up with a firm with an optimal debtratio of 40%.
Aswath Damodaran 45
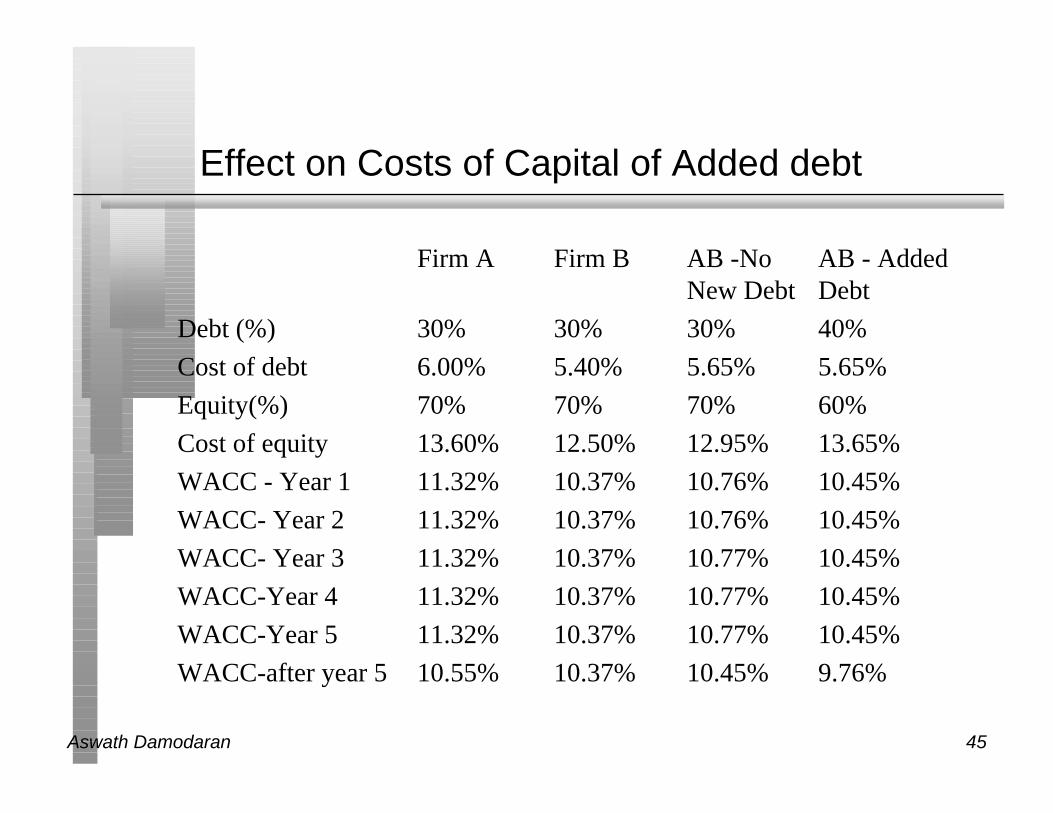
Effect on Costs of Capital of Added debt
Firm A Firm B AB -No AB - AddedNew Debt Debt
Debt (%) 30% 30% 30% 40%
Cost of debt 6.00% 5.40% 5.65% 5.65%
Equity(%) 70% 70% 70% 60%
Cost of equity 13.60% 12.50% 12.95% 13.65%
WACC - Year 1 11.32% 10.37% 10.76% 10.45%
WACC- Year 2 11.32% 10.37% 10.76% 10.45%
WACC- Year 3 11.32% 10.37% 10.77% 10.45%
WACC-Year 4 11.32% 10.37% 10.77% 10.45%
WACC-Year 5 11.32% 10.37% 10.77% 10.45%
WACC-after year 5 10.55% 10.37% 10.45% 9.76%
Aswath Damodaran 46
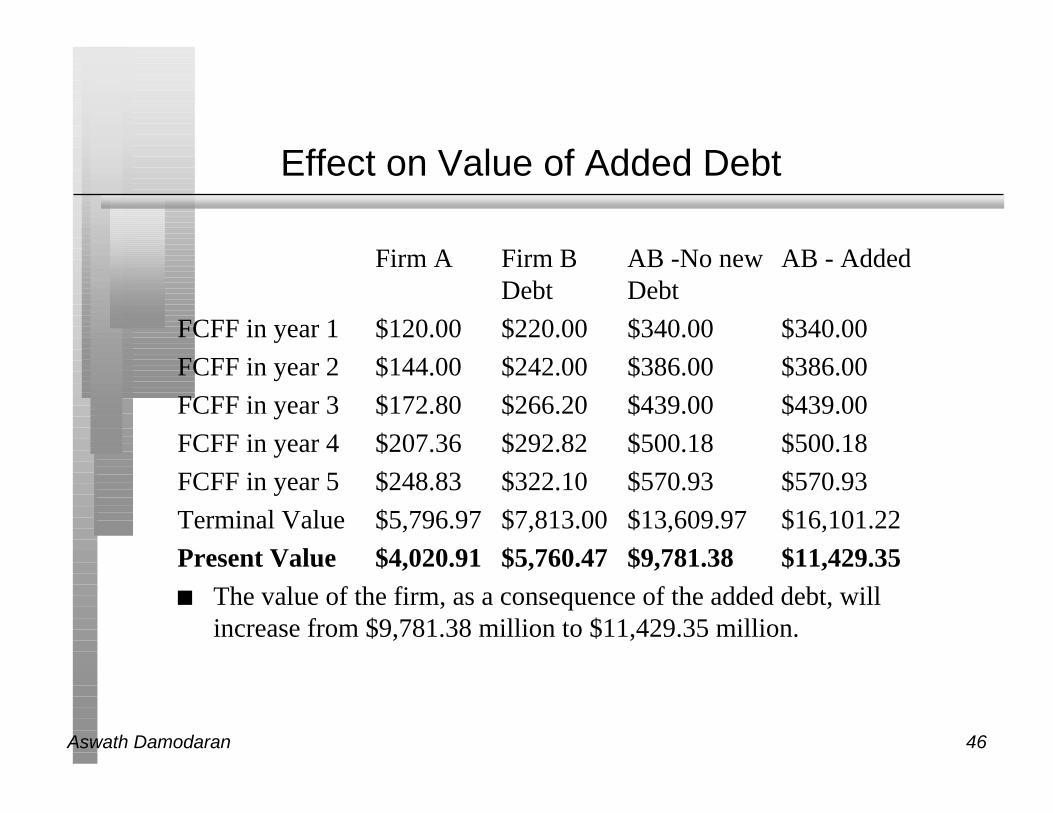
Effect on Value of Added Debt
Firm A Firm B AB -No new AB - Added Debt Debt
FCFF in year 1 $120.00 $220.00 $340.00 $340.00
FCFF in year 2 $144.00 $242.00 $386.00 $386.00
FCFF in year 3 $172.80 $266.20 $439.00 $439.00
FCFF in year 4 $207.36 $292.82 $500.18 $500.18
FCFF in year 5 $248.83 $322.10 $570.93 $570.93
Terminal Value $5,796.97 $7,813.00 $13,609.97 $16,101.22
Present Value $4,020.91 $5,760.47 $9,781.38 $11,429.35 n The value of the firm, as a consequence of the added debt, will
increase from $9,781.38 million to $11,429.35 million.
Aswath Damodaran 47
Empirical Evidence on Synergy
n If synergy is perceived to exist in a takeover, the value of thecombined firm should be greater than the sum of the values of thebidding and target firms, operating independently.
V(AB) > V(A) + V(B)
n Bradley, Desai and Kim (1988) use a sample of 236 inter-firm tenderoffers between 1963 and 1984 and report that the combined value ofthe target and bidder firms increases 7.48% ($117 million in 1984dollars), on average, on the announcement of the merger.
n Operating synergy was the primary motive in one-third of hostiletakeovers. (Bhide)
Aswath Damodaran 48
Operational Evidence on Synergy
• A stronger test of synergy is to evaluate whether merged firmsimprove their performance (profitability and growth), relative totheir competitors, after takeovers.• McKinsey and Co. examined 58 acquisition programs between 1972 and
1983 for evidence on two questions -• Did the return on the amount invested in the acquisitions exceed the cost of
capital?
• Did the acquisitions help the parent companies outperform the competition?
• They concluded that 28 of the 58 programs failed both tests, and 6failed at least one test.
• Large number of acquisitions that are reversed within fairly shorttime periods. About 20.2% of the acquisitions made between 1982and 1986 were divested by 1988. In studies that have trackedacquisitions for longer time periods (ten years or more) the divestiturerate of acquisitions rises to almost 50%.
Aswath Damodaran 49
Who gets the benefits of synergy?
n The sharing of the benefits of synergy among the two players willdepend in large part on whether the bidding firm's contribution to thecreation of the synergy is unique or easily replaced. If it can beeasily replaced, the bulk of the synergy benefits will accrue to thetarget firm. It is unique, the sharing of benefits will be much moreequitable.
n Bradley, Desai and Kim (1988) conclude that the benefits of synergyaccrue primarily to the target firms when there are multiple biddersinvolved in the takeover. They estimate that the market-adjusted stockreturns around the announcement of the takeover for the successfulbidder to be 2%, in single bidder takeovers, and -1.33%, in contestedtakeovers.