Embed Size (px)
Citation preview
Published: June 30, 2011
r 2011 American Chemical Society 6209 dx.doi.org/10.1021/ma200966a |Macromolecules 2011, 44, 6209–6219
ARTICLE
pubs.acs.org/Macromolecules
Monte Carlo Phase Diagram for a Polydisperse Diblock CopolymerMeltT. M. Beardsley* and M. W. Matsen*
School of Mathematical and Physical Sciences, University of Reading, Whiteknights, Reading RG6 6AX, U.K.
’ INTRODUCTION
Block copolymer molecules have received considerable atten-tion due to their intriguing behavior and potential applications.1
The majority of research has focused on the ideal monodisperseAB diblock copolymer system, where all the polymers areidentical with NA A-type monomers joined to NB B-type mono-mers, giving a total polymerization of N = NA + NB and acomposition of f = NA/N. When the interaction between the Aand B monomers is sufficiently unfavorable as measured by theFlory�Huggins χ parameter, the diblock copolymers self-assem-ble into periodically ordered structures with nanometer-sizeddomains. The equilibrium phase diagram2 is comprised of theclassical lamellar (L), cylindrical (C), and spherical (S) phases aswell as a complex gyroid (G) phase.4,3 Another complex perfo-rated-lamellar (PL) phase is often observed in experiments,5 butit is understood to be metastable relative to the G phase.6 A thirdcomplex phase with Fddd symmetry has also been reportedrecently,7 but its region of stability in the phase diagram appearsto be very small.
There has been a long-held opinion that the formation of well-ordered morphologies requires the block copolymers to besynthesized via anionic polymerization so as to limit the levelof polydispersity.8 However, experimentalists have begun torealize that this is not necessarily the case,8,9 implying that itmay be acceptable to synthesize the block copolymers via lesscostly methods. This has inspired efforts to better understandhow the phase behavior of block copolymers is affected byelevated degrees of polydispersity. The model system for muchof the experimental work10�14 has been AB diblocks withpolydisperse A blocks and monodisperse B blocks.
In most respects, self-consistent field theory (SCFT) hasmanaged to successfully explain the experiments.15�18 This buildsupon the usual explanations of block copolymer behavior, wherethe entropic stretching energy of the A and B blocks competeswith the A/B interfacial energy.19,20 Because polydisperse blocks
are able to fill spacemore efficiently, the stretching energy of the Adomains is reduced which, in turn, predicts an increase in domainsize15�17 as observed in experiments.10,11,21,22 Furthermore, thereduction in stretching energy of the polydisperse domainchanges the preferred curvature of the A/B interface, causingthe order�order transitions (OOTs) to shift toward composi-tions higher in the polydisperse component,15,16,18 and this toohas been seen in experiments.11�14 Because of the fact thatpolydisperse melts are multicomponent systems, thermody-namics requires the emergence of two-phase coexistence regionsalong the phase boundaries,18 and indeed a number of experi-mental studies have reported this.9,10,21,22 However, SCFT andexperiments are not consistent with regards to the effect ofpolydispersity on the order�disorder transition (ODT). Experi-ments by Lynd and Hillmyer12 found that (χN)ODT is reducedwhen the minority component is polydisperse and raised whenthe majority component is polydisperse. SCFT predicts insteadthat polydispersity lowers (χN)ODT at all diblock copolymercompositions.15,16,18
In an earlier study,23 we used Monte Carlo simulations toinvestigate this inconsistency between SCFT and experiment.The simulations were performed over a range of A-blockpolydispersity indexes, PDIA � (NA)w/(NA)n = 1.0�2.0, atan average polymerization of N � (NA)n + NB = 30 and asymmetric composition of f� (NA)n/N = 0.5. In each case, theODT was bracketed by a hysteresis loop formed by runningsequential temperature scans back and forth across the ODT, asfirst implemented by Vassiliev and Matsen24 for monodispersemelts. The simulations found no shift in the ODT withincreasing polydispersity, which is consistent with the experi-ments. However, the Monte Carlo study was restricted to a
Received: April 27, 2011Revised: June 13, 2011
ABSTRACT: The phase diagram for an AB diblock copolymer melt with polydisperseA blocks and monodisperse B blocks is evaluated using lattice-based Monte Carlosimulations. Experiments on this system have shown that the A-block polydispersityshifts the order�order transitions (OOTs) toward higher A-monomer content, whilethe order�disorder transition (ODT) moves toward higher temperatures when the Ablocks form the minority domains and lower temperatures when the A blocks form thematrix. Although self-consistent field theory (SCFT) correctly accounts for the changein the OOTs, it incorrectly predicts theODT to shift toward higher temperatures at all diblock copolymer compositions. In contrast,our simulations predict the correct shifts for both the OOTs and the ODT. This implies that polydispersity amplifies the fluctuation-induced correction to the mean-field ODT, which we attribute to a reduction in packing frustration. Consistent with thisexplanation, polydispersity is found to enhance the stability of the perforated-lamellar phase.
6210 dx.doi.org/10.1021/ma200966a |Macromolecules 2011, 44, 6209–6219
Macromolecules ARTICLE
single composition, and its ability to locate the ODT waslimited by the finite size of the hysteresis loops.
Here we extend our previous Monte Carlo study to a widerange of compositions, f, for polydisperse diblock copolymers ofPDIA = 1.5 and N = 30. This will allow us to deduce the effect ofpolydispersity by comparing to an earlier study25 on monodis-perse melts of the same polymerization. To improve the sensi-tivity of our new study, this time we implement the same paralleltempering procedure used in the monodisperse study. Bysimulating the different temperatures simultaneously on a multi-processor platform, we are able to perform far moreMonte Carlosteps (MCS) than by the sequential temperature sweeps of ourearlier study.23 Furthermore, the exchange of configurationsbetween adjacent temperatures provides an effective way ofovercoming energy barriers allowing equilibrium to be reachedmore quickly. As a result of the improved statistics, the systemgenerally exhibits a well-defined spike in the heat capacity, CV,which locates the ODT with far more accuracy than the previoushysteresis loops. In the few cases where there is no discerniblespike, we locate the ODT by the disappearance of peaks in theordered-state scattering function, S(q).
’MONTE CARLO ALGORITHM
The current study employs the same lattice model described indetail by Vassiliev and Matsen24 for monodisperse melts andextended by Beardsley and Matsen23 to polydisperse melts. Itcontains n = ∑nNA
diblock copolymers, of which nNAhave NA
monomers in their A block, giving a number-averaged polymer-ization of (NA)n = ∑NAnNA
/n. The monodisperse B blocks areeach composed of NB monomers. The resulting polymer chainsare placed on a lattice with no more than one monomer perlattice site and with bonded monomers occupying nearest-neighbor sites. In order to minimize lattice effects, the modeluses a face-centered cubic (fcc) lattice with a large coordinationnumber of z = 12 and periodic boundaries. It is constructed bytaking an L� L� L simple cubic lattice with lattice constant, d,and deleting every second site, producing an fcc lattice withV = L3/2 sites and a nearest-neighbor distance of b =
√2d. As in
our previous study, the default box size is L = 54, but neverthelesswe often run simulations over a range of sizes in order to assessfinite-size effects. To allow room for the polymers to move, thelattice is only filled to a copolymer occupancy of ϕc � nN/V ≈0.8. Molecular interactions are limited to neighboring A and Bmonomers with an interaction strength of εAB, from which wedefine a lattice-based Flory�Huggins parameter
χ � zεABkBT
ð1Þ
The simulations are performed in the canonical ensemble byapplying the standard Metropolis algorithm over a range oftemperatures, {χi}. At each temperature, the algorithm choosesamong four types of Monte Carlo step (MCS): the slitheringsnake, chain reversal, crankshaft, and block exchange with relativefrequencies of 6:1:2:1. Instead of simulating the temperaturessequentially as before,23 they are now simulated simultaneouslyon separate CPUs using parallel tempering26�28 as implementedin our previous monodisperse study.25 This is done with theintroduction of a global move, which attempts to swap theconfigurations of a randomly selected pair of neighboringtemperatures, every 103 MCS per monomer.
For given values of L, (NA)n, and NB, a simulation begins byequilibrating an athermal configuration (i.e., χ = 0) with 106 MCSper monomer, which serves as our initial configuration for finite χ.A sequence of χi values (i = 1, 2, ...,M) is then selected to span theexpected location of the ODT and generally involves M = 20replicas with a spacing of ΔχN = 0.5 for compositions exhibitingthe strongest transitions and ΔχN = 1.0 for most other composi-tions. The M replicas are all started from the athermal configura-tion and equilibrated for typically 3 � 106 MCS per monomer,after which the resulting configurations are visually inspected. IftheODT does not appear to have been captured, then the series oftemperatures is adjusted and additional relaxation steps areperformed. Furthermore, if the acceptance rate of replica exchangebetween any two neighboring temperatures drops below 20%,then an intermediate temperature point is inserted.
Once the system has been equilibrated, various thermody-namic quantities are independently sampled in each replica,every 40 MCS per monomer. The estimation period usuallylasts for about 5� 106MCS per monomer. The main quantity ofinterest is the heat capacity
CV ¼ εAB2
kBT2ðÆnAB2æ� ÆnABæ2Þ ð2Þ
where nAB is the total number of A�Bmonomer contacts and theangle brackets denoteMonte Carlo averages. The heat capacity iscommonly used to detect first-order transitions,29 where there isa jump in the internal energy, εABnAB. At a transition, the systemspends equal amounts of time in the two competing states,causing the internal energy to fluctuate and thus producing alarge value of CV. Moving away from the transition causes onephase to dominate the other, which reduces the fluctuationsleading to a drop in CV. This results in a peak with a widthinversely proportional to the difference in internal energy and aheight proportional to the difference squared. Thus, the peakbecomes sharper and more pronounce as the system size isincreased, since ÆnABæ � V.
However, even when using the largest system size we are ableto equilibrate, the transformation from the disordered state to anordered phase does not always result in a sufficient decrease inÆnABæ to produce a discernible peak in CV. Even still, there isusually a significant change in morphology, which can be readilyidentified by visual inspection of the configurations. However,this is a rather tedious way of locating the ODT. A moreconvenient alternative is to use the structure function
SðqÞ ¼ 1VÆj ∑
V
j¼ 1σj expðiq 3 rjÞj2æ ð3Þ
where rj is the position of the jth lattice site and σj = 1, 0, or�1 ifit is occupied by an A-monomer, a vacancy, or a B-monomer,respectively. The ordered phase is then detected by spikes inS(q) produced by the periodicity of the morphology. Forsimplicity, we generally look at the spherically averaged structurefunction, S(q), but in some cases we do examine the full functionin 3-D reciprocal space for further information.
The shape of the molecular-weight distribution will have someeffect on the behavior of the polydispersemelt,13,30 but we ignore thisissue and adopt the usual Schultz�Zimm distribution31,32
pðNAÞ ¼ kkNAk � 1
ðNAÞnkΓðkÞexp � kNA
ðNAÞn
!ð4Þ
6211 dx.doi.org/10.1021/ma200966a |Macromolecules 2011, 44, 6209–6219
Macromolecules ARTICLE
where PDIA � (NA)w/(NA)n = (k + 1)/k. However, thiscontinuous distribution needs to be converted to a discretedistribution {nNA
} with n = ∑nNAtotal chains and a specified
number-averaged polymerization of (NA)n = ∑NAnNA/n. For a
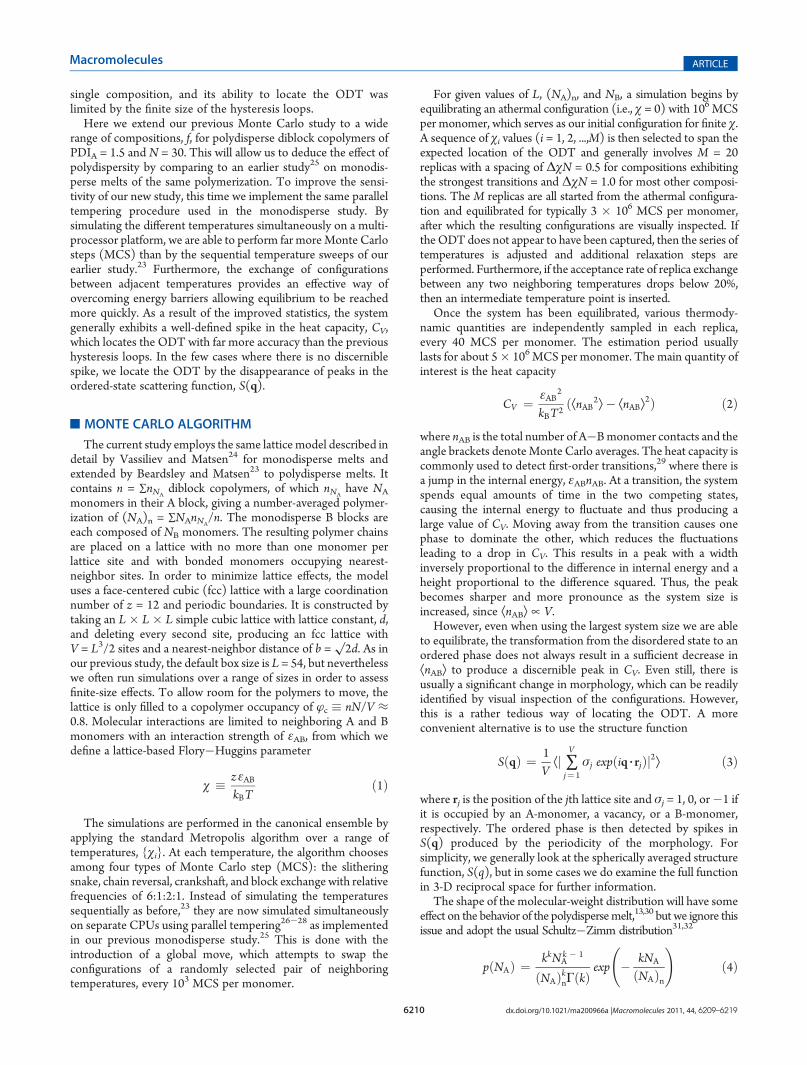
detailed description of the discretization procedure, we refer thereader to our previous paper.23 Figure 1 compares the resultingdiscrete distribution to the continuous distribution, eq 4, forPDIA = 1.5 with (NA)n = 10, 15, and 20. This example is forn = 2100, which corresponds to the number of polymer chains inour default simulation box of L = 54.
’RESULTS
To facilitate direct comparison to the early study on mono-disperse diblocks,25 we fix the degree of polymerization to thesame value, N = (NA)n + NB = 30, and sweep across a range ofcompositions, (NA)n = 4�25, locating the ODT and identifyingthe symmetry of the ordered morphology. Based on our previousexperience,23 large polydispersities lead to a variety of computa-tional challenges. For instance, broad molecular weight distribu-tions result in a number of long molecules, particularly for large(NA)n, which are slow to relax requiring increased equilibrationperiods. Polydispersity also reduces the tendency of the system toorder, making the ODT more difficult to detect. Furthermore,polydispersity creates larger domains and thus generally requiresbigger simulation boxes. Therefore, we select an intermediatevalue of polydispersity, PDIA = (NA)w/(NA)n = 1.5, that is large
enough to have a significant effect, but not too large to createcomputational difficulties.Sphere Phase with Monodisperse Matrix. The lowest di-
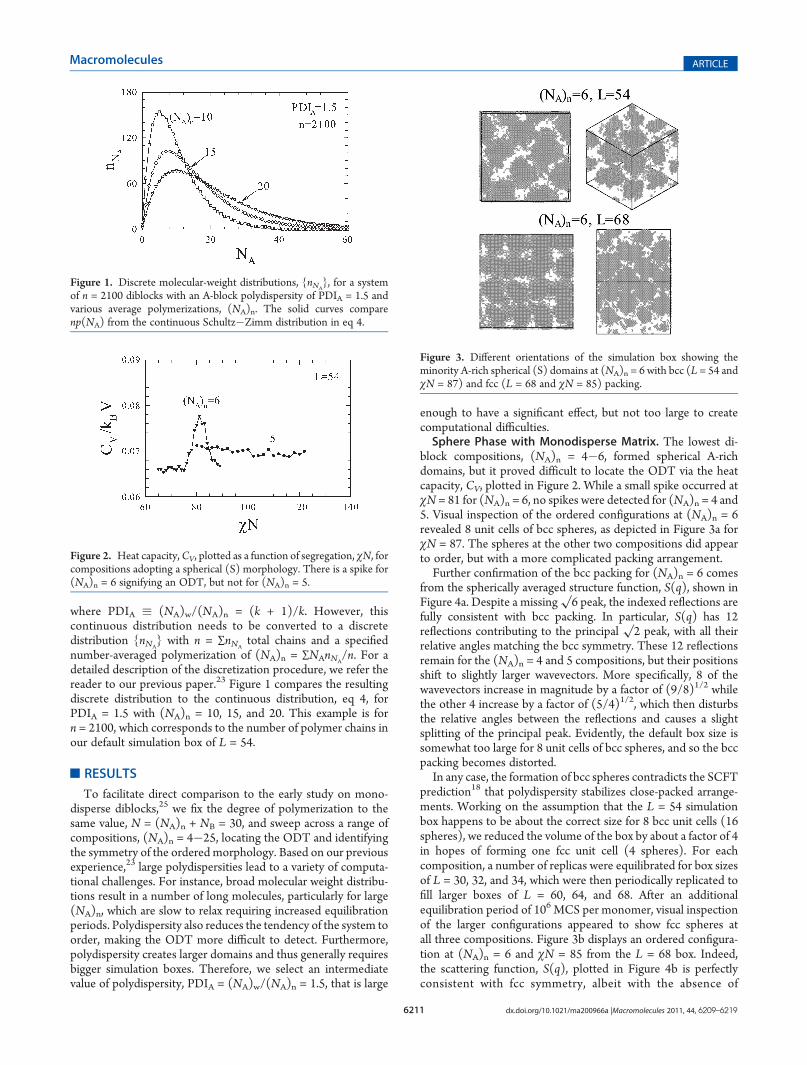
block compositions, (NA)n = 4�6, formed spherical A-richdomains, but it proved difficult to locate the ODT via the heatcapacity, CV, plotted in Figure 2. While a small spike occurred atχN = 81 for (NA)n = 6, no spikes were detected for (NA)n = 4 and5. Visual inspection of the ordered configurations at (NA)n = 6revealed 8 unit cells of bcc spheres, as depicted in Figure 3a forχN = 87. The spheres at the other two compositions did appearto order, but with a more complicated packing arrangement.Further confirmation of the bcc packing for (NA)n = 6 comes
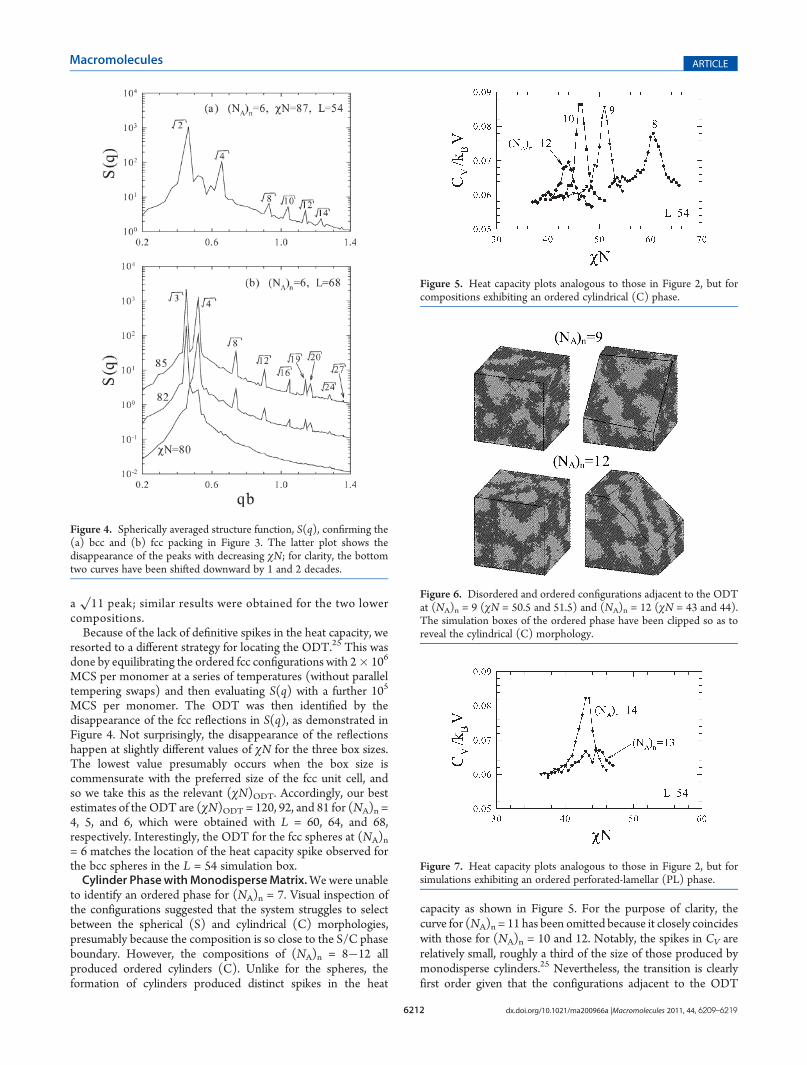
from the spherically averaged structure function, S(q), shown inFigure 4a. Despite a missing
√6 peak, the indexed reflections are
fully consistent with bcc packing. In particular, S(q) has 12reflections contributing to the principal
√2 peak, with all their
relative angles matching the bcc symmetry. These 12 reflectionsremain for the (NA)n = 4 and 5 compositions, but their positionsshift to slightly larger wavevectors. More specifically, 8 of thewavevectors increase in magnitude by a factor of (9/8)1/2 whilethe other 4 increase by a factor of (5/4)1/2, which then disturbsthe relative angles between the reflections and causes a slightsplitting of the principal peak. Evidently, the default box size issomewhat too large for 8 unit cells of bcc spheres, and so the bccpacking becomes distorted.In any case, the formation of bcc spheres contradicts the SCFT
prediction18 that polydispersity stabilizes close-packed arrange-ments. Working on the assumption that the L = 54 simulationbox happens to be about the correct size for 8 bcc unit cells (16spheres), we reduced the volume of the box by about a factor of 4in hopes of forming one fcc unit cell (4 spheres). For eachcomposition, a number of replicas were equilibrated for box sizesof L = 30, 32, and 34, which were then periodically replicated tofill larger boxes of L = 60, 64, and 68. After an additionalequilibration period of 106 MCS per monomer, visual inspectionof the larger configurations appeared to show fcc spheres atall three compositions. Figure 3b displays an ordered configura-tion at (NA)n = 6 and χN = 85 from the L = 68 box. Indeed,the scattering function, S(q), plotted in Figure 4b is perfectlyconsistent with fcc symmetry, albeit with the absence of
Figure 1. Discrete molecular-weight distributions, {nNA}, for a system
of n = 2100 diblocks with an A-block polydispersity of PDIA = 1.5 andvarious average polymerizations, (NA)n. The solid curves comparenp(NA) from the continuous Schultz�Zimm distribution in eq 4.
Figure 2. Heat capacity,CV, plotted as a function of segregation, χN, forcompositions adopting a spherical (S) morphology. There is a spike for(NA)n = 6 signifying an ODT, but not for (NA)n = 5.
Figure 3. Different orientations of the simulation box showing theminority A-rich spherical (S) domains at (NA)n = 6 with bcc (L = 54 andχN = 87) and fcc (L = 68 and χN = 85) packing.
6212 dx.doi.org/10.1021/ma200966a |Macromolecules 2011, 44, 6209–6219
Macromolecules ARTICLE
a√11 peak; similar results were obtained for the two lower
compositions.Because of the lack of definitive spikes in the heat capacity, we
resorted to a different strategy for locating the ODT.25 This wasdone by equilibrating the ordered fcc configurations with 2� 106
MCS per monomer at a series of temperatures (without paralleltempering swaps) and then evaluating S(q) with a further 105
MCS per monomer. The ODT was then identified by thedisappearance of the fcc reflections in S(q), as demonstrated inFigure 4. Not surprisingly, the disappearance of the reflectionshappen at slightly different values of χN for the three box sizes.The lowest value presumably occurs when the box size iscommensurate with the preferred size of the fcc unit cell, andso we take this as the relevant (χN)ODT. Accordingly, our bestestimates of the ODT are (χN)ODT = 120, 92, and 81 for (NA)n =4, 5, and 6, which were obtained with L = 60, 64, and 68,respectively. Interestingly, the ODT for the fcc spheres at (NA)n= 6 matches the location of the heat capacity spike observed forthe bcc spheres in the L = 54 simulation box.Cylinder PhasewithMonodisperseMatrix.Wewere unable
to identify an ordered phase for (NA)n = 7. Visual inspection ofthe configurations suggested that the system struggles to selectbetween the spherical (S) and cylindrical (C) morphologies,presumably because the composition is so close to the S/C phaseboundary. However, the compositions of (NA)n = 8�12 allproduced ordered cylinders (C). Unlike for the spheres, theformation of cylinders produced distinct spikes in the heat
capacity as shown in Figure 5. For the purpose of clarity, thecurve for (NA)n = 11 has been omitted because it closely coincideswith those for (NA)n = 10 and 12. Notably, the spikes in CV arerelatively small, roughly a third of the size of those produced bymonodisperse cylinders.25 Nevertheless, the transition is clearlyfirst order given that the configurations adjacent to the ODT
Figure 5. Heat capacity plots analogous to those in Figure 2, but forcompositions exhibiting an ordered cylindrical (C) phase.
Figure 6. Disordered and ordered configurations adjacent to the ODTat (NA)n = 9 (χN = 50.5 and 51.5) and (NA)n = 12 (χN = 43 and 44).The simulation boxes of the ordered phase have been clipped so as toreveal the cylindrical (C) morphology.
Figure 7. Heat capacity plots analogous to those in Figure 2, but forsimulations exhibiting an ordered perforated-lamellar (PL) phase.
Figure 4. Spherically averaged structure function, S(q), confirming the(a) bcc and (b) fcc packing in Figure 3. The latter plot shows thedisappearance of the peaks with decreasing χN; for clarity, the bottomtwo curves have been shifted downward by 1 and 2 decades.
6213 dx.doi.org/10.1021/ma200966a |Macromolecules 2011, 44, 6209–6219
Macromolecules ARTICLE
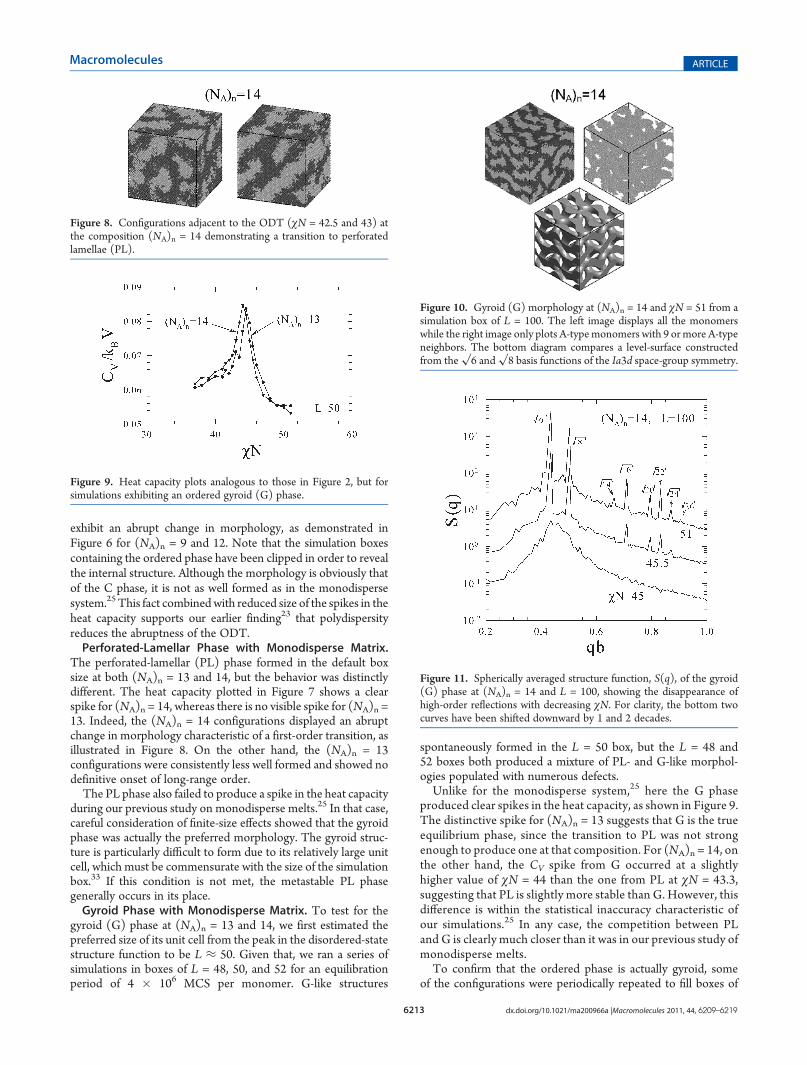
exhibit an abrupt change in morphology, as demonstrated inFigure 6 for (NA)n = 9 and 12. Note that the simulation boxescontaining the ordered phase have been clipped in order to revealthe internal structure. Although the morphology is obviously thatof the C phase, it is not as well formed as in the monodispersesystem.25 This fact combinedwith reduced size of the spikes in theheat capacity supports our earlier finding23 that polydispersityreduces the abruptness of the ODT.Perforated-Lamellar Phase with Monodisperse Matrix.
The perforated-lamellar (PL) phase formed in the default boxsize at both (NA)n = 13 and 14, but the behavior was distinctlydifferent. The heat capacity plotted in Figure 7 shows a clearspike for (NA)n = 14, whereas there is no visible spike for (NA)n =13. Indeed, the (NA)n = 14 configurations displayed an abruptchange in morphology characteristic of a first-order transition, asillustrated in Figure 8. On the other hand, the (NA)n = 13configurations were consistently less well formed and showed nodefinitive onset of long-range order.The PL phase also failed to produce a spike in the heat capacity
during our previous study on monodisperse melts.25 In that case,careful consideration of finite-size effects showed that the gyroidphase was actually the preferred morphology. The gyroid struc-ture is particularly difficult to form due to its relatively large unitcell, which must be commensurate with the size of the simulationbox.33 If this condition is not met, the metastable PL phasegenerally occurs in its place.Gyroid Phase with Monodisperse Matrix. To test for the
gyroid (G) phase at (NA)n = 13 and 14, we first estimated thepreferred size of its unit cell from the peak in the disordered-statestructure function to be L ≈ 50. Given that, we ran a series ofsimulations in boxes of L = 48, 50, and 52 for an equilibrationperiod of 4 � 106 MCS per monomer. G-like structures
spontaneously formed in the L = 50 box, but the L = 48 and52 boxes both produced a mixture of PL- and G-like morphol-ogies populated with numerous defects.Unlike for the monodisperse system,25 here the G phase
produced clear spikes in the heat capacity, as shown in Figure 9.The distinctive spike for (NA)n = 13 suggests that G is the trueequilibrium phase, since the transition to PL was not strongenough to produce one at that composition. For (NA)n = 14, onthe other hand, the CV spike from G occurred at a slightlyhigher value of χN = 44 than the one from PL at χN = 43.3,suggesting that PL is slightly more stable than G. However, thisdifference is within the statistical inaccuracy characteristic ofour simulations.25 In any case, the competition between PLand G is clearly much closer than it was in our previous study ofmonodisperse melts.To confirm that the ordered phase is actually gyroid, some
of the configurations were periodically repeated to fill boxes of
Figure 8. Configurations adjacent to the ODT (χN = 42.5 and 43) atthe composition (NA)n = 14 demonstrating a transition to perforatedlamellae (PL).
Figure 9. Heat capacity plots analogous to those in Figure 2, but forsimulations exhibiting an ordered gyroid (G) phase.
Figure 10. Gyroid (G) morphology at (NA)n = 14 and χN = 51 from asimulation box of L = 100. The left image displays all the monomerswhile the right image only plots A-typemonomers with 9 ormore A-typeneighbors. The bottom diagram compares a level-surface constructedfrom the
√6 and
√8 basis functions of the Ia3d space-group symmetry.
Figure 11. Spherically averaged structure function, S(q), of the gyroid(G) phase at (NA)n = 14 and L = 100, showing the disappearance ofhigh-order reflections with decreasing χN. For clarity, the bottom twocurves have been shifted downward by 1 and 2 decades.
6214 dx.doi.org/10.1021/ma200966a |Macromolecules 2011, 44, 6209–6219
Macromolecules ARTICLE
L = 100 and then equilibrated for a further 106MCS per monomer.Figure 10 shows the resulting configuration for (NA)n = 14 atχN = 51, plotted first with all monomers and then with just theA-type monomers that have at least 9 A-type neighbors. TheMonte Carlo configuration is also compared to a level surface,generated from a linear combination of the
√6 and
√8 basis
functions of the Ia3d space group to approximate the A/Binterface of the G morphology. The resemblance is ratherstriking. Further confirmation of the Ia3d symmetry comes fromthe spherically averaged structure function, S(q), plotted inFigure 11. The appearance of the first 8 Ia3d peaks leaves nodoubt that the ordered phase is indeed gyroid. Analogous resultswere obtained for (NA)n = 13.The heat capacity spikes in Figure 9 are obtained from just a
single unit cell of G, and so we also located the ODT from thelarger simulation box, L = 100, by examining the disappearance ofthe peaks in S(q). Following the same procedure as for the fccspheres, an ordered morphology is equilibrated at a series ofhigher temperatures for 106MCS per monomer (without paralleltempering swaps). According to S(q), the G phase appears todisorder at χN= 45 for (NA)n = 14, as illustrated in Figure 11, andat χN = 45.5 for (NA)n = 13. These values are slightly higher thanthose obtained from the spike in CV, which is not too surprisingsince a larger simulation box permits more fluctuations. Given
that the bigger box is closer to the thermodynamic limit, theselatter results are taken to be our best estimates of (χN)ODT.Lamellar Phase. The simple lamellar (L) phase was observed
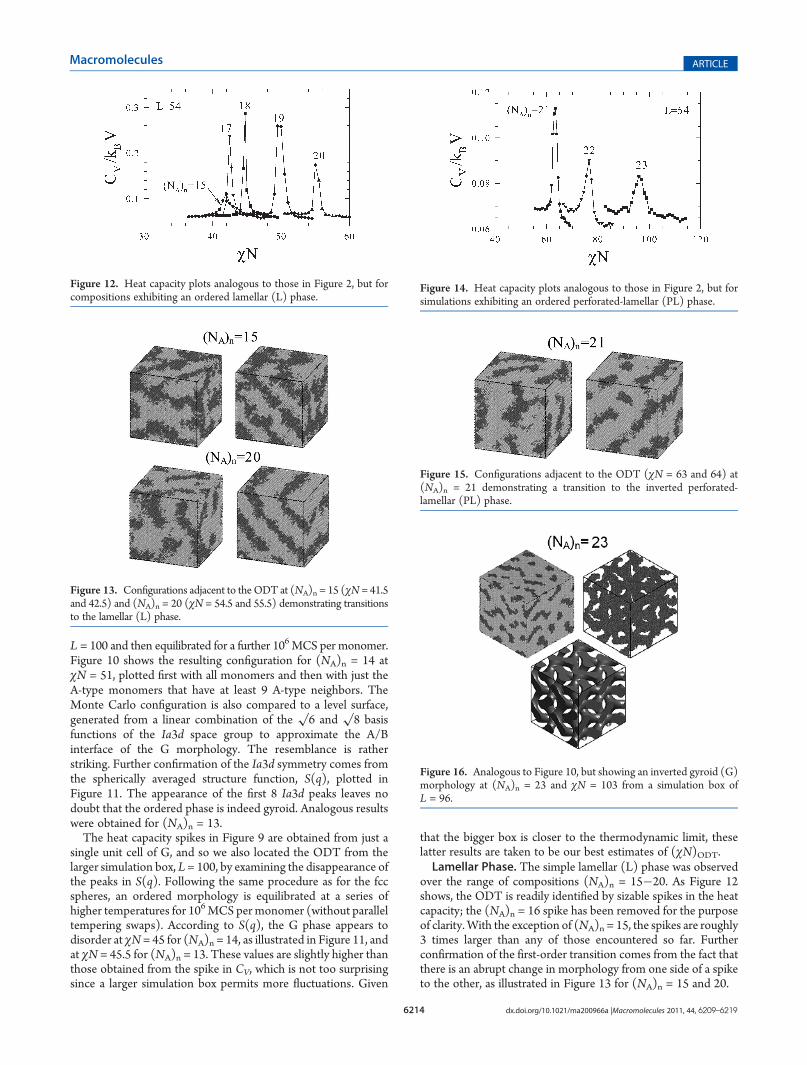
over the range of compositions (NA)n = 15�20. As Figure 12shows, the ODT is readily identified by sizable spikes in the heatcapacity; the (NA)n = 16 spike has been removed for the purposeof clarity.With the exception of (NA)n = 15, the spikes are roughly3 times larger than any of those encountered so far. Furtherconfirmation of the first-order transition comes from the fact thatthere is an abrupt change in morphology from one side of a spiketo the other, as illustrated in Figure 13 for (NA)n = 15 and 20.
Figure 12. Heat capacity plots analogous to those in Figure 2, but forcompositions exhibiting an ordered lamellar (L) phase.
Figure 13. Configurations adjacent to theODT at (NA)n = 15 (χN = 41.5and 42.5) and (NA)n = 20 (χN = 54.5 and 55.5) demonstrating transitionsto the lamellar (L) phase.
Figure 14. Heat capacity plots analogous to those in Figure 2, but forsimulations exhibiting an ordered perforated-lamellar (PL) phase.
Figure 15. Configurations adjacent to the ODT (χN = 63 and 64) at(NA)n = 21 demonstrating a transition to the inverted perforated-lamellar (PL) phase.
Figure 16. Analogous to Figure 10, but showing an inverted gyroid (G)morphology at (NA)n = 23 and χN = 103 from a simulation box ofL = 96.
6215 dx.doi.org/10.1021/ma200966a |Macromolecules 2011, 44, 6209–6219
Macromolecules ARTICLE
The ordered configurations from (NA)n = 16 to 20 are clearlylamellar, with well-formed alternating A- and B-rich layers.However, the A-rich lamellae of the (NA)n = 15 configurationexhibit a small population of perforations, as previously encoun-tered in the L phase of monodisperse melts.23 These perforationsare much different than the permanent densely packed ones inthe PL morphology. In this case, the perforations are transientfeatures that diffuse around the lamellae for just a few thousandMCS per monomer before closing up. We suspect that it is theirpresence that causes the peak in CV to be significantly smallerthan for the other compositions.Perforated-Lamellar Phase with Polydisperse Matrix. In
the standard box size of L = 54, an inverted PL phase withperforations in the monodisperse B-rich lamellae forms atcompositions of (NA)n = 21�23. This time, the heat capacityplotted in Figure 14 displays clear spikes identifying the ODT.Although the spikes become smaller and broader with increasing(NA)n, they remain as large as for any of the nonlamellar phases.The CV spikes are also accompanied by abrupt changes in themorphology, as illustrated in Figure 15 for (NA)n = 21. Unlike forthe neighboring L phase at (NA)n = 20, the perforations aredensely packed and permanent, at least, on the time scale of thesimulations (i.e., 3� 106 MCS per monomer). However, as withall instances of PL, we need to consider its potential metastabilitywith respect to the G phase.Gyroid Phase with Polydisperse Matrix. The peak in the
disordered-state structure function at compositions (NA)n =21�23 indicates a preferred size of L ≈ 46 for the gyroid unitcell. Therefore, we investigated the range of box sizes, L = 42, 44,46, 48, and 50. Even with a particularly long equilibration periodof 5 � 106 MCS per monomer, G-like configurations onlyformed for the (NA)n = 23 composition. There were a fewreplicas in the L = 46 simulation box that exhibited G-like order,but they were defect-ridden. Some better formed G-like struc-tures were produced in the L = 48 box, but even still they wereintermixed with replicas exhibiting PL-like morphologies. Thesystem evidently has considerable difficulty in choosing betweenthe G and PL phases.To test the stability of the G phase more thoroughly, we took
one of the ordered configurations from the L = 48 simulation box
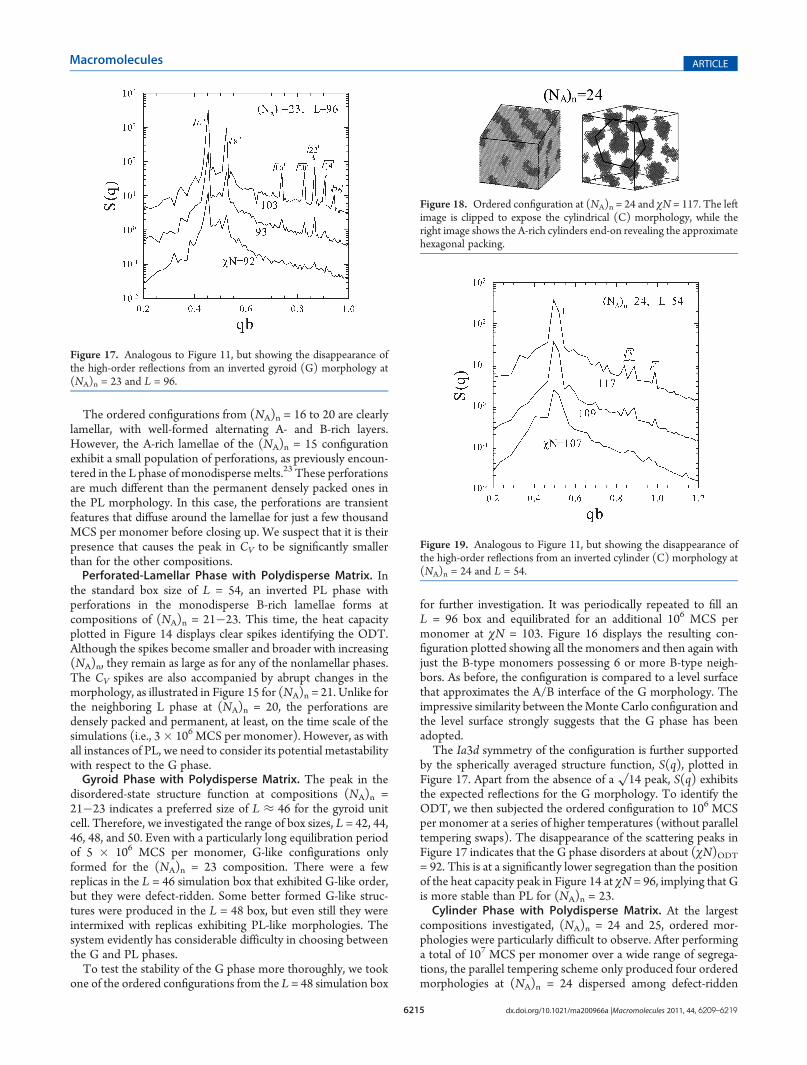
for further investigation. It was periodically repeated to fill anL = 96 box and equilibrated for an additional 106 MCS permonomer at χN = 103. Figure 16 displays the resulting con-figuration plotted showing all the monomers and then again withjust the B-type monomers possessing 6 or more B-type neigh-bors. As before, the configuration is compared to a level surfacethat approximates the A/B interface of the G morphology. Theimpressive similarity between theMonte Carlo configuration andthe level surface strongly suggests that the G phase has beenadopted.The Ia3d symmetry of the configuration is further supported
by the spherically averaged structure function, S(q), plotted inFigure 17. Apart from the absence of a
√14 peak, S(q) exhibits
the expected reflections for the G morphology. To identify theODT, we then subjected the ordered configuration to 106 MCSper monomer at a series of higher temperatures (without paralleltempering swaps). The disappearance of the scattering peaks inFigure 17 indicates that the G phase disorders at about (χN)ODT= 92. This is at a significantly lower segregation than the positionof the heat capacity peak in Figure 14 at χN = 96, implying that Gis more stable than PL for (NA)n = 23.Cylinder Phase with Polydisperse Matrix. At the largest
compositions investigated, (NA)n = 24 and 25, ordered mor-phologies were particularly difficult to observe. After performinga total of 107 MCS per monomer over a wide range of segrega-tions, the parallel tempering scheme only produced four orderedmorphologies at (NA)n = 24 dispersed among defect-ridden
Figure 17. Analogous to Figure 11, but showing the disappearance ofthe high-order reflections from an inverted gyroid (G) morphology at(NA)n = 23 and L = 96.
Figure 18. Ordered configuration at (NA)n = 24 and χN = 117. The leftimage is clipped to expose the cylindrical (C) morphology, while theright image shows the A-rich cylinders end-on revealing the approximatehexagonal packing.
Figure 19. Analogous to Figure 11, but showing the disappearance ofthe high-order reflections from an inverted cylinder (C) morphology at(NA)n = 24 and L = 54.
6216 dx.doi.org/10.1021/ma200966a |Macromolecules 2011, 44, 6209–6219
Macromolecules ARTICLE
configurations and three at (NA)n = 25. Figure 18 displays one ofthe ordered configurations from (NA)n = 24 at χN = 117. In theleft image, the simulation box has been clipped to show theinternal structure of the phase which is clearly cylindrical, and inthe right image, the matrix has been removed with the boxoriented to display the approximate hexagonal packing of thecylinders.Because of the exceptionally long equilibration times required
to produce ordered configurations, the ODT could not bedetermined from the heat capacity. Therefore, we turned tothe same method used for the fcc spherical and gyroid phases,where the transition was detected via the structure function, S(q).At each composition, an ordered C configuration was subjectedto 107 MCS per monomer of equilibration over a broad range ofsegregations (without parallel tempering swaps), and the ODTwas identified by the loss of peaks in S(q). In this case, the L = 54box was considered to be large enough that we did not double its
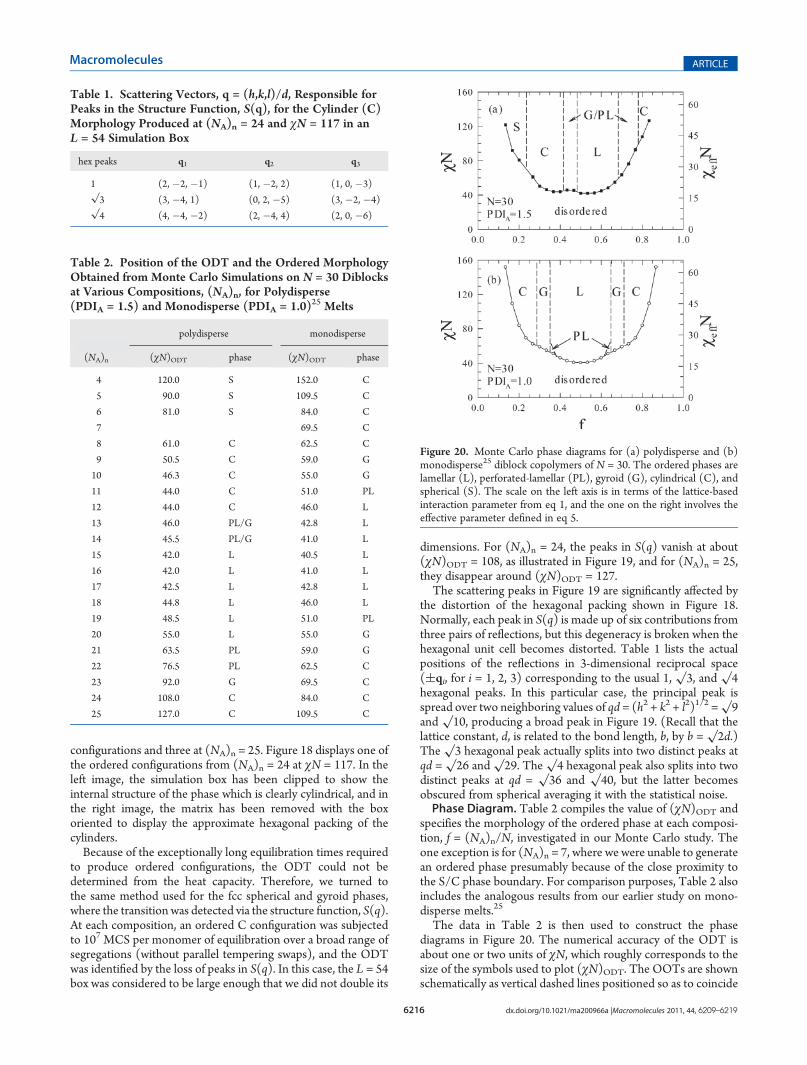
dimensions. For (NA)n = 24, the peaks in S(q) vanish at about(χN)ODT = 108, as illustrated in Figure 19, and for (NA)n = 25,they disappear around (χN)ODT = 127.The scattering peaks in Figure 19 are significantly affected by
the distortion of the hexagonal packing shown in Figure 18.Normally, each peak in S(q) is made up of six contributions fromthree pairs of reflections, but this degeneracy is broken when thehexagonal unit cell becomes distorted. Table 1 lists the actualpositions of the reflections in 3-dimensional reciprocal space((qi, for i = 1, 2, 3) corresponding to the usual 1,
√3, and
√4
hexagonal peaks. In this particular case, the principal peak isspread over two neighboring values of qd = (h2 + k2 + l2)1/2 =
√9
and√10, producing a broad peak in Figure 19. (Recall that the
lattice constant, d, is related to the bond length, b, by b =√2d.)
The√3 hexagonal peak actually splits into two distinct peaks at
qd =√26 and
√29. The
√4 hexagonal peak also splits into two
distinct peaks at qd =√36 and
√40, but the latter becomes
obscured from spherical averaging it with the statistical noise.Phase Diagram. Table 2 compiles the value of (χN)ODT and
specifies the morphology of the ordered phase at each composi-tion, f = (NA)n/N, investigated in our Monte Carlo study. Theone exception is for (NA)n = 7, where we were unable to generatean ordered phase presumably because of the close proximity tothe S/C phase boundary. For comparison purposes, Table 2 alsoincludes the analogous results from our earlier study on mono-disperse melts.25
The data in Table 2 is then used to construct the phasediagrams in Figure 20. The numerical accuracy of the ODT isabout one or two units of χN, which roughly corresponds to thesize of the symbols used to plot (χN)ODT. The OOTs are shownschematically as vertical dashed lines positioned so as to coincide
Table 2. Position of the ODT and the Ordered MorphologyObtained from Monte Carlo Simulations on N = 30 Diblocksat Various Compositions, (NA)n, for Polydisperse(PDIA = 1.5) and Monodisperse (PDIA = 1.0)25 Melts
polydisperse monodisperse
(NA)n (χN)ODT phase (χN)ODT phase
4 120.0 S 152.0 C
5 90.0 S 109.5 C
6 81.0 S 84.0 C
7 69.5 C
8 61.0 C 62.5 C
9 50.5 C 59.0 G
10 46.3 C 55.0 G
11 44.0 C 51.0 PL
12 44.0 C 46.0 L
13 46.0 PL/G 42.8 L
14 45.5 PL/G 41.0 L
15 42.0 L 40.5 L
16 42.0 L 41.0 L
17 42.5 L 42.8 L
18 44.8 L 46.0 L
19 48.5 L 51.0 PL
20 55.0 L 55.0 G
21 63.5 PL 59.0 G
22 76.5 PL 62.5 C
23 92.0 G 69.5 C
24 108.0 C 84.0 C
25 127.0 C 109.5 C
Figure 20. Monte Carlo phase diagrams for (a) polydisperse and (b)monodisperse25 diblock copolymers of N = 30. The ordered phases arelamellar (L), perforated-lamellar (PL), gyroid (G), cylindrical (C), andspherical (S). The scale on the left axis is in terms of the lattice-basedinteraction parameter from eq 1, and the one on the right involves theeffective parameter defined in eq 5.
Table 1. Scattering Vectors, q = (h,k,l)/d, Responsible forPeaks in the Structure Function, S(q), for the Cylinder (C)Morphology Produced at (NA)n = 24 and χN = 117 in anL = 54 Simulation Box
hex peaks q1 q2 q3
1 (2, �2, �1) (1, �2, 2) (1, 0, �3)√3 (3, �4, 1) (0, 2, �5) (3, �2, �4)√4 (4, �4, �2) (2, �4, 4) (2, 0, �6)
6217 dx.doi.org/10.1021/ma200966a |Macromolecules 2011, 44, 6209–6219
Macromolecules ARTICLE
with the morphologies listed in Table 2. The left axis is labeled interms of the lattice-based χ parameter defined in eq 1, whichdiffers from the more common definition used by the continuummodel of SCFT. In order to facilitate quantitative comparisonwith SCFT,18 the right axis is labeled with an effective interactionparameter34,35
χeff � zeffεABkBT
ð5Þ
where the effective coordination number, zeff = 4.94, wasevaluated previously25 from the number of intermolecular con-tacts in an athermal melt (χ = 0) extrapolated to infinite N.Interestingly, the ODT of the polydisperse system exhibits a
noticeable bump at the complex phase window, f ≈ 0.45 (seeFigure 20a). This feature has been observed in experiments onmonodisperse melts,36,37 but this is the first time it has been seenin simulations. It implies that the microstructure of the complexphases is more easily disrupted by thermal fluctuations than thatof the neighboring lamellar and cylindrical phases. This may inpart be due to the polydispersity of A-type blocks making up theminority component networks, but it may also have something todo with the location of the complex phase window. The effectcould be more pronounced than usual due to the fact that theslope of the ODT is relatively flat.The most striking effect of polydispersity is the shift in the
OOTs toward larger A-block composition, f. There was someevidence of this in our previous Monte Carlo study23 at f = 0.5,where the lamellar phase became perforated at large PDIA, butthe effect is much clearer in the full phase diagrams of Figure 20.This result is qualitatively consistent with both experiment11�14
and SCFT15,16,18 and is readily explained by the fact thatpolydispersity reduces the entropic stretching energy of theA-rich domains.
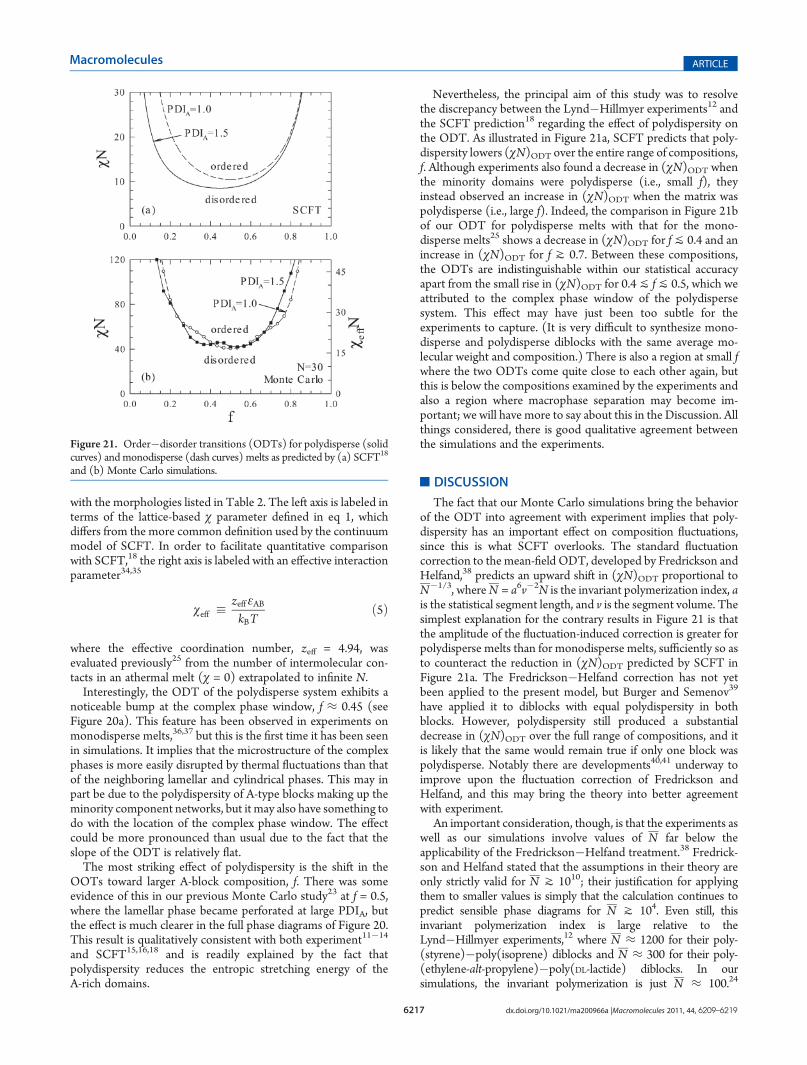
Nevertheless, the principal aim of this study was to resolvethe discrepancy between the Lynd�Hillmyer experiments12 andthe SCFT prediction18 regarding the effect of polydispersity onthe ODT. As illustrated in Figure 21a, SCFT predicts that poly-dispersity lowers (χN)ODT over the entire range of compositions,f. Although experiments also found a decrease in (χN)ODT whenthe minority domains were polydisperse (i.e., small f), theyinstead observed an increase in (χN)ODT when the matrix waspolydisperse (i.e., large f). Indeed, the comparison in Figure 21bof our ODT for polydisperse melts with that for the mono-disperse melts25 shows a decrease in (χN)ODT for fj 0.4 and anincrease in (χN)ODT for f J 0.7. Between these compositions,the ODTs are indistinguishable within our statistical accuracyapart from the small rise in (χN)ODT for 0.4j fj 0.5, which weattributed to the complex phase window of the polydispersesystem. This effect may have just been too subtle for theexperiments to capture. (It is very difficult to synthesize mono-disperse and polydisperse diblocks with the same average mo-lecular weight and composition.) There is also a region at small fwhere the two ODTs come quite close to each other again, butthis is below the compositions examined by the experiments andalso a region where macrophase separation may become im-portant; we will have more to say about this in the Discussion. Allthings considered, there is good qualitative agreement betweenthe simulations and the experiments.
’DISCUSSION
The fact that our Monte Carlo simulations bring the behaviorof the ODT into agreement with experiment implies that poly-dispersity has an important effect on composition fluctuations,since this is what SCFT overlooks. The standard fluctuationcorrection to the mean-field ODT, developed by Fredrickson andHelfand,38 predicts an upward shift in (χN)ODT proportional toN�1/3, whereN = a6v�2N is the invariant polymerization index, ais the statistical segment length, and v is the segment volume. Thesimplest explanation for the contrary results in Figure 21 is thatthe amplitude of the fluctuation-induced correction is greater forpolydisperse melts than for monodisperse melts, sufficiently so asto counteract the reduction in (χN)ODT predicted by SCFT inFigure 21a. The Fredrickson�Helfand correction has not yetbeen applied to the present model, but Burger and Semenov39
have applied it to diblocks with equal polydispersity in bothblocks. However, polydispersity still produced a substantialdecrease in (χN)ODT over the full range of compositions, and itis likely that the same would remain true if only one block waspolydisperse. Notably there are developments40,41 underway toimprove upon the fluctuation correction of Fredrickson andHelfand, and this may bring the theory into better agreementwith experiment.
An important consideration, though, is that the experiments aswell as our simulations involve values of N far below theapplicability of the Fredrickson�Helfand treatment.38 Fredrick-son and Helfand stated that the assumptions in their theory areonly strictly valid for N J 1010; their justification for applyingthem to smaller values is simply that the calculation continues topredict sensible phase diagrams for N J 104. Even still, thisinvariant polymerization index is large relative to theLynd�Hillmyer experiments,12 where N ≈ 1200 for their poly-(styrene)�poly(isoprene) diblocks and N ≈ 300 for their poly-(ethylene-alt-propylene)�poly(DL-lactide) diblocks. In oursimulations, the invariant polymerization is just N ≈ 100.24
Figure 21. Order�disorder transitions (ODTs) for polydisperse (solidcurves) andmonodisperse (dash curves) melts as predicted by (a) SCFT18
and (b) Monte Carlo simulations.
6218 dx.doi.org/10.1021/ma200966a |Macromolecules 2011, 44, 6209–6219
Macromolecules ARTICLE
One of the Fredrickson�Helfand assumptions, which certainlyno longer holds, is that the melt remains weakly segregated atthe ODT. In reality, the centers of the A- and B-rich domains inour simulations are relatively pure. We suspect that at thislevel of segregation there are now important effects beyond whata weak-segregation approach can account for, such as packingfrustration.42 Indeed, a completely different theoretical approachmay be required for these values of N , even for monodispersemelts.
Polydispersity relieves packing frustration in the A-rich domainsdue to the reduction in entropic stretching energy and in the B-richdomains due to diblocks that detach from the interface on accountof their small A blocks.17 As previously pointed out,23 thisweakens the tendency for domains to order, which in turnallows composition fluctuations to have a larger effect causing ageneral upward shift in (χN)ODT. The reduced tendency to orderalso accounts for the increased difficulty we experienced intrying to detect the ODT, relative to our earlier study25 onmonodisperse melts.
Packing frustration is also attributed to creating a preferencefor G over PL.42,43 Consistent with a reduction in packingfrustration, the competition between G and PL is much closerthan for the monodisperse melts, where G survives to signifi-cantly higher χN than PL provided that the simulation box iscommensurate with the preferred size of its unit cell. Thesituation is quite different for the polydisperse melts. On the leftside of the phase diagram at (NA)n = 13 and 14, there is no longera discernible difference in the ODTs for PL and G. It is only thefact that G is able to displace PL in the L = 50 simulation box thatsuggests G is the true equilibrium phase. On the other side of thediagram, G does survive fluctuations to a significantly lower χNthan PL for (NA)n = 23. However, there are two compositions,(NA)n = 21 and 22, next to the L region where PL formed and Gdid not despite examining five separate system sizes centeredabout the expected size of its unit cell. Consistent with this, Lyndand Hillmyer12 did find one sample on this side of the phasediagram exhibiting the PL morphology. Listak et al.13 alsoobserved PL, but on the other side of the phase diagram; notablytheir polydispersity was higher, their molecular-weight distribu-tion was significantly less skewed, and there was a modestamount of homopolymer in their samples.
The two-phase coexistence regions predicted by SCFT18 andobserved in some experiments9,10,21,22 were absent in oursimulations. Basic thermodynamics predicts these regions toemerge along each of the phase boundaries, due to the fact thatthe competing phases have a preference for different portions ofthe molecular weight distribution (e.g., the lamellar phase favorsthe more symmetric diblocks while the other phases prefer theasymmetric molecules to varying degrees). It therefore becomesenergetically favorable for the molecular-weight distribution tofractionate into two populations, one for each of the coexistingphases. However, macrophase separation requires the transportof material over macroscopic distances, and thus the equilibra-tion time for this can become prohibitive. This applies to bothsimulations and experiments. In simulations, though, there is amore serious impediment to macrophase separation—the en-ergy cost of forming an interface between the coexisting phases.The system size has to be rather large before the energy gain frommacrophase separation is able to compensate for the penalty offorming the interface. If we were dealing with just a binary blend(i.e., two separatemolecular weights), thenwemight overcome thisproblem by performing simulations in the grand-canonical
ensemble. However, this is inconceivable when our polydispersesystem contains on the order of 100 separate molecularweights (see Figure 1), each of which requires a separate chemicalpotential.
Nevertheless, the two-phase regions should still be relativelynarrow for PDIA = 1.5 according to SCFT,18 with perhaps theexception of the one separating the disordered phase from theordered spheres at small f. For sufficiently asymmetric composi-tions, the disordered phase will start to form spherical micelles asthe temperature is reduced, predominantly from the diblockswith the longer A blocks. At some point, the spheres will start toaggregate into a close-packed arrangement (most certainly in animperfect lattice which is neither fcc nor hcp), leading to coex-istence between a spherical and a disordered phase. As thetemperature is reduced further, the spheres will start to incorporatediblocks with ever shorter A blocks, causing the disordered phaseto shrink away until only a spherical phase remains. Unfortunately,Lynd and Hillmyer did not consider sufficiently small composi-tions, f, to produce spheres, as it would have been interesting to seeif experiments could actually detect this behavior.
’SUMMARY
Using lattice-based Monte Carlo simulations, a phase diagramwas generated for melts of AB diblock copolymer composed ofpolydisperse A blocks joined to monodisperse B blocks (seeFigure 20a). Although the simulations were performed in thecanonical ensemble, which prevents the formation of two-phasecoexistence, our study was restricted to a moderate A-blockpolydispersity index of PDIA = (NA)w/(NA)n = 1.5 for whichthese regions are expected to be narrow.18 We also chose a fixednumber-averaged polymerization of N = (NA)n + NB = 30(corresponding to an invariant polymerization index of N ≈ 100)to match that of our previous phase diagram for monodispersemelts (see Figure 20b)25 so as to allow for direct comparison.The polydispersity caused a sizable shift in the order�ordertransitions (OOTs) toward higher A-monomer compositions,f = (NA)n/N, as previously predicted by self-consistent fieldtheory (SCFT)15,16,18 and observed in experiment.11�14 However,unlike the SCFT, which predicts the order�disorder transition(ODT) to shift toward lower segregations at all compositions (seeFigure 21a), the Monte Carlo simulations observe a reduction in(χN)ODT for small f and an increase in (χN)ODT for large f (seeFigure 21b). This is in good agreement with the experiments ofLynd and Hillmyer.12
This difference between SCFT and the simulations impliesthat polydispersity increases the fluctuation-induced shift of themean-field ODT. We attribute this to a reduction in packingfrustration, which in turn weakens the tendency of domains toorder into a regular periodic structure. Indeed, it was generallymore difficult to detect the ODT in the polydisperse as opposedto the monodisperse melts. The reduced packing frustration alsoexplains the closer competition between the complex G and PLstructures, which evidently leads to a stable PL region between Land G on the large-f side of the phase diagram as observed byLynd and Hillmyer.12
’AUTHOR INFORMATION
Corresponding Author*E-mail: [email protected] (T.M.B.);[email protected] (M.W.M.).
6219 dx.doi.org/10.1021/ma200966a |Macromolecules 2011, 44, 6209–6219
Macromolecules ARTICLE
’ACKNOWLEDGMENT
We have benefited from useful discussions with Patrick Fair-clough, Marc Hillmyer, Nate Lynd, and Rob Wickham. Thiswork was supported by the EPSRC (EP/E010342/1).
’REFERENCES
(1) Bates, F. S.; Fredrickson, G. H. Phys. Today 1999, 52, 32–38.(2) Bates, F. S.; Schulz, M. F.; Khandpur, A. K.; F€orster, S.; Rosedale,
J. H.; Almdal, K.; Mortensen, K. Faraday Discuss. 1994, 98, 7–18.(3) Schulz, M. F.; Bates, F. S.; Almdal, K.; Mortensen, K. Phys. Rev.
Lett. 1994, 73, 86–89.(4) Hajduk, D. A.; Harper, P. E.; Gruner, S. M.; Honeker, C. C.; Kim,
G.; Thomas, E. L.; Fetters, L. J. Macromolecules 1994, 27, 4063–4075.(5) Hamley, I. W.; Koppi, K. A.; Rosedale, J. H.; Bates, F. S.; Almdal,
K.; Mortensen, K. Macromolecules 1993, 26, 5959–5970.(6) Hajduk, D. A.; Takenouchi, H.; Hillmyer, M. A.; Bates, F. S.;
Vigild, M. E.; Almdal, K. Macromolecules 1997, 30, 3788–3795.(7) Takenaka, M.; Wakada, T.; Akasaka, S.; Nishitsuji, S.; Saijo, K.;
Shimizu, H.; Kim, M. I.; Hasegawa, H. Macromolecules 2007, 40,4399–4402.(8) Hillmyer, M. A. J. Polym. Sci., Part B 2007, 45, 3249–3251.(9) Bendejacq, D.; Ponsinet, V.; Joanicot, M.; Loo, Y.-L.; Register,
R. A. Macromolecules 2002, 35, 6645–6649.(10) Lynd, N. A.; Hamilton, B. D.; Hillmyer, M. A. J. Polym. Sci., Part
B 2007, 45, 3386–3393; the two macrophase-separated samples areconsistent with L + C coexistence (private communication).(11) Lynd,N.A.;Hillmyer,M. A.Macromolecules2005, 38, 8803–8810.(12) Lynd,N.A.;Hillmyer,M. A.Macromolecules2007, 40, 8050–8055.(13) Listak, J.; Jakubowski, W.; Mueller, L.; Plichta, A.; Matyjaszewski,
K.; Bockstaller, M. R.Macromolecules 2008, 41, 5919–5927.(14) Ruzette, A.-V.; Tence-Girault, S.; Leibler, L.; Chauvin, F.;
Bertin, D.; Guerret, O.; Gerard, P.Macromolecules 2006, 39, 5804–5814.(15) Sides, S. W.; Fredrickson, G. H. J. Chem. Phys. 2004, 121,
4974–4986.(16) Cooke, D. M.; Shi, A.-C.Macromolecules 2006, 39, 6661–6671.(17) Matsen, M. W. Eur. Phys. J. E 2006, 21, 199–207.(18) Matsen, M. W. Phys. Rev. Lett. 2007, 99, 148304.(19) Semenov, A. E. Sov. Phys. JETP 1985, 61, 733–742.(20) Matsen, M. W.; Bates, F. S. J. Chem. Phys. 1997, 106,
2436–2448.(21) Matsushita, Y.; Noro, A.; Iinuma, M.; Suzuki, J.; Ohtani, H.;
Takano, A. Macromolecules 2003, 36, 8074–8077.(22) Noro, A.; Iinuma, M.; Suzuki, J.; Takano, A.; Matsushita, Y.
Macromolecules 2004, 37, 3804–3808.(23) Beardsley, T. M.; Matsen, M. W. Eur. Phys. J. E 2008, 27,
323–333.(24) Vassiliev, O. N.; Matsen, M. W. J. Chem. Phys. 2003, 118,
7700–7713.(25) Beardsley, T. M.; Matsen, M. W. Eur. Phys. J. E 2010, 32,
255–264.(26) Geyer, C. J.; Thompson, E. A. J. Am. Stat. Assoc. 1995, 90,
909–920.(27) Hukushima, K.; Nemoto, K. J. Phys. Soc. Jpn. 1996, 65,
1604–1608.(28) Earl, D. J.; Deem, M. W. Phys. Chem. Chem. Phys. 2005, 7,
3910–3916.(29) Lee, J. Y.; Kosterlitz, J. M. Phys. Rev. B 1991, 43, 3265–3277.(30) Lynd, N. A.; Hillmyer, M. A.; Matsen, M. W. Macromolecules
2008, 41, 4531–4533.(31) Schultz, G. V. Z. Phys. Chem. (Munich) 1939, B43, 25–46.(32) Zimm, B. H. J. Chem. Phys. 1948, 16, 1099–1116.(33) Martinez-Veracoechea, F.; Escobedo, F. A. Macromolecules
2005, 38, 8522–8531.(34) M€uller, M.; Binder, K. Macromolecules 1995, 28, 1825–1834.(35) Morse, D. E.; Chung, J. K. J. Chem. Phys. 2009, 130, 224901.
(36) Khandpur, A. K.; F€orster, S.; Bates, F. S.; Hamley, I. W.; Ryan,A. J.; Bras, W.; Almdal, K.; Mortensen, K. Macromolecules 1995, 28,8796–8806.
(37) Schultz, M. F.; Khandpur, A. K.; Bates, F. S.; Almdal, K.;Mortensen, K.; Hajduk, D. A.; Gruner, S. M. Macromolecules 1996, 29,2857–2867.
(38) Fredrickson, G. H.; Helfand, E. J. Chem. Phys. 1987, 87,697–705.
(39) Burger, C.; Ruland, W.; Semenov, A. N. Macromolecules 1990,23, 3339–3346. 1991, 24, 816.
(40) Grzywacz, P.; Qin, J.; Morse, D. C. Phys. Rev. E 2007, 76,061802.
(41) Morse, D. C.; Qin, J. A. J. Chem. Phys. 2011, 134, 084902.(42) Matsen, M. W.; Bates, F. S. Macromolecules 1997, 29,
7641–7644.(43) Matsen, M. W. J. Phys.: Condens. Matter 2002, 14, R21–R47.