Embed Size (px)
Citation preview

RDA/ml/ACT_SATbrief2004-06 9/12/2006
Research Brief Prepared by Michael Loughrey September 2006
________________________________________________
ACT & SAT District Report: A Three-Year Summary 2004-2006
About This Report For this research brief, data was taken from ACT and SAT reporting services which use the most recent test scores of seniors only. A technical report is available from RDA or the Community Relations Office.
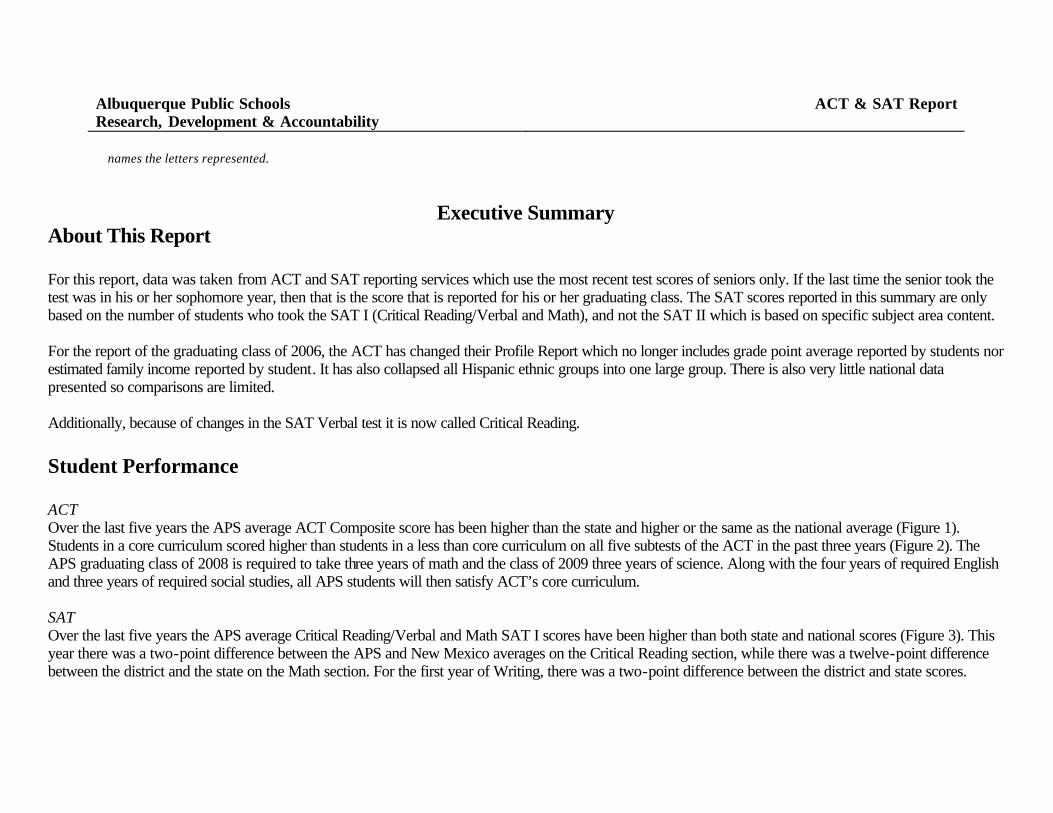
Student Performance ACT Over the last five years the APS average ACT Composite score has been higher than the state and higher than the national score except for the past two years when it was the same as the national. (Figure 1).
20.8
20.8
20.9
20.9
21.1
20
20.1
20
20.1
21.2
21.1
21.2
20.9
21.1
19.9
18 19 20 21 22 23
2001-02
2002-03
2003-04
2004-05
2005-06
Composite Scores
APSNMNation
RDA/ml/ACT_SATbrief2004-06 9/12/2006
20.1
20.1
20.9
19.5
19.4
22.4
22.1
22.9
22.3
22
0 5 10 15 20 25Compo
site
Scien
ce
Reading
Math
Englis
h
2005-06 Average Scores
Less than Core Core
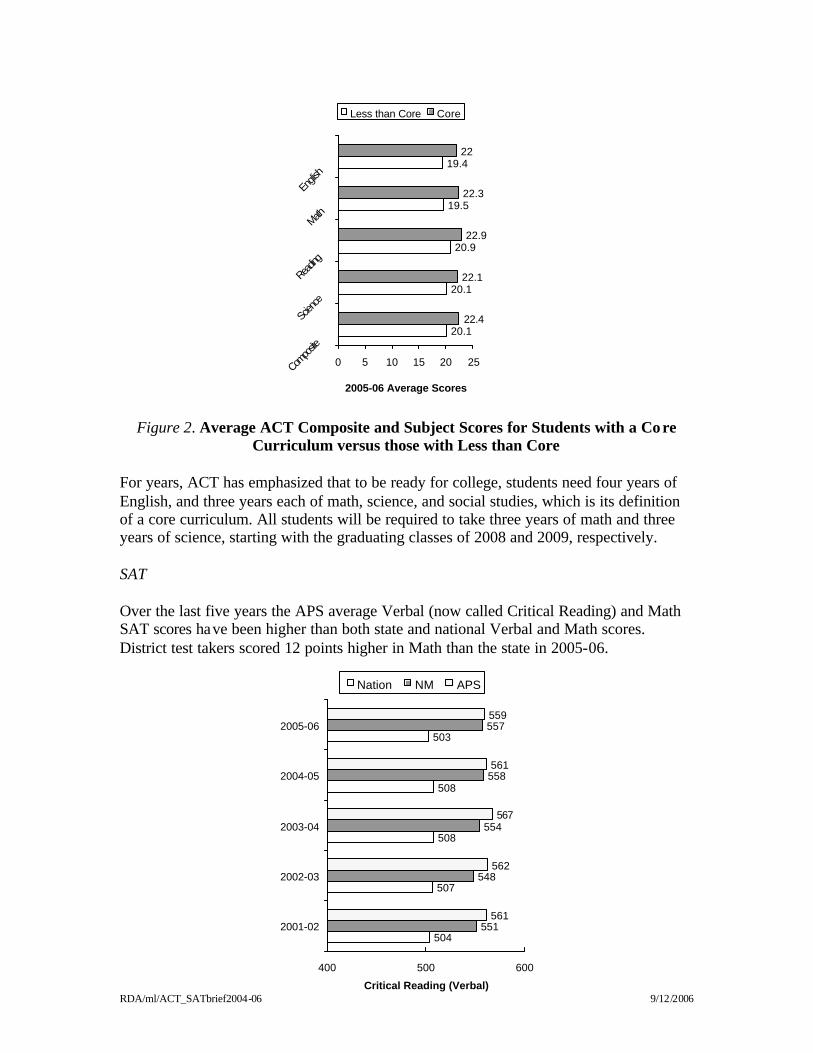
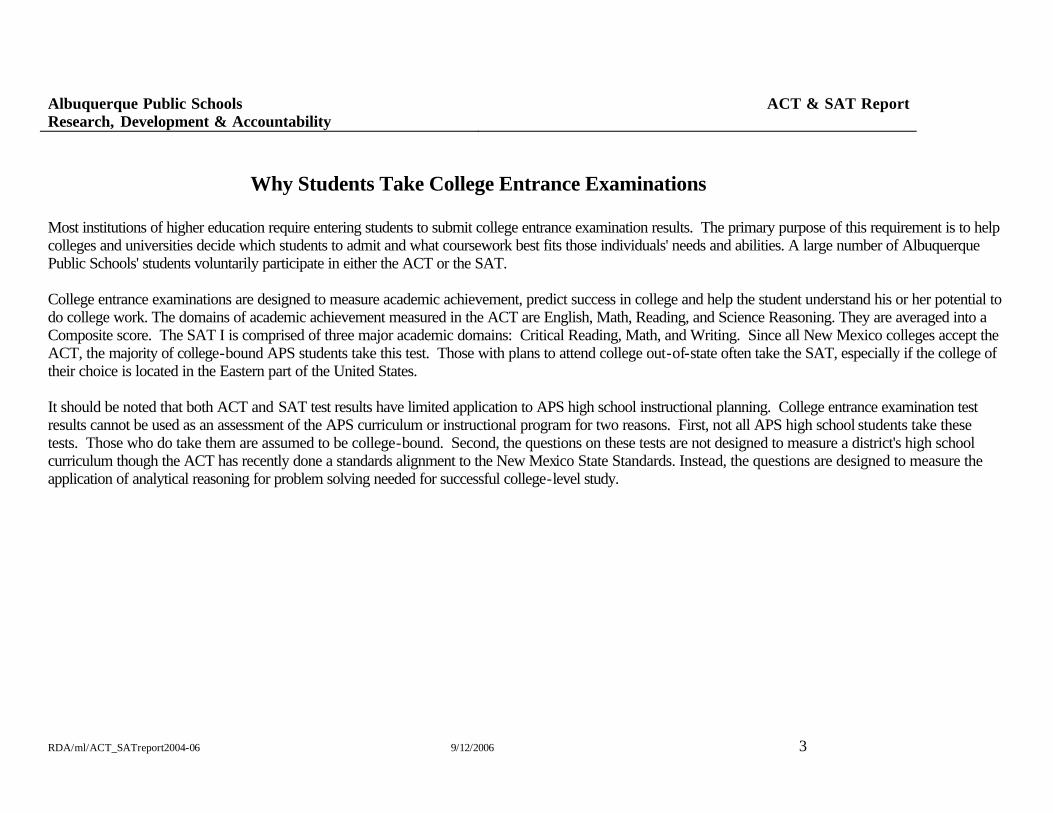
Figure 2. Average ACT Composite and Subject Scores for Students with a Core
Curriculum versus those with Less than Core
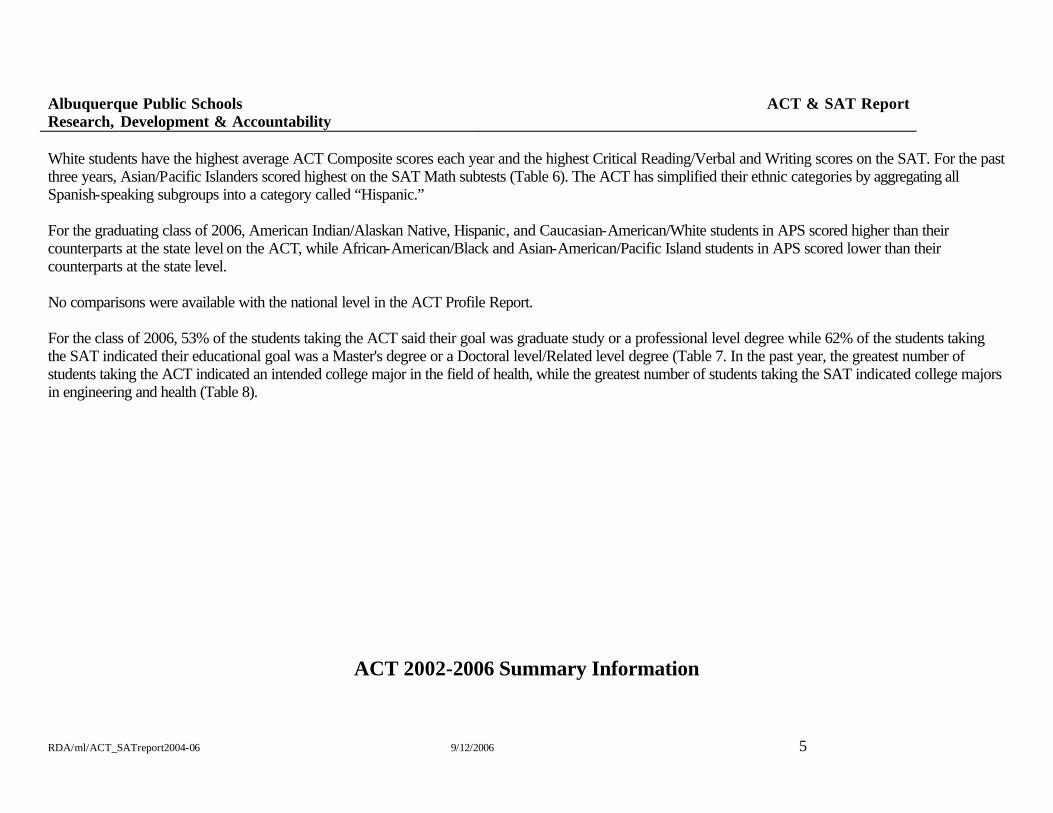
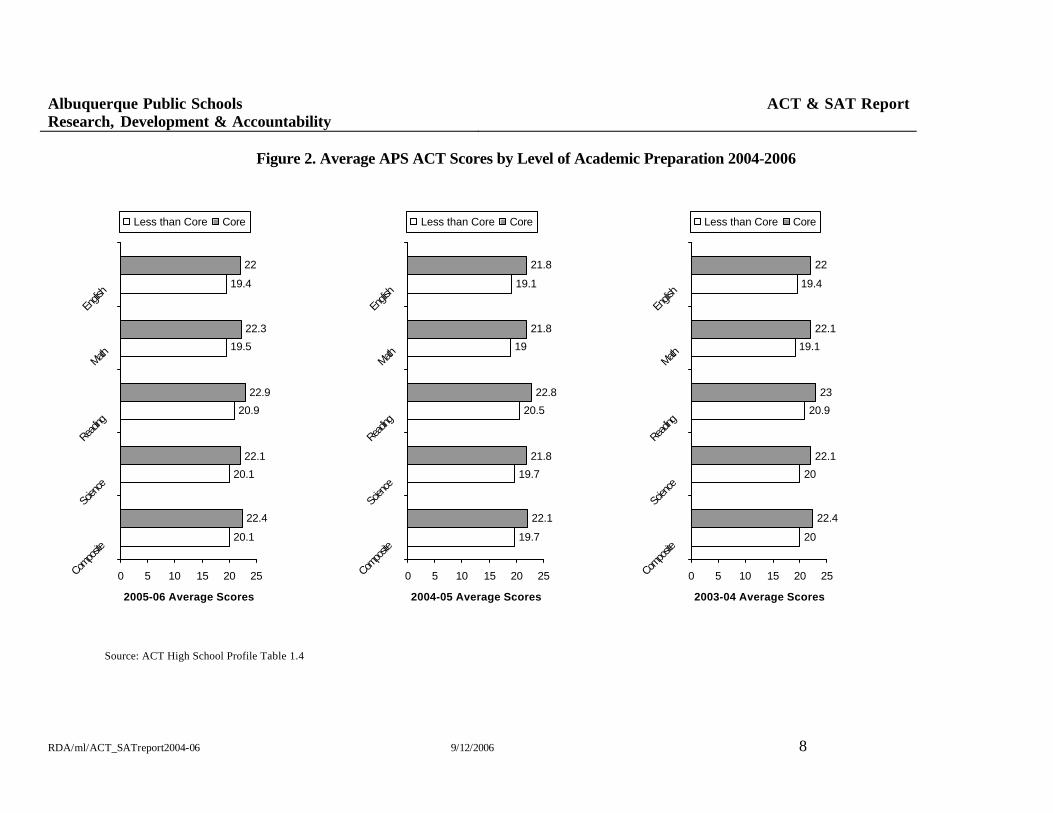
For years, ACT has emphasized that to be ready for college, students need four years of English, and three years each of math, science, and social studies, which is its definition of a core curriculum. All students will be required to take three years of math and three years of science, starting with the graduating classes of 2008 and 2009, respectively. SAT Over the last five years the APS average Verbal (now called Critical Reading) and Math SAT scores have been higher than both state and national Verbal and Math scores. District test takers scored 12 points higher in Math than the state in 2005-06.
504
507
508
508
503
551
548
554
558
557
561
562
567
561
559
400 500 600
2001-02
2002-03
2003-04
2004-05
2005-06
Critical Reading (Verbal)
Nation NM APS
RDA/ml/ACT_SATbrief2004-06 9/12/2006
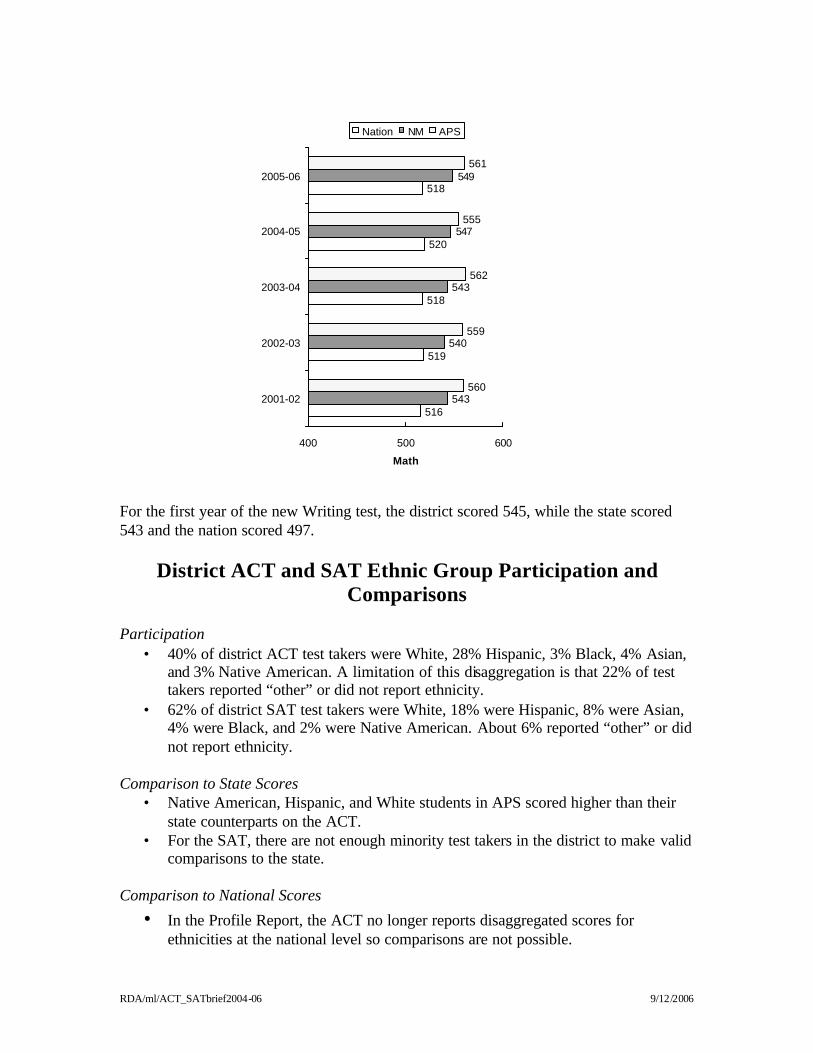
516
519
518
520
518
543
540
543
547
549
560
559
562
555
561
400 500 600
2001-02
2002-03
2003-04
2004-05
2005-06
Math
Nation NM APS
For the first year of the new Writing test, the district scored 545, while the state scored 543 and the nation scored 497.
District ACT and SAT Ethnic Group Participation and Comparisons
Participation
• 40% of district ACT test takers were White, 28% Hispanic, 3% Black, 4% Asian, and 3% Native American. A limitation of this disaggregation is that 22% of test takers reported “other” or did not report ethnicity.
• 62% of district SAT test takers were White, 18% were Hispanic, 8% were Asian, 4% were Black, and 2% were Native American. About 6% reported “other” or did not report ethnicity.
Comparison to State Scores
• Native American, Hispanic, and White students in APS scored higher than their state counterparts on the ACT.
• For the SAT, there are not enough minority test takers in the district to make valid comparisons to the state.
Comparison to National Scores
• In the Profile Report, the ACT no longer reports disaggregated scores for ethnicities at the national level so comparisons are not possible.
RDA/ml/ACT_SATbrief2004-06 9/12/2006
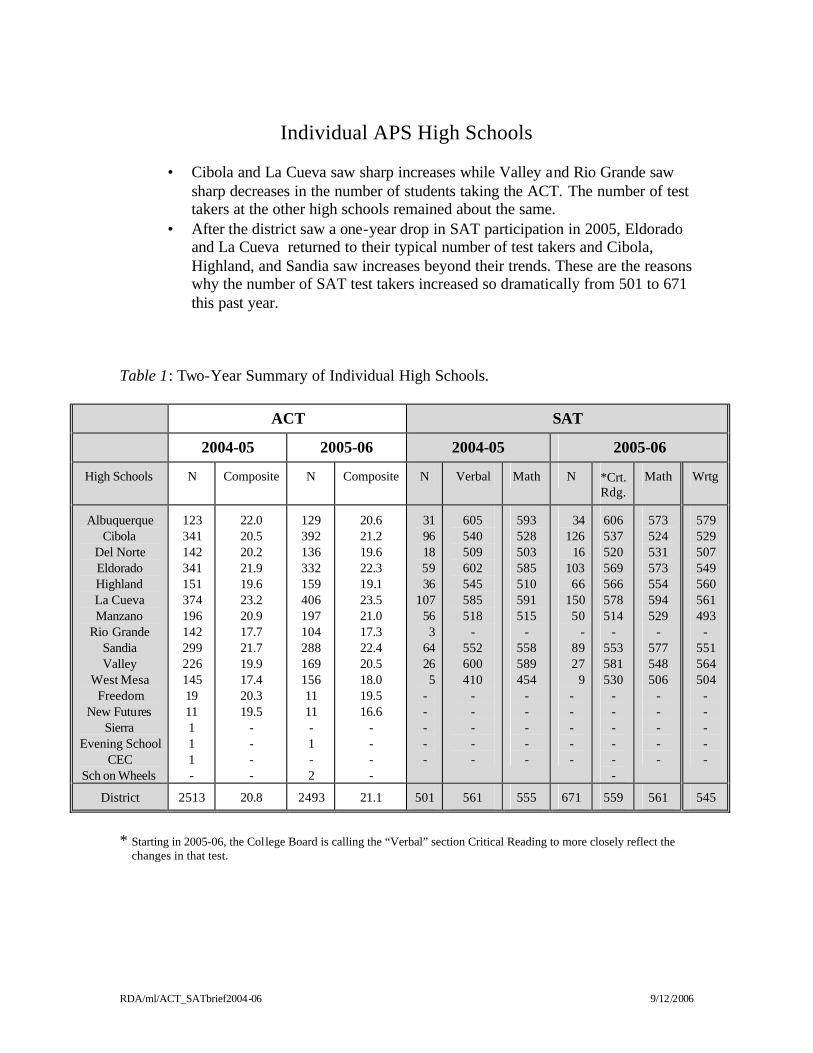
Individual APS High Schools
• Cibola and La Cueva saw sharp increases while Valley and Rio Grande saw
sharp decreases in the number of students taking the ACT. The number of test takers at the other high schools remained about the same.
• After the district saw a one-year drop in SAT participation in 2005, Eldorado and La Cueva returned to their typical number of test takers and Cibola, Highland, and Sandia saw increases beyond their trends. These are the reasons why the number of SAT test takers increased so dramatically from 501 to 671 this past year.
Table 1: Two-Year Summary of Individual High Schools. ACT SAT
2004-05 2005-06 2004-05 2005-06
High Schools N Composite N Composite N Verbal Math N *Crt. Rdg.
Math Wrtg
Albuquerque Cibola
Del Norte Eldorado Highland La Cueva Manzano
Rio Grande Sandia Valley
West Mesa Freedom
New Futures Sierra
Evening School CEC
Sch on Wheels
123 341 142 341 151 374 196 142 299 226 145 19 11 1 1 1 -
22.0 20.5 20.2 21.9 19.6 23.2 20.9 17.7 21.7 19.9 17.4 20.3 19.5
- - - -
129 392 136 332 159 406 197 104 288 169 156 11 11 - 1 - 2
20.6 21.2 19.6 22.3 19.1 23.5 21.0 17.3 22.4 20.5 18.0 19.5 16.6
- - - -
31 96 18
59 36
107 56 3 64 26 5 - - - - -
605 540 509 602 545 585 518
- 552 600 410
- - - - -
593 528 503 585 510 591 515
- 558 589 454
- - - - -
34 126 16 103 66 150 50
- 89 27 9 - - - - -
606 537 520 569 566 578 514
- 553 581530
- - - - - -
573 524 531 573 554 594 529
- 577 548 506
- - - - -
579 529 507 549 560 561 493
- 551 564 504
- - - - -
District 2513 20.8 2493 21.1 501 561 555 671 559 561 545
* Starting in 2005-06, the College Board is calling the “Verbal” section Critical Reading to more closely reflect the changes in that test.
ALBUQUERQUE PUBLIC SCHOOLS
DISTRICT REPORT
ACT & SAT
A Three Year Summary 2004-06
College Entrance Testing
Prepared by Michael Loughrey, Ph.D. September 2006
ALBUQUERQUE PUBLIC SCHOOLS
Albuquerque Public Schools Research, Development & Accountability
ACT & SAT Report
BOARD OF EDUCATION
PAULA MAES President
MIGUEL ACOSTA MARY LEE MARTIN Vice President Secretary
BERNA FACIO ROBERT LUCERO Policy Chair District Relations Chair
LEONARD J. DELAYO, JR GORDON ROWE Finance/Audit Chair Capital Outlay Chair
ELIZABETH EVERITT Superintendent
SUSIE PECK NELINDA VENEGAS Associate Superintendent Associate Superintendent
THOMAS SAVAGE Deputy Superintendent
RESEARCH, DEVELOPMENT AND ACCOUNTABILITY
930-A Oak Street SE Albuquerque, New Mexico 87106
(505) 848-8710 www.rda.aps.edu
Rose-Ann McKernan, Director
This annual summary of the district ACT/SAT results, as well as a briefer report, can be obtained at RDA or the APS Community Relations Department

Albuquerque Public Schools Research, Development & Accountability
ACT & SAT Report
Table of Contents Executive Summary...............................................................................................................................................................1 Why Students Take College Entrance Examinations……………………………………………………………………..3 A Profile of APS Students Taking College Entrance Exams....................................................................................................4 ACT* 2002-2006 Summary Information...............................................................................................................................6 Figure 1. Five-Year History of ACT Composite Scores for APS, New Mexico, and the Nation ..………………7 Figure 2. Average APS ACT Scores by Level of Academic Preparation ……………………………………….. 8 SAT* 2002-2006 Summary Information………………………………………………………………………………… 9 Figure 3. Five-year History of SAT Verbal and Math Scores for APS, New Mexico, and the Nation.......................10 Table 1. Number and Percent of Males and Females Tested................................................................................ 11 Table 2. Percent of Graduating Class Having Taken College Entrance Exams During High School......................... 11 Table 3. Grade Level at Time of Testing ...............................................................................................................12 Table 4. Student-Reported Grade Point Average..................................................................................................13 Table 5. Student-Estimated Family Income ...........................................................................................................14 Table 6. Ethnicity.................................................................................................................................................16 Table 7. Educational Goals...................................................................................................................................17 Table 8. Most Frequent College Major.................................................................................................................18 Individual APS High School Results Table 9. ACT and SAT Scores for APS High Schools.............................................................................................19 * The acronyms ACT and SAT are used to describe the two reports since several years ago both companies dropped the actual
Albuquerque Public Schools Research, Development & Accountability
ACT & SAT Report
names the letters represented.
Executive Summary About This Report For this report, data was taken from ACT and SAT reporting services which use the most recent test scores of seniors only. If the last time the senior took the test was in his or her sophomore year, then that is the score that is reported for his or her graduating class. The SAT scores reported in this summary are only based on the number of students who took the SAT I (Critical Reading/Verbal and Math), and not the SAT II which is based on specific subject area content. For the report of the graduating class of 2006, the ACT has changed their Profile Report which no longer includes grade point average reported by students nor estimated family income reported by student. It has also collapsed all Hispanic ethnic groups into one large group. There is also very little national data presented so comparisons are limited. Additionally, because of changes in the SAT Verbal test it is now called Critical Reading. Student Performance ACT Over the last five years the APS average ACT Composite score has been higher than the state and higher or the same as the national average (Figure 1). Students in a core curriculum scored higher than students in a less than core curriculum on all five subtests of the ACT in the past three years (Figure 2). The APS graduating class of 2008 is required to take three years of math and the class of 2009 three years of science. Along with the four years of required English and three years of required social studies, all APS students will then satisfy ACT’s core curriculum. SAT Over the last five years the APS average Critical Reading/Verbal and Math SAT I scores have been higher than both state and national scores (Figure 3). This year there was a two-point difference between the APS and New Mexico averages on the Critical Reading section, while there was a twelve-point difference between the district and the state on the Math section. For the first year of Writing, there was a two-point difference between the district and state scores.

Albuquerque Public Schools Research, Development & Accountability
ACT & SAT Report
RDA/ml/ACT_SATreport2004-06 9/12/2006 2
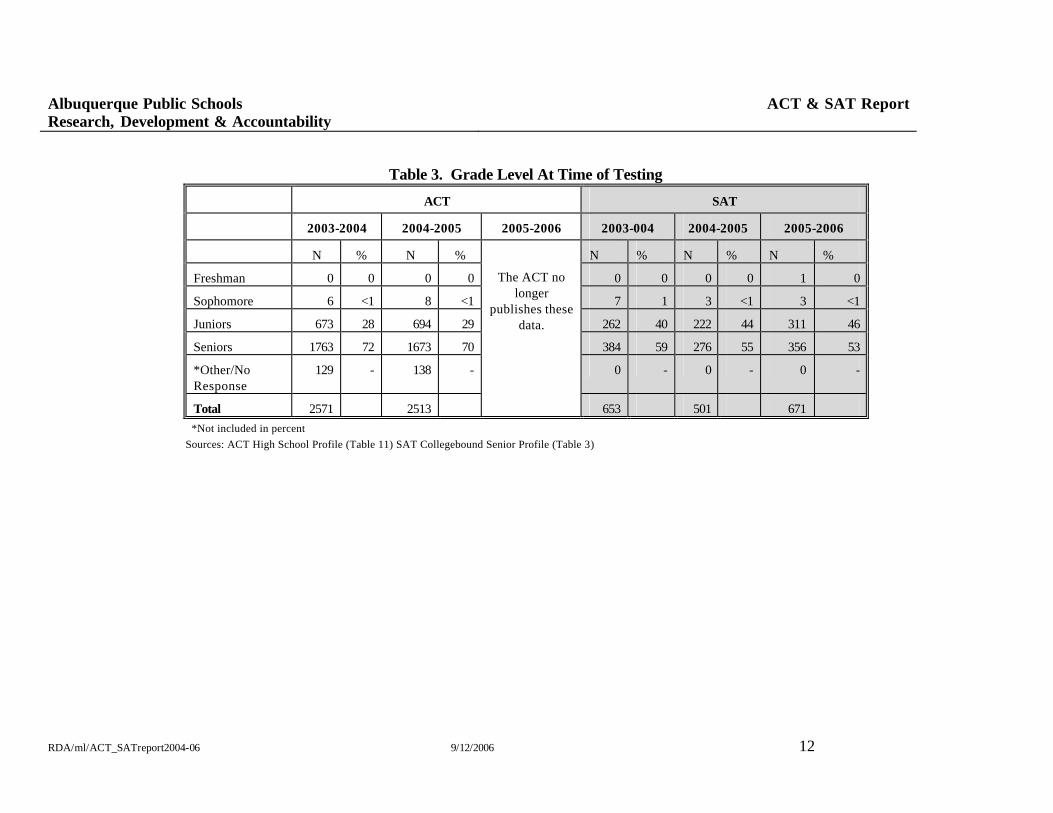
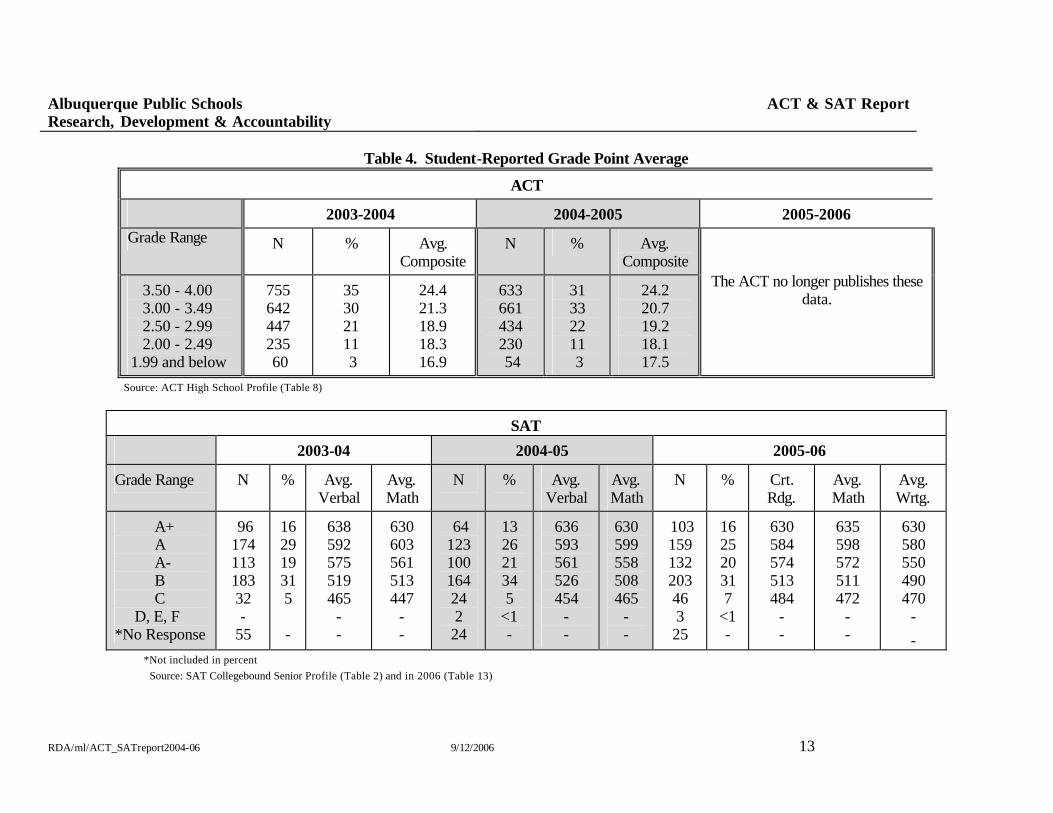
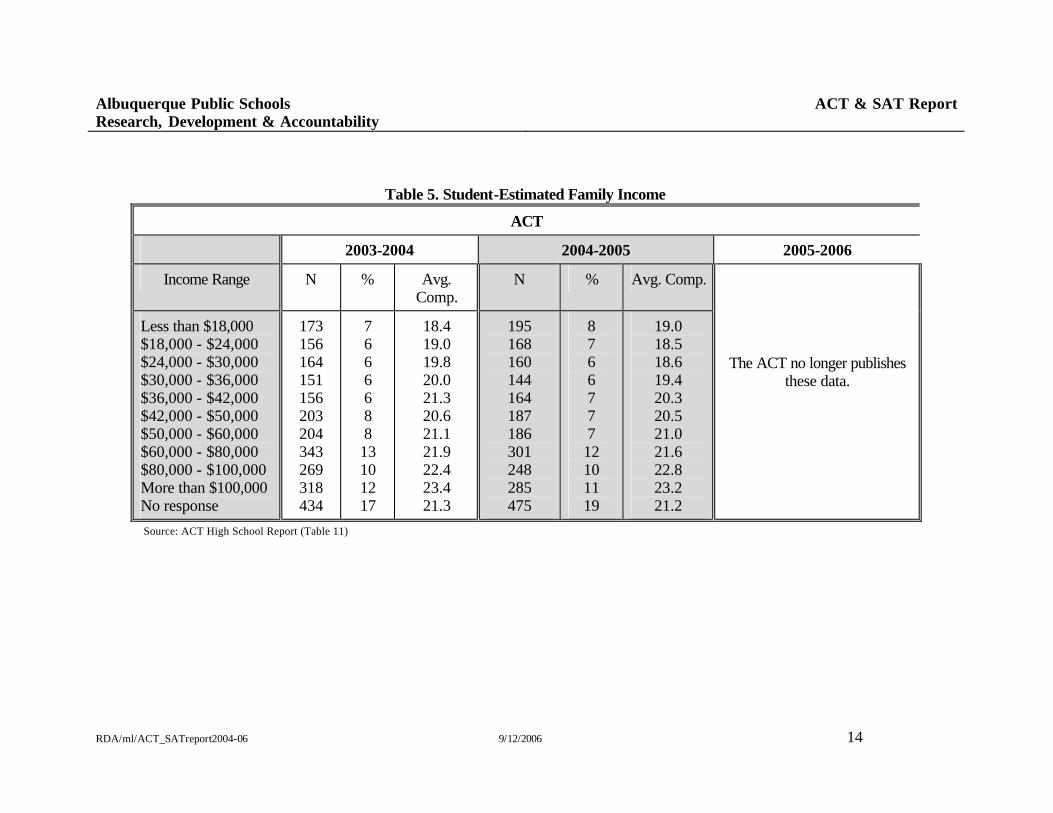
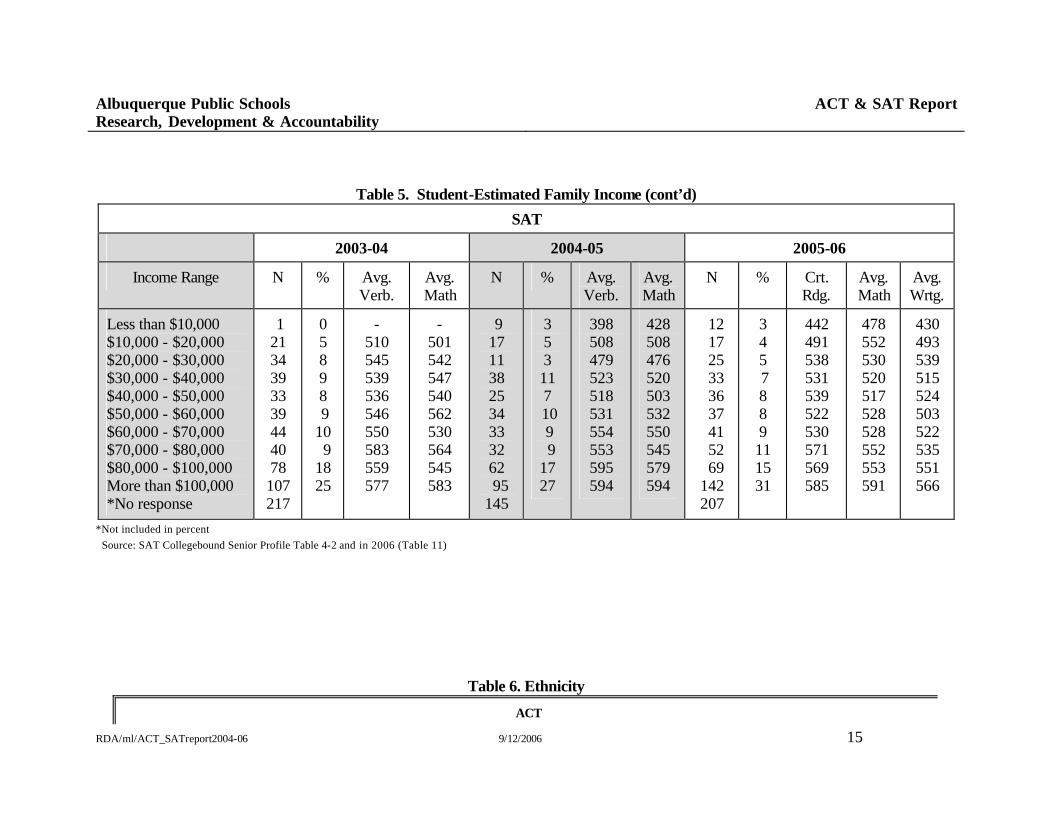
Student Demographic Profile Since 2000-01, APS girls have been 55-57% of the ACT test takers and 53-56% of the SAT test takers with a slightly greater percentage of boys taking the ACT and SAT in the past year (Table 1). The percent of APS seniors having taken the ACT at some point during high school has fluctuated between 54% and 60% in the past five years (Table 2). The percent of seniors having taken the SAT some time during their high school tenure has been between 11% and 15% (Table 2). About 70% of students who take the ACT, take it for the last time during their senior year, although the ACT did not report this data for the class of 2006. About 53% of students took the SAT for the first time in their senior year (Table 3). Over the past three years, the percent of graduating seniors who have taken the SAT for the last time in their junior year has increased each year to 46%. Some students who take their final ACT or SAT in their junior year do so to take advantage of the schools that offer early action acceptance. A greater percentage of students taking the SAT do so during their junior year because they are applying to out-of-state colleges. About three times as many APS students participated in the ACT (N = 2493) as in the SAT (N = 671) (Table 2) for the graduating class of 2006. For APS students, the higher the reported GPA, the higher the scores earned on the SAT (Table 4). As would be expected, SAT Critical Reading, Math, and Writing subtest scores tend to increase as income increases. ACT no longer reports either of these statistics. Students from lower income families are less represented in the number of students who take either of these tests (Table 5).
Albuquerque Public Schools Research, Development & Accountability
ACT & SAT Report
RDA/ml/ACT_SATreport2004-06 9/12/2006 3
Why Students Take College Entrance Examinations Most institutions of higher education require entering students to submit college entrance examination results. The primary purpose of this requirement is to help colleges and universities decide which students to admit and what coursework best fits those individuals' needs and abilities. A large number of Albuquerque Public Schools' students voluntarily participate in either the ACT or the SAT. College entrance examinations are designed to measure academic achievement, predict success in college and help the student understand his or her potential to do college work. The domains of academic achievement measured in the ACT are English, Math, Reading, and Science Reasoning. They are averaged into a Composite score. The SAT I is comprised of three major academic domains: Critical Reading, Math, and Writing. Since all New Mexico colleges accept the ACT, the majority of college-bound APS students take this test. Those with plans to attend college out-of-state often take the SAT, especially if the college of their choice is located in the Eastern part of the United States. It should be noted that both ACT and SAT test results have limited application to APS high school instructional planning. College entrance examination test results cannot be used as an assessment of the APS curriculum or instructional program for two reasons. First, not all APS high school students take these tests. Those who do take them are assumed to be college-bound. Second, the questions on these tests are not designed to measure a district's high school curriculum though the ACT has recently done a standards alignment to the New Mexico State Standards. Instead, the questions are designed to measure the application of analytical reasoning for problem solving needed for successful college-level study.

Albuquerque Public Schools Research, Development & Accountability
ACT & SAT Report
RDA/ml/ACT_SATreport2004-06 9/12/2006 4
A Profile of APS Students Taking College Entrance Exams Student Demographic Profile The 40-day senior enrollment in APS schools has fluctuated over the past five years between 4449 in 2001-02 and 4630 in 2005-06 (Table 2), with a high enrollment of 4649 in 2002-03. Fifty-four percent of APS seniors took the ACT last year, which is about 3% less than the senior population from the previous year. The percent of the senior class having taken the ACT has fluctuated between 54% and 60% over the past five years. The decrease may be due to students being counseled to take CNM’s free ACCUPLACER test instead of the ACT because they plan on enrolling at CNM for their first two years of college. The ACCUPLACER is free and only takes less than an hour to administer. For those students who reported gender on the ACT, 45% were male and 55% were female. This was an increase of 2% in the number of males from last year. For the SAT, three percent more males (47%) were among the participants this year than last year. After a drop in SAT participation for the class of 2005 (N = 501), the slowly increasing trend of SAT participation was evident this year with an all-time high of 671 seniors from the graduating class of 2006 taking the test. Fourteen percent of the 2006 graduating class took the SAT, which was almost 3% more than two years previous (Table 2). The ACT no longer reports what grade in school students from the graduating class took the ACT for the last time. Essentially, close to half (46%) of the seniors who took the SAT did so for the last time in their junior year. This probably indicates that students who take the SAT are deciding on their college plans, i.e., going out-of-state to attend college, earlier than those who take the ACT. As would be expected, the higher the student-reported grade point average (GPA), the higher the score earned on the SAT Critical Reading, Math, and Writing subtests (Table 4). For this past year 92% percent of SAT test takers reported an A or B average. The ACT no longer reports statistics on student-reported grade point average. For the most part, SAT Critical Reading, Math, and Writing subtest scores increase as family income increases (Table 5). This result is consistent with other research establishing the relationship between socioeconomic status (SES) and student achievement. When the percent of students at each income category is inspected, a disproportionately lower percentage of test-takers are from the lowest income categories. A vigorous program to encourage students from families with lower incomes to keep more post-secondary options open by taking college entrance examinations and college prep courses would increase the number of low income test takers. ACT no longer reports student estimated family income. Even though disaggregating scores by ethnicity is tempered by the fact that 22% of APS students taking the ACT do not mark their ethnicity or respond “other,”
Albuquerque Public Schools Research, Development & Accountability
ACT & SAT Report
RDA/ml/ACT_SATreport2004-06 9/12/2006 5
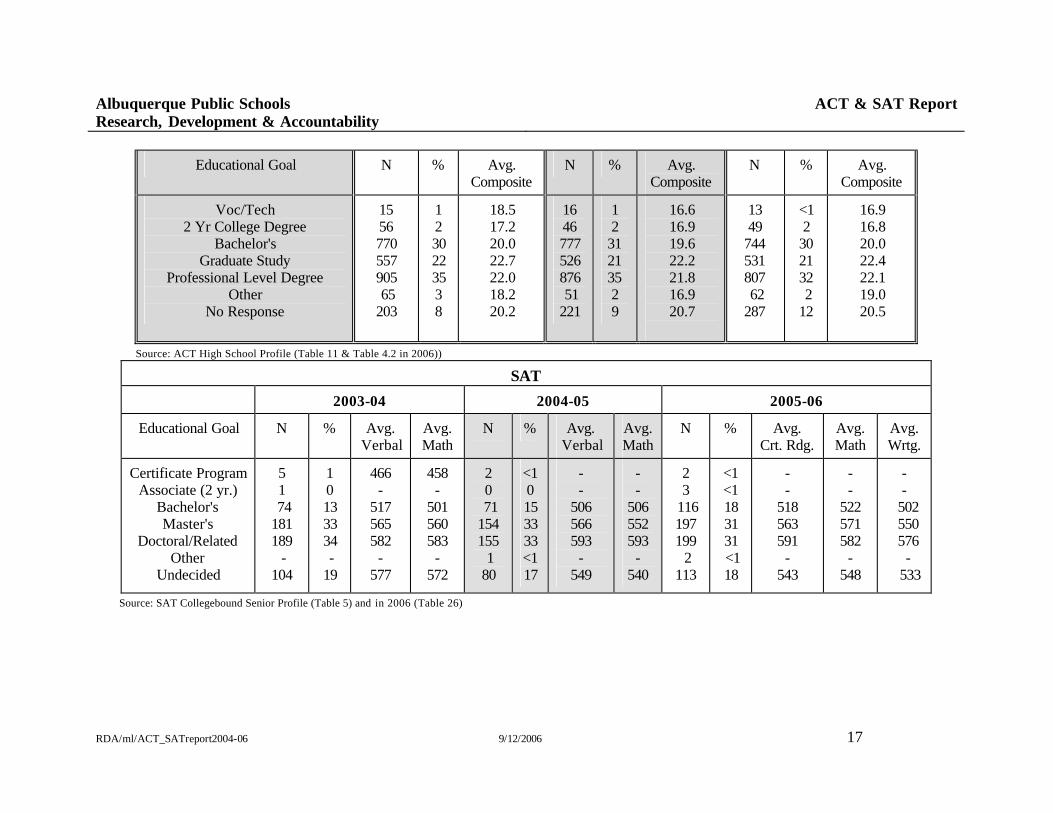
White students have the highest average ACT Composite scores each year and the highest Critical Reading/Verbal and Writing scores on the SAT. For the past three years, Asian/Pacific Islanders scored highest on the SAT Math subtests (Table 6). The ACT has simplified their ethnic categories by aggregating all Spanish-speaking subgroups into a category called “Hispanic.” For the graduating class of 2006, American Indian/Alaskan Native, Hispanic, and Caucasian-American/White students in APS scored higher than their counterparts at the state level on the ACT, while African-American/Black and Asian-American/Pacific Island students in APS scored lower than their counterparts at the state level. No comparisons were available with the national level in the ACT Profile Report. For the class of 2006, 53% of the students taking the ACT said their goal was graduate study or a professional level degree while 62% of the students taking the SAT indicated their educational goal was a Master's degree or a Doctoral level/Related level degree (Table 7. In the past year, the greatest number of students taking the ACT indicated an intended college major in the field of health, while the greatest number of students taking the SAT indicated college majors in engineering and health (Table 8).
ACT 2002-2006 Summary Information

Albuquerque Public Schools Research, Development & Accountability
ACT & SAT Report
RDA/ml/ACT_SATreport2004-06 9/12/2006 6
The ACT Assessment First administered in APS in 1989, the Enhanced ACT is a test designed to reflect current skills and knowledge students need for success in college. Scores for the four subtests of the Enhanced ACT: English, Math, Reading, and Science Reasoning are reported on a scale of 1 to 36. Writing has been added as an optional test since some colleges have started asking for a writing test. Since the 2001-02 school year, APS's average Composite score has been higher than the state average and higher or equal to the national average (Figure 1). This trend of higher scores that the state has existed for all four subtests (Reading, Math, English, and Science Reasoning) over the past five years. Compared to the national level for the past five years, APS subtest scores have been higher than or equaled the national scores. The scores for students who have taken a core curriculum and those who have not are compared in the ACT report. Those students in the core curriculum always score higher on the four subtests (Figure 2).
Albuquerque Public Schools Research, Development & Accountability
ACT & SAT Report
RDA/ml/ACT_SATreport2004-06 9/12/2006 7
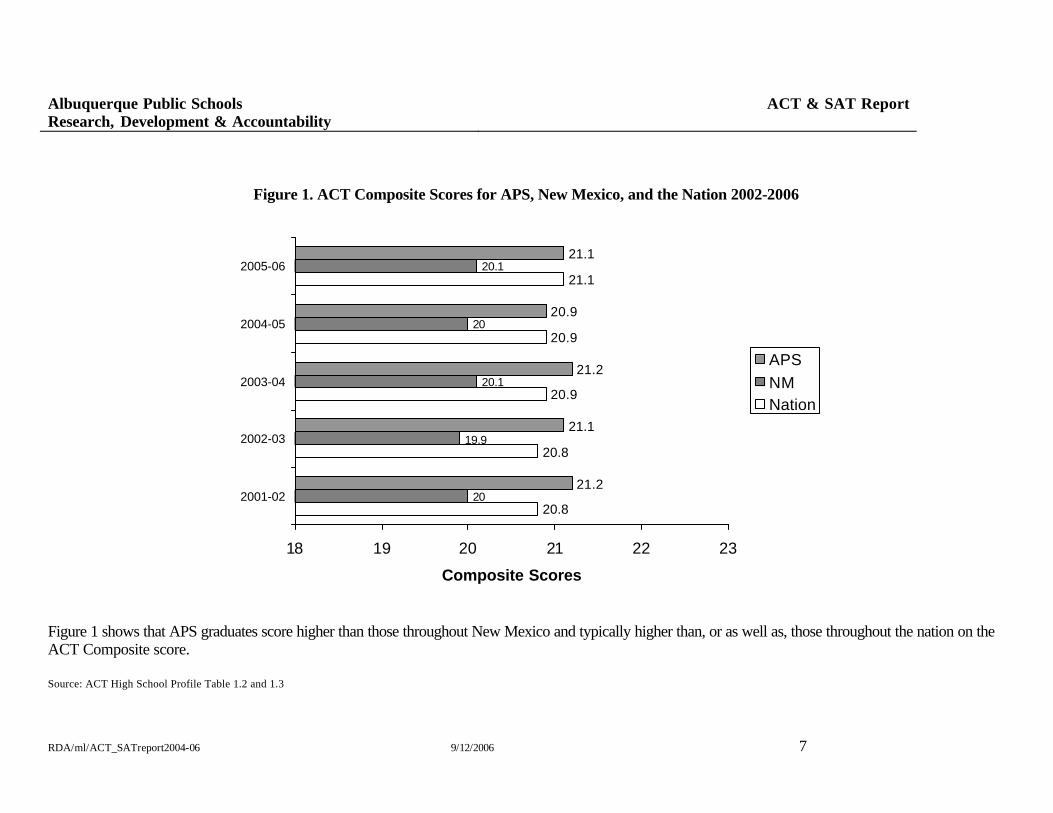
Figure 1. ACT Composite Scores for APS, New Mexico, and the Nation 2002-2006
20.8
20.8
20.9
20.9
21.1
20
20.1
20
20.1
21.2
21.1
21.2
20.9
21.1
19.9
18 19 20 21 22 23
2001-02
2002-03
2003-04
2004-05
2005-06
Composite Scores
APSNMNation
Figure 1 shows that APS graduates score higher than those throughout New Mexico and typically higher than, or as well as, those throughout the nation on the ACT Composite score. Source: ACT High School Profile Table 1.2 and 1.3
Albuquerque Public Schools Research, Development & Accountability
ACT & SAT Report
RDA/ml/ACT_SATreport2004-06 9/12/2006 8
Figure 2. Average APS ACT Scores by Level of Academic Preparation 2004-2006
20.1
20.1
20.9
19.5
19.4
22.4
22.1
22.9
22.3
22
0 5 10 15 20 25Compo
site
Scien
ce
Reading
Math
Englis
h
2005-06 Average Scores
Less than Core Core
19.7
19.7
20.5
19
19.1
22.1
21.8
22.8
21.8
21.8
0 5 10 15 20 25Compo
site
Scien
ce
Reading
Math
Englis
h
2004-05 Average Scores
Less than Core Core
20
20
20.9
19.1
19.4
22.4
22.1
23
22.1
22
0 5 10 15 20 25Compo
site
Scien
ce
Reading
Math
Englis
h
2003-04 Average Scores
Less than Core Core
Source: ACT High School Profile Table 1.4
Albuquerque Public Schools Research, Development & Accountability
ACT & SAT Report
RDA/ml/ACT_SATreport2004-06 9/12/2006 9
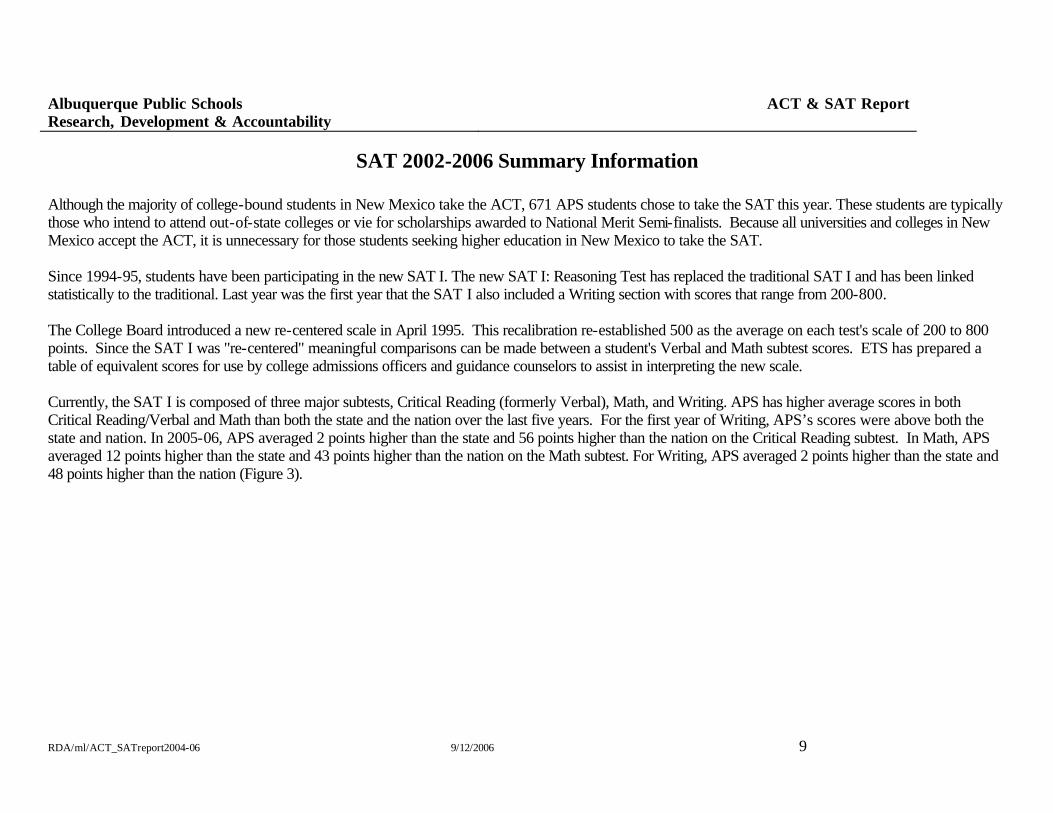
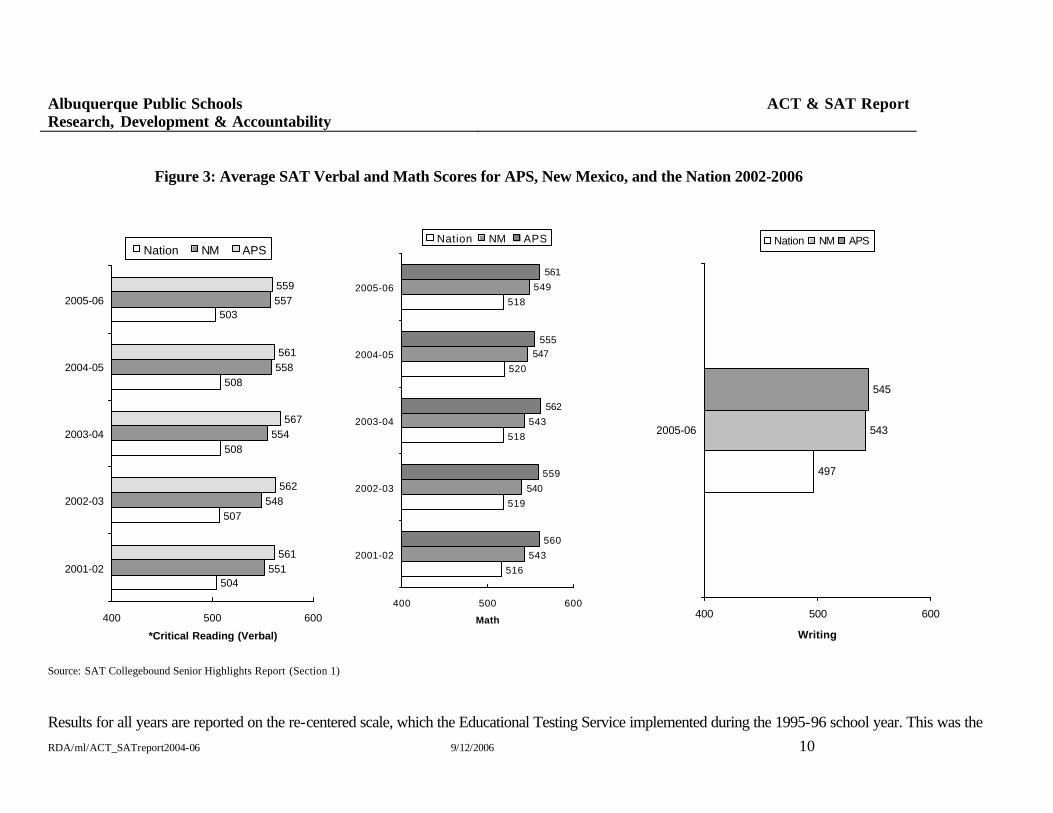
SAT 2002-2006 Summary Information Although the majority of college-bound students in New Mexico take the ACT, 671 APS students chose to take the SAT this year. These students are typically those who intend to attend out-of-state colleges or vie for scholarships awarded to National Merit Semi-finalists. Because all universities and colleges in New Mexico accept the ACT, it is unnecessary for those students seeking higher education in New Mexico to take the SAT. Since 1994-95, students have been participating in the new SAT I. The new SAT I: Reasoning Test has replaced the traditional SAT I and has been linked statistically to the traditional. Last year was the first year that the SAT I also included a Writing section with scores that range from 200-800. The College Board introduced a new re-centered scale in April 1995. This recalibration re-established 500 as the average on each test's scale of 200 to 800 points. Since the SAT I was "re-centered" meaningful comparisons can be made between a student's Verbal and Math subtest scores. ETS has prepared a table of equivalent scores for use by college admissions officers and guidance counselors to assist in interpreting the new scale. Currently, the SAT I is composed of three major subtests, Critical Reading (formerly Verbal), Math, and Writing. APS has higher average scores in both Critical Reading/Verbal and Math than both the state and the nation over the last five years. For the first year of Writing, APS’s scores were above both the state and nation. In 2005-06, APS averaged 2 points higher than the state and 56 points higher than the nation on the Critical Reading subtest. In Math, APS averaged 12 points higher than the state and 43 points higher than the nation on the Math subtest. For Writing, APS averaged 2 points higher than the state and 48 points higher than the nation (Figure 3).
Albuquerque Public Schools Research, Development & Accountability
ACT & SAT Report
RDA/ml/ACT_SATreport2004-06 9/12/2006 10
Figure 3: Average SAT Verbal and Math Scores for APS, New Mexico, and the Nation 2002-2006
504
507
508
508
503
551
548
554
558
557
561
562
567
561
559
400 500 600
2001-02
2002-03
2003-04
2004-05
2005-06
*Critical Reading (Verbal)
Nation NM APS
516
519
518
520
518
543
540
543
547
549
560
559
562
555
561
400 500 600
2001-02
2002-03
2003-04
2004-05
2005-06
Math
Nation NM APS
497
543
545
400 500 600
2005-06
Writing
Nation NM APS
Source: SAT Collegebound Senior Highlights Report (Section 1) Results for all years are reported on the re-centered scale, which the Educational Testing Service implemented during the 1995-96 school year. This was the
Albuquerque Public Schools Research, Development & Accountability
ACT & SAT Report
RDA/ml/ACT_SATreport2004-06 9/12/2006 11
second time ETS re-centered scores, which was done, as it was the first time in 1941, to reflect the more diverse group that the re-norming was based on. Re-norming has established 500 as the mean in both Critical Reading/Verbal and Math sections and, additionally, has aligned the scores in both areas so that they are comparable to each other. The new Writing section has also established 500 as the mean.
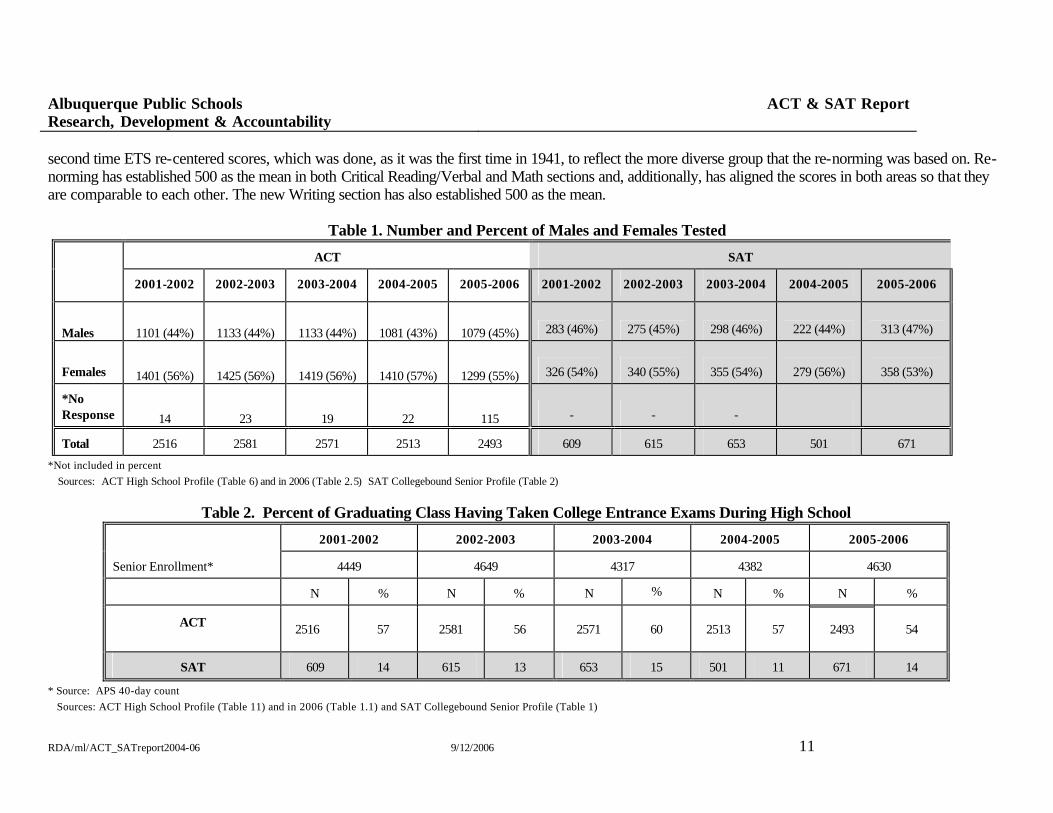
Table 1. Number and Percent of Males and Females Tested
ACT SAT
2001-2002 2002-2003 2003-2004 2004-2005 2005-2006 2001-2002 2002-2003 2003-2004 2004-2005 2005-2006
Males 1101 (44%)
1133 (44%) 1133 (44%) 1081 (43%) 1079 (45%) 283 (46%) 275 (45%) 298 (46%) 222 (44%) 313 (47%)
Females 1401 (56%)
1425 (56%) 1419 (56%) 1410 (57%) 1299 (55%) 326 (54%) 340 (55%) 355 (54%) 279 (56%) 358 (53%)
*No Response 14 23 19 22 115 - - -
Total 2516 2581 2571 2513 2493 609 615 653 501 671
*Not included in percent Sources: ACT High School Profile (Table 6) and in 2006 (Table 2.5) SAT Collegebound Senior Profile (Table 2)
Table 2. Percent of Graduating Class Having Taken College Entrance Exams During High School
2001-2002 2002-2003 2003-2004 2004-2005 2005-2006 Senior Enrollment* 4449 4649 4317 4382 4630
N % N % N % N % N %
ACT 2516 57 2581 56 2571 60 2513 57 2493 54
SAT 609 14 615 13 653 15 501 11 671 14
* Source: APS 40-day count Sources: ACT High School Profile (Table 11) and in 2006 (Table 1.1) and SAT Collegebound Senior Profile (Table 1)
Albuquerque Public Schools Research, Development & Accountability
ACT & SAT Report
RDA/ml/ACT_SATreport2004-06 9/12/2006 12
Table 3. Grade Level At Time of Testing
ACT SAT
2003-2004 2004-2005 2005-2006 2003-004 2004-2005 2005-2006
N % N % N % N % N %
Freshman 0 0 0 0 0 0 0 0 1 0
Sophomore 6 <1 8 <1 7 1 3 <1 3 <1
Juniors 673 28 694 29 262 40 222 44 311 46
Seniors 1763 72 1673 70 384 59 276 55 356 53
*Other/No Response
129 - 138 - 0 - 0 - 0 -
Total 2571 2513
The ACT no longer
publishes these data.
653 501 671 *Not included in percent Sources: ACT High School Profile (Table 11) SAT Collegebound Senior Profile (Table 3)
Albuquerque Public Schools Research, Development & Accountability
ACT & SAT Report
RDA/ml/ACT_SATreport2004-06 9/12/2006 13
Table 4. Student-Reported Grade Point Average
ACT
2003-2004 2004-2005 2005-2006 Grade Range N % Avg.
Composite N % Avg.
Composite
3.50 - 4.00 3.00 - 3.49 2.50 - 2.99 2.00 - 2.49 1.99 and below
755 642 447 235 60
35 30 21 11 3
24.4 21.3 18.9 18.3 16.9
633 661 434 230 54
31 33 22 11 3
24.2 20.7 19.2 18.1 17.5
The ACT no longer publishes these data.
Source: ACT High School Profile (Table 8)
SAT
2003-04 2004-05 2005-06
Grade Range N % Avg. Verbal
Avg. Math
N % Avg. Verbal
Avg. Math
N % Crt. Rdg.
Avg. Math
Avg. Wrtg.
A+ A A- B C D, E, F *No Response
96 174 113 183 32 -
55
16 29 19 31 5 -
638 592 575 519 465
- -
630 603 561 513 447
- -
64 123 100 164 24 2 24
13 26 21 34 5
<1 -
636 593 561 526 454
- -
630 599 558 508 465
- -
103 159 132 203 46 3 25
16 25 20 31 7
<1 -
630 584 574 513 484
- -
635 598 572 511 472
- -
630 580 550 490 470
- -
*Not included in percent Source: SAT Collegebound Senior Profile (Table 2) and in 2006 (Table 13)
Albuquerque Public Schools Research, Development & Accountability
ACT & SAT Report
RDA/ml/ACT_SATreport2004-06 9/12/2006 14
Table 5. Student-Estimated Family Income
ACT
2003-2004 2004-2005 2005-2006
Income Range N % Avg. Comp.
N % Avg. Comp.
Less than $18,000 $18,000 - $24,000 $24,000 - $30,000 $30,000 - $36,000 $36,000 - $42,000 $42,000 - $50,000 $50,000 - $60,000 $60,000 - $80,000 $80,000 - $100,000 More than $100,000 No response
173 156 164 151 156 203 204 343 269 318 434
7 6 6 6 6 8 8 13 10 12 17
18.4 19.0 19.8 20.0 21.3 20.6 21.1 21.9 22.4 23.4 21.3
195 168 160 144 164 187 186 301 248 285 475
8 7 6 6 7 7 7 12 10 11 19
19.0 18.5 18.6 19.4 20.3 20.5 21.0 21.6 22.8 23.2 21.2
The ACT no longer publishes these data.
Source: ACT High School Report (Table 11)
Albuquerque Public Schools Research, Development & Accountability
ACT & SAT Report
RDA/ml/ACT_SATreport2004-06 9/12/2006 15
Table 5. Student-Estimated Family Income (cont’d)
SAT
2003-04 2004-05 2005-06
Income Range N % Avg. Verb.
Avg. Math
N % Avg. Verb.
Avg. Math
N % Crt. Rdg.
Avg. Math
Avg.Wrtg.
Less than $10,000 $10,000 - $20,000 $20,000 - $30,000 $30,000 - $40,000 $40,000 - $50,000 $50,000 - $60,000 $60,000 - $70,000 $70,000 - $80,000 $80,000 - $100,000 More than $100,000 *No response
1 21 34 39 33 39 44 40 78 107 217
0 5 8 9 8 9 10 9 18 25
- 510 545 539 536 546 550 583 559 577
- 501 542 547 540 562 530 564 545 583
9 17 11 38 25 34 33 32 62 95 145
3 5 3 11 7
10 9 9 17 27
398 508 479 523 518 531 554 553 595 594
428 508 476 520 503 532 550 545 579 594
12 17 25 33 36 37 41 52 69 142 207
3 4 5 7 8 8 9 11 15 31
442 491 538 531 539 522 530 571 569 585
478 552 530 520 517 528 528 552 553 591
430 493 539 515 524 503 522 535 551 566
*Not included in percent Source: SAT Collegebound Senior Profile Table 4-2 and in 2006 (Table 11)
Table 6. Ethnicity
ACT

Albuquerque Public Schools Research, Development & Accountability
ACT & SAT Report
RDA/ml/ACT_SATreport2004-06 9/12/2006 16
2003-2004 2004-2005 2005-2006
Ethnic Group N % Avg. Composite
N % Avg. Composite
N % Avg. Composite
Amer/Alaskan Native Asian/Pacific Amer Black/African-Amer Hispanic Caucasian Amer/White Other/No Response
73 80 79
723 1113 503
3 3 3 28 43 20
18.6 21.8 18.6 19.2 22.8 21.3
65 90 61
753 1038 506
3 4 2 30 41 20
18.2 20.9 17.3 19.2 22.3 21.3
63 108 71
705 1009 537
3 4 3 28 40 22
18.2 21.0 18.3 19.3 22.8 21.3
Source: ACT High School Profile (Table 11) and in 2006 (Table 1.5) and SAT Collegebound Senior Profile (Table 4-1) and in 2006 (Table 8)
SAT
2003-04 2004-05 2005-06
Ethnic Group N % Avg. Verbal
Avg. Math
N % Avg. Verbal
Avg. Math
N % Avg. Crt. Rdg
Avg. Math
Avg. Wrtg
Amer Indian/Alaskan Nat Asian/Asian Am/Pacif. Isander Black/African American Mexican/Mexican American Puerto Rican Hispanic/Latino White Other No Response
8 39 18 44 2 33
355 46
108
1 7 3 8
<1 6 65
8 -
481 560 508 530
- 498 573 602 587
501 580 490 524
- 508 571 568 572
6 32 17 40 4 35
281 33
53
1 7 4 9 1 8 63
7 -
452 540 438 525
- 569 579 520 592
483 584 424 525
- 547 570 515 569
10 51 22 51 3 57
380 34
63
2 8 4 8
<1 9 62
6 -
476 531 526 548
- 517 571 575 580
488 579 503 562
- 509 570 543 581
442 527 523 532
- 506 555 551 569
Table 7. Educational Goals
ACT
2003-2004 2004-2005 2005-2006
Albuquerque Public Schools Research, Development & Accountability
ACT & SAT Report
RDA/ml/ACT_SATreport2004-06 9/12/2006 17
Educational Goal N % Avg. Composite
N % Avg. Composite
N % Avg. Composite
Voc/Tech 2 Yr College Degree
Bachelor's Graduate Study
Professional Level Degree Other
No Response
15 56 770 557 905 65 203
1 2 30 22 35 3 8
18.5 17.2 20.0 22.7 22.0 18.2 20.2
16 46 777 526 876 51 221
1 2
31 21 35 2 9
16.6 16.9 19.6 22.2 21.8 16.9 20.7
13 49
744 531 807 62 287
<1 2
30 21 32 2 12
16.9 16.8 20.0 22.4 22.1 19.0 20.5
Source: ACT High School Profile (Table 11 & Table 4.2 in 2006))
SAT 2003-04 2004-05 2005-06
Educational Goal N % Avg. Verbal
Avg. Math
N % Avg. Verbal
Avg. Math
N % Avg. Crt. Rdg.
Avg. Math
Avg. Wrtg.
Certificate Program Associate (2 yr.)
Bachelor's Master's
Doctoral/Related Other
Undecided
5 1
74 181 189 -
104
1 0 13 33 34 - 19
466 -
517 565 582
- 577
458 -
501 560 583
- 572
2 0
71 154 155 1 80
<1 0 15 33 33 <117
- -
506 566 593
- 549
- -
506 552 593
- 540
2 3
116 197 199 2
113
<1 <1 18 31 31 <1 18
- -
518 563 591
- 543
- -
522 571 582
- 548
- -
502 550 576
- 533
Source: SAT Collegebound Senior Profile (Table 5) and in 2006 (Table 26)

Albuquerque Public Schools Research, Development & Accountability
ACT & SAT Report
RDA/ml/ACT_SATreport2004-06 9/12/2006 18
Table 8. Most Frequent College Major
ACT
2003-2004 2004-2005 2005-2006
Major
N
Avg. Composite
N Avg. Composite
N Avg. Composite
Health Business
Social Sciences Engineering
Art Sciences Education
412 201 179 127 174 165 95
20.7 19.9 21.6 23.0 20.5 23.7 20.6
386 228 168 123 138 136 58
20.4 20.3 21.1 22.7 21.1 23.3 20.9
360 177 132 98 144 123 50
20.6 20.4 21.6 22.0 21.1 23.9 21.0
Sources: ACT High School Profile (Table 10) and in 2006 (Table 4.1) and SAT Collegebound Senior Profile (Table 5) and in 2006 (Table 26)
SAT 2003-04 2004-05 2005-06
Major N Avg. Verbal
Avg. Math
N Avg. Verbal
Avg. Math
N Avg. Crt.Rdg
Avg. Math
Avg. Wrtg
Health Engineering
Social Sciences Arts
Biological Sciences Business Education
Physical Sciences Computer/
Info. Sciences
76 80 49 33 56 40 19 18
15
543 565 551 561 601 534 552 667
581
549 602 516 524 590 540 543 661
575
59 66 39 33 37 34 17 14
17
513 599 585 537 612 525 548 613
577
523 621 538 505 618 518 525 626
585
69 72 55 56 53 51 18 23
15
546 558 579 554 569 514 532 595
595
546 596 549 544 578 531 561 628
606
529 543 567 554 559 497 539 583
550
Albuquerque Public Schools Research, Development & Accountability
ACT & SAT Report
RDA/ml/ACT_SATreport2004-06 9/12/2006 19
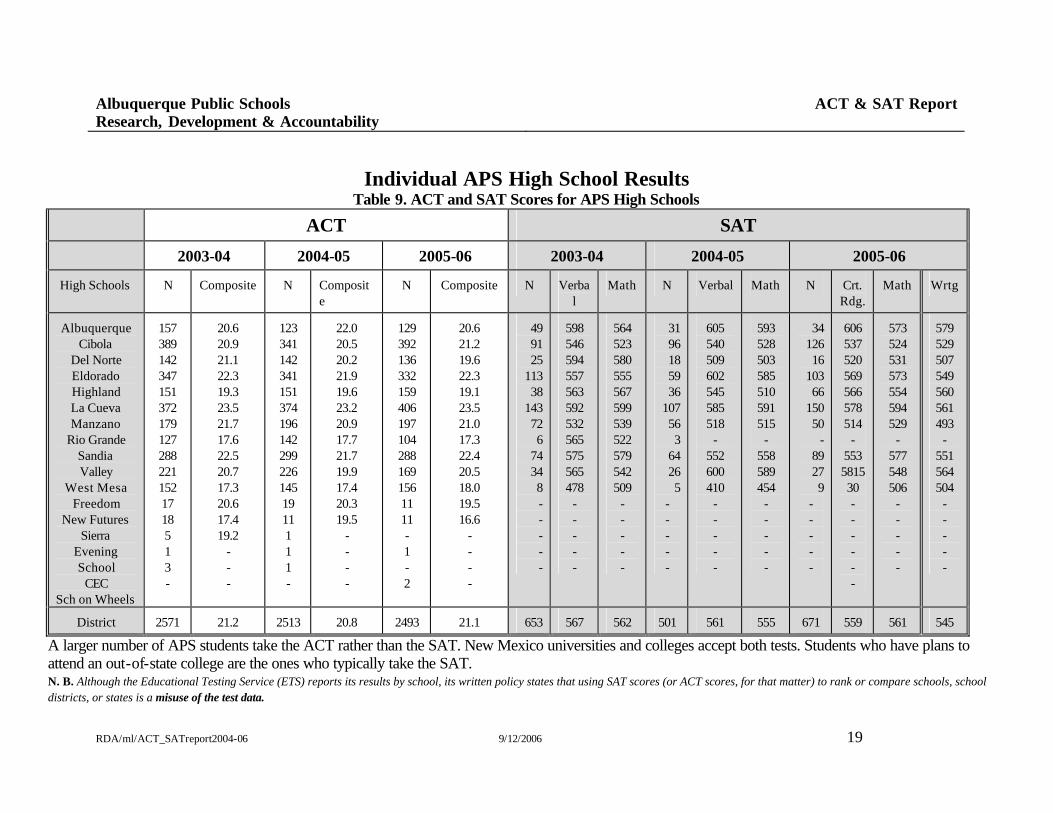
Individual APS High School Results Table 9. ACT and SAT Scores for APS High Schools
ACT SAT
2003-04 2004-05 2005-06 2003-04 2004-05 2005-06
High Schools N Composite N Composite
N Composite N Verbal
Math N Verbal Math N Crt. Rdg.
Math Wrtg
Albuquerque Cibola
Del Norte Eldorado Highland La Cueva Manzano
Rio Grande Sandia Valley
West Mesa Freedom
New Futures Sierra
Evening School
CEC Sch on Wheels
157 389 142 347 151 372 179 127 288 221 152 17 18 5 1 3 -
20.6 20.9 21.1 22.3 19.3 23.5 21.7 17.6 22.5 20.7 17.3 20.6 17.4 19.2
- - -
123 341 142 341 151 374 196 142 299 226 145 19 11 1 1 1 -
22.0 20.5 20.2 21.9 19.6 23.2 20.9 17.7 21.7 19.9 17.4 20.3 19.5
- - - -
129 392 136 332 159 406 197 104 288 169 156 11 11 - 1 - 2
20.6 21.2 19.6 22.3 19.1 23.5 21.0 17.3 22.4 20.5 18.0 19.5 16.6
- - - -
49 91 25
113 38
143 72 6 74 34 8 - - - - -
598 546 594 557 563 592 532 565 575 565 478
- - - - -
564 523 580 555 567 599 539 522 579 542 509
- - - - -
31 96 18
59 36
107 56 3 64 26 5
- - - - -
605 540 509 602 545 585 518
- 552 600 410
- - - - -
593 528 503 585 510 591 515
- 558 589 454
- - - - -
34 126 16 103 66 150 50
- 89 27 9 - - - - -
606 537 520 569 566 578 514
- 553 581530 - - - - - -
573 524 531 573 554 594 529
- 577 548 506
- - - - -
579 529 507 549 560 561 493
- 551 564 504
- - - - -
District 2571 21.2 2513 20.8 2493 21.1 653 567 562 501 561 555 671 559 561 545
A larger number of APS students take the ACT rather than the SAT. New Mexico universities and colleges accept both tests. Students who have plans to attend an out-of-state college are the ones who typically take the SAT. N. B. Although the Educational Testing Service (ETS) reports its results by school, its written policy states that using SAT scores (or ACT scores, for that matter) to rank or compare schools, school districts, or states is a misuse of the test data.