Embed Size (px)
Citation preview
B O N N E V I L L E P O W E R A D M I N I S T R A T I O N
Fact Sheet
A Northwest energy solution: Regional power benefits of the lower Snake River dams Clean, flexible and reliable. The lower Snake River dams are part of a Northwest energy solution with the capability to generate over 3,000 megawatts of carbon-free power.Congress authorized the U.S. Army Corps of Engineers to construct four large dams along the lower Snake River. Completed in the 1970s, the dams are work-horse multi-use facilities that provide power, navigation, recreation, and fish and wildlife conservation benefits for the Northwest.
The four lower Snake River dams — Ice Harbor, Lower Monumental, Little Goose and Lower Granite — are part of the Federal Columbia River Power System. The FCRPS
March 2016
Ice Harbor Dam — capacity 603 megawatts, energized in 1961.
is the largest source of clean, renewable electricity in the Pacific Northwest, helping the region limit its green-house gas emissions. Because of their location on the east side of the Cascades and the size of their generators, Washington state’s lower Snake River dams are also critical links in the carefully synchronized operation of the Northwest’s federal hydropower system.
CLEAN: Emission-free renewable energyA key benefit of the federal dams is clean air. These dams produce a lot of energy and no greenhouse gas emissions. This gives the Northwest an environmental edge unmatched elsewhere in the country, where power production is largely based on fossil fuels.
US
AC
E P
HO
TO
BY
DA
VID
RIG
G
2
If the region were to replace the energy produced by the lower Snake dams, it would most likely be with a fossil fuel, natural gas.1 A 2015 BPA reliability analysis concluded that replacement of the lower Snake dams with highly efficient natural gas generation would still increase the region’s carbon dioxide emissions by 2.0 to 2.6 million metric tons annually.2 At the low end, this would be the equivalent of adding 421,000 passenger cars to the region’s roads each year.3
The Northwest Power and Conservation Council estimated the social costs of continued CO2 emissions to the region over time.4 Using the Council’s social cost of carbon analysis, BPA estimates that replacing the four lower Snake River dams with gas-fired generation would have an associated social carbon cost of $98 million to $381 million each year.
The four lower Snake River dams produce over 1,000 average megawatts of reliable, carbon-free energy. That’s enough energy for over 800,000 average U.S. homes.
It would cost $1.3 billion to $2.6 billion to breach the dams.
The four lower Snake River dams include some of the most advanced and successful fish passage systems in the world.
The dams are now on track to achieve standards of 96 percent average dam survival for young spring chinook and steelhead migrating downstream and 93 percent for young summer-migrating fish.
Wind and solar generators are neither technically nor economically viable replacements for these dams.
1
2
3
4
5
FLEXIBLE: Hydro supports wind power and has the capacity to meet changing demandRENEWABLE RESOURCE INTEGRATION
Wind is an important renewable resource for the region and a significant energy resource on the BPA transmission grid — about 4,800 MW of wind generation (roughly four times the output of Bonneville Dam) is connected to BPA’s system. But wind power is intermittent, varying as the wind changes, so it must be complemented with other generation sources that can increase when the wind wanes or decrease when it blows harder.
Hydropower is an exceptionally valuable source of this capability. Dam operators can start, stop, increase or decrease generation by hundreds of megawatts in seconds to minutes if sufficient water is available. This quick response time is important because changes in electrical generation or use can happen in the blink of an eye.
Natural gas-fired combustion turbines are nearly as adept at increasing or decreasing output. Other thermal plants such as nuclear and coal-fired generation take longer, many minutes or hours, to achieve similar swings in generation.
While it varies seasonally, under normal operating conditions the four lower Snake River dams supply up to one-quarter of BPA’s operating reserves. Reserves are the capacity that utilities are required to have available to meet unexpected changes in generation or electrical demand. Without the flexibility and operating reserves that
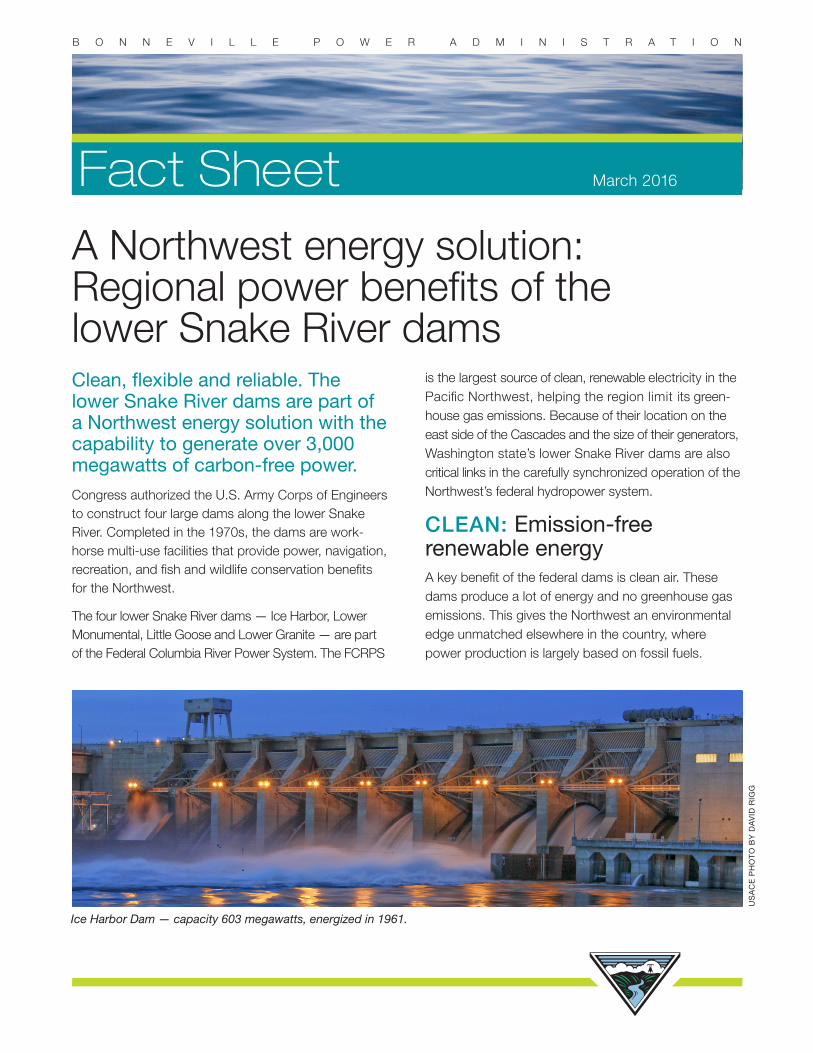
Lower Granite Dam — capacity 810 megawatts, energized in 1975
Five things you should know
3
these dams supply, the region would lose a substantial amount of its ability to deliver reliable energy, including the balancing of intermittent wind.
STEADY POWER SUPPLY
BPA markets power from 31 federal dams, but only the 10 largest of these dams keep the federal power system operating smoothly through the use of automatic generation control, or AGC. Those 10 dams include the four lower Snake River dams (see AGC map on page 7).
When the total electricity being consumed differs from the generation in the power system, automatic signals go to these few dams with AGC to instantly increase or decrease generation. This maintains the constant balance of generation and loads, or electrical demand, which is necessary for power system reliability.
Of the other dams with AGC, Grand Coulee and Chief Joseph are on the Columbia River above its confluence
with the Snake River. Streamflows in the Snake and upper Columbia River often differ. When the upper Columbia streamflows are limited for power generation, the lower Snake dams may be used more to help keep the lights on in the region.
RELIABLE: These dams keep the power and transmission systems in balanceCAPACITY TO MEET LOADS
The useful output of a power station is measured in two ways: capacity and energy. By either measure, the four lower Snake River dams are major power plants. Capacity is the largest amount of power a plant can generate when it is operating at full output. The combined nameplate capacity of the four lower Snake River dams is over 3,000 megawatts.
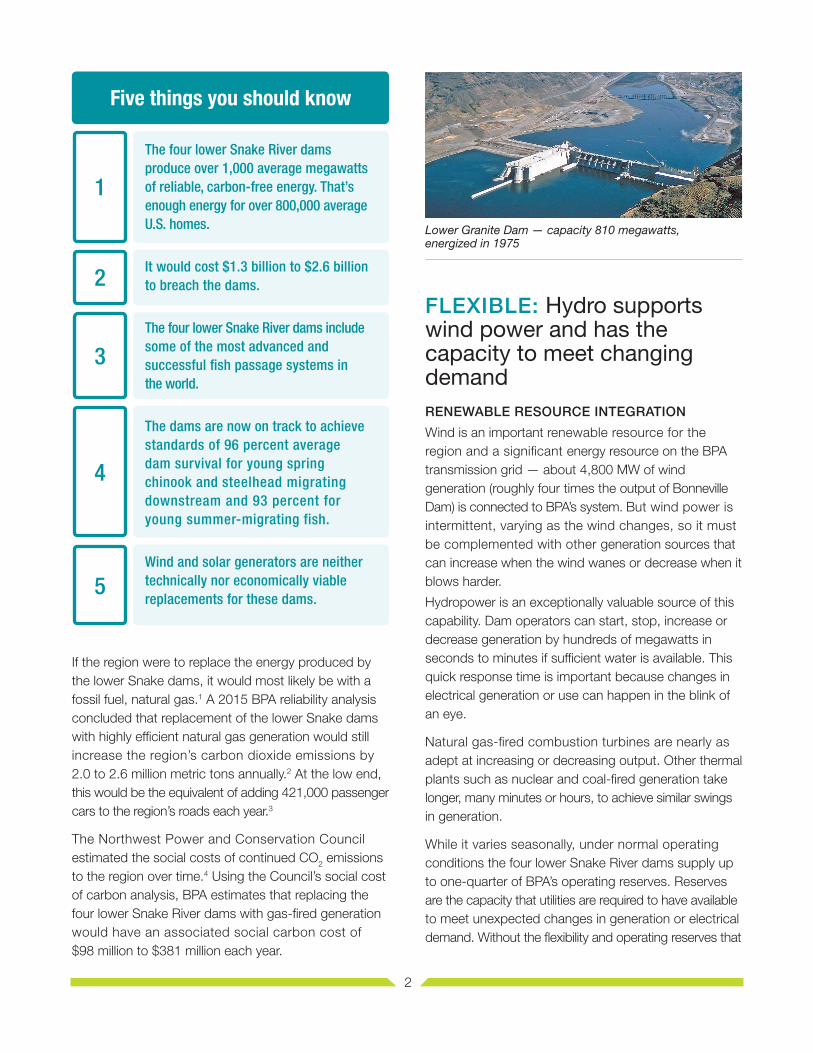
In recent years, the region’s ratepayers and federal taxpayers have also made huge long-term investments in large-scale structural and operational changes to further improve existing fish passage routes as well as provide new, safe passage structures at these dams. These improvements, which have focused primarily on providing safe and effective juvenile fish passage via surface spill routes, conventional spill and screened bypass, were developed in consultation with regional salmon experts representing states, tribes and federal agencies and will help meet specific fish survival performance standards. The dams are now on track to achieve standards of 96 percent average dam survival for young spring chinook and steelhead migrating downstream and 93 percent for young summer migrating fish. Adult salmon coming back up the river on the way to their spawning grounds pass the dams via fish ladders.
THE LOWER SNAKE RIVER DAMS PROVIDE SAFE FISH PASSAGE
lower Snake River Dams
4
Ice Harbor Dam 603 MW Lower Monumental Dam 810 MW Little Goose Dam 810 MW Lower Granite Dam 810 MW
Total 3,033 MW
Capacity is becoming increasingly important to the Pacific Northwest as loads continue to increase over time during the region’s periods of peak power demand, in winter for warming and in summer for cooling, as more households install air conditioning, using the full capacity of the FCRPS.
Much of the year, BPA relies on the lower Snake River dams specifically to help meet these peak demands for energy.
In the event of an extended cold snap or another power plant shutting down unexpectedly, the lower Snake dams can produce in excess of 2,650 MW of energy over a sustained period of 10 hours per day for five consecutive days. This represents over 10 percent of the total capacity of the FCRPS.
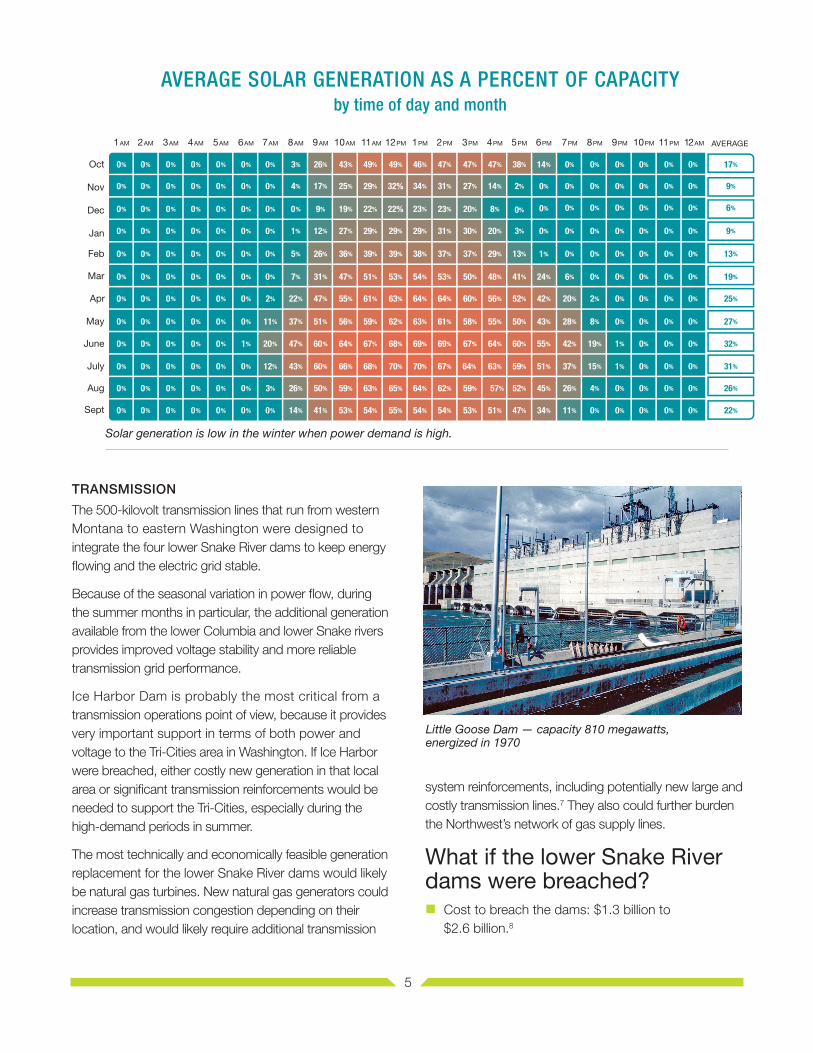
The average energy output of a generator is also helpful when making comparisons. The four lower Snake River dams produce 1,004 average megawatts5 each year. For comparison, the Boardman coal plant in Oregon provides 489 aMW. As an additional point of comparison, three
recently removed dams in Washington that blocked fish passage — Condit, Elwha and Glines Canyon — generated a combined 31 aMW.
Winter energy and capacity cannot be replaced with other renewable resourcesThe Northwest’s demand for electricity is highest in the winter. The four lower Snake River dams provide critical winter energy and capacity to serve regional loads. This benefit cannot be replaced by other renewable resources such as solar and wind.
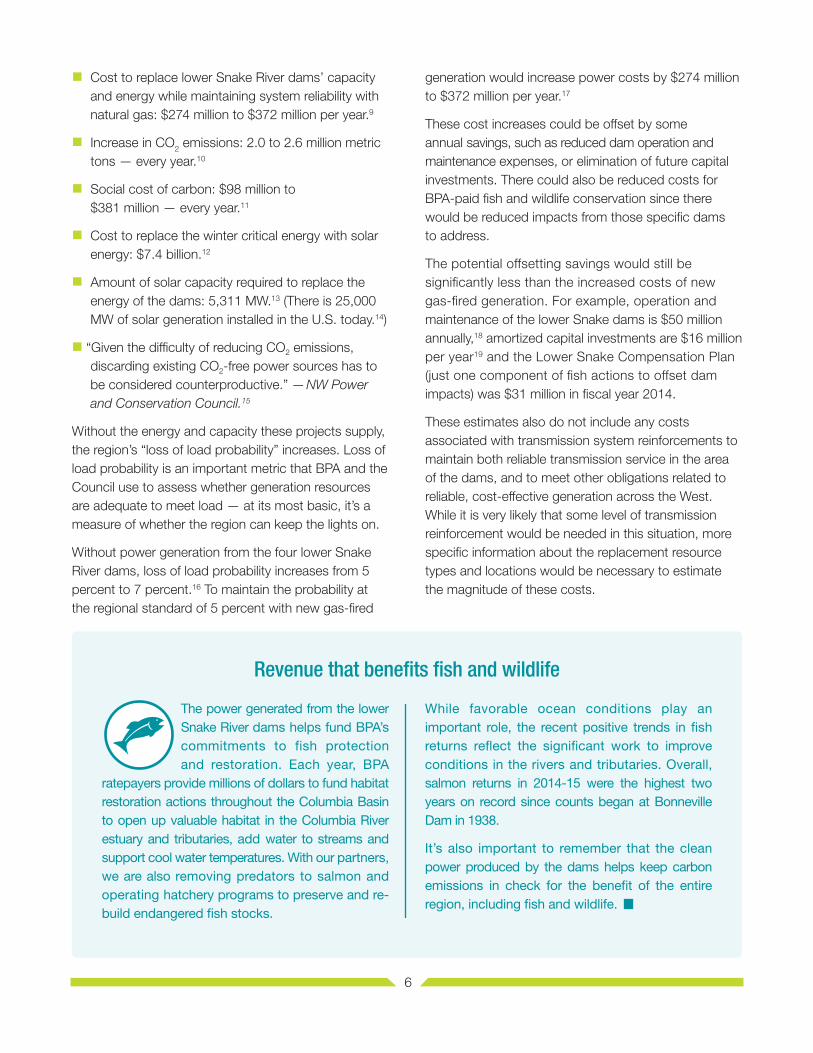
To replace the winter energy capability that these projects provide with solar energy would take thousands of megawatts of installed solar panels at a utility scale and would be extraordinarily expensive for regional energy consumers.6 And even then, peak Northwest power needs in the winter typically happen before the sun rises or after it has set. In fact, utility-scale solar generation projects in the BPA control area produce an average of only 6 percent of their full generation capacity in the winter month of December.
Similarly, about half the time during periods of peak energy use in the winter months, wind farms in the BPA balancing area generate at 10 percent or less of their full potential. And for an additional 30 percent of the time, they have a capacity value of 3 percent or less. For comparison, conventional power plants (hydroelectric, natural gas and coal) are typically available at 100 percent capacity from 90 to 98 percent of the time.
80-YEAR AVERAGE ANNUAL GENERATION
The lower Snake River dams are significant energy resources.
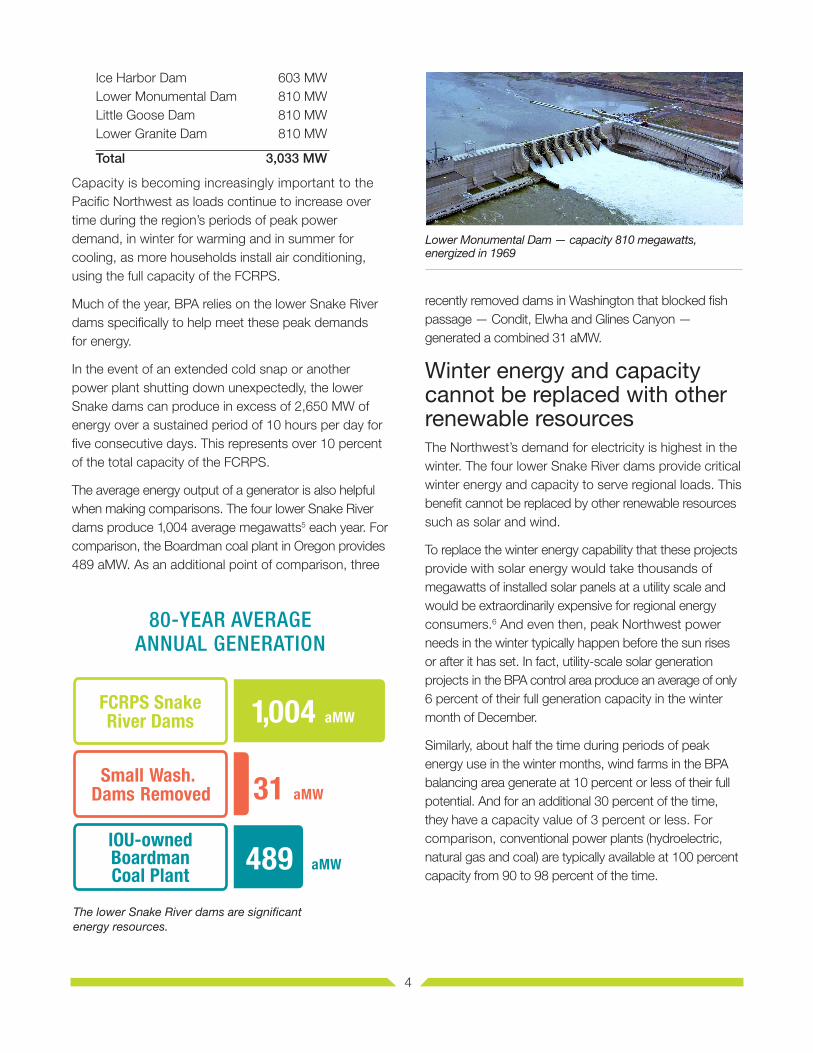
Lower Monumental Dam — capacity 810 megawatts, energized in 1969
5
TRANSMISSION
The 500-kilovolt transmission lines that run from western Montana to eastern Washington were designed to integrate the four lower Snake River dams to keep energy flowing and the electric grid stable.
Because of the seasonal variation in power flow, during the summer months in particular, the additional generation available from the lower Columbia and lower Snake rivers provides improved voltage stability and more reliable transmission grid performance.
Ice Harbor Dam is probably the most critical from a transmission operations point of view, because it provides very important support in terms of both power and voltage to the Tri-Cities area in Washington. If Ice Harbor were breached, either costly new generation in that local area or significant transmission reinforcements would be needed to support the Tri-Cities, especially during the high-demand periods in summer.
The most technically and economically feasible generation replacement for the lower Snake River dams would likely be natural gas turbines. New natural gas generators could increase transmission congestion depending on their location, and would likely require additional transmission
Little Goose Dam — capacity 810 megawatts, energized in 1970
AVERAGE SOLAR GENERATION AS A PERCENT OF CAPACITYby time of day and month
1 AM 2 AM 3 AM 4 AM 5 AM 6 AM 7 AM 8 AM 9 AM 10 AM 11 AM 12 PM 1 PM 2 PM 3 PM 4 PM 5 PM 6 PM 7 PM 8 PM 9 PM 10 PM 11 PM 12 AM Monthly AverageOct 0% 0% 0% 0% 0% 0% 0% 3% 26% 43% 49% 49% 46% 47% 47% 47% 38% 14% 0% 0% 0% 0% 0% 0% 17%Nov 0% 0% 0% 0% 0% 0% 0% 4% 17% 25% 29% 32% 34% 31% 27% 14% 2% 0% 0% 0% 0% 0% 0% 0% 9%Dec 0% 0% 0% 0% 0% 0% 0% 0% 9% 19% 22% 22% 23% 23% 20% 8% 0% 0% 0% 0% 0% 0% 0% 0% 6%Jan 0% 0% 0% 0% 0% 0% 0% 1% 12% 27% 29% 29% 29% 31% 30% 20% 3% 0% 0% 0% 0% 0% 0% 0% 9%Feb 0% 0% 0% 0% 0% 0% 0% 5% 26% 36% 39% 39% 38% 37% 37% 29% 13% 1% 0% 0% 0% 0% 0% 0% 13%Mar 0% 0% 0% 0% 0% 0% 0% 7% 31% 47% 51% 53% 54% 53% 50% 48% 41% 24% 6% 0% 0% 0% 0% 0% 19%Apr 0% 0% 0% 0% 0% 0% 2% 22% 47% 55% 61% 63% 64% 64% 60% 56% 52% 42% 20% 2% 0% 0% 0% 0% 25%May 0% 0% 0% 0% 0% 0% 11% 37% 51% 56% 59% 62% 63% 61% 58% 55% 50% 43% 28% 8% 0% 0% 0% 0% 27%June 0% 0% 0% 0% 0% 1% 20% 47% 60% 64% 67% 68% 69% 69% 67% 64% 60% 55% 42% 19% 1% 0% 0% 0% 32%July 0% 0% 0% 0% 0% 0% 12% 43% 60% 66% 68% 70% 70% 67% 64% 63% 59% 51% 37% 15% 1% 0% 0% 0% 31%Aug 0% 0% 0% 0% 0% 0% 3% 26% 50% 59% 63% 65% 64% 62% 59% 57% 52% 45% 26% 4% 0% 0% 0% 0% 26%Sept 0% 0% 0% 0% 0% 0% 0% 14% 41% 53% 54% 55% 54% 54% 53% 51% 47% 34% 11% 0% 0% 0% 0% 0% 22%
1 AM
Oct
Nov
Dec
Jan
Feb
Mar
Apr
May
June
July
Aug
Sept
2 AM 3 AM 4 AM 5 AM 6 AM 7 AM 8 AM 9 AM 10 AM 11 AM 12 PM 1 PM 2 PM 3 PM 4 PM 5 PM 6 PM 7 PM 8 PM 9 PM 10 PM 11 PM 12 AM AVERAGE
502512.5 37.5 62.5 87.575 1000
0%
0%
0%
0%
0%
0%
0%
0%
0%
0%
0%
0%
0%
0%
0%
0%
0%
0%
0%
0%
0%
0%
0%
0%
0%
0%
0%
0%
0%
0%
0%
0%
0%
0%
0%
0%
0%
0%
0%
0%
0%
0%
0%
0%
0%
0%
0%
0%
0%
0%
0%
0%
0%
0%
0%
0%
0%
0%
0%
0%
0%
0%
0%
0%
0%
0%
0%
0%
1%
0%
0%
0%
0%
0%
0%
0%
0%
0%
2% 2%
8%
8%
2% 0%
11%
20%
12%
3%
0%
3%
4%
0%
1%
5%
7% 6%
22%
37%
37% 37%
37%
47%
47%46% 47% 47%
47% 34%
34%
43%
26%
14%
26%
17%
9%
12%
26%
31%
31%
31% 30%
47%
51%
51%
51%
45% 26% 4%
60%
60%
60%
60%
50%
50% 48%
50%
52%
52%
41%
41% 24%
42%
42%
43%
43%
25%
19%
19%
27%
27%
36%
47%
55%
55%
55%
55%
56%
56%
64%
64% 64%
64%
64%
64%
66%
59% 59% 57%
59%
53%
53% 53%
53%
49% 49%
29% 32%
22%
14%
22%
29% 29% 29%
23% 23% 20%
20%
13%
3%
20%
28%
29%39% 39% 38%
38% 14% 17%
9%
6%
9%
13%
19%
25%
27%
32%
31%
26%
22%
0% 0% 0% 0% 0% 0%
0% 0% 0% 0% 0% 0%
0% 0% 0% 0% 0% 0%
0%0%
0% 0%
0% 0% 0% 0% 0%
0%1% 0% 0% 0% 0% 0%
0% 0% 0% 0% 0%
0% 0% 0% 0%
0% 0% 0% 0%
1% 0% 0% 0%
1% 0% 0% 0%
0% 0% 0% 0%
0%0% 0% 0% 0%
51%
61%
61% 58%59%
67% 67%
67%68%
68% 69% 69%
70% 70%
63% 65%
63%
63%62%
62%
63%
54% 54% 54%
54%
11%
15%
Solar generation is low in the winter when power demand is high.
system reinforcements, including potentially new large and costly transmission lines.7 They also could further burden the Northwest’s network of gas supply lines.
What if the lower Snake River dams were breached?
� Cost to breach the dams: $1.3 billion to $2.6 billion.8
6
� Cost to replace lower Snake River dams’ capacity and energy while maintaining system reliability with natural gas: $274 million to $372 million per year.9
� Increase in CO2 emissions: 2.0 to 2.6 million metric tons — every year.10
� Social cost of carbon: $98 million to $381 million — every year.11
� Cost to replace the winter critical energy with solar energy: $7.4 billion.12
� Amount of solar capacity required to replace the energy of the dams: 5,311 MW.13 (There is 25,000 MW of solar generation installed in the U.S. today.14)
� “Given the difficulty of reducing CO2 emissions, discarding existing CO2-free power sources has to be considered counterproductive.” —NW Power and Conservation Council.15
Without the energy and capacity these projects supply, the region’s “loss of load probability” increases. Loss of load probability is an important metric that BPA and the Council use to assess whether generation resources are adequate to meet load — at its most basic, it’s a measure of whether the region can keep the lights on.
Without power generation from the four lower Snake River dams, loss of load probability increases from 5 percent to 7 percent.16 To maintain the probability at the regional standard of 5 percent with new gas-fired
generation would increase power costs by $274 million to $372 million per year.17
These cost increases could be offset by some annual savings, such as reduced dam operation and maintenance expenses, or elimination of future capital investments. There could also be reduced costs for BPA-paid fish and wildlife conservation since there would be reduced impacts from those specific dams to address.
The potential offsetting savings would still be significantly less than the increased costs of new gas-fired generation. For example, operation and maintenance of the lower Snake dams is $50 million annually,18 amortized capital investments are $16 million per year19 and the Lower Snake Compensation Plan (just one component of fish actions to offset dam impacts) was $31 million in fiscal year 2014.
These estimates also do not include any costs associated with transmission system reinforcements to maintain both reliable transmission service in the area of the dams, and to meet other obligations related to reliable, cost-effective generation across the West. While it is very likely that some level of transmission reinforcement would be needed in this situation, more specific information about the replacement resource types and locations would be necessary to estimate the magnitude of these costs.
Revenue that benefits fish and wildlife
The power generated from the lower Snake River dams helps fund BPA’s commitments to fish protection and restoration. Each year, BPA
ratepayers provide millions of dollars to fund habitat restoration actions throughout the Columbia Basin to open up valuable habitat in the Columbia River estuary and tributaries, add water to streams and support cool water temperatures. With our partners, we are also removing predators to salmon and operating hatchery programs to preserve and re-build endangered fish stocks.
While favorable ocean conditions play an important role, the recent positive trends in fish returns reflect the significant work to improve conditions in the rivers and tributaries. Overall, salmon returns in 2014-15 were the highest two years on record since counts began at Bonneville Dam in 1938.
It’s also important to remember that the clean power produced by the dams helps keep carbon emissions in check for the benefit of the entire region, including fish and wildlife.
7
Noxon Rapids
Boise
BRITISH COLUMBIA
M O N TA N A
IDAHO
O R E G O N
W Y
WA S H I N G T O N
Col
umbi
aR
i ver
Will
amet
teRi
ver
SnakeRive
r
Columbia River iSnake
Rver
Pa
ci
fi
cO
ce
an
Portland
Seattle
Missoula
Spokane
Chief Joseph
Grand Coulee
LowerGraniteLower
Monumental
LittleGoose
Ice Harbor
McNaryJohn Day
Detroit
Cougar
Hills Creek
Lookout Point
Big Cliff
Dexter
Chandler
Roza
TheDalles
Bonneville
AlbeniFalls
Libby
Dworshak
Cascade
Black CanyonLucky Peak
Minidoka
AmericanFalls
PalisadesAnderson
Ranch
HungryHorse
Wells
RockyReach
Rock Island
Wanapum
PriestRapids
MossyrockMayfield
MerwinYale
Swift
Pelton
SwanFalls
C JStrike
UpperSalmon Falls
Milner
HellsCanyon
Brownlee
Cabinet Gorge
Kerr
Oxbow
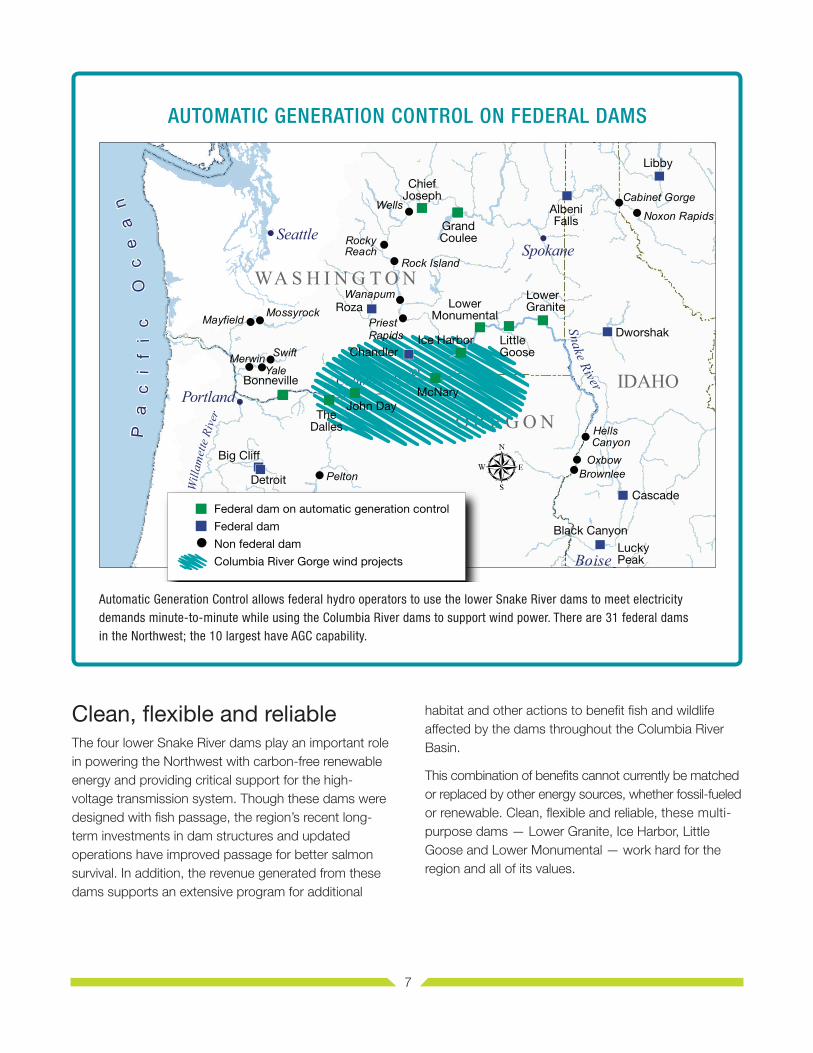
BoundaryAUTOMATIC GENERATION CONTROL ON FEDERAL DAMS
Automatic Generation Control allows federal hydro operators to use the lower Snake River dams to meet electricity demands minute-to-minute while using the Columbia River dams to support wind power. There are 31 federal dams in the Northwest; the 10 largest have AGC capability.
Federal dam on automatic generation control
Federal dam
Non federal dam
Columbia River Gorge wind projects
Clean, flexible and reliable The four lower Snake River dams play an important role in powering the Northwest with carbon-free renewable energy and providing critical support for the high-voltage transmission system. Though these dams were designed with fish passage, the region’s recent long-term investments in dam structures and updated operations have improved passage for better salmon survival. In addition, the revenue generated from these dams supports an extensive program for additional
habitat and other actions to benefit fish and wildlife affected by the dams throughout the Columbia River Basin.
This combination of benefits cannot currently be matched or replaced by other energy sources, whether fossil-fueled or renewable. Clean, flexible and reliable, these multi-purpose dams — Lower Granite, Ice Harbor, Little Goose and Lower Monumental — work hard for the region and all of its values.
BONNEVILLE POWER ADMINISTRATIONDOE/BP-4751 • March 2016
1 Northwest Power and Conservation Council, Seventh Northwest Conservation and Electric Power Plan, pg. 1–2. All cost-effective conservation is being developed and as a consequence it is not available to replace these projects. There is also a call in the Seventh Power Plan to develop demand response, or DR, resources. BPA supports demand response solutions, but at least in the foreseeable future, DR solutions are still too new and small-scale to be an effective replacement for large-scale hydropower generation.
2 Carbon emissions from a Mitsubishi 501 gigawatt plant, 786 lb/MWh, from the Council’s Generating Resources Advisory Committee, Oct. 16, 2013. Low estimate is additional gas generation in the Pacific Northwest only; the high estimate is if the exported generation from the Snake River dams no longer offset out-of-region thermal generation.
3 From http://www2.epa.gov/energy/greenhouse-gas-equivalencies-calculator.
4 The Council’s social cost of carbon estimates in the Seventh Power Plan are $41 to $121 per metric ton in 2016, and they escalate steadily through 2035 to a range of $60 to $189 per metric ton. These figures are all in 2012 dollars, pg. 15–20, 15–23.
5 The average megawatts, or aMW, figures reported here for hydropower projects indicate the average annual energy production using 80 years of streamflow data.
6 BPA analysis indicates the lower Snake dams provide 478 aMW of energy during the December 1936 to February 1937 critical period. To replace the energy output with solar would require the installation of 5,311 megawatts of solar panels (478/.09 = 5,311 MW). At the end of 2015, there was 25,000 MW installed in the U.S., according to the Solar Energy Industries Association. Using estimates of solar installation costs from the Council’s Seventh Power Plan, the capital cost of installing this amount of solar at an estimated $1.7 million per megawatt for a total of $8.9 billion dollars (2012 dollars for the year 2020, pg. H-23). 478 aMW is part of the critical period generation and is the basis of BPA’s priority firm wholesale power rates while 1,004 aMW reported elsewhere is the average generation of the Snake dams over 80 water years.
7 New large transmission line construction is very expensive and can exceed a million dollars per mile for new 500-kilovolt lines.
8 Corps of Engineers, Final Feasibility Study and Environmental Impact Statement, 1998, Annex X, pg. D-X-3. Costs converted to 2015 dollars using CPI calculator http://data.bls.gov/cgi-bin/cpicalc.pl.
9 BPA analysis of loss of load probability shows an increase from 5 percent (the regional reliability standard) to 7 percent, and replacement with gas generation, using capital cost estimates and gas price forecasts from the Council’s Seventh Power Plan, pg. H 11–12.
10 Based on BPA estimate of natural gas generation needed to replace the four lower Snake River dams.
11 BPA estimate using price data from the Council’s social cost of carbon estimates, Seventh Power Plan, pgs. 15-20 and 15-23.
12 See note 6.
13 BPA analysis of energy output of lower Snake dams during critical water period (1937) indicates they would provide 478 aMW of energy during December. Solar generation projects provide an average of 6 percent of their full capacity in BPA’s control area in December based on historical data.
14 Source: Solar Energy Industries Association.
15 Northwest Power and Conservation Council, “Carbon Dioxide Footprint of the Northwest Power System” (Nov. 2007), pg. 11.
16 Using the Council’s Genesys model and the 2021 Gas Turbine Scenario study with a 5 percent loss of load probability (1,150 MW of gas plants added) as the reference case. This reference case includes all cost effective conservation of the Sixth Power Plan. www.nwcouncil.org/media/7149625/2020-21-sos-report-final-100815.pdf.
17 These figures represent the estimated costs or values of: installing 810 MW of new gas turbines, gas generation and the value of lost export power sales. These estimated cost figures do not reflect any offsets from estimated annual savings.
18 O&M figure (rounded up from $49.7 million) only includes BPA direct funds and appropriations for hydropower and joint features. It does not include O&M costs associated with navigation, recreation or flood risk management.
19 Ten-year capital plan (2016 to 2025) for the lower Snake River dams is $265.4 million (2015 dollars) amortized over 30 years at 4.5 percent, the regional cost of capital from a corporate perspective, according to the Council’s Seventh Power Plan, pg. A-12.
End notes