Embed Size (px)
Citation preview

Grant Agreement Number: 641185
Action acronym:
CEMCAP
Action full title: CO2 capture from cement production
Type of action:
H2020-LCE-2014-2015/H2020-LCE-2014-1
Starting date of the action: 2015-05-01 Duration: 42 months
D3.2 CEMCAP framework for comparative techno-economic analysis
of CO2 capture from cement plants
Revision 1
Due delivery date: 2017-01-31 Actual delivery date: 2017-05-11
Revised version delivery date: 2017-09-18
Organisation name of lead participant for this deliverable: SINTEF-ER
Project co-funded by the European Commission within Horizon2020
Dissemination Level
PU Public x
CO Confidential , only for members of the consortium (including the Commission Services)


Page iii
This project has received funding from the European Union's Horizon2020 Research and Innovation Programme under Grant Agreement No 641185. This work was supported by the Swiss State Secretariat for Education, Research and Innovation (SERI) under contract number 15.0160
Deliverable number: D3.2
Deliverable title: CEMCAP framework for comparative techno-economic analysis of CO2 capture from cement plants
Work package: WP3: CEMCAP Framework
Lead participant: SINTEF-ER
Author(s)
Name Organisation E-mail
Rahul Anantharaman SINTEF ER [email protected]
David Berstad SINTEF ER [email protected]
Giovanni Cinti C.T.G SPA [email protected]
Edoardo De Lena Politecnico di Milano [email protected]
Manuele Gatti Politecnico di Milano [email protected]
Matteo Gazzani ETH Zurich [email protected]
Helmut Hoppe VDZ GmbH [email protected]
Isabel Martínez Politecnico di Milano [email protected]
Juliana Garcia Moretz-Sohn Monteiro
Matteo Romano Politecnico di Milano [email protected]
Simon Roussanaly SINTEF ER [email protected]
Erin Schols TNO [email protected]
Maurizio Spinelli Politecnico di Milano [email protected]
Sigmund Størset SINTEF ER [email protected]
Peter van Os TNO [email protected]
Mari Voldsund SINTEF ER [email protected]
Abstract
This document provides a framework for comparative techno-economic analysis in the CEMCAP
project, where four different CO2 capture technologies are to be evaluated for application in
cement plants. It defines a reference cement kiln with description of the main unit, and
characteristics of raw material and flue gas. The four capture technologies (oxyfuel, chilled
ammonia, membrane assisted liquefaction, and calcium looping), and a reference technology
(MEA absorption) are described. Specifications are set for process units (e.g. heat exchangers,
compressors etc.) and for the generation of utilities (e.g. steam, electric power etc.). Conditions
like the extent of CO2 capture and purity of the produced CO2 are set. Furthermore, relevant
economic parameters are defined, and parameters relevant for sensitivity studies are suggested.
Changes in revision 1
Clarifications are included on the definition of primary energy for renewable power production
(Chapter 6.2.1) and cost of electricity in EU28 (Table 6.6). The new ISO 27913 standard on CO2
pipeline transportation systems is commented on in relation to the CO2 impurity specifications
(Chapter 8.1.1). Temperature profiles in Fig. 3.6 are corrected. CEPCI for 2014 was updated with
final 2014 value instead of a preliminary value.


Page v
This project has received funding from the European Union's Horizon2020 Research and Innovation Programme under Grant Agreement No 641185. This work was supported by the Swiss State Secretariat for Education, Research and Innovation (SERI)
under contract number 15.0160.
TABLE OF CONTENTS
Page
1 INTRODUCTION ................................................................................................................... 3
2 GENERAL DEFINITION AND CONDITIONS .................................................................... 4 2.1 Units ............................................................................................................................. 4 2.2 Reference state for gas concentrations ......................................................................... 4 2.3 Ambient conditions ...................................................................................................... 4
3 REFERENCE CEMENT KILN .............................................................................................. 5 3.1 Size ............................................................................................................................... 5
3.2 Raw material ................................................................................................................. 6 3.2.1 Raw meal .......................................................................................................... 6 3.2.2 Fuel ................................................................................................................... 7
3.3 Preheater ....................................................................................................................... 7
3.4 Calciner ......................................................................................................................... 9 3.5 Kiln ............................................................................................................................. 10
3.6 Main burner ................................................................................................................ 12 3.7 Clinker cooler ............................................................................................................. 14 3.8 Flue gas ....................................................................................................................... 15
3.8.1 Interconnected and direct mode ...................................................................... 15 3.8.2 Air leak ........................................................................................................... 16
3.8.3 Flue gas conditions ......................................................................................... 17 3.8.4 Flue gas base case definition .......................................................................... 20
4 CAPTURE TECHNOLOGIES ............................................................................................. 21 4.1 Reference case: MEA absorption ............................................................................... 21 4.2 Oxyfuel ....................................................................................................................... 22 4.3 Chilled ammonia ........................................................................................................ 24
4.4 Membrane assisted liquefaction ................................................................................. 27 4.5 Calcium looping ......................................................................................................... 29
5 PROCESS UNIT SPECIFICATIONS .................................................................................. 32
5.1 Heat exchangers .......................................................................................................... 32 5.2 Separators ................................................................................................................... 32 5.3 Pumps, fans, compressors and expanders ................................................................... 32 5.4 Filters .......................................................................................................................... 33
6 CO2 CAPTURE UTILITIES ................................................................................................. 34 6.1 Steam .......................................................................................................................... 34
6.1.1 Steam produced from heat recovery in the cement power plant .................... 34 6.1.2 Steam import from external coal CHP plant ................................................... 34 6.1.3 Natural gas-fired boiler ................................................................................... 35
6.1.4 CO2 emissions and cost .................................................................................. 35 6.2 Electricity.................................................................................................................... 36
6.2.1 Reference efficiency and CO2 emission ......................................................... 36
6.2.2 Cost of electricity ............................................................................................ 38

Page vi
This project has received funding from the European Union's Horizon2020 Research and Innovation Programme under Grant Agreement No 641185. This work was supported by the Swiss State Secretariat for Education, Research and Innovation (SERI)
under contract number 15.0160.
6.3 Integrated power production ....................................................................................... 40 6.4 Air separation unit ...................................................................................................... 44
6.4.1 On-site production .......................................................................................... 44 6.4.2 Oxygen supplied by tank trucks ..................................................................... 45 6.4.3 Oxygen costs ................................................................................................... 45
6.5 Refrigeration system ................................................................................................... 45 6.6 Heat rejection system ................................................................................................. 49
7 EXTENT OF CO2 CAPTURE .............................................................................................. 50
8 CO2 AND FLUE GAS SPECIFICATIONS .......................................................................... 51 8.1 CO2 transport .............................................................................................................. 51
8.1.1 Pipeline transport ............................................................................................ 51 8.1.2 Ship transport .................................................................................................. 52
8.2 CO2 destination ........................................................................................................... 52 8.2.1 Storage ............................................................................................................ 52 8.2.2 EOR ................................................................................................................ 52
8.2.3 Utilisation ....................................................................................................... 52 8.2.4 Mineralisation ................................................................................................. 53
8.3 CO2 conditioning ........................................................................................................ 53 8.3.1 CO2 compression ............................................................................................ 54
8.3.2 CO2 liquefaction ............................................................................................. 55 8.4 Flue gas ....................................................................................................................... 56
9 ECONOMIC ANALYSIS ..................................................................................................... 57
9.1 Introduction ................................................................................................................ 57
9.2 Economic boundaries ................................................................................................. 57 9.3 Financial parameters ................................................................................................... 59 9.4 Capital investment ...................................................................................................... 59
9.5 Main operating cost parameters .................................................................................. 62 9.5.1 Maintenance, insurance and labour costs ....................................................... 62
9.5.2 Utilities and consumables cost........................................................................ 63 9.5.3 Other variable Operating costs ....................................................................... 63
10 KEY PERFORMANCE INDICATORS ............................................................................... 64 10.1 Energy and environmental performance indicators .................................................... 64
10.2 Economic indicators ................................................................................................... 67
10.3 Other indicators .......................................................................................................... 67
11 CASE OVERVIEW .............................................................................................................. 69
12 SENSITIVITY ANALYSIS .................................................................................................. 70
REFERENCES .............................................................................................................................. 72

Page 1
This project has received funding from the European Union's Horizon2020 Research and Innovation Programme under Grant Agreement No 641185. This work was supported by the Swiss State Secretariat for Education, Research and Innovation (SERI)
under contract number 15.0160.
List of abbreviations
AACE: Association for the Advancement of Cost Engineering
AC: CO2 avoided
ASU: Air Separation Unit
BAT: Best Available Technique
BREF: BAT Reference
BUA: Bottom-Up Approach
CAC: Cost of Avoided CO2
CaL: Calcium Looping
CAP: Chilled Ammonia Process
CCR: CO2 Capture Ratio
CCS: Carbon Capture and Storage
CEPCI: Chemical Engineering Plant Cost Index
CHP: Combined Heat and Power
clk: clinker
COC: Cost of Clinker
COP: Coefficient of Performance
CPU: CO2 Purification Unit
EOS: Equation of State
EPC: Engineering, Procurement and Construction Costs
FGD: Flue Gas Desulphurizer
GT: Gas Turbine
HRSG: Heat Recovery Steam Generator
KPI: Key Performance Indicator
LHV: Lower Heating Value
LOI: Loss on Ignition
MEA: Monoethanolamine
O&M: Operations & Maintenance
ORC: Organic Rankine Cycle
PM: Particulate Matter
PSA: Pressure Swing Adsorption
R&D: Research and Development

Page 2
This project has received funding from the European Union's Horizon2020 Research and Innovation Programme under Grant Agreement No 641185. This work was supported by the Swiss State Secretariat for Education, Research and Innovation (SERI)
under contract number 15.0160.
RDF: Refuse Derived Fuel
SPECCA: Specific Primary Energy Consumption for CO2 Avoided
STP: Standard Temperature and Pressure
TDC: Total Direct Costs
TEC: Total Equipment Costs
TEG: Triethylene Glycol
TOC: Total Organic Carbon
TOT: Turbine Outlet Temperature
TPC: Total Plant Costs
TRL: Technology Readiness Level
VPSA: Vacuum Pressure Swing Adsorption
WTE: Waste-to-Energy

Page 3
This project has received funding from the European Union's Horizon2020 Research and Innovation Programme under Grant Agreement No 641185. This work was supported by the Swiss State Secretariat for Education, Research and Innovation (SERI)
under contract number 15.0160.
1 INTRODUCTION
This document provides a framework for techno-economic analyses in the CEMCAP project.
It will ensure a consistent benchmarking of CO2 capture technologies in the cement industry. It
is based on the preliminary work of the European Benchmarking Task Force which has
developed a framework for benchmarking of power plants with CO2 capture. Due to the different
scope of CEMCAP, additional information about the clinker burning process and a reference
cement kiln had to be included in the present framework document. A description of the CO2
capture technologies, which are investigated within the project, is furthermore contained in the
document.
The aim of the framework document is:
• to define a reference cement kiln where different CO2 capture technologies could be applied,
• to define boundary conditions (e.g. energy prices, investment related basis values, CO2
quality), assumptions (e.g. by reference location) and sensitivities (e.g. economic parameters)
to compare capture methods,
• to assemble a framework for simulations and evaluation of full-scale cement kilns with CO2
capture; several capture cases/scenarios will be employed for the technology evaluation,
• to define key performance indicators (KPIs) for benchmarking; these will include (but are not
limited to) energy consumption, required/produced heat, required/produced power, cost of
CO2 captured, cost of CO2 avoided and other techno-economic parameters.
The benchmarking framework developed in CEMCAP will be disseminated in several different
ways with the ECRA members as primary receiver. However, curbing CO2 emissions from the
cement industry is a global challenge, and consequently efforts will be made to spread the
document globally and beyond the lifetime of CEMCAP. It is expected that the CEMCAP
framework can also be a useful reference for the R&D directed towards implementation of CCS
technologies in other CO2-intensive industries.

Page 4
This project has received funding from the European Union's Horizon2020 Research and Innovation Programme under Grant Agreement No 641185. This work was supported by the Swiss State Secretariat for Education, Research and Innovation (SERI)
under contract number 15.0160.
2 GENERAL DEFINITION AND CONDITIONS
2.1 Units
In all documents SI units (Système International d’Unitès) are used [BIPM].
2.2 Reference state for gas concentrations
Gas concentrations are referred to standard temperature (273.15 K) and pressure (1,013 hPa)
conditions (STP) in the dry state.
In some cases, gas concentrations are referred to a reference oxygen concentration, e.g. 10 % O2.
The following equation can be used to correct a measured pollutant concentration in a dry
emitted of a conventional cement plant with a measured O2 content to an equivalent pollutant
concentration in a dry emitted gas with a specified reference amount of O2:
𝐸B =21 − 𝑂B
21 − 𝑂M×𝐸M
EM: mass concentration measured
EB: mass concentration, as related to reference oxygen content
OM: oxygen content measured
OB: reference oxygen content
2.3 Ambient conditions
The reference cement kiln is assumed to be situated on inland, with the following ambient
conditions:
• Air temperature: 15 °C
• Air pressure: 1.013 bar
• Relative humidity: 60 %
The air composition is given in Table 2.1.
Table 2.1: Air composition
Component Unit Concentration
Dry air Air at 60 % relative humidity
N2 vol% 78.09 77.30
CO2 vol% 0.03 0.03
H2O vol% 0 1.01
Ar vol% 0.932 0.923
O2 vol% 20.95 20.74

Page 5
This project has received funding from the European Union's Horizon2020 Research and Innovation Programme under Grant Agreement No 641185. This work was supported by the Swiss State Secretariat for Education, Research and Innovation (SERI)
under contract number 15.0160.
3 REFERENCE CEMENT KILN
The reference case relies on the Best Available Technique (BAT) standard as defined in the
European BREF-Document (Best Available Technique Reference) for the manufacture of cement
[BREF, 2013]. The plant structure for the reference case, based on a dry kiln process, consists of
a five stage cyclone preheater, calciner (also called precalciner) with tertiary duct, rotary kiln
and grate cooler, as illustrated in Figure 3.1. This case is used as reference also in the ECRA
project, and a process model has been built by VDZ (in this document referred to as the VDZ
process model).
Figure 3.1: BAT cement kiln
3.1 Size
A BAT cement kiln exhibits a clinker capacity of 3,000 t/d (raw meal/clinker factor 1.6), which
is a representative size for a European cement kiln (see Table 3.1). This corresponds to a yearly
clinker production of 1 Mt (equivalent to a run time of >330 days per year) or a cement
production of 1.36 Mt per year (clinker/cement factor 0.737).
Table 3.1: Production characteristics of a BAT cement kiln
Parameter Value
Production capacity 1 Mtclk/y (3,000 tclk/d)
Cement production 1.36 Mtcement/y
Clinker/cement factor 0.737
Raw meal/clinker factor 1.6
Specific CO2 emissions 850 kgCO2/tclk
Specific total electricity demand 97 kWh/tcement
Page 6
This project has received funding from the European Union's Horizon2020 Research and Innovation Programme under Grant Agreement No 641185. This work was supported by the Swiss State Secretariat for Education, Research and Innovation (SERI)
under contract number 15.0160.
3.2 Raw material
3.2.1 Raw meal
The raw materials for the clinker burning process are calcareous deposits, such as limestone,
marl or chalk. These materials provide the source for calcium carbonate. In most cases,
corrective materials (e.g. other natural raw materials or so-called secondary/alternative raw
materials from other production processes) are required for an appropriate raw material mixture
to provide the required amounts of other oxides like SiO2, Fe2O3 and Al2O3. For the so-called
BAT plant, an average raw material moisture (before drying) of 6 wt% was defined. The
composition of a typical raw meal (that has been dried while grinding) and of a clinker is shown
in Table 3.2.
Table 3.2: Composition of a typical raw meal (including correcting components) and of a
clinker
Raw meal composition at preheater inlet Clinker composition2)
Parameter Unit Value Parameter Unit Value
SiO2 wt% 13.80 C3S wt% 64.3
Al2O3 wt% 3.25 C2S wt% 14.0
TiO2 wt% 0.06 C3A wt% 10.0
P2O5 wt% 0.04 C4AF wt% 8.6
Fe2O3 wt% 1.96 CaO wt% 0.7
Mn2O3 wt% 0.05 Cl wt% 0.015
CaO wt% 43.22 SO3 wt% 0.70
MgO wt% 0.71 K2O wt% 0.85
CO2 wt% 34.74 Na2O wt% 0.19
SO3 wt% 0.34 LSF (lime saturation factor)
95
Sulphide1) wt% 0.05 Alumina ratio 1.8
K2O wt% 0.55 Silica ratio 2.5
Na2O wt% 0.12 Degree of sulphatisation 72
Cl wt% 0.01
TOC wt% 0.10
H2O wt% 1.00
1) SO2 can be generated from the sulphides in the preheater 2) Other trace components are not mentioned which make up the deficit up to 100 %.
The compositions of the raw meal and clinker are expressed as oxides, which is the common
practice in the cement industry. Shortened forms are used to simplify the chemical formulae of
the clinker phases, in which:
C = CaO
S = SiO2
A = Al2O3
F = Fe2O3

Page 7
This project has received funding from the European Union's Horizon2020 Research and Innovation Programme under Grant Agreement No 641185. This work was supported by the Swiss State Secretariat for Education, Research and Innovation (SERI)
under contract number 15.0160.
3.2.2 Fuel
In the reference case coal (residue on 90 µm sieve < 15 %) is used as fuel for the clinker burning
process. At many cement plants alternative fuels (e.g. RDF or a mixture from RDF, animal meal
and sewage sludge) are taken into use to replace some of the coal. Fuel characteristics are shown
in Table 3.3. The characteristics of RDF are included for reference purposes.
Table 3.3: Fuel characteristics of coal and RDF
Parameter Unit Coal RDF
Calorific value (LHV) kJ/kg 27,150 22,000
Ash wt% 16.50 9.00
Moisture wt% 0.50 12.00
Cl wt% 0.02 0.40
C wt% 69.00 55.50
H wt% 4.00 8.50
S wt% 0.50 0.15
N wt% 0.48 0.25
O wt% 9.00 14.20
Ash composition
SiO2 wt% 41.40 17.20
Al2O3 wt% 27.30 55.00
TiO2 wt% 1.40 4.60
P2O5 wt% 1.10 0.40
Fe2O3 wt% 4.00 0.80
Mn2O3 wt% 0.10 0.05
CaO wt% 18.20 17.50
MgO wt% 1.70 0.95
SO3 wt% 4.00 0.80
K2O wt% 0.60 0.60
Na2O wt% 0.20 2.10
3.3 Preheater
Cement clinker is mainly produced in dry processes making use of cyclone preheaters. The
cyclone preheater generally consists of three to six cyclone stages (depending on the raw
material moisture) arranged above one another. The raw meal (kiln feed) passes through the
process stages of preheating and calcining in succession from top to bottom before reaching the
rotary kiln. The flow of process gases is essentially counter to the flow of the kiln feed. Each
cyclone stage is made of two parts: the connecting duct which connects each cyclone to the one
above, where the material and gas phase are in direct contact with each other allowing an
extensive heat transfer, and the cyclone itself (Figure 3.2), where the raw meal is separated from
the flue gas due to centrifugal forces.

Page 8
This project has received funding from the European Union's Horizon2020 Research and Innovation Programme under Grant Agreement No 641185. This work was supported by the Swiss State Secretariat for Education, Research and Innovation (SERI)
under contract number 15.0160.
Figure 3.2: Scheme of a cyclone
Depending on the task (dust removal, low pressure drop) of the cyclone different designs are
available. To ensure the function of the preheater, gas velocities of 15 to 20 m/s are necessary in
the gas ducts connecting each stage of cyclone to the upper one. The preheater internal surfaces,
both of connecting ducts and cyclones, are protected internally by a layer of refractory materials,
in form of bricks or in special refractory concrete. Table 3.4 summarizes the reference
parameters of the cyclone preheater.
Table 3.4: Preheater specification
Parameter Unit Value
Preheater cyclone stages No. 5
Preheater strings No. 1
Gas velocity m/s 15.0
Entrance area, cyclone 1 (top of preheater) m2 8.25
Entrance area, cyclone 2 m2 9.80
Entrance area, cyclone 3 m2 10.95
Entrance area, cyclone 4 m2 11.85
Entrance area, cyclone 5 (bottom of preheater) m2 11.85
Raw gas temperature (after preheater) °C 314.0
Raw gas dust load (after preheater) g/m3STP 61.0
Degree of calcination (meal entering the calciner) % 18.0

Page 9
This project has received funding from the European Union's Horizon2020 Research and Innovation Programme under Grant Agreement No 641185. This work was supported by the Swiss State Secretariat for Education, Research and Innovation (SERI)
under contract number 15.0160.
3.4 Calciner
The calcination, which is the decomposition of calcium carbonate to calcium oxide and CO2,
requires around 2/3 of the burning process’ energy demand. By applying a calciner the degree of
decarbonisation of the raw material when entering the kiln could be increased to 90 - 95 %. Due
to the required temperature level of around 900 °C especially low-calorific fuels could be used in
the calciner (however, 100% coal scenario is envisaged in the reference cement kiln, see Chapter
3.2.2). Fuels can be added at different locations in the calciner and combusted flameless.
Calciners have to be fitted with a tertiary air duct (hot air from the cooler bypassing the kiln). In
this way it is possible to burn a high quantity of fuel (up to 65% of the total plant demand).
Moreover a variety of designs are available for different applications, such as low NOx calciner,
with pre-combustion chamber to use difficult fuels etc. In the reference case a simple in-line
design with tertiary air duct was chosen, as shown in Figure 3.3.
Figure 3.3: Scheme of an in-line calciner
In contrast to the other kiln units the gas and material phases are directed in co-current flow. The
kiln exhaust gas entrains the hot meal from the preheater. To lift the material at least 15 - 20 m/s
gas velocities are needed. In order to allow enough reaction time for calcination and the
complete burnout of fuels (mainly if alternative) 3 - 6 seconds of residence time should be
ensured.
The calciner is equipped with one or more burners, sometimes just fuel injectors, placed in
different positions to control the temperature in the best way and prevent NOx formation. The
combustion takes place almost immediately, without the classical flame. The temperature is

Page 10
This project has received funding from the European Union's Horizon2020 Research and Innovation Programme under Grant Agreement No 641185. This work was supported by the Swiss State Secretariat for Education, Research and Innovation (SERI)
under contract number 15.0160.
stable around 900°C which is the decarbonation temperature, mainly due to the very fast heat
absorption of the generated heat by the decarbonation reaction. Also the calciner is internally
protected with a brick lining.
Table 3.5 summarizes the reference parameters of the calciner.
Table 3.5: Calciner specification
Parameter Unit Value
Calciner length m 45.0
Calciner inner diameter m 3.88
Gas velocity m/s 15.0
Residence time s 3.0
Degree of calcination (meal entering the kiln) % 95.0
Material load (at inlet) kg/m3STP 2.05
Coal mass flow kg/h 8,700
Energy input kJ/s 65,160
Tertiary air duct length m 57.0
Tertiary air duct diameter m 2.2
Gas velocity m/s 26.0 – 27.0
3.5 Kiln
The completion of calcination, the formation of the clinker phases and the granulation of the kiln
charge take place in the rotary kiln. The rotary kiln represents therefore the core of a cement
work. Rotary kilns are steel tubes, placed on 2 or 3 roller stations, inclined between 3% and 4%
towards the discharge end, rotating at a rate of about 1.3 to 3.5 revolutions per minute. The
length of the kiln depends on production capacity and the extent of calcination of the raw meal
entering the rotary kiln. Modern rotary kilns with preheater and calciner are 50 m to 80 m long
and have a diameter between three and seven metres. The inside of the rotary kiln is lined with
refractory bricks as the high temperatures in the kiln (gas phase up to 2,000 °C, material 1,450
°C) would otherwise destroy the tube.
Depending on the length of the kiln the gas residence time is 2 to 4 s at temperatures greater than
1,200 °C. The solid material takes 20 to 40 minutes to pass through the kiln depending on the
degree of calcination and the size of the kiln. During its way through the kiln the raw material
components form the mineralogical phases via intermediate phases. Figure 3.4 shows the
intermediate phases along the reference rotary kiln.
Table 3.6 summarizes the reference parameters of the rotary kiln.
Page 11
This project has received funding from the European Union's Horizon2020 Research and Innovation Programme under Grant Agreement No 641185. This work was supported by the Swiss State Secretariat for Education, Research and Innovation (SERI)
under contract number 15.0160.
Figure 3.4: Material conversion of the main components in the reference rotary kiln (material
flow from left to the right, gas flow from right to left). For the explanation of the abbreviated
formulae of clinker phases see Chapter 3.2.1. The x-axis kiln length is given in arbitrary units.
Table 3.6: Kiln specification
Parameter Unit Value
Kiln length m 57.0
Kiln diameter (outer) m 4.04
L/D ratio - 14
Pre-cooling zone m 3.0
Thickness of the refractory m 0.2
Volume load t/(d*m3) 5.2
Thermal load MJ/(s*m2) 3.9
0
10
20
30
40
50
60
70
80
90
100
Ma
teri
al c
on
ve
rsio
n i
n w
t.%
Kiln length
Al2O3 Fe2O3 SiO2 CaO CaCO3 C3S C2S C3A C4AF C2F CA

Page 12
This project has received funding from the European Union's Horizon2020 Research and Innovation Programme under Grant Agreement No 641185. This work was supported by the Swiss State Secretariat for Education, Research and Innovation (SERI)
under contract number 15.0160.
3.6 Main burner
The burner placed at the rotary kiln discharge end is usually called main burner because in the
past all or the major part of the fuel was burned in this part of the process. As mentioned above,
in modern kilns with calciners only around 40 % of the total thermal input is generated here.
It is important to note that fuels used during the clinker production process are experiencing a
full utilization concerning the released thermal energy and introduced material. To achieve this,
the firing systems in cement kilns are properly designed in order to handle various kinds of fuels.
The general design of a kiln burner is shown in Figure 3.5.
Figure 3.5: General design of a cement kiln burner
A portion of the combustion air, called primary air, is used in part to transport the ground coal to
the very end of the burner (the tip of the burner) and in part to control the shape of the flame
(divided in axial air and swirl air). This portion of combustion air is not preheated and it is
necessary to minimize its amount, both because it is better to recover as much preheated air from
the cooler as possible, and because NOx formation is favoured by a high amount of primary air.
The major portion of combustion air is retrieved from the clinker cooler as preheated secondary
air. This secondary air is fed from the outside of the burner through the clinker cooler and then
mixed into the flame.
Flame temperatures in the range of 1,800 - 2,000 °C are required in order to sinter and granulate
the kiln charge and to form clinker phases at kiln charge temperatures higher than 1,450 °C
(Figure 3.6). In order to create suitable temperature profiles a compact, hot and not too long
flame should be formed. The flame shape and the combustion are controlled by combining the
axial momentum flow, the rotation and the divergence of the primary air. An optimum heat
transfer in the kiln by radiation is shown in Figure 3.7.
Technical specifications of the burner in the reference kiln are given in Table 3.7.

Page 13
This project has received funding from the European Union's Horizon2020 Research and Innovation Programme under Grant Agreement No 641185. This work was supported by the Swiss State Secretariat for Education, Research and Innovation (SERI)
under contract number 15.0160.
Figure 3.6: Temperature profile in the reference rotary kiln (material flow from left to the right,
gas flow from right to left); x-axis: kiln length in arbitrary units
Figure 3.7: Radiation heat in the reference rotary kiln (material flow from left to the right, gas
flow from right to left); x-axis: kiln length in arbitrary units
0
500
1000
1500
2000
2500Te
mp
era
ture
[°C
]
Material Material-Surface-Top Gas Dust Wall (outside)

Page 14
This project has received funding from the European Union's Horizon2020 Research and Innovation Programme under Grant Agreement No 641185. This work was supported by the Swiss State Secretariat for Education, Research and Innovation (SERI)
under contract number 15.0160.
Table 3.7: Burner specification1)
Parameter Unit Value Typical Value
Primary air volume % of combustion air 8 -15 8
Primary air temperature °C 30 – 502) 50
Solid fuel injection velocity m/s 15 – 40 30
Fuel to air ratio in transport air kg/kg 2 – 9 5
Primary air velocity at nozzle exit m/s 150 – 250 200
Secondary air velocity
(at burner tip)
m/s 5 -10 (max. 15) 5
Coal mass flow 3) kg/h 5,290
Energy input kJ/s 39,895 1) The values indicated are not set in the VDZ process model, because the VDZ model does not include the burner settings. 2) Temperature increase from ambient due to the compression in the fan. 3) Calorific value: see Table 3-3
3.7 Clinker cooler
Modern plants are mainly equipped with grate clinker coolers. Despite having very different
designs (clinker transport, shape of grate plates, air feed), all grate coolers operate by the same
cooling principle: once discharged from the kiln the clinker lies on a grate and cooling air flows
through it from below, according to a cross flow heat exchange mechanism. The cooler
generates the secondary combustion air, which flows through the kiln hood to the rotary kiln,
and the tertiary combustion air, which flows through a connection located on the hot part of the
cooler or in the kiln hood and then along the tertiary air duct up to the calciner. It is possible to
generate different air flow rates in the different temperature zones of the cooler by using several
fans underneath the grate (Figure 3.8). However, this optimised clinker cooling process means
that grate coolers have an increased specific air requirement, so the excess air must be
discharged as cooler exhaust air or as central exhaust air and dedusted. However, due to its
temperature of up to 400 °C this excess air can be used for drying and energy recovery. Table
3.8 summarizes the reference parameters of the grate cooler.
Figure 3.8: Scheme of a grate clinker cooler

Page 15
This project has received funding from the European Union's Horizon2020 Research and Innovation Programme under Grant Agreement No 641185. This work was supported by the Swiss State Secretariat for Education, Research and Innovation (SERI)
under contract number 15.0160.
Table 3.8: Cooler specification
Parameter Unit Value
Aerated length m 22.0
Aerated width m 3.5
Area load t/(d*m2) 39.0
Specific cooling air volume m3STP/kgclk 1.84
Specific exhaust air volume m3STP/kgclk 1.03
Exhaust air temperature °C 285
Specific secondary air volume m3STP/kgclk 0.23
Secondary air temperature °C 1,137
Specific tertiary air volume m3STP/kgclk 0.58
Tertiary air temperature °C 1,086
Cooled clinker kg/h 125,000
Cooled clinker temperature °C 115
3.8 Flue gas
Flue gas is produced by burning fuel in the rotary kiln and calciner, and by calcination of the raw
meal in the calciner. The flue gas conditions (e.g. flow rate and CO2 concentration) are in
addition to type of kiln and overall plant layout dependent on the amount of air leaking into the
system and on the mode of operation of the raw mill. In CEMCAP we consider two main cases:
• Increasing air leak
• Constant low air leak
These cases are described in detail in Chapter 3.8.4. In the preceding chapters the impact of air
leak and mode of operation is explained, and flue gas conditions for different air leak scenarios
and modes of operation are defined.
3.8.1 Interconnected and direct mode
A cement kiln switches between so-called interconnected and direct mode of operation during
the daily operation, and this has an impact on the resulting flue gas characteristics. The route of
the flue gas through the process in interconnected mode is shown with grey solid arrows in
Figure 3.9. After the preheater the flue gas is sent through a conditioning tower where the
temperature and moisture content of the gas can be controlled by spraying water into the gas.
However, in interconnected mode the amount of water spraying required in the conditioning
tower is small or zero. When the water spraying is zero the conditioning tower is operated like a
simple ductwork. The flue gas is thereafter sent to the raw mill where the residual thermal
energy associated to the flue gas is used to dry the raw mix. After the raw mill the mix of flue
gas and ground raw mix is sent to the filter where the solids are separated from the gas before
the gas is sent to the stack, while the solids are sent to the top stage of the preheater via
homogenization silos and raw meal silos. In this mode the kiln and the raw mill are operating in
a completely interconnected way, as a single machine. A cement kiln is run in interconnected
mode typically 90% of the time during a day (21-22 h/d).
Page 16
This project has received funding from the European Union's Horizon2020 Research and Innovation Programme under Grant Agreement No 641185. This work was supported by the Swiss State Secretariat for Education, Research and Innovation (SERI)
under contract number 15.0160.
The raw mill can be stopped almost every day for visual inspection and control. When the mill is
out of operation the kiln is run in direct mode. The flue gas then bypasses the raw mill and is
sent directly to the dust filter as shown with dashed arrow in Figure 3.9. This mode of operation
is called direct mode because of the direct connection between the kiln and the process filter.
While the mill is stopped, the flue gas coming from the preheater and passing through the
conditioning tower has to be cooled down to a temperature compatible to the one tolerated by
the material of the bag filter, or increased in moisture content up to the point which is necessary
for the highest efficiency of the electrostatic precipitators. In the reference case we assume the
use of a high temperature bag filter that can be operated at temperatures up to 210 °C. The kiln is
typically run in direct mode 10% of the time during a day.
Figure 3.9: Flowsheet of cement kiln with numbered flue gas streams for interconnected
operation. Dashed arrows shows streams relevant for direct operation. The lower cyclone in the
preheating tower is treated as a part of the calciner.
3.8.2 Air leak
At several points along the process the flue gas is diluted by air leaking into the system –
typically at the kiln inlet and outlet, in the calciner, in the preheater stages, and in the raw mill.
Air that has leaked into the flue gas is referred to as "false air". The extent of air leak in the raw
mill at interconnected operation is relatively high, while there is usually not much air leak after
the preheater at direct operation.
The amount of air leak also changes a lot during the classical year of operation. Air leak increase
over the year and is reduced during maintenance periods. Relevant variations over the year are:
• Air leakage at seals between rotating and non-rotating parts is typically doubled during
the year. In a BAT plant the amount of false air in the flue gas at the preheater outlet can

Page 17
This project has received funding from the European Union's Horizon2020 Research and Innovation Programme under Grant Agreement No 641185. This work was supported by the Swiss State Secretariat for Education, Research and Innovation (SERI)
under contract number 15.0160.
be around 6% on dry standard volume basis right after maintenance. After the air leak is
doubled, the false air content has increased to 10%.
• Air leakage in the raw mill can also double during the year. The amount of false air at the
stack can be 30% just after maintenance. Accounting for doubled air leak both at seals
and in the mill the resulting amount of false air at the stack is 46% at the end of the year.
3.8.3 Flue gas conditions
Gas flow rates, temperatures and compositions are available from the VDZ process model for
the gas leaving the rotary kiln (E-100), the calciner (E-200), and the preheater (E-300). It should
be noted that here the lower cyclone in the preheater tower is treated as a part of the calciner.
These data are summarised in Table 3.9. The content of impurities can be back-calculated from
Table 3.12.
Table 3.9: Stream data for gas streams E-100 to E-300 from the VDZ process model
Unit E-100 E-200 E-300
Total flow rate kg/h 61,411 226,504 236,470
Temperature °C 1,078 860 314
Gas composition, wet basis
CO2 vol%STP 20.1 33.2 32.0
N2 vol%STP 70.5 59.2 58.8
O2 vol%STP 1.5 2.8 3.0
H2O vol%STP 6.4 4.9 6.2
SOx (expr. as SO2) mg/m3STP 2,739 499 236
Dust g/m3STP 61
In this part of the plant the effect of increased air leak over the year is relatively small. By
doubling the air leak, exhaust gas flow rate increases by maximum 5%, and gas compositions
change with less than 2 pp. The effect of varying air leak is therefore neglected in the reference
plant in these points.
When it comes to the flue gas at the stack, the variations are higher, both due to switching
between interconnected and direct operation, and due to varying degrees of air leak. Ranges for
gas composition and dust content of the flue gas at the stack (E-600) based on measurements
from a wide range of rotary kiln systems (not assigned to a specific fuel scenario) are available
from a standard document from the Association of German Engineers [VDI, 2003] and provided
in Table 3.10.

Page 18
This project has received funding from the European Union's Horizon2020 Research and Innovation Programme under Grant Agreement No 641185. This work was supported by the Swiss State Secretariat for Education, Research and Innovation (SERI)
under contract number 15.0160.
Table 3.10: Measured gas phase concentrations (with nitrogen as balance) and dust content
(STP, dry basis) at the stack (E-600) for a range of different rotary kiln systems [VDI, 2003].
Exhaust gas component Unit Range
Gas phase composition, dry basis
CO2 vol%STP 14 - 35
O2 vol%STP 5 - 14
CO g/m3STP 0.1 - 2
NO and NO2, expressed as NO2 g/m3STP 0.5 - 0.8
SO2 and SO3, expressed as SO2 mg/m3STP <50 - 400
Organics, expressed as total carbon mg/m3STP 5 - 100
Gaseous inorganic chlorine compounds, expressed as HCl mg/m3STP <20
Gaseous inorganic fluorine compounds, expressed as HF mg/m3STP <1
Dioxins/furans ng I-TEQ/m3STP <0.1
Dust mg/m3STP <5 - 30
For the reference cement kiln, flue gas conditions for interconnected operation with medium air
leak and low air leak, and for direct operation, are defined using the following assumptions:
• Interconnected operation with medium air leak: After the preheater outlet air leak of
139,800 kg/h is assumed in the mill which is double the amount in a BAT reference plant
described by Müller [MÜL, 1993]. The raw material is dried from 6 to 1 wt% moisture
and heated from 15 °C to 60 °C. The raw mill is in operation 90% of the day, giving a
raw material flow rate 1.1 times higher here than at the preheater inlet. This corresponds
to evaporation of 11,822 kg/h of water in the raw mill, and the flue gas is cooled to 110
°C.
• Interconnected operation with low air leak: This case is similar to the "medium air leak"
case, but the air leak is 69,900 kg/h which is the same as in a BAT reference plant
described by Müller [MÜL,1993].
• Direct operation: In this case the air leak after the preheater is assumed to be zero. The
flue gas is cooled to 210 °C (we assume use of high temperature bag filters). This
requires spraying of 9,700 kg/h water in the conditioning tower.
The cost of CO2 capture increases as flue gas flow rate increases and CO2 concentration
decreases. It is therefore likely that there will be more maintenance over the year and focus on
limiting avoidable air leak at a cement kiln where CCS is applied. In reality there are also plants
with far more air leak than defined here, but it is not likely that these plants will be selected first
for application of CCS.
The resulting flue gas properties at the stack (E-600) are summarised in Table 3.11. The dust
content at the stack is subject to environmental regulations, and is assumed to be 10 mg/Sm3STP
in all cases. Impurity concentrations related to a state with 10% O2 are assumed to be the same in
all cases, and are given in Table 3.12. See Chapter 2.2 on how to relate the values in the table to
the cases with O2 content other than 10%.

Page 19
This project has received funding from the European Union's Horizon2020 Research and Innovation Programme under Grant Agreement No 641185. This work was supported by the Swiss State Secretariat for Education, Research and Innovation (SERI)
under contract number 15.0160.
The concentration of NOx is limited to 0.5 g/m3STP by a SNCR system. The NOx reduction is
achieved by injection of ammonia (reducing agent) into the flue gas stream, according to the
following chemical reaction: 4 NO + 4 NH3 + O2 4 N2 + 6 H2O.
Table 3.11: Stream data for the exhaust gas at stack (E-600) for the three cases considered in
CEMCAP. Impurity contents are specified in Table 3.12.
Mode of operation Unit Interconnected Direct
Air leak in mill Medium Low -
Air leak in mill, flow rate kg/h 139,806 69,903 -
Total flow rate kg/h 388,098 318,192 246,170
Temperature °C 110 130 210
Gas phase composition, dry basis
CO2 vol% 20 25 34
N2 vol% 69 67 63
O2 vol% 11 8 3
Gas phase composition, wet basis
CO2 vol% 18 22 29
N2 vol% 63 60 54
O2 vol% 10 7 3
H2O vol% 9 11 13
Dust mg/m3STP 10 10 10
Table 3.12: Impurity concentrations at 10% O2 content.
Component Unit Value
CO g/m3 1
NO and NO2, expressed as NO2 g/m3STP 0.5
SO2 and SO3, expressed as SO2 mg/m3STP 200
Organics, expressed as total carbon mg/m3STP 50
Gaseous inorganic chlorine compounds,expressed as HCl
mg/m3STP 5
Gaseous inorganic fluorine compounds, expressed as HF
mg/m3STP 0.5
Dioxins/furans ng I-TEQ/m3STP 0.05

Page 20
This project has received funding from the European Union's Horizon2020 Research and Innovation Programme under Grant Agreement No 641185. This work was supported by the Swiss State Secretariat for Education, Research and Innovation (SERI)
under contract number 15.0160.
3.8.4 Flue gas base case definition
The flue gas conditions (e.g. flow rate and CO2 concentration) are significantly affected by the
air leaking into the system. Normally the air leak at the cement kiln increases over the year,
while it is decreased by maintenance. If we assume more maintenance over the year it should be
possible to keep the air leak low.
We therefore consider two cases for air leak over the year:
• Increasing air leak (base case)
• Constant low air leak
In the case with increasing air leak it is considered low air leak the first ½ of the year, and
medium air leak the second ½ of the year. In this case the capture system should be designed for
medium air leak, which has a higher flow rate than the process with low air leak. The
performance of the system should be calculated for both flue gas conditions, and average values
for power consumption, steam consumption etc. should be used to calculate KPIs.
In the case with constant low air leak it is considered low air leak the whole year.
In both cases there will be direct operation (mill out of operation) 0-2 hours every day. The
period with direct operation will most likely give a small reduction in the average heat and
power consumption. This will however not be taken into account in the calculation of KPIs.

Page 21
This project has received funding from the European Union's Horizon2020 Research and Innovation Programme under Grant Agreement No 641185. This work was supported by the Swiss State Secretariat for Education, Research and Innovation (SERI)
under contract number 15.0160.
4 CAPTURE TECHNOLOGIES
In this chapter the principles of the relevant capture technologies are explained. For each
technology a list of the relevant process units is given. They are either defined as case specific
units, which are units where specifications must be set individually for the different technologies
(e.g. absorption and desorption columns), or as general process units, where specifications are
set commonly in Chapter 5 (e.g. heat exchangers, pumps and compressors).
4.1 Reference case: MEA absorption
Reactive absorption with aqueous amine solutions as solvent is considered as the most mature
option for CO2 capture. Absorption with amine is the technology used at the first full scale CO2
capture power plant in Boundary Dam in Canada [BOU, 2013]. Absorption with aqueous
solution of monoethanolamine (MEA) is established as reference technology in benchmark
studies of CO2 capture processes, and will be used as the base case also in CEMCAP.
The principle of the technology is shown in Figure 4.1. The solvent (30 wt% MEA) is circulated
between an absorber and a desorber. Flue gas is sent through the absorber, where the CO2 reacts
with MEA and is dissolved in the solvent. The CO2 rich solvent is heated and sent to the
desorber. In the desorber the solvent is regenerated by further heating with a reboiler operated
around 120 °C. The reaction is reversed, and CO2 is released from the solvent. The desorber is
operated at a pressure of 1-2 bars, which means that the purified CO2 is produced at this
pressure. It is sent to further conditioning for transport and storage/reuse by compression or
liquefaction. The CO2 lean solvent is recirculated back to the absorber. The process units
required in the process are listed in Table 4.1.
MEA can separate CO2 at very low partial pressures, and the CO2 is produced at high purity.
However, it requires high thermal energy for regeneration, it is corrosive, and the amine
degrades over time [LIN, 2014].
Figure 4.1: Principle of MEA absorption

Page 22
This project has received funding from the European Union's Horizon2020 Research and Innovation Programme under Grant Agreement No 641185. This work was supported by the Swiss State Secretariat for Education, Research and Innovation (SERI)
under contract number 15.0160.
Table 4.1: List of process units required for MEA absorption
Case specific units General units
Absorber Fan
Desorber Liquid/liquid heat exchangers
Solvent pump
CO2 pump
4.2 Oxyfuel
The oxyfuel technology relies on the combustion with pure oxygen and a recirculation of flue
gas in order to enrich CO2 to an amount which allows a relatively easy purification by
liquefaction systems. For this purpose different integration systems can be chosen, the full and
the partial oxyfuel technology.
Implementing the full oxyfuel concept almost all generated CO2 can theoretically be captured. In
this case the whole plant is operated under oxyfuel conditions. Therefore, all plant units are
influenced by the changed gas atmosphere. The heat transfer, the combustion, the capacity
streams of material and gas as well as the clinker formation are affected due to the different gas
properties like heat capacity, emissivity or density.
Within a joint research project of the European Cement Research Academy (ECRA) a full
concept of an oxyfuel cement kiln has been developed [ECR, 2009]. The principal configuration
of this design uses the conventional technology as the starting point (see Figure 4.2).
Figure 4.2: Configuration of a full oxyfuel cement kiln [ECR, 2009]
CO2 Purification
Transport
CO2 Compression
AirOxidizer
Rotary Kiln
Cooler
Pre-
heater
Pre-
calciner
Raw Mill
Air
Separation
Unit N2
Clinker
Raw Material
Fuel Preparation
Fuel
ORCFilterCO2 rich
flue gas
Air In-leaks
Gas Mixing
Storage
Mixing
gas
Vent
Exhaust air
cleaning
Cond-
enser
CO2 Purification
Transport
CO2 Compression
AirOxidizer
Rotary Kiln
Cooler
Pre-
heater
Pre-
calciner
Raw Mill
Air
Separation
Unit N2
Clinker
Raw Material
Fuel Preparation
Fuel
ORCFilterCO2 rich
flue gas
Air In-leaks
Gas Mixing
Storage
Mixing
gas
Vent
Exhaust air
cleaning
Cond-
enser
AirOxidizer
Rotary Kiln
Cooler
Pre-
heater
Pre-
calciner
Raw Mill
Air
Separation
Unit N2
Clinker
Raw Material
Fuel Preparation
Fuel
ORCFilterCO2 rich
flue gas
Air In-leaks
Gas Mixing
Storage
Mixing
gas
Vent
Exhaust air
cleaning
Cond-
enser

Page 23
This project has received funding from the European Union's Horizon2020 Research and Innovation Programme under Grant Agreement No 641185. This work was supported by the Swiss State Secretariat for Education, Research and Innovation (SERI)
under contract number 15.0160.
The main additional installations required for the oxyfuel kiln are:
• two stage clinker cooler (first stage operated in oxyfuel mode, the second one in air
mode)
• exhaust gas recirculation system
• gas-gas heat exchanger (optionally, a gas-steam heat exchanger)
• condensing unit
• air separation unit (ASU)
• CO2 purification (by liquefaction) unit (CPU)
• rotary kiln burner for oxy-combustion.
In Table 4.2 these units are sorted as case specific units and general units.
Clinker cooler: The first cooler stage is operated with recycled flue gas, which is needed in the
burning process. As this would result in still too high clinker temperatures, a second cooler
stage, which is operated with ambient air, is considered. The air leaves the cooler as exhaust air
and can be used for raw material drying or fuel preparation. A major advantage of using cooler
exhaust air for drying purposes is the fact that e.g. the raw mill must not be operated under air-
tight conditions.
ASU: The oxygen from the ASU mixed with the recirculated CO2 rich exhaust gas is forming
the so-called oxidizer. This is provided to the precalciner and kiln firing (as primary “air”) as
well as to the premixing of cooling gas. For a medium-size cement kiln with a capacity of 3,000
tpd the oxygen demand is estimated to be around 30 to 35 tph. Such amounts of oxygen can for
logistical reasons only be provided by an on-site oxygen supply system.
Recirculation/heat exchanger/condenser: Within the recirculation the flue gas undergoes
different steps like the removal of heat, dedusting and dehydration. Part of the flue gas is
discharged to the CO2 purification unit (CPU) and the residual fraction to the cooler for another
cycle. Heat from the flue gas, which is leaving the preheater, could also be used to increase the
drying potential of the cooler exhaust air by a gas-gas heat exchanger. If the flue gas still
contains enough energy, power can be produced, e.g. by an Organic Rankine Cycle (ORC).
The partial oxyfuel concept concentrates the oxyfuel operation only on the calciner, which is
separated from the kiln units of the plant. In the case of a double line preheater tower one line
could also be switched to oxyfuel operation. This concept takes advantage of the fact that most
of the CO2 emissions are generated in the calciner by a major part of the decomposition of
carbonates (responsible for approx. 60 % of CO2 from cement plants) and fuel input (ca. 60 % of
total fuel input). As the other installations (kiln, cooler, raw mill) are operated conventionally,
this option avoids the increased effort involved with the improvement of seals and does not have
any impacts on the product quality. Due to fewer changes to the kiln plant design and reduced
influence on the plants operation this concept is seen preferably for retrofitting purposes. In this
layout the gas supplied to the calciner possesses lower temperatures compared to conventional
operation, which also affects the overall plant energy efficiency. Higher energy input to the main
burner leads to unabated CO2 . This circumstance and losses by the CPU lead to an overall
capture rate of this technology of 60 %. Therefore the capture efficiency is lower compared to
full oxyfuel operation of the clinker burning process (> 85 %).

Page 24
This project has received funding from the European Union's Horizon2020 Research and Innovation Programme under Grant Agreement No 641185. This work was supported by the Swiss State Secretariat for Education, Research and Innovation (SERI)
under contract number 15.0160.
Figure 4.3: Configuration of a partial oxyfuel cement kiln [IEA, 2008]
Exemplary for the partial oxyfuel technology the configuration of [IEA-08] is explained more in
detail in the following (see Figure 4.3). Oxygen from the air separation unit is supplied premixed
with recycled flue gas before being provided to the calciner. Here the preheated material from
both preheater strings is calcined and then supplied to the kiln for further mineralogical
conversion. Gas from the calciner, which is enriched by CO2 from the material and combustion
gases, is provided to preheater string 2. Preheater string 1 is operated with combustion gases
from the rotary kiln. These combustion gases can be used for the drying of raw material. After
this usage it is released to the environment, while the oxyfuel string gases are captured. As
tertiary air from the grate cooler is not provided to the calciner as usual, it can be used for other
issues like preheating, drying or power generation.
Table 4.2: Case-specific and general units for the oxyfuel process
Case specific units General units
Oxyfuel burner ASU
Two-stage cooler ORC
Heat exchanger CPU
Exhaust gas recirculation system
Condenser unit
4.3 Chilled ammonia
The Chilled Ammonia Process (CAP) follows the same technology principle of MEA
absorption, previously introduced in Chapter 4.1. CAP is a promising technology for post-
combustion CO2 capture and shows competitive energetic performance. The use of aqueous NH3
as a solvent offers advantages concerning global availability, environmental footprint, cost and
chemical stability in the presence of impurities such as SOx and NOx.

Page 25
This project has received funding from the European Union's Horizon2020 Research and Innovation Programme under Grant Agreement No 641185. This work was supported by the Swiss State Secretariat for Education, Research and Innovation (SERI)
under contract number 15.0160.
The overall plant layout, shown in Figure 4.4 is similar to most of the amine-based scrubbing
processes and is subdivided in three main sections: (i) the flue gas cooling section, (ii) the CO2
capture section, and (iii) the ammonia slip abatement section (generally called NH3 water wash).
Following Figure 4.4, the untreated flue gases exiting the Flue Gas Desulfurizer (FGD) are
cooled by means of a direct contact cooler which limits the temperature increase within the CO2-
absorber. The cooled flue gases are then sent to the absorber, where the CO2 content is reduced
by the ammonia solution. The solution is regenerated in the CO2 desorber by heating up the
solution with steam in a conventional kettle reboiler at about 120 - 130 °C. High purity CO2
leaves the column condenser with pressure up to 20 bar and is further conditioned by com-
pression or liquefaction. The decarbonized flue gases are sent to the ammonia control section,
where the NH3 slip is reduced using chilled water. Eventually, the recovered ammonia is
stripped in a dedicated desorber and is re-used in the CO2 capture section.
CAP has been developed and demonstrated at pilot scale by Alstom [GAL, 2006], [GAL, 2008],
[GAL, 2011] in a range of CO2 concentration between 3 and 16 % [TEL, 2011], [KOZ, 2009].
The increased CO2 concentration in the flue gas typical of cement kilns affects the operation of
the entire process. The higher concentration in the flue gas can be compensated with a higher
liquid to gas flow rate ratio, with a higher NH3-concentration of the solvent, with a higher CO2
loading of the solvent, or with a combination of these. Therefore, a significant change in the flue
gas composition requires fundamental modifications and a re-optimization of the existing CAP
design.
Figure 4.4: Chilled Ammonia Process (CAP) layout

Page 26
This project has received funding from the European Union's Horizon2020 Research and Innovation Programme under Grant Agreement No 641185. This work was supported by the Swiss State Secretariat for Education, Research and Innovation (SERI)
under contract number 15.0160.
The CAP plant operating conditions strongly affect the chemical behavior of the process: solid
phases, primarily consisting of ammonium carbonate and bicarbonate, may form in the absorber
and in related units. In the existing CAP plants the solid formation has been strictly avoided due
to the complexity of handling solids and the operational issues related to the clogging of
equipment. Nevertheless, solid formation offers different advantages: i) reduction of stripper
heat requirement; ii) reduction of the stripper dimension; and iii) reduction of the ammonia slip
from the absorber. Accordingly, the performance of the process can be improved when
exploiting the formation of solids in a so-called 2nd generation CAP.
As shown in Figure 4.5, the plant layout of the 2nd generation CAP differs from the standard
CAP in the CO2 capture section. The rich solution leaving the absorber is introduced to a solid
formation section where the solution is cooled and chilled in two subsequent crystallizer units.
Solid phase forms at low temperature and the generated suspension is separated in a hydro-
cyclone into (i) a rich slurry, which is sent to the regeneration, and (ii) a clear solution, which is
recycled to the absorber. The absorber with its sophisticated structured packing, however,
remains free of solids.
Figure 4.5: CO2 capture section layout of the 2nd generation CAP
A list of process units involved in this technology is given in Table 4.3, where case specific units
are those which need to be specifically designed in CEMCAP while general specifications fixed
at this stage of the project will be used for general units.
Cooled flue gas
CO2 depleted flue gas
Absorber recirculation
CO2 lean solution
CO2 Rich solution
CO2
CO2
absorber
CO2
desorber
Crystallizer

Page 27
This project has received funding from the European Union's Horizon2020 Research and Innovation Programme under Grant Agreement No 641185. This work was supported by the Swiss State Secretariat for Education, Research and Innovation (SERI)
under contract number 15.0160.
Table 4.3: List of process units required in CAP
Case specific units General units
Direct contact cooler Pump
CO2 absorber Heat Exchanger
CO2 desorber Flue gas blower
CO2 post-treatment column
NH3 absorber
NH3 desorber
Crystallizer*
Hydrocyclone*
* only required for 2nd generation CAP
4.4 Membrane assisted liquefaction
Membrane-assisted CO2 liquefaction is based on the principle of combining two different
separation technologies, none of which are perfectly suited for stand-alone capture of CO2 at low
to medium concentration in flue gases, so that each can carry out a partial separation within its
favorable regime of operation. Polymeric membranes are generally suited for bulk separation of
CO2 resulting in moderate product purity. Low-temperature separation, on the other hand, is
very well suited for purification of CO2 of moderate-to-high feed purity through condensation of
CO2 and removal of the volatile components nitrogen, oxygen etc. by phase-separation.
A simplified process scheme for the combination of membrane bulk separation and low-
temperature CO2 purification is shown in Figure 4.6. An exemplified process configuration for
the liquefaction unit is shown in Figure 4.7.
Figure 4.6: Simplified process scheme for membrane-assisted CO2 liquefaction
Membrane system
Compression and
conditioning
Cooling
Separation
Flue gas
Captured CO2
Exhaust
Permeate with
intermediate
XCO2

Page 28
This project has received funding from the European Union's Horizon2020 Research and Innovation Programme under Grant Agreement No 641185. This work was supported by the Swiss State Secretariat for Education, Research and Innovation (SERI)
under contract number 15.0160.
Water Water
IC IC
CO2 feed from
membrane unit
Water
IC Chiller
Waste gas
expander
Waste gas
expander
Dehyd.
Pressurised
CO2
Refrig. Refrig.
Figure 4.7: Example of possible process configuration for low temperature CO2 condensation
Membrane separation is conceptually a very simple process where the driving force for
separation is the component partial pressure differential across the membrane. The purity and
capture ratio attainable from a single stage membrane process depends on the membrane
properties such as membrane permeability and selectivity and involves a trade-off between
driving forces across the membrane (attained by pressure manipulations of the feed and
permeate streams) and the membrane area.
Efficient separation of CO2 from volatile components, in this case primarily nitrogen and
oxygen, by liquefaction requires compression and cooling of the feed stream. The obtainable
CO2 capture ratio is governed by the vapour–liquid equilibrium for the system. The CO2 capture
ratio strongly depends on the separation pressure (typically 20 - 40 bar) and temperature
(typically around -55 °C). The energy- and/or cost-optimal CO2 capture ratio is also highly
dependent on the CO2 concentration in the permeate gas from the membrane unit. The trade-off
involved in the liquefaction process is thus between compression required prior to liquefaction
and the refrigeration utility.
Thus, for a given CO2 product purity and capture ratio of the overall process, the following
membrane and process parameters will require to be "optimised":
• CO2 capture ratio of the membrane process and liquefaction process
• Membrane properties (permeability and selectivity)
• Membrane permeate CO2 purity
• Membrane feed pressure and permeate pressure
• Membrane area
• Compression level prior to liquefaction process1
• Refrigeration utility
1 For a given capture ratio defined for the liquefaction process this is set by the condensation temperature

Page 29
This project has received funding from the European Union's Horizon2020 Research and Innovation Programme under Grant Agreement No 641185. This work was supported by the Swiss State Secretariat for Education, Research and Innovation (SERI)
under contract number 15.0160.
A significant advantage for the principle of membrane-assisted CO2 liquefaction is that there is
no requirement for process steam, which is normally not available in cement factories. The
process will in principle depend on electric power only, which is readily available in most cases.
A list of process units required in the process is given in Table 4.4. For the membrane part
several commercial membrane types exist, but it is likely that facilitated-transport membranes,
currently under development, will become the preferred technology.
Table 4.4: List of process units required in membrane-assisted CO2 liquefaction
Case specific units General units
Membrane unit: Membrane unit:
Membranes Filters and gas cleaning units
Fan or compressor
(Vacuum pump)
Liquefaction unit:
Compressors and intercoolers
Dehydration unit
Heat exchangers
Phase separators
Gas expanders
Liquid CO2 pumps
Industrial refrigeration units
4.5 Calcium looping
The Calcium Looping (CaL) process has been proven as an effective and cost-effective
technology for post-combustion CO2 capture in power plants [ARI, 2013]. It is based on the
reversible reaction between a CaO-based sorbent and CO2 in a flue gas, and in the subsequent
calcination of the CaCO3 formed in a separate reactor to regenerate the CaO and release the CO2
as a concentrated gas stream. This technology has been developed in the last years from a
concept paper to a pilot-scale of up to 1.7 MWth in the framework of different European,
national and industrial research projects, which have allowed carrying out progress at different
levels: particle reaction fundamentals [ABA, 2003], [GRA, 2006] reactor testing and scale-up,
[ARI, 2013], [ABA, 2004], [ALO, 2010], [CHA, 2011], [DIE, 2013], and process modeling
[ROD, 2008], [ROD, 2012].
Main advantage of this technology is that it is a high temperature process (carbonator: ~ 650 °C;
calciner: ~ 900 °C) so it allows recovering most of the heat introduced for sorbent regeneration
as high temperature heat, which can be used for steam production. Due to its wide availability,
cost and CO2 carrying capacity, limestone is usually proposed as natural precursor of CaO. Coal
is typically proposed to be burnt under oxy-combustion conditions in the calciner for supplying
the energy needed for regenerating the sorbent. Consequently, a solid purge would be needed in
the CaL process to avoid coal ashes and sulphur accumulation in the solid loop, as well as to
eliminate deactivated CaO. This fact allows a synergy with cement industry by using purged
material (mainly CaO) as raw material for clinker production.

Page 30
This project has received funding from the European Union's Horizon2020 Research and Innovation Programme under Grant Agreement No 641185. This work was supported by the Swiss State Secretariat for Education, Research and Innovation (SERI)
under contract number 15.0160.
In this project, the direct integration of a CaL system into a cement kiln is analysed, whose
implications for cement and CaL process have only been theoretically analysed up to date [ROD,
2008], [ROM, 2013], [ROM, 2014]. The CaL configurations that are sufficiently mature to be
demonstrated within CEMCAP are those involving oxy-combustion conditions in the calciner
(represented in Figure 4.8 and Figure 4.9), and they are analysed in this project. Basically these
CaL configurations differ on the type of reactors used for the carbonator and calciner. In both
cases, heat recovery (not shown in the figures) should be performed from the walls of the
carbonator and from cooling the carbonator and calciner off-gases. While heat from the
carbonator will be recovered by producing steam, heat in the gas streams may be recovered both
by preheating the raw meal in direct contact suspension preheaters or by feeding the heat
recovery steam cycle. The optimal heat recovery strategy will depend on techno-economic
parameters and will be object of the activity performed in CEMCAP.
Figure 4.8: CaL process integration into a cement kiln operated in twin circulating fluidised bed
reactors
Figure 4.9: CaL process integration into a cement kiln operated in entrained-flow reactor
technology
(Cyclo
ne
)
Pre
he
ate
r
Rotary KilnCooler
Fuel
Air
Clinker
FB
Ca
rob
na
tor
FB
Ca
lcin
er
CO2 lean
Flue GasCO2 rich Gas
Flue Gas
Limestone
(CaCO3)
Fuel
O2 CaO
Raw Meal
Marl / Clay
Additive

Page 31
This project has received funding from the European Union's Horizon2020 Research and Innovation Programme under Grant Agreement No 641185. This work was supported by the Swiss State Secretariat for Education, Research and Innovation (SERI)
under contract number 15.0160.
In the first analyzed configuration (Figure 4.8), carbonator and calciner reactors are two
interconnected fluidised bed reactors. As mentioned before, this type of reactor technology has
already been demonstrated at a pilot scale of 1.7 MWth in post-combustion CO2 capture
applications in power plants. When integrated into a cement kiln, solids purged from calciner
(dashed line in Figure 4.8), which are basically composed of CaO, are incorporated into the
cement preheater for partially substituting the raw meal needed for clinker production. Doing so,
CO2 emissions associated with raw meal calcination are consequently reduced. This type of
reactor technology usually operates with particle sizes in the range of 100 to 600 m, which is
high compared to the particle size of 50 m needed for producing clinker. Therefore, to be able
to use the solid purge into the cement production process, CaL solid purge may need to be
cooled down and milled. One goal of the project is to investigate if smaller sized particles up to
200 µm can be used in existing fluidized bed reactors and if these particle sizes can be directly
used for cement production.
The second analyzed configuration (shown in Figure 4.9) proposes the use of entrained flow
reactors for the carbonator and the calciner reactors in the CaL process [MAR1, 2012], [MAR2,
2012] This reactor concept, which has not been experimentally demonstrated yet, fulfills cement
process requirement of fine calcined materials (30-50 m) and any intermediate solid handling
device is therefore avoided. Moreover, it exploits the synergies with mature cement process
technologies like raw meal precalciner systems.
A list of process units required in the process is given in Table 4.5. In addition to the case
specific units, which are the two reactors characterizing the process, general units include fans,
cyclones for gas-solid separation at reactors outlet and a heat recovery steam cycle, including its
heat exchangers to recover excess heat from the carbonator and calciner off-gases.
Table 4.5: List of process units required in the Calcium Looping process
Case specific units General units
Oxyfuel calciner Fans
Carbonator reactor Cyclones
Heat recovery steam cycle and heat exchangers

Page 32
This project has received funding from the European Union's Horizon2020 Research and Innovation Programme under Grant Agreement No 641185. This work was supported by the Swiss State Secretariat for Education, Research and Innovation (SERI)
under contract number 15.0160.
5 PROCESS UNIT SPECIFICATIONS
In this chapter operating specifications are given for standard process units that are used in
several of the capture processes. This is done to ensure consistency between process simulations
of the respective processes.
5.1 Heat exchangers
Minimum pinch point temperature differences vary with the heat exchanging fluids. Values for
different types of heat exchangers are specified in Table 5.1. The values are also dependent on
factors such as size, pressure, composition and metallurgy, and the values presented here should
be considered as guidance.
Table 5.1: Minimum pinch point temperature difference (ΔT) for heat exchangers
Operating temperature Fluids Minimum ΔT
Above ambient temperature Dusty gas/gas 40 °C
Dusty gas/liquid 80 °C
Liquid/liquid 10 °C
Reboiler 10 °C
Condenser1) 10 °C
Below ambient temperature General minimum 3 °C
Boiling liquid/condensing liquid2) 5 °C
1) Intercoolers in multistage compression is included in this category due to some condensation of water. 2) For sections of heat exchangers with single-component mixtures at constant boiling and condensation temperature.
Pressure drop in heat exchangers is dependent on phase. Usually liquid phase pressure drop is
absolute while gas pressure drop depends on the gas pressure.
• Liquid phase pressure drop for cold and hot side: 0.04 MPa
• Gas phase pressure drop for cold and hot side: 2 % of inlet pressure
Assumptions related to HRSGs can be found in Table 6.8 in Chapter 6.3.
5.2 Separators
Pressure drop in knock-out drums in compressor trains can be neglected. Pressure drop in other
types of separators has to be estimated for each particular case.
5.3 Pumps, fans, compressors and expanders
Guidance values for efficiencies of pumps, fans, compressors and expanders are given in Table
5.2. The exact efficiencies will depend on the exact type of unit, the size, and on the operating
conditions. For the sake of simplicity, one approximate value is set for each type of unit.

Page 33
This project has received funding from the European Union's Horizon2020 Research and Innovation Programme under Grant Agreement No 641185. This work was supported by the Swiss State Secretariat for Education, Research and Innovation (SERI)
under contract number 15.0160.
Table 5.2: Efficiencies for pumps, fans and compressors; the
values given can be considered as BAT values
Efficiency Value
Pump efficiency 80%
Isentropic efficiency compressors 85%
Isentropic efficiency expanders 85%
Fan efficiency 85%
Driver efficiencies should be 95%. In case expanders will be used to generate electric power,
similar mechanical and generator efficiencies as used in integrated power production (Chapter
6.3) should be used.
5.4 Filters
For process dust abatement two main technologies are available: electrostatic filters (ESP) and
bag filters. Both technologies are suitable for the cement kiln gas, having different strong and
weak points. The ESP has low efficiency when the gas stream parameters are far from the steady
operating conditions, namely start up and shut down periods, while the bag filter is very sensi-
tive to the gas temperature and moisture content; different types of filtration media are available,
but in any case the highest temperature can’t be higher than 260 °C. Filtration efficiency is very
high for both technologies, with residual dust content after treatment below 10 mg/m3STP (dry
state, 10% O2). The total pressure drop for an ESP is in general, at a gas velocity of 1 m/s,
around 0.6 – 0.7 kPa, while for a fabric filter it is 1.2 – 1.5 kPa (0.7 – 0.8 kPa on the filter media
and the rest on the filter casing). Additional electrical energy is necessary for ESP to create the
electrostatic field between the electrodes, while for fabric filters compressed air is necessary to
clean the bags and to operate a gas conditioning system (by water injection or by air to gas heat
exchanger). In the end both solutions are consuming 1.5 – 2 kWh/tclk for the kiln-raw mill
application (main process emission). This range is valid for installation at a wide range of plants,
with plant sizes from 2,000 up to 5,000 tclk/d. Maintenance costs are in favour of bag filters,
mainly due to the higher complexity of an ESP.

Page 34
This project has received funding from the European Union's Horizon2020 Research and Innovation Programme under Grant Agreement No 641185. This work was supported by the Swiss State Secretariat for Education, Research and Innovation (SERI)
under contract number 15.0160.
6 CO2 CAPTURE UTILITIES
6.1 Steam
Steam generation is needed in case of CO2 capture by absorption, in order to regenerate the CO2-
rich solvent. Waste heat available from cement production process will be used to raise steam
for this scope. However, it is expected that waste heat available will not be sufficient to provide
the entire heat duty required. Therefore, additional steam generation systems will have to be
included.
Two options will be considered in CEMCAP for this scope, namely: (i) steam import from an
external CHP plant, and (ii) steam generation in a natural gas-fired boiler. In the last case,
preference to a natural gas-fired systems is given in order to limit additional CO2 emissions from
fuel combustion and avoid high cost dedicated devices for the control of the emissions of other
pollutants such as SOx, NOx and particulate matter (PM).
6.1.1 Steam produced from heat recovery in the cement power plant
In this case, the heat required to produce the steam is available in the process and needs to be
recovered to produce the steam for the capture process. While no climate impact or fuel cost is
considered, investment and operating cost associated with the recovery are included. The
investments for the waste heat recovery system is based on an investment cost of 0.45 M€/MW
suggested from industrial experience.
6.1.2 Steam import from external coal CHP plant
The steam, in this case, is assumed to be bought from a coal power plant near the cement plant
location. The steam is assumed to be extracted from the steam flow entering the low pressure
(LP) steam turbine of the power plant. Heat to power conversion efficiencies are calculated by
considering expansion of steam at initial pressure and temperature of 4 bar and 220 °C,
condenser pressure of 0.1 bar, turbine isentropic efficiency of 90% and electrical-mechanical
efficiency of the generator of 98%. The cost and climate impact of the steam are based on the
lost electricity revenues that the power plant would have received from producing and selling the
corresponding electricity. While the climate impact of the steam is based on the climate impact
of the electricity it would have produced [ANA, 2011], the economic value of the electricity is
based on the average European price presented in Chapter 6.2. The results are summarised in
Table 6.1.
In practice, less than 10 % of European existing cement plants are located near a coal power
plant and therefore this option is not the most representative alternative. However in the case of
a new cement plant to be built with CCS, this alternative could significantly lower the CO2
capture cost associated with the cement plant.
Table 6.1: Cost and climate impact for steam
Steam temperature [°C]
Calculated efficiency for conversion to power [%]
Steam cost
[€/MWhth]
Steam climate impact
[kgCO2/MWhth]
100 13.3 7.7 101
120 17.8 10.3 136
140 22.3 13.0 170

Page 35
This project has received funding from the European Union's Horizon2020 Research and Innovation Programme under Grant Agreement No 641185. This work was supported by the Swiss State Secretariat for Education, Research and Innovation (SERI)
under contract number 15.0160.
6.1.3 Natural gas-fired boiler
In case of steam generated in a natural gas fired boiler, natural gas consumption will be
evaluated by simply assuming a boiler efficiency of 90% (LHV basis). Boiler efficiency will not
depend on the pressure of the steam generated, assuming that air preheating temperature can be
adjusted depending on the temperature of the combustion gases exiting the evaporator tubes. The
cost of this option is largely dominated2 by the cost of natural gas.
Steam produced from this option is more expensive than the external steam supply by a coal
CHP plant. However, this option results in lower CO2 emissions, is more flexible in term of
range of capacity available and can easily be installed on-site. The cost of this option is based on
the fuel cost presented in Chapter 9.5.2, the boiler efficiency and the investment and the
operating cost are based on the cost of a natural gas boiler. The climate impact of this option is
based on a natural gas emission factor defined in Chapter 6.2.1 and the boiler efficiency of 90%.
6.1.4 CO2 emissions and cost
The cost and climate impact associated with the different options to produce steam presented
above are gathered in Table 6.2. By default, the steam from heat recovery of the cement kiln is
considered up to the amount available. If steam is required in addition to what can be extracted
from the heat recovery in the cement kiln, it is assumed to be produced by a Natural Gas Boiler
as this option is more probable than the import of steam imported from a coal power plant.
However sensitivity analyses will be performed to address the influence of the steam cost on
CO2 capture cost of the different technologies.
Table 6.2: Cost and climate impact for steam
Steam source Steam cost
[€/MWhth]
Steam climate impact
[kgCO2/MWhth]
Waste heat available on the plant 8.5 0
External CHP steam plant at 100°C 7.7 101
External CHP steam plant at 120°C 10.3 136
External CHP steam plant at 140°C 13.0 170
Natural gas boiler 25.3 224
2 An overnighted CAPEX of 9.5 M€ is estimated for a 150 MWth boiler resulting in investment and maintenance
cost of 1.3 €/MWthh over the project economic duration.

Page 36
This project has received funding from the European Union's Horizon2020 Research and Innovation Programme under Grant Agreement No 641185. This work was supported by the Swiss State Secretariat for Education, Research and Innovation (SERI)
under contract number 15.0160.
6.2 Electricity
6.2.1 Reference efficiency and CO2 emission
Reference efficiency and emissions associated to power generation are needed to quantify the
indirect primary energy consumption and indirect CO2 emissions associated to electricity
consumptions or production within the cement plant (see Chapter 10.1).
A first approach for defining the reference efficiency and emissions is to consider the average
values for electricity production in the EU-28. In this approach, fuels emission factors in Table
6.3 [IEA, 2005] and fuel consumptions and electricity production in Table 6.4 [EUR1] have
been considered as primary data. From these data, the average electric production efficiency and
CO2 emissions have been calculated, as reported in the last two columns of Table 6.4. In
particular, average electric efficiency of 45.9% and average CO2 emissions of 262 kg/MWh have
been calculated for the whole EU-28 non-CHP power generation system in 2014. Considering
only fossil fuel power generation, efficiency of 40.6% and emissions of 776 kg/MWh have been
calculated.
A second approach for defining reference efficiency and emissions is to consider typical values
for representative technologies and fuels. Such an approach is justified by the fact that, from an
LCA (life cycle assessment) perspective, the actual emissions and primary energy consumption
associated to flows of electricity between the cement plant and the grid will depend on the
specific technologies used to balance the variation of the power exchanged with the grid.
Therefore, a wide variability can be expected from case to case and from country to country,
depending on the local market conditions and the regional power generation technologies. Due
to this variability, it is recommended to perform a sensitivity analysis considering the different
power generation cases reported in Table 6.5. Note that in the case of renewables, the definition
of primary energy is not straightforward. Therefore, two different approaches are considered.
The first approach is the "physical energy content method", which is used for energy statistics by
IEA and Eurostat [IEA2, 2016], [IEA, 2017], [EUR, 2017]. In this approach the primary energy
is defined as the first energy flow in the production process that has a practical energy use. For
geothermal and solar thermal power the primary energy is then heat, while for solar
photovoltaic, wind, hydro, tide, wave, and ocean power, the primary energy is the produced
electricity. Since the share of geothermal and solar thermal power plants for electricity
generation is small in Europe, this contribution is neglected, and we end up with a reference
efficiency of 100%. In the other approach, only fossil energy is counted as primary energy. This
corresponds to setting the reference efficiency of renewables to infinity.
Table 6.3: Reference CO2 emission factor from using different fuels [IEA, 2005]
Fuel source CO2 emission factor, cCO2, tCO2/TJfuel_LHV
Hard coal 94.6
Lignite 101.2
Oil shale and oil sand 106.7
Oil 78.5
Natural gas 56.1
Refinery gas 66.7
Nuclear/Renewables 0
Waste (non-renewable) 98.1

Page 37
This project has received funding from the European Union's Horizon2020 Research and Innovation Programme under Grant Agreement No 641185. This work was supported by the Swiss State Secretariat for Education, Research and Innovation (SERI)
under contract number 15.0160.
Table 6.4: Electricity generation in EU-28 in 2014 in non CHP power plant
Fuel 2014 electricity production, E, GWh [EUR1]
2014 fuel consumption, E,
TJLHV [EUR1]
2014 average electric
efficiency, % (calculated)
CO2 emission factor, kg/MWh
(calculated)
Hardcoal and derivatives 352,931
3,246,292 39.1 870.1
Lignite and derivatives 229,815
2,227,256 37.1 980.8
Oil shale and oil sand 10,022 110,523 32.6 1176.7
Oil w/o refinery gas 11,116
101,658 39.4 717.7
Natural Gas 231,142
1,712,945
48.6 415.7
Refinery gas 151 1,188 45.8 525.0
Nuclear 849,485 9,267,109* 33.0* 0
Renewables 830,117 2,988,421* 100.0* 0
Waste (non-renewable) 11,530 143,447 28.9 1220.0
Total 2,526,309 19,798,839 45.9 262
Total, fossil fuels only 835,177 7,399,862 40.6 776
* efficiency of 33% for nuclear and 100% for renewables is assumed, in agreement with [IEA2, 2016]. Primary
energy consumption calculated from the assumed efficiency.
Table 6.5: Reference efficiency and CO2 emission factor for power generation technologies, to
be considered in the calculation of the key performance indicators. For fossil fuel power
generation, CO2 emissions factors have been calculated from the assumed electric efficiency and
the fuel emission factors in Table 6.3.
Power generation technology Electric efficiency, % CO2 emission factor, kg/MWh
Pulverized coal, state of the art [EUD, 2004] 44.2 770
Pulverized coal, sub-critical 35.0 973
Natural gas combined cycle [EUD, 2004] 52.5 385
Renewables (physical energy content method) [IEA2, 2016], [IEA, 2017], [EUR, 2017]
1 0
Renewables (only fossil primary energy) ∞ 0

Page 38
This project has received funding from the European Union's Horizon2020 Research and Innovation Programme under Grant Agreement No 641185. This work was supported by the Swiss State Secretariat for Education, Research and Innovation (SERI)
under contract number 15.0160.
6.2.2 Cost of electricity
The cost of electricity for an industrial customer depends on the amount of energy required in a
year. The electricity demand in a cement plant ranges typically from 90 to 150 kWh/tcement
[BREF, 2013]; ECRA’s reference case consumes 97 kWh/tcement. Considering (i) ECRA’s
reference plant size, (3,000 tclk/d), (ii) a clinker/cement ratio equal to 0.737, and (iii) 90 %
annual run factor, we can obtain the yearly electric consumption as:
𝐸 =𝑄𝑐𝑙𝑖.
𝑠𝑒𝑐𝑒𝑚𝑒𝑛𝑡 ∙
8760 ∙ 𝜑
24 kWh/y
where
- Qclk is the amount of clinker produced per day [tclk/d]
- s is the clinker to cement mass ratio
- ecement is the specific electric consumption [kWh/tcement]
- φ is the annual cement run factor
Accordingly, ECRA’s reference plant consumes about 130,000 MWh/y. Given the plant size
variability along with the different specific electric consumptions, three different industrial
consumers’ ranges are considered for indications on the cost of electricity [EUR2]:
- Band IE: 20,000 < E <70,000 MWh/y
- Band IF: 70,000 < E < 150,000 MWh/y
- Band IG: E > 150,000 MWh/y
Results are shown in Table 6.6.
In cases in which electricity can be produced in the plant and can be sold outside of the battery
limit of the plant, it will be credited with the electricity cost corresponding to the associated
consumer band.

Page 39
This project has received funding from the European Union's Horizon2020 Research and Innovation Programme under Grant Agreement No 641185. This work was supported by the Swiss State Secretariat for Education, Research and Innovation (SERI)
under contract number 15.0160.
Table 6.6: Cost of electricity (€/kWh) for three different yearly energy demands in 2013 and
2014 [EUR2]. The cost for each country is the sum of the energy price and tax. The "Median
EU28" is the sum of the median energy price and the median tax.
Country 20,000 < E < 70,000 MWh/y 70,000 < E < 150,000 MWh/y E > 150,000 MWh/y
2013 2014 2013 2014 2013 2014
Belgium 0.0685 0.0642 0.0641 0.0635 n/a n/a
Bulgaria 0.0469 0.0529 0.0445 0.0474 0.0442 0.048
Czech Republic 0.0503 0.0434 0.0507 0.0411 n/a n/a
Denmark 0.0491 0.0339 0.0483 0.0339 n/a n/a
Germany 0.0953 0.0949 0.0818 0.087 n/a n/a
Estonia 0.0566 0.0529 0.0548 0.0541 n/a n/a
Ireland 0.0871 0.0799 0.0784 0.0753 n/a n/a
Greece 0.0868 0.0695 0.0633 0.0487 n/a n/a
Spain 0.0824 0.0779 0.0723 0.073 0.0627 0.064
France 0.0551 0.0566 0.0459 0.0455 n/a n/a
Croatia 0.0487 0.0474 0.0524 0.0476 n/a n/a
Italy 0.1283 0.1288 0.1076 0.1072 0.0956 0.0864
Cyprus 0.1532 0.1404 0.1506 0.1392 n/a n/a
Latvia 0.0749 0.075 0.0727 0.0772 n/a n/a
Lithuania n/a 0.0841 n/a n/a n/a n/a
Luxembourg 0.0531 0.0514 n/a n/a n/a n/a
Hungary 0.0719 0.0649 0.0664 0.0633 0.0702 0.0607
Malta 0.1203 0.1194 0.1229 0.1136 0 n/a
Netherlands 0.0576 0.0501 0.0567 0.0495 n/a n/a
Austria 0.0719 0.0686 0.07 0.0641 n/a n/a
Poland 0.0536 0.0486 0.0529 0.0464 0.052 0.0445
Portugal 0.0685 0.0664 0.0602 0.061 n/a n/a
Romania 0.0418 0.0422 0.0454 0.0493 n/a n/a
Slovenia 0.0641 0.0578 0.0629 0.0573 n/a n/a
Slovakia 0.0547 0.0485 0.0569 0.0486 0.0532 0.0472
Finland 0.0547 0.0501 0.0541 0.05 n/a n/a
Sweden 0.0478 0.0427 0.0455 0.0396 n/a n/a
United Kingdom 0.0787 0.0868 0.0774 0.0859 0.0767 0.0837
Liechtenstein n/a n/a n/a n/a n/a n/a
Norway 0.0526 0.0469 0.0501 0.0448 n/a n/a
Montenegro 0.041 0.0388 n/a n/a n/a n/a
Serbia 0.0346 0.0447 0.0312 0.0467 n/a n/a
Turkey 0.061 0.0596 0.0607 0.0583 0.0625 0.0576
Bosnia and Herzegovina 0.0354 n/a n/a n/a 0.0478 n/a
Median EU28 0.0558 0.0548 0.0558 0.0509 0.0569 0.0581

Page 40
This project has received funding from the European Union's Horizon2020 Research and Innovation Programme under Grant Agreement No 641185. This work was supported by the Swiss State Secretariat for Education, Research and Innovation (SERI)
under contract number 15.0160.
6.3 Integrated power production
For oxyfuel and CaL capture technologies, a significant amount of waste heat is available from
the process. In order to achieve good process efficiencies, such heat can be recovered by feeding
a heat recovery steam cycle. The size of such a steam cycle may vary depending on the cement
kiln configuration and the thermal integration of the capture section with the raw meal
preheating process. Depending on the thermal input of the steam cycle, as well as on the tempe-
rature profile of the waste heat available, different steam parameters and turbine efficiencies
have to be expected according to economic considerations. As a general rule, the smaller the
steam cycle, the lower the maximum steam pressure and temperature, the lower the steam
turbine isentropic efficiency due to scale effects.
In conventional cement kilns, heat recovery steam cycles are very seldom adopted, due to the
small amount of waste heat normally available. In order to define the parameters to be adopted
in the simulation of steam cycles for oxyfuel and CaL cement kilns, reference can be made for
example to waste-to-energy (WTE), biomass and small fossil fuel-fired power plants, charac-
terized by plant sizes in a wide range.
A rather complete picture of the steam cycle parameters adopted in WTE plants as function of
size is available in [CON, 2012], which constitutes the basis for the definition of the steam cycle
parameters used in CEMCAP. Since the definition of WTE steam cycle parameters is constrai-
ned by hot corrosion issues related to the presence of chloride and other chemically aggressive
species in the flue gas, steam cycle parameters have been defined also based on the information
reported in [ANS], [SPL, 2010], [JAC, 2009], [TSC, 2003], [ALS].
Steam cycle parameters as function of thermal input are reported in Table 6.7, while steam
turbine efficiencies for WTE plants are shown in Figure 6.1. In Table 6.8, the other assumptions
for the calculation of the steam cycles are reported. To facilitate the reproducibility of the steam
cycle balances, the material and energy balances for three representative sizes of 12.5, 100 and
300 MW of thermal input are reported below as calculated with the Polimi in-house process
simulation tool GS [GSS]. The flowsheet of the power plant is shown in Figure 6.2, the energy
balances are reported in Table 6.9 and the properties of the streams in Table 6.10, Table 6.11 and
Table 6.12.
It should be noted that the material and energy balances of the CEMCAP steam cycles will
likely differ from those reported here, since low temperature heat recovery will be possible so
that part (or all) the feedwater preheating may be performed through such heat recovery.
Therefore, data reported here should be used just as a way to calibrate and validate steam cycle
models implemented in different process simulation tools.
Table 6.7: Steam cycle parameters as function of thermal input
Nominal thermal input, MW 12.5 25 50 100 200 300
Steam pressure at turbine inlet, bar 30 40 60 80 100 125
Steam temperature at turbine inlet, °C 350 400 460 480 530 565
LP regenerative condensate preheater No No Yes Yes Yes Yes
Feedwater temperature at boiler inlet, °C 120 120 140 140 140 140
Estimated turbine isentropic efficiency, % 70.0 75.0 78.0 80.8 85.6 86.8

Page 41
This project has received funding from the European Union's Horizon2020 Research and Innovation Programme under Grant Agreement No 641185. This work was supported by the Swiss State Secretariat for Education, Research and Innovation (SERI)
under contract number 15.0160.
Figure 6.1: Steam turbine isentropic efficiency as function of size for WTE plants [CON, 2012]
Table 6.8: Assumptions for the calculation of the heat recovery steam cycle
Parameter Value
Reheat NO
Pressure drop in economizer, bar 20
Pressure drop in superheater 8%
Pressure drop in turbine admission valve 5%
Condensing pressure, bar 0.07
Feedwater pump hydraulic efficiency 75%
Feedwater pump mechanical-electric efficiency 94%
Steam turbine mechanical-electric efficiency @ 3,000 RPM 97%
Steam turbine mechanical-electric efficiency with gearbox 94%
LP steam bleeding pressure (if LP feedwater preheater activated), bar 0.7
Pressure drop of the bled steam for feedwater heating (deaerator) 7%
Pressure drop of the bled steam for feedwater heating (surface preheaters) 5 %
Minimum water-steam temperature difference in feedwater heaters, °C 3
Minimum water-condensate temperature difference in feedwater heaters, °C 5
Electric consumption for heat rejection to ambient as a % of the heat rejected 1%
Deaerator saturation temperature, °C 120 or 140
Number of feedwater preheaters (in addition to the deaerator) 0 or 1

Page 42
This project has received funding from the European Union's Horizon2020 Research and Innovation Programme under Grant Agreement No 641185. This work was supported by the Swiss State Secretariat for Education, Research and Innovation (SERI)
under contract number 15.0160.
Figure 6.2: Schematic of the steam cycle
Table 6.9: Energy balance of three representative steam cycles with different thermal inputs
Thermal power entering the cycle, MWth 12.5 100 300
Energy balance, kW
Thermal power discharged at condenser 9,366 65,518 182,181
Thermal power exchanged in surface feedwater preheater
- 6,614 18,781
Thermal power exchanged in deaerator 1,418 7,427 21,058
Steam turbine power at blades 3,170 35,050 120,140
Steam turbine electric power at generator 2,979 32,950 116,530
Condensate pump power at blades 1 23 66
Feedwater pump power at blades 35 545 2,258
Condensate pump electric power consumption 1 25 70
Feedwater pump electric power consumption 37 580 2,402
Pumps electric power consumption 38 605 2,472
Condenser auxiliaries consumption 94 655 1,822
Net electric power produced, kW 2,847 31,690 112,236
Cycle gross electric efficiency, % 23.83 32.95 38.84
Cycle net electric efficiency, % 22.78 31.69 37.41
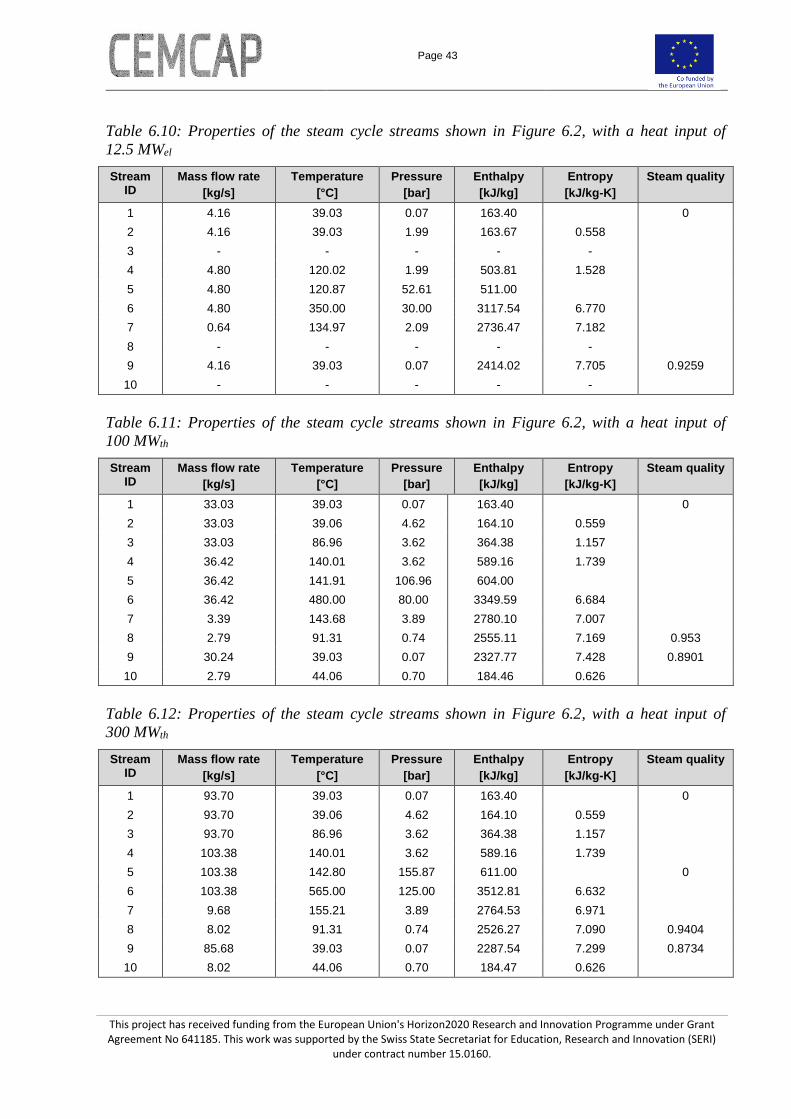
Page 43
This project has received funding from the European Union's Horizon2020 Research and Innovation Programme under Grant Agreement No 641185. This work was supported by the Swiss State Secretariat for Education, Research and Innovation (SERI)
under contract number 15.0160.
Table 6.10: Properties of the steam cycle streams shown in Figure 6.2, with a heat input of
12.5 MWel
Stream ID
Mass flow rate
[kg/s]
Temperature
[°C]
Pressure
[bar]
Enthalpy
[kJ/kg]
Entropy
[kJ/kg-K]
Steam quality
1 4.16 39.03 0.07 163.40 0
2 4.16 39.03 1.99 163.67 0.558
3 - - - - -
4 4.80 120.02 1.99 503.81 1.528
5 4.80 120.87 52.61 511.00
6 4.80 350.00 30.00 3117.54 6.770
7 0.64 134.97 2.09 2736.47 7.182
8 - - - - -
9 4.16 39.03 0.07 2414.02 7.705 0.9259
10 - - - - -
Table 6.11: Properties of the steam cycle streams shown in Figure 6.2, with a heat input of
100 MWth
Stream ID
Mass flow rate
[kg/s]
Temperature
[°C]
Pressure
[bar]
Enthalpy
[kJ/kg]
Entropy
[kJ/kg-K]
Steam quality
1 33.03 39.03 0.07 163.40 0
2 33.03 39.06 4.62 164.10 0.559
3 33.03 86.96 3.62 364.38 1.157
4 36.42 140.01 3.62 589.16 1.739
5 36.42 141.91 106.96 604.00
6 36.42 480.00 80.00 3349.59 6.684
7 3.39 143.68 3.89 2780.10 7.007
8 2.79 91.31 0.74 2555.11 7.169 0.953
9 30.24 39.03 0.07 2327.77 7.428 0.8901
10 2.79 44.06 0.70 184.46 0.626
Table 6.12: Properties of the steam cycle streams shown in Figure 6.2, with a heat input of
300 MWth
Stream ID
Mass flow rate
[kg/s]
Temperature
[°C]
Pressure
[bar]
Enthalpy
[kJ/kg]
Entropy
[kJ/kg-K]
Steam quality
1 93.70 39.03 0.07 163.40 0
2 93.70 39.06 4.62 164.10 0.559
3 93.70 86.96 3.62 364.38 1.157
4 103.38 140.01 3.62 589.16 1.739
5 103.38 142.80 155.87 611.00 0
6 103.38 565.00 125.00 3512.81 6.632
7 9.68 155.21 3.89 2764.53 6.971
8 8.02 91.31 0.74 2526.27 7.090 0.9404
9 85.68 39.03 0.07 2287.54 7.299 0.8734
10 8.02 44.06 0.70 184.47 0.626

Page 44
This project has received funding from the European Union's Horizon2020 Research and Innovation Programme under Grant Agreement No 641185. This work was supported by the Swiss State Secretariat for Education, Research and Innovation (SERI)
under contract number 15.0160.
6.4 Air separation unit
There are presently two main different alternatives available in the market concerning oxygen
supply:
• oxygen is produced on-site in oxygen generators (air separation units)
• oxygen is produced outside of the cement plant and is delivered afterwards by tank
trucks
6.4.1 On-site production
For industrial purposes, atmospheric air separation is the most common oxygen generation
process. Air consists mainly of nitrogen, oxygen, argon and small amounts of carbon dioxide.
The different air separation technologies are based on different physical and chemical prop-
erties of the air components. Three main oxygen generation technologies from air separation are
currently known: cryogenic generators, adsorption generators and membrane generators. As
cryogenic O2 production is the most mature technology, adsorption and membrane technologies
are not considered in this document.
Cryogenic air separation is currently the most power efficient technology available in the market
for the production of large quantities of oxygen. The system working principle relies on the
different boiling points of the air elemental components, which can be separated in liquid form
at temperatures around -185 °C. The cryogenic technology uses multi-column cryogenic distil-
lation to produce oxygen from compressed air. The air feed is distilled into the elemental
streams by a system, which includes a high and low pressure column. Figure 6.3 shows the flow
diagram of a cryogenic air separation unit, and Table 6.13 provides technical and economic data.
Figure 6.3: Flow diagram of a cryogenic air separation unit

Page 45
This project has received funding from the European Union's Horizon2020 Research and Innovation Programme under Grant Agreement No 641185. This work was supported by the Swiss State Secretariat for Education, Research and Innovation (SERI)
under contract number 15.0160.
Table 6.13: Technical and economic data of cryogenic air separation
Air
separation
technology
Oxygen
purity
[vol.-%]
capacity
[t O2/d]
power
consumption [kWh/t O2]
variable fee
[€/t O2]*
Cryogenic < 99,9 350 < x < 5,000 220 - 400 > 50
6.4.2 Oxygen supplied by tank trucks
The supply of liquefied oxygen into storage tanks is widely known in the cement industry. Tank
trucks coming from an air separation plant located nearby arrive to the cement plant and fill the
oxygen storage tanks with liquefied oxygen.
Although the specific costs of liquefied oxygen supply are higher than on-site oxygen genera-
tion, depending on the distance of the air separation plant and the required amount of oxygen, it
can become a very attractive solution, not only due to its relatively low capital expenditure, but
also due to its flexibility.
6.4.3 Oxygen costs
Table 6.14 shows current figures for oxygen costs for the two alternatives considered.
Table 6.14: Oxygen costs for tank delivery system and on-site production
Supply method Fee Power costs Total oxygen costs
Tank system 80 – 100 €/t O2
Cryogenic separation >50 €/t O2 15 – 28 €/t O2 66 – 91 €/t O2
6.5 Refrigeration system
The coefficient of performance (COP) for a refrigeration system is defined as the ratio between
refrigeration duty and net power requirement:
COP =�̇�refrigeration
�̇�net
The COP for a refrigeration plant is case specific and depends on several factors such as:
• Process layout (single-stage, multiple stages, cascade etc.)
• Refrigerant (single, multiple, mixed)
• Compressor efficiency
• Ambient temperature
• Temperature approaches in heat exchangers
• Plant size and economic trade-off

Page 46
This project has received funding from the European Union's Horizon2020 Research and Innovation Programme under Grant Agreement No 641185. This work was supported by the Swiss State Secretariat for Education, Research and Innovation (SERI)
under contract number 15.0160.
For the process benchmarking in CEMCAP a simple framework for estimation of the power
requirement for refrigeration is made. A generic correlation is developed based on simulations
using CoolPack [COO, 2017] of the following four standard refrigeration cycles:
• One-stage cycle, DX evaporator, Refrigerant R134a
• One-stage cycle, DX evaporator, Refrigerant R290
• One-stage cycle, DX evaporator, Refrigerant R717
• Two-stage cascade system, DX evaporators, Refrigerants R290 and R170
The one-stage cycle processes are selected for evaporator temperatures from 233 K to 283 K,
and the two-stage cascade process is selected for lower evaporator temperatures. Cooling water
temperature (18.2 °C), heat exchanger pinches, and compressor efficiencies are taken as defined
in other sections of this document.
The resulting COP is plotted against evaporator temperature in Figure 6.4. It can be observed
that the result is very similar for the different refrigerants in the one-stage cycle. A polynomial
of sixth degree giving COP as function of evaporator temperature is obtained by regression. It is
shown as a grey dotted line in Figure 6.4, and it is used to obtain COP values for evaporator
temperatures from 214 K to 283 K in Table 6.15.
Figure 6.4: Relation between cold-side refrigeration temperature and COP
Table 6.15: Relation between cold-side refrigeration temperature and COP
T [K] COP T [K] COP T [K] COP T [K] COP
283 10.23 265 4.81 247 2.81 229 1.86
282 9.70 264 4.65 246 2.74 228 1.83
281 9.22 263 4.50 245 2.67 227 1.79
280 8.77 262 4.36 244 2.60 226 1.76
279 8.35 261 4.23 243 2.53 225 1.73
278 7.97 260 4.10 242 2.47 224 1.71
0
2
4
6
8
10
12
210 220 230 240 250 260 270 280 290
CO
P
Evaporator temperature [K]
ONE-STAGE CYCLE,DX evaporator R134a
ONE-STAGE CYCLE,DX evaporator R290
ONE-STAGE CYCLE,DX evaporator R717
2-STAGE CASCADER290, R170

Page 47
This project has received funding from the European Union's Horizon2020 Research and Innovation Programme under Grant Agreement No 641185. This work was supported by the Swiss State Secretariat for Education, Research and Innovation (SERI)
under contract number 15.0160.
T [K] COP T [K] COP T [K] COP T [K] COP
277 7.61 259 3.98 241 2.41 223 1.68
276 7.28 258 3.86 240 2.35 222 1.65
275 6.98 257 3.75 239 2.29 221 1.62
274 6.69 256 3.64 238 2.24 220 1.59
273 6.42 255 3.53 237 2.19 219 1.57
272 6.17 254 3.43 236 2.14 218 1.54
271 5.94 253 3.33 235 2.09 217 1.51
270 5.72 252 3.24 234 2.05 216 1.48
269 5.52 251 3.15 233 2.01 215 1.46
268 5.32 250 3.06 232 1.97 214 1.43
267 5.14 249 2.97 231 1.93 213 1.40
266 4.97 248 2.89 230 1.89 212 1.38
By examining the behaviour of the actual COP compared to the theoretical maximum, a general
trend that can be used for estimation of COP for low refrigeration temperatures can be observed.
The COP can be looked upon as an efficiency η multiplied with the theoretical maximum
coefficient of performance COPCarnot:
COP = η ∙ COPCarnot
The COPCarnot is dependent on the temperature of the two reservoirs that the process transfer heat
between. We define the two reservoirs as the cooling water with temperature Tcw and the
evaporator with temperature Tevap. The resulting COPCarnot is:
COPCarnot =𝑇evap
𝑇cw − 𝑇evap
The efficiency η is plotted against evaporator temperature in Figure 6.5. It can be observed that
the efficiency η goes towards a constant value when the evaporator temperature decreases (0.5
with the equipment specifications used in CEMCAP). This can be used to estimate COP for low
refrigeration temperatures.

Page 48
This project has received funding from the European Union's Horizon2020 Research and Innovation Programme under Grant Agreement No 641185. This work was supported by the Swiss State Secretariat for Education, Research and Innovation (SERI)
under contract number 15.0160.
Figure 6.5: Relation between η=COP/COPCarnot and cold-side refrigeration temperature.
0,0
0,1
0,2
0,3
0,4
0,5
0,6
0,7
0,8
0,9
1,0
210 220 230 240 250 260 270 280 290
η
Evaporator temperature [K]
ONE-STAGE CYCLE,DX evaporatorR134a
ONE-STAGE CYCLE,DX evaporatorR290
ONE-STAGE CYCLE,DX evaporatorR717
2-STAGE CASCADER290, R170
Page 49
This project has received funding from the European Union's Horizon2020 Research and Innovation Programme under Grant Agreement No 641185. This work was supported by the Swiss State Secretariat for Education, Research and Innovation (SERI)
under contract number 15.0160.
6.6 Heat rejection system
The cooling system is assumed to be a closed loop cooling system, where water cooled in a
forced draft cooling tower is used as cooling medium. The site is assumed to be at inland with
ambient temperature of 15 °C and 60% humidity (see Chapter 2), corresponding to a wet bulb
temperature of 10.8 °C. Following EBTF assumptions [EBTF, 2011], cooling water leaves the
cooling tower at 18.2 °C, corresponding to a temperature approach of 7.4 °C. The temperature
rise of cooling water in process heat exchangers is assumed equal to 11 °C, so that temperature
of cooling water returning to the cooling tower is 29.2 °C. A power consumption of 2% of the
thermal power rejected is assumed, associated to fans consumption and water pumping. Water
consumption of 0.61 kg/MJ of heat rejected is assumed, resulting from assuming a saturated air
at 25 °C at the cooling tower outlet and a water make-up flow equal to twice the amount of
evaporated water (i.e. a purge water stream from the cooling water circuit equal to the
evaporated water is considered to avoid salt build-up).

Page 50
This project has received funding from the European Union's Horizon2020 Research and Innovation Programme under Grant Agreement No 641185. This work was supported by the Swiss State Secretariat for Education, Research and Innovation (SERI)
under contract number 15.0160.
7 EXTENT OF CO2 CAPTURE
In order to compare different technologies on the same basis, the cases studied should have the
same extent of CO2 capture. In CEMCAP it is chosen to handle this by fixing the CO2 avoided
from the flue gas (𝐴𝐶𝑓𝑔) to 90%. This KPI is defined as the direct CO2 emission reduction from
the flue gas of the cement kiln (see Chapter 10). In addition, an optional case should be selected
individually for each technology.
Thus, the following values for CO2 avoided from the flue gas will be considered:
• 90%
• Optional (other than 90%)

Page 51
This project has received funding from the European Union's Horizon2020 Research and Innovation Programme under Grant Agreement No 641185. This work was supported by the Swiss State Secretariat for Education, Research and Innovation (SERI)
under contract number 15.0160.
8 CO2 AND FLUE GAS SPECIFICATIONS
In this chapter specifications for CO2 transport and destination, and standard CO2 conditioning
processes are presented.
The temperatures and pressures required for the conditioned CO2 are defined by the CO2
transport option. The CO2 purities required are defined by the CO2 transport and destination in
combination. The CO2 purification required to reach the purity limits takes place mainly during
CO2 capture, but also during the CO2 conditioning. The CO2 purity requirements apply to the
conditioned CO2.
8.1 CO2 transport
8.1.1 Pipeline transport
Most international studies on CCS with transport by pipeline have selected CO2 delivery
pressures of 11.0 MPa, among others the studies made by IEAGHG, while some studies have
selected 10.0 MPa. The CASTOR and ENCAP projects have used 11.0 MPa. The ENCAP
project used temperature of <30 °C. These conditions were adopted by the EBTF [EBTF, 2011],
and are used also here:
• Pressure: 110 bar
• Temperature: <30 °C
NETL provided in 2012 quality guidelines for energy system studies on CO2 impurity design
parameters [NET1, 2012]. They reviewed specifications in other studies, pipeline design guides,
pipe transportation specifications and sequestration plant experience, before they set their
recommended design parameters (see Table 8.1). The limits are set based on considerations such
as toxicity, compression work and corrosion. These parameters are adopted in CEMCAP. An
ISO standard on CO2 pipeline transportation systems (ISO 27913) was published in November
2016, i.e. after the CEMCAP simulation work started. In this standard, no standard limits for
impurities were set, but indicative levels were given, with some slight differences from the
NETL guidelines.
Table 8.1: Minimum CO2 concentration and maximum
impurity concentrations for pipeline transport [NET1, 2012]
Component Limit
CO2 >95 vol%
H2O <300 ppmwt
SO2 <100 ppmv
NOx <100 ppmv
CO <35 ppmv
O2 <4 vol%
N2 <4 vol%
Ar <4 vol%
NH3 <50 ppmv

Page 52
This project has received funding from the European Union's Horizon2020 Research and Innovation Programme under Grant Agreement No 641185. This work was supported by the Swiss State Secretariat for Education, Research and Innovation (SERI)
under contract number 15.0160.
The following additional impurities can be present in the flue gas: HCl, HF, Hg, other heavy
metals, organic carbon and dust. However, the concentrations of these components after the
capture processes will be very low. Also, there are no limits set for these components for
transport and storage in other studies found in the literature. Therefore the limits for these
components are left open in CEMCAP.
8.1.2 Ship transport
For transport of CO2 by ship it is assumed that the CO2 will be in liquid form close to the triple
point in order to obtain a high CO2 density and avoid ships with too expensive pressure vessels.
The conditions selected by Aspelund et al. [ASP, 2006] are used:
• Pressure: 6.5 bar
• Temperature: subcooled with 3 °C (-52 °C for pure CO2)
Little work has been done on defining purity requirements for ship transport. It is assumed that
the purity requirements should be at least as strict as for pipeline transport. In order to avoid
operational problems in the liquefaction process, stricter limits will apply for some components.
A tentative limit for water content is <50 ppm [ASP, 2007].
8.2 CO2 destination
8.2.1 Storage
The specifications for storage as recommended by NETL [NET1, 2012] are adopted, and they
are identical to the specifications for pipeline transport (see Table 8.1).
8.2.2 EOR
In CEMCAP the focus is not on EOR. However if EOR for any reason should be considered, the
specifications are almost identical to the specifications for storage. The exceptions are stricter
limits for N2, Ar and H2 (1 vol.-%) and O2 (0.01 vol.-%). These limits are also adopted from the
NETL recommendations [NET1, 2012].
8.2.3 Utilisation
There are several forms of CO2 utilization, ranging from chemical conversion into various
products to use of CO2 as a solvent. The required specifications of the different routes vary
widely in terms of temperature, pressure, and purity. Several uses, their stage of development,
and the required pressure of the CO2 are presented in Table 8.2. For processes which are still
under development, the required pressures are not yet known to a high level of certainty, as
experiments are still conducted under laboratory conditions. The required purity of CO2 is in
general not known for these processes, except for food applications (99.9 % purity), as industrial
grade CO2 is already 99 % pure and the effect of less pure CO2 has not been adequately studied.
For the processes still at the laboratory stage, examples of tests with CO2 sourced from capture
systems are very few. Some of the catalysts used in these processes may be very sensitive to
impurities while others will not be affected.

Page 53
This project has received funding from the European Union's Horizon2020 Research and Innovation Programme under Grant Agreement No 641185. This work was supported by the Swiss State Secretariat for Education, Research and Innovation (SERI)
under contract number 15.0160.
Table 8.2: Uses of CO2 and the required CO2 pressure
Use Stage of development
CO2 pressure
[bar]
Notes
Urea production Commercial 140 – 175 CO2 is sourced both from ammonia production and flue gas (when
needed)
Methanol production (conventional)
Commercial 40 – 100 Actual pressure dependent on catalyst and operating temperature
Methanol production (renewable)
Pre-commercial ~50 Processes are still proprietary
Organic carbonates Laboratory 1 – 100 Processes vary widely
Polyurethanes Laboratory, Pre-commercial
1 – 100 Processes vary widely; pre-commercial process is proprietary
Technological Commercial >74 Usually supercritical CO2 used for various applications (extraction,
solvation, dry-washing, etc.)
Food Commercial 7 – 8 Mostly for carbonated beverages
8.2.4 Mineralisation
Mineralisation – i.e. the extraction of an alkaline earth metal from a precursor material and its
subsequent precipitation with CO2 in the form of a carbonate mineral – requires little pre-
processing of the captured CO2. The conventional research suggests that CO2 should be
processed at pressures similar to the pipeline pressure. Thus, if captured and compressed CO2 is
pipelined to a mineralization plant next to a distant disposal site, the constraints on pipeline
operations are likely to exceed pre-processing needs for mineralisation [IPCC, 2005]. More
recent research points towards process concepts that can accept very low CO2 pressures. In this
case, a preliminary capture step becomes optional, only moderate or no compression is needed,
and the mineralisation plant has to be built next to the point source/capture plant [WER, 2014].
For both the high and the low pressure approach, CO2 purity requirements are minimal; acidic
components of the flue gas would be neutralized by the alkaline earth metal as they pass through
the process and can then be disposed of together with the carbonate product. It may be the case
that the purity requirements for the product of the mineralisation process are stringent,
depending on the end use/storage of the product compounds. The purity requirements would
then be governed by the product quality specifications rather than by processing constraints, but
pipeline specifications are expected to still be sufficient.
8.3 CO2 conditioning
In this section standard CO2 compression and liquefaction processes are presented. The feed
conditions are different for each CO2 capture technology. The product temperatures and
pressures are defined by the transport option. The product purities are defined by the transport
option and the CO2 destination in combination.

Page 54
This project has received funding from the European Union's Horizon2020 Research and Innovation Programme under Grant Agreement No 641185. This work was supported by the Swiss State Secretariat for Education, Research and Innovation (SERI)
under contract number 15.0160.
8.3.1 CO2 compression
The various technologies produce CO2 at different conditions. Therefore the number of stages
and pressure ratios for CO2 compression will be selected for each case individually. However,
the following guidelines are set:
• pressure ratios: 2 - 4
• similar pressure ratio for all stages
• isentropic compressor efficiency: 85%
• pump efficiency: 80%
• pump and compressor driver efficiency: 95%
Pressure drop in gas coolers should be 2% of inlet pressure, in liquid coolers 0.4 bar, and in
scrubbers neglected, as specified in Chapter 5. Assuming a pinch temperature of 10 °C (since the
CO2 condenses) the intercoolers can cool the CO2 to 28 °C.
In each scrubber condensate (mainly water) is removed. Before the last compression stage, the
gas is dehydrated using TEG if necessary in order to reach the limit of 300 ppmwt of water.
Pressure drop in the TEG scrubber is assumed to be 5% of the inlet pressure.
As an example, a suggested compression process for CO2 after MEA capture (feed ~1.5 bar) is
given in Table 8.3 and Figure 8.1. The electric power demand for compression is in this case
estimated to 0.33 MJ/kg CO2. This estimation is for pure CO2 saturated with water. It is
performed with Aspen Plus using the GERG2008 property package. It should be recalculated for
each particular case, also taking other impurities into account.
Table 8.3: Pressure ratios and isentropic efficiencies for CO2 compression after MEA capture
Inlet pressure
[bar]
Discharge pressure
[bar]
Pressure ratio
[-]
Isentropic efficiency
[%]
Stage 1 1.50 5.85 3.9 85
Stage 2 5.73 22.3 3.9 85
Stage 3 20.8 80.0 3.8 85
Captured CO2
1.5 bar40 °C
5.85 bar 22.3 bar 80 bar
28 °C
TEG
28 °C<300 ppmwt H2O
Condensate WaterCondensate
28 °C 28 °C
5.73 bar 20.8 bar 110 bar
Figure 8.1: CO2 compression and dehydration after MEA capture

Page 55
This project has received funding from the European Union's Horizon2020 Research and Innovation Programme under Grant Agreement No 641185. This work was supported by the Swiss State Secretariat for Education, Research and Innovation (SERI)
under contract number 15.0160.
8.3.2 CO2 liquefaction
The standard liquefaction cycle for CO2 captured by MEA (feed ~1.5 bar) shown in Figure 8.2 is
assumed to operate with two intercooled compression stages and three dehydration stages. Each
intercooling stage consists of ambient cooling to 28 °C and chilling to 4 °C. This is done to
maximise the water removal rate in the water separators. After the first compression,
intercooling and chilling stage about 97 % of the water content is removed in the water
separation drum. The load on the final adsorptive dehydration unit is minimised and has a water
removal duty of about 1.5 % of the total water content.
Figure 8.2: Standard CO2 liquefaction cycle for ~1.5 bar feed pressure
The pressure at the inlet of the CO2 condenser is 16.2 bar, giving a CO2 condensation tempe-
rature of -24.9 °C. The cold-side evaporation temperature of the auxiliary refrigeration is
assumed to be -30.5 °C and cools the CO2 into subcooled state at -27 °C. At the outlet the
pressure is about 15.8 bar and the stream is throttled to 6.9 bar. The vapour fraction of the
throttled stream is 0.129 and this stream is recycled to the suction side of the second compressor
stage. Since this cold stream is mixed with the feed stream still containing a certain water
fraction, the flash gas is assumed to be heated to about 0 °C in order to prevent ice formation and
accumulation in the manifold of the gas mixer.
The liquid stream from the flash tank is assumed to hold equilibrium temperature and is
subcooled with 3 °C by auxiliary refrigeration (to -52 °C for pure CO2).
Pressure drops in heat exchangers are specified according to the data in Chapter 5.1. A pressure
drop of 50 kPa is assumed for the dehydration unit, while pressure drops have been neglected in
the water separation drums. Pressure drops in these drums would increase the power requirement
somewhat.
Table 8.4: Pressure ratios, isentropic efficiencies and power consumption for compressors
Isentropic eff Pressure ratio Pin Pout Power
[%] [bar] [bar] [kJe/kg]
Compressor 1 85 3.9 1.5 5.9 114.5
Compressor 2 85 3.1 5.6 17.4 86.8
Water
IC ICChiller
Dehydration
HeaterCO2
condenser
CO2
subcooler
Liquid CO2
CO2 feed
(1.5 bar)
Chiller
Water

Page 56
This project has received funding from the European Union's Horizon2020 Research and Innovation Programme under Grant Agreement No 641185. This work was supported by the Swiss State Secretariat for Education, Research and Innovation (SERI)
under contract number 15.0160.
Table 8.5: Auxiliary refrigeration
Tcold COP/COPcarnot COP Cold duty Power
[°C] [kJth/kg] [kJp/kg]
Chillers 1 0.35 6.85 56.6 8.3
CO2 condenser -30 0.48 2.59 384.8 148.5
CO2 subcooler -55 0.48 1.49 6.0 4.0
Table 8.6: Overall power requirement
Specific power
CO2 compression kJe/kg 201.3
Auxiliary refrigeration kJe/kg 160.8
Suma kJe/kg 362.1
Neta,b kJe/kg 381.1
a Not including regeneration of dehydration unit b Including 0.95 mechanical efficiency
8.4 Flue gas
The temperature of the flue gas should be sufficiently higher than the dew point in order to avoid
condensation and problems with corrosion. Further, a high temperature of the flue gas ensures
enough draft in the stack and a wide spread of the flue gas after it has left the stack. If the
temperature of the flue gas is not sufficiently high, reheating or alternative technologies should
be considered to ensure good dispersion of the plume.
For oxyfuel and calcium looping capture, it is important to pay attention to the operating ranges
of the process filter, and that heat is required for evaporation of moisture in the raw mill.
The content of pollutants in the emitted flue gas is subject to regulations. However, since the
focus in CEMCAP is on CO2 capture retrofit, it is assumed that the emission of pollutants is
acceptable if it is equal to or lower than the emissions of the reference kiln.

Page 57
This project has received funding from the European Union's Horizon2020 Research and Innovation Programme under Grant Agreement No 641185. This work was supported by the Swiss State Secretariat for Education, Research and Innovation (SERI)
under contract number 15.0160.
9 ECONOMIC ANALYSIS
9.1 Introduction
One of the objectives of CEMCAP is to evaluate the economic viability of CO2 capture from
cement using different capture technologies. In order to perform the assessment and comparison
in a consistent manner, a cost methodology has been developed and is presented in the following
sections.
The economic assessment consists mainly of estimations of investment costs, fixed and variable
operation and maintenance costs of the cement plant with and without CO2 capture. Investment
costs are evaluated based on a Bottom Up Approach for the CO2 capture and conditioning
process while the cement plant cost are based on a Top Down Approach. The operation and
maintenance costs are estimated based on material replacement and a factor approach, while the
variable operating costs are based on material, fuel and energy consumptions.
Based on these costs, relevant key performance indicators such as the break-even cement cost
with CO2 capture and the break-even CO2 avoided cost. Finally, sensitivity analyses shall be
performed in order to quantify the impact of several parameters on the economic performances
of the cement plant with CO2 capture.
9.2 Economic boundaries
This section specifies the main assumption considered in order to perform the economic
evaluation of the cement kiln with and without CO2 capture and conditioning.
All economic assessments will be reported on a 2014 basis. In cases in which all costs are not
directly available in 2014 prices, investment costs are adjusted to the correct level of prices
using the Chemical Engineering Plant Cost Index (CEPCI) for the CO2 capture and conditioning
facilities and the cement kiln costs. The CEPCI is developed in the US, but it is assumed that it
is representative also for Europe, and that it can be used directly to convert from euro for a
specific year to euro in 2014. Yearly average values for the CEPCI are given in Figure 9.1 and
Table 9.1, and the exchange rates from euro to US dollars and GB pounds are given in Table 9.1.
The cement kiln and the CO2 capture and conditioning process are considered to have an
economic lifetime of 25 years [KOR, 2013]. However the economic lifetime of the plant may
differ from the expected lifetime of certain equipment and material of the process, such as
membranes and sorbent. Therefore cost associated with periodic replacement of such parts shall
be included. As in practice the operating lifetime of the plant and certain equipment can be
longer or shorter than here considered, sensitivity analyses on these parameters shall be
performed.
A plant construction period of 3 years for the capture process and 2 years for the cement kiln are
here considered. The annual allocation of construction costs used for evaluation of the overall
cost is presented in Table 9.2.

Page 58
This project has received funding from the European Union's Horizon2020 Research and Innovation Programme under Grant Agreement No 641185. This work was supported by the Swiss State Secretariat for Education, Research and Innovation (SERI)
under contract number 15.0160.
Figure 9.1: Chemical Engineering Plant Cost Index [CEP, 2014].
Table 9.1. Yearly average Chemical Engineering Plant Cost Index [CEP, 2014] and exchange
rates [OFX, 2017] for 2001-2014.
Year CEPCI USD/EUR GBP/EUR
2001 394.3 0.8960 0.6220
2002 395.6 0.9425 0.6281
2003 402.0 1.1341 0.6933
2004 444.2 1.2441 0.6787
2005 468.2 1.2464 0.6846
2006 499.6 1.2563 0.6819
2007 525.4 1.3704 0.6845
2008 575.4 1.4714 0.7961
2009 521.9 1.3945 0.8916
2010 550.8 1.3274 0.8585
2011 585.7 1.3927 0.8679
2012 584.6 1.2857 0.8112
2013 567.3 1.3285 0.8491
2014 571.61) 1.3292 0.8065 1) In deliverables D4.1 and D4.2 a preliminary CEPCI value for 2014 (580.2) was used since the final number was not available yet. In remaining deliverables the final 2014 CEPCI (571.6) will be used.
Table 9.2: Annual allocation of construction costs [ANA, 2011]
Year Allocation of cement kiln cost [%] Allocation of CO2 capture cost [%]
1 50 40
2 50 30
3 30
0
100
200
300
400
500
600
700
1940 1960 1980 2000 2020
CE
PC
I (-
)
Year

Page 59
This project has received funding from the European Union's Horizon2020 Research and Innovation Programme under Grant Agreement No 641185. This work was supported by the Swiss State Secretariat for Education, Research and Innovation (SERI)
under contract number 15.0160.
9.3 Financial parameters
A discounted cash flow approach is here considered to perform the project valuation. A real
discount rate (i.e. without inflation) of 8 % is considered in order to perform the project financial
valuation. The discount rate represents an average cost of capital which takes into account both
the return rates on equity and interest rates on loans. As the discount rate is specific to the type
of investor, sensitivity analyses will be performed on this parameter. For example, the State uses
lower discount rates than average companies while Oil & Gas companies and companies dealing
with risk use a higher discount rate.
As both corporate taxes and depreciation fiscal accounting varies significantly among European
member states, the project evaluation is performed on a pre-taxation basis. Finally, as the aim of
the CEMCAP project is to evaluate the cost of capturing CO2 from cement kilns, no CO2
emission taxation is here considered.
9.4 Capital investment
Two approaches are considered in order to evaluate the Total Plant Cost (TPC): a Bottom-Up
approach and a Top-Down approach [ANA, 2011]. As only a very limited number of cement
kilns is built every year in Europe, the cost provided in the project will be given for a retrofit
case.
The Bottom-Up approach
A Bottom-Up approach (BUA) is used to estimate the EPC costs for the CO2 capture and
conditioning processes. A schematic overview of the BUA is given in Figure 9.2.
Figure 9.2: The Bottom-Up approach for estimation of total plant costs

Page 60
This project has received funding from the European Union's Horizon2020 Research and Innovation Programme under Grant Agreement No 641185. This work was supported by the Swiss State Secretariat for Education, Research and Innovation (SERI)
under contract number 15.0160.
The following cost elements are included:
• Equipment Costs – The Equipment Cost for each main basic equipment of the different
processes can be estimated based on a step-count exponential costing method, using the
dominant or a combination of parameters derived from mass and energy balance
computations, combined with cost data obtained from equipment suppliers and/or other
available data. The Total Equipment Cost (TEC) is the sum of all Equipment Costs in the
plant.
• Installation costs – The installation costs are estimated as additional expenses to
integrate the individual equipment into the plant, such as costs for piping/valves, civil
works, instrumentations, electrical installations, insulations, paintings, steel structures,
erections and OSBL (outside battery limits).
• Total Direct Cost (TDC) – The Direct Cost is the sum of the Equipment Costs and the
Installation Costs and shall also include the appropriate process contingency factor in
order to reflect the differences in technology maturity between the considered CO2
capture concepts as shown in Table 9.3.
Table 9.3: AACE guidelines for process contingency [NET, 2011]
Technology Status Process Contingency
[% of Associated Process Capital]
New concept with limited data 40+
Concept with bench-scale data 30-70
Small pilot plant data 20-35
Full-sized modules have been operated 5-20
Process is used commercially 0-10
• Indirect Costs – The indirect expenditures are fixed to 14 % of the TDC for all CO2
capture and conditioning technologies considered and include the costs for the yard
improvement, service facilities and engineering costs as well as the building and
sundries. An indicative breakdown of the Indirect Costs is given in Table 9.4.
Table 9.4: Breakdown of indirect costs
Indirect costs % of TDC
Yard improvement 1.5
Service facilities 2
Engineering/consultancy cost 4.5
Building 4
Miscellaneous 2
• Engineering, Procurement and Construction Costs (EPC) – The EPC is the sum of Total
Direct Cost and Indirect Costs.
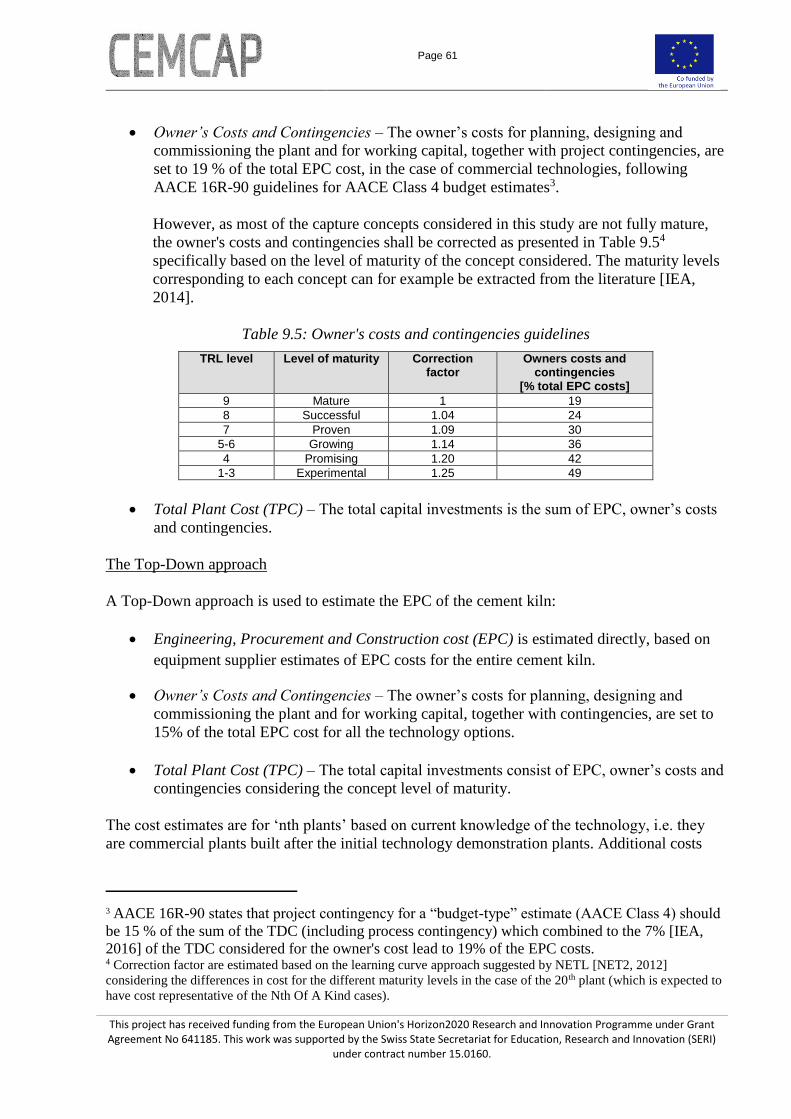
Page 61
This project has received funding from the European Union's Horizon2020 Research and Innovation Programme under Grant Agreement No 641185. This work was supported by the Swiss State Secretariat for Education, Research and Innovation (SERI)
under contract number 15.0160.
• Owner’s Costs and Contingencies – The owner’s costs for planning, designing and
commissioning the plant and for working capital, together with project contingencies, are
set to 19 % of the total EPC cost, in the case of commercial technologies, following
AACE 16R-90 guidelines for AACE Class 4 budget estimates3.
However, as most of the capture concepts considered in this study are not fully mature,
the owner's costs and contingencies shall be corrected as presented in Table 9.54
specifically based on the level of maturity of the concept considered. The maturity levels
corresponding to each concept can for example be extracted from the literature [IEA,
2014].
Table 9.5: Owner's costs and contingencies guidelines
TRL level Level of maturity Correction factor
Owners costs and contingencies
[% total EPC costs]
9 Mature 1 19
8 Successful 1.04 24
7 Proven 1.09 30
5-6 Growing 1.14 36
4 Promising 1.20 42
1-3 Experimental 1.25 49
• Total Plant Cost (TPC) – The total capital investments is the sum of EPC, owner’s costs
and contingencies.
The Top-Down approach
A Top-Down approach is used to estimate the EPC of the cement kiln:
• Engineering, Procurement and Construction cost (EPC) is estimated directly, based on
equipment supplier estimates of EPC costs for the entire cement kiln.
• Owner’s Costs and Contingencies – The owner’s costs for planning, designing and
commissioning the plant and for working capital, together with contingencies, are set to
15% of the total EPC cost for all the technology options.
• Total Plant Cost (TPC) – The total capital investments consist of EPC, owner’s costs and
contingencies considering the concept level of maturity.
The cost estimates are for ‘nth plants’ based on current knowledge of the technology, i.e. they
are commercial plants built after the initial technology demonstration plants. Additional costs
3 AACE 16R-90 states that project contingency for a “budget-type” estimate (AACE Class 4) should
be 15 % of the sum of the TDC (including process contingency) which combined to the 7% [IEA,
2016] of the TDC considered for the owner's cost lead to 19% of the EPC costs. 4 Correction factor are estimated based on the learning curve approach suggested by NETL [NET2, 2012]
considering the differences in cost for the different maturity levels in the case of the 20th plant (which is expected to
have cost representative of the Nth Of A Kind cases).

Page 62
This project has received funding from the European Union's Horizon2020 Research and Innovation Programme under Grant Agreement No 641185. This work was supported by the Swiss State Secretariat for Education, Research and Innovation (SERI)
under contract number 15.0160.
normally associated with 1st-of-a-kind commercial plants shall be excluded. The estimate
accuracy is expected to be +35/-15 % (AACE Class 4).
If not directly provided for 2014 prices, investment costs are adjusted to the correct level of
prices using the CEPCI for the CO2 capture and conditioning facilities and the cement kiln costs.
It is worth noting that the development and land costs are not considered in the project estimates.
9.5 Main operating cost parameters
The designed capture processes are set to operate in base load operation. However, in practice
technical issues in the first years lead to a lower capacity factor before reaching the base load.
Therefore, during the first two years of operation, capacity factors of 40% and 65% are
presumed respectively, while a capacity factor of 87 % is achieved afterwards.
An overview of the elements of the included operating costs is given in Figure 9.3, and more
details about the cost estimations are given in the following text.
Figure 9.3: Elements of operating costs in CEMCAP
9.5.1 Maintenance, insurance and labour costs
The fixed operating costs which include maintenance, insurance and labour costs are estimated
as follows:
• Insurance and local property taxes: The total annual cost of insurance, local property
taxes and miscellaneous regulatory and overhead fees is to be a total of 2% of TPC
[ANA, 2011].
• Maintenance cost: Maintenance costs include cost of preventive maintenance, corrective
maintenance (repair and replacement of failed components) and periodic replacement of
materials. A maintenance cost corresponding to 2.5 % of the TPC excluding periodic
replacement of materials which are defined based on the process [ANA, 2011]. This cost
includes the maintenance labour cost, corresponding to 40% of the total maintenance
cost.

Page 63
This project has received funding from the European Union's Horizon2020 Research and Innovation Programme under Grant Agreement No 641185. This work was supported by the Swiss State Secretariat for Education, Research and Innovation (SERI)
under contract number 15.0160.
• Labour costs: Labour costs include operating labour, administrative and support labour.
100 persons are assumed to be employed for operative labour [IEA, 2013]. The ‘fully
burdened’ cost of labour, including social security payments is assumed to be 60 k€ per
employee. Administrative and support labour are also included and assumed to be 30 %
of the operating and maintenance labour cost while maintenance labour are assumed to
be 40 % of the overall maintenance cost [KOR, 2013].
9.5.2 Utilities and consumables cost
The variable operating costs include material utilities consumption such as electricity, natural
gas, process water, chemicals, sorbent, etc. The costs of the main utilities and consumables are
evaluated based on the process energy and mass balance and the costs presented in Table 9.6. As
discussed in Chapters 6.2 and 6.1, certain utilities such as electricity and steam can be obtained
at different costs depending on the source, amount and location. Considering the electricity of
the plant with CCS, it seems reasonable to assume that the electricity cost which shall be
considered for the cost evaluation correspond to the highest electricity consumption band
presented in Chapter 6.2, while the steam cost depends on the steam demand for the CO2 capture
plant as presented in Chapter 6.1. Sensitivity analyses will be performed on these values in order
to evaluate their impacts on the key performance indicators.
Table 9.6: Costs of main utilities and consumables
Utilities and consumables Cost Unit Range
Electricity 58.1 €/MWh
Natural gas [KOR, 2013] 6 €/GJ
Coal [ANA, 2011, KOR, 2013] 3 €/GJ
Steam from heat recovery 3.5 €/MWh Until the amount which can be produced from the cement kiln wasted heat
Steam from Natural Gas Boiler 25.3 €/MWh Above the amount which can be produced from the cement kiln wasted
heat
Process water [KOR, 2013] 6.65 €/m3
Cooling water [KOR, 2013] 0.39 €/m3
MEA 1,450 €/t
Raw meal, incl. grinding (limestone, iron oxide, sand, etc.)
5.0 €/tclk
Alternative fuels 15 - 25 €/tclk
9.5.3 Other variable Operating costs
In addition to the aforementioned operating costs, other miscellaneous Opex of 0.8 €/tcement (or
1.09 €/tclk) are assumed, coherently with [IEA, 2013].

Page 64
This project has received funding from the European Union's Horizon2020 Research and Innovation Programme under Grant Agreement No 641185. This work was supported by the Swiss State Secretariat for Education, Research and Innovation (SERI)
under contract number 15.0160.
10 KEY PERFORMANCE INDICATORS
In this chapter energy, environmental and economic indicators are defined for a subsequent
benchmarking of capture technologies. In this connection, also the Benchmark Analysis from the
Norcem CO2 Capture Project will be taken into account.
10.1 Energy and environmental performance indicators
In the reference configuration, the cement kiln production requires the use of fuel for sustaining
calcium carbonate decomposition in the precalciner and the formation of the main clinker consti-
tuents in the rotating kiln. Such processes entail direct fuel consumptions and direct CO2 emis-
sions within the cement plant boundaries. Such consumptions and emissions are defined as
follows:
• Direct specific primary energy consumption:
𝑞𝑐𝑙𝑘 [𝑘𝐽𝐿𝐻𝑉
𝑘𝑔𝑐𝑙𝑘] =
�̇�𝑓𝑢𝑒𝑙 ∙ 𝐿𝐻𝑉𝑓𝑢𝑒𝑙
�̇�𝑐𝑙𝑘
• Direct specific CO2 emissions at cement kiln stack5:
𝑒𝑐𝑙𝑘 [𝑘𝑔𝐶𝑂2
𝑡𝑐𝑙𝑘] =
�̇�𝐶𝑂2
�̇�𝑐𝑙𝑘
In addition to these values, cement manufacturing brings some additional indirect contributions
associated to electric power import, reflecting in indirect primary energy consumption (𝑞𝑒𝑙,𝑐𝑙𝑘)
and CO2 emissions (𝑒𝑒𝑙,𝑐𝑙𝑘). These values depend on the specific electric power consumed by the
cement kiln auxiliaries (𝑃𝑒𝑙,𝑐𝑙𝑘), which is characterized by the efficiency (𝜂𝑒𝑙) and specific CO2
emissions (𝑒𝑒𝑙) of the power generation technology or the country energy mix considered. Such
indirect consumptions and emissions are defined as follows:
• Specific electric power consumption:
𝑃𝑒𝑙,𝑐𝑙𝑘 [𝑘𝑊ℎ𝑒𝑙
𝑘𝑔𝑐𝑙𝑘] =
𝑃𝑒𝑙
�̇�𝑐𝑙𝑘
• Indirect specific primary energy consumption:
𝑞𝑒𝑙,𝑐𝑙𝑘 [𝑘𝐽𝐿𝐻𝑉
𝑘𝑔𝑐𝑙𝑘] =
𝑃𝑒𝑙,𝑐𝑙𝑘
𝜂𝑒𝑙
5 Only fossil carbon emissions should be accounted for in computing this index (i.e. CO2 emissions from biomass
combustion are considered as neutral emissions)

Page 65
This project has received funding from the European Union's Horizon2020 Research and Innovation Programme under Grant Agreement No 641185. This work was supported by the Swiss State Secretariat for Education, Research and Innovation (SERI)
under contract number 15.0160.
• Indirect CO2 emissions:
𝑒𝑒𝑙,𝑐𝑙𝑘 [𝑘𝑔𝐶𝑂2
𝑡𝑐𝑙𝑘] = 𝑃𝑒𝑙,𝑐𝑙𝑘 ∙ 𝑒𝑒𝑙
As a result, equivalent values for primary energy consumption (𝑞𝑐𝑙𝑘,𝑒𝑞) and CO2 emission
(𝑒𝑐𝑙𝑘,𝑒𝑞) result from the sum of the direct and indirect values mentioned above:
𝑞𝑐𝑙𝑘,𝑒𝑞 = 𝑞𝑐𝑙𝑘 + 𝑞𝑒𝑙,𝑐𝑙𝑘 [𝑘𝐽𝐿𝐻𝑉
𝑘𝑔𝑐𝑙𝑘]
𝑒𝑐𝑙𝑘,𝑒𝑞 = 𝑒𝑐𝑙𝑘 + 𝑒𝑒𝑙,𝑐𝑙𝑘 [𝑘𝑔𝐶𝑂2
𝑡𝑐𝑙𝑘]
It has to be highlighted that in case of net power export from the cement kiln (Pel < 0 according
to its definition above) when a sufficiently large heat recovery steam cycle is possible, fuel and
CO2 credits accounted with the previous equations result in negative indirect fuel consumptions
and CO2 emissions.
CO2 capture ratio is defined as the ratio between the CO2 captured �̇�𝐶𝑂2,𝑐𝑎𝑝𝑡 and the total CO2
generated in the cement kiln �̇�𝐶𝑂2,𝑔𝑒𝑛:
𝐶𝐶𝑅 =�̇�𝐶𝑂2,𝑐𝑎𝑝𝑡
�̇�𝐶𝑂2,𝑔𝑒𝑛
CO2 avoided from flue gas (𝐴𝐶𝑓𝑔) is defined as the direct CO2 emission reduction from the flue
gas of the cement kiln. In this definition, CO2 emitted with the vent gas from the CO2
purification unit should be accounted for:
𝐴𝐶𝑓𝑔 = 1 −𝑒𝑐𝑙𝑘,𝑓𝑔
𝑒𝑐𝑙𝑘,𝑓𝑔,𝑟𝑒𝑓
CO2 avoided gives a better indication on the reduced impact of a cement kiln with CO2 capture.
CO2 avoided is defined as follows, through the ratio between the CO2 emission of the cement
kiln with CO2 capture 𝑒𝑐𝑙𝑘 and the emissions of the reference cement kiln without capture
𝑒𝑐𝑙𝑘,𝑟𝑒𝑓:
𝐴𝐶 = 1 −𝑒𝑐𝑙𝑘
𝑒𝑐𝑙𝑘,𝑟𝑒𝑓
Similarly, the equivalent CO2 avoided index, taking into account the indirect CO2 emissions
associated to electric power consumption/generation can be defined through the equivalent CO2
emissions:
𝐴𝐶𝑒𝑞 = 1 −𝑒𝑐𝑙𝑘,𝑒𝑞
𝑒𝑐𝑙𝑘,𝑒𝑞,𝑟𝑒𝑓

Page 66
This project has received funding from the European Union's Horizon2020 Research and Innovation Programme under Grant Agreement No 641185. This work was supported by the Swiss State Secretariat for Education, Research and Innovation (SERI)
under contract number 15.0160.
In order to compare different technologies from an energy and environmental point of view, the
SPECCA (Specific Primary Energy Consumption for CO2 Avoided) index can be used, as
already done diffusely in the literature in power plants applications. The SPECCA index is
defined by the following equation, quantifying the increased equivalent fuel consumption to
avoid the emission of CO2 in a cement kiln with CO2 capture with respect to a reference cement
kiln without capture (𝑟𝑒𝑓):
𝑆𝑃𝐸𝐶𝐶𝐴 [𝑀𝐽𝐿𝐻𝑉
𝑘𝑔𝐶𝑂2] =
𝑞𝑐𝑙𝑘,𝑒𝑞 − 𝑞𝑐𝑙𝑘,𝑒𝑞,𝑟𝑒𝑓
𝑒𝑐𝑙𝑘,𝑒𝑞,𝑟𝑒𝑓 − 𝑒𝑐𝑙𝑘,𝑒𝑞
One advantage of the SPECCA index is to allow a comparison between CO2 capture
technologies, independently of the field of application. For example, SPECCA indexes
calculated for cement kilns can be compared with the same indexes calculated for power plants
and other industrial applications.
In Figure 10.1 a graphical representation of the connections between the cement plant and the
electric grid with the performance indexes described above is shown.
Figure 10.1: Representation of the energy flows involving a cement plant in reference cement
plants and in plants with CO2 capture
Ref. Cement Plant
Ref. Power Plant
Electric Grid
Direct fuel consumption
Reference case
Direct CO2
emissions
+ +
Retrofit Cement
Ref. Power Plant
Electric Grid
CO2 capture case
+ +
== ==
CO2
stored
== ==
Direct fuel consumption
Indirect fuel consumption
Indirect fuel consumption
Direct CO2
emissions
Indirect CO2
emissions
Indirect CO2
emissions

Page 67
This project has received funding from the European Union's Horizon2020 Research and Innovation Programme under Grant Agreement No 641185. This work was supported by the Swiss State Secretariat for Education, Research and Innovation (SERI)
under contract number 15.0160.
10.2 Economic indicators
The economic performance of the cement plant with CO2 capture will be evaluated with the
following indexes:
• Cost of clinker (𝐶𝑂𝐶): this is evaluated by summing the contributions of the investment
cost 𝐶𝑖𝑛𝑣, converted into a yearly constant annualized flow through a Capital Carrying
Charge factor, of the fuel cost 𝐶𝐹𝑢𝑒𝑙, of the raw material costs 𝐶𝑅𝑀, of the electricity cost
𝐶𝑒𝑙, of the other O&M cost 𝐶𝑂&𝑀, all referred to the ton of clinker produced (i.e. as
€/tclk). In case the cement plant is characterized by a net power export, revenues for
electricity export to the grid (i.e. negative costs) has to be considered.
𝐶𝑂𝐶 = 𝐶𝑖𝑛𝑣 + 𝐶𝐹𝑢𝑒𝑙 + 𝐶𝑅𝑀 + 𝐶𝑒𝑙 + 𝐶𝑂&𝑀 [€
𝑡𝑐𝑙𝑘]
• Cost of CO2 avoided (𝐶𝐴𝐶): this is evaluated with the following equation, comparing
the cost of clinker and the equivalent specific emissions of the assessed cement plant and
the reference cement plant without CO2 capture:
𝐶𝐴𝐶 =𝐶𝑂𝐶 − 𝐶𝑂𝐶𝑟𝑒𝑓
𝑒𝑐𝑙𝑘,𝑒𝑞,𝑟𝑒𝑓 − 𝑒𝑐𝑙𝑘,𝑒𝑞 [
€
𝑡𝐶𝑂2]
• Cost of clinker with carbon tax (𝐶𝑂𝐶𝐶𝑡𝑎𝑥): in order to compare the cost of clinker for
cement kilns with different CO2 capture rates, it is important to evaluate the economic
impact of the CO2 emitted on the cost of clinker. This cost can be calculated with the
following equation, where the cost of the CO2 emitted as consequence of the carbon tax
(𝐶𝐶𝑡𝑎𝑥) is added to the previous 𝐶𝑂𝐶.
𝐶𝑂𝐶𝐶𝑡𝑎𝑥 = 𝐶𝑖𝑛𝑣 + 𝐶𝐹𝑢𝑒𝑙 + 𝐶𝑅𝑀 + 𝐶𝑒𝑙 + 𝐶𝑂&𝑀 + 𝐶𝐶𝑡𝑎𝑥 [€
𝑡𝑐𝑙𝑘]
where the following equation is used to calculate the 𝐶𝐶𝑡𝑎𝑥 term, as consequence of the
carbon tax 𝑐𝑡𝑎𝑥, expressed as € per ton of fossil CO2 emitted:
𝐶𝐶𝑡𝑎𝑥 = 𝑐𝑡𝑎𝑥 ∙ 𝑒𝑐𝑙𝑘,𝑒𝑞 = 𝑐𝑡𝑎𝑥 ∙ (𝑒𝑒𝑙,𝑐𝑙𝑘 + 𝑒𝑐𝑙𝑘) [€
𝑡𝑐𝑙𝑘]
The cost associated to CO2 emissions takes into account the equivalent CO2 emissions (i.e. both
direct and indirect emissions). Based on this approach, the cost of electricity 𝐶𝑒𝑙 to be used in the
two COC indexes does not change. The increase of the expected cost of electricity as
consequence of the presence of a carbon tax in the economic system is however taken into
account through the contribution of the term 𝑐𝑡𝑎𝑥 ∙ 𝑒𝑒𝑙,𝑐𝑙𝑘.
10.3 Other indicators
Besides carbon dioxide emissions, the cement kiln exhaust gases contain other contaminants
such as SOx, NOx, particulate, etc. released from fuel combustion or by the raw meal. Their final
concentration may depend on the carbon capture technology considered. It is expected that
reliable predictions on the emissions of such contaminants may not be completely clarified by

Page 68
This project has received funding from the European Union's Horizon2020 Research and Innovation Programme under Grant Agreement No 641185. This work was supported by the Swiss State Secretariat for Education, Research and Innovation (SERI)
under contract number 15.0160.
the activities performed in CEMCAP, which focus on CO2 emissions. For such contaminants,
qualitative considerations may be made for each technology assessed.
Other indicators that should be indicated for the technologies assessed are related to space
requirement, in particular the footprint and the total height of the capture plant.

Page 69
This project has received funding from the European Union's Horizon2020 Research and Innovation Programme under Grant Agreement No 641185. This work was supported by the Swiss State Secretariat for Education, Research and Innovation (SERI)
under contract number 15.0160.
11 CASE OVERVIEW
Several different cases will be studied in CEMCAP in addition to the base case. The cases are
related to the amount of air leak, the extent of CO2 capture, the transport option, and the steam
scenario. The cases are described under the relevant topic in this document, and an overview of
the cases with a reference to the relevant chapter is given in Table 11.1.
Table 11.1: Overview of cases studied in CEMCAP.
Case Air leak CO2 avoided
from flue gas
(𝑨𝑪𝒇𝒈)
Transport Steam scenario Relevant chapter
Base case Increasing 90% Pipeline NG boiler and waste heat
Constant low air leak Constant low 90% Pipeline NG boiler and waste heat 3.8
Optional 𝐴𝐶𝑓𝑔 Increasing Optional Pipeline NG boiler and waste heat 7
Ship transport Increasing 90% Ship NG boiler and waste heat 8
Steam import Increasing 90% Pipeline Steam import and waste heat 6.1
Other cases may be studied if they appear to be interesting or particularly relevant for one or
several of the studied technologies.

Page 70
This project has received funding from the European Union's Horizon2020 Research and Innovation Programme under Grant Agreement No 641185. This work was supported by the Swiss State Secretariat for Education, Research and Innovation (SERI)
under contract number 15.0160.
12 SENSITIVITY ANALYSIS
Due to the intrinsic uncertainty and the time-place dependency of some assumptions, a
sensitivity analysis should be performed on the following parameters in the suggested range,
estimating the consequent techno-economic indicators variation:
- Indirect fuel consumption, indirect emission and SPECCA should be calculated with the
efficiency and specific emissions of the power generation technologies indicated in Table
6.5, in addition to the values average European mix of Table 6.4.
- Fuel price: +/- 50% of the reference cost
- Electricity price: +/- 50% of the reference cost
- Steam supply: +/- 50% of the reference cost
- Carbon tax: 0-100 €/tCO2
- Capex of the new technologies: +/- 30%

Page 71
This project has received funding from the European Union's Horizon2020 Research and Innovation Programme under Grant Agreement No 641185. This work was supported by the Swiss State Secretariat for Education, Research and Innovation (SERI)
under contract number 15.0160.
APPENDIX
APPENDIX A – THERMODYNAMIC PROPERTIES
A.1 Air and flue gases
Any EOS suitable for expanded gases, including the ideal gas EOS can be used for temperatures
above 0 °C.
A.2 CO2
Prediction of properties for CO2 rich mixtures should be consistent with GERG-2008 [KUN,
2008]. This equation of state covers the gas phase, liquid phase, supercritical region, and vapour-
liquid equilibrium stated for mixtures of 21 different components typically found in natural gas.
In this model, pure CO2 is modelled by means of the Span and Wagner (1996) equation of state,
which is considered state-of-the-art for this component.
A.3 Reaction enthalpies during the production of cement clinker
Table A.3.1: Kiln feed reactions and reaction enthalpies during the production of Portland
cement clinker [LOC, 2006]
Reaction Reaction equation Standard enthalpy of reaction
[kJ/kg] * [kJ/kg clk]
I. Formation of the oxides, and
decomposition reactions
1. Evaporation of H2O H2Oliq → H2Ovap + 2,453 + 4
2. Kaolinite decomposition ** Al2O3 ∙ 2 SiO2 ∙ 2 H2O → Al2O3
+ 2 SiO2 + 2 H2O
+ 780 + 78
3. Organic clay constituents C + O2 → CO2 - 33,913 -136
4. MgCO3 dissociation MgCO3 → MgO + CO2 + 1,395 + 22
5. CaCO3 dissociation CaCO3 → CaO + CO2 + 1,780 + 2,111
total 1 – 5 + 2,079
II. Formation of intermediate
products
6. Formation of CA CaO + Al2O3 → CA - 110 - 8
7. Formation of C2F 2 CaO + Fe2O3 → C2F - 114 - 6
8. Formation of β-C2S 2 CaO + SiO2 → β-C2S - 732 - 493
total 6 - 8 - 507
III. Sintering reactions 9. Formation of C4AF CA + C2F + CaO → C4AF + 25 + 3
10. Formation of C3A CA + 2 CaO → C3A + 25 + 1
11. Formation of C3S β-C2S + CaO → C3S + 59 + 35
total 9 to 11 + 39
IV. Overall reaction a) Including combustion
kiln meal clinker total of 1 - 11 + 1,611
b) Without combustion total of 1,2,4 - 11 + 1,747 * related to substance in left-hand column ** between 500 and 600 °C in the preheater

Page 72
This project has received funding from the European Union's Horizon2020 Research and Innovation Programme under Grant Agreement No 641185. This work was supported by the Swiss State Secretariat for Education, Research and Innovation (SERI)
under contract number 15.0160.
REFERENCES
[ABA, 2003] J.C. Abanades, et al.: Conversion Limits in the Reaction of CO2 with Lime.
Energy Fuels, 17(2), p. 308-315 (2003)
[ABA, 2004] J.C. Abanades, et al.: Capture of CO2 from combustion gases in a fluidized bed
of CaO. AIChE J., 50(7), p. 1614-1622 (2004)
[ALO, 2010] M. Alonso, et al.: Carbon dioxide capture from combustion flue gases with a
calcium oxide chemical loop. Experimental results and process development.
Int. J. Greenhouse Gas Control, 4(2), p. 167-173 (2010)
[ALS] Alstom: Industrial steam turbines – Sengkang (Indonesia) case study (leaflet)
[ANA, 2011] R. Anantharaman, O. Bolland, N. Booth, E.V. Dorst, C. Ekstrom, F. Franco, E.
Macchi, G. Manzolini, D. Nikolic, A. Pfeffer, M. Prins, S. Rezvani, L.
Robinson: D1.4.3 European best practice guidelines for assessment of CO2
capture technologies. In: DECARBit Project, 2011
[ANA, 2014] R. Anantharaman, D. Berstad, S. Roussanaly: Techno-economic Performance
of a Hybrid Membrane – Liquefaction Process for Post-combustion CO2.
Energy Procedia, Volume 61, p. 1244–1247 (2014)
[ANS] Ansaldo Energia Steam Turbines brochure
[ARI, 2013] B. Arias, et al.: Demonstration of steady state CO2 capture in a 1.7 MWth
Calcium looping pilot. Int J Greenhouse Gas Control, 245, p. 237-245 (2013)
[ASP, 2006] A. Aspelund et al.: Ship Transport of CO2: Technical Solutions and Analysis
of Costs, Energy Utilization, Exergy Efficiency and CO2 Emissions. Chemical
Engineering Research and Design, 09/2006, p. 847-855
[ASP, 2007] A. Aspelund and K. Jordal: Gas conditioning – The interface between CO2
capture and transport. 2007
[BIP, 2006] Bureau International des Poids et Mesures: The International System of Units
(SI). 8th edition, 2006
[BOU, 2013] K. Stéphenne: Start-Up of World's First Commercial Post-Combustion Coal
Fired CCS Project: Contribution of Shell Cansolv to SaskPower Boundary
Dam ICCS Project. Energy Procedia, Volume 63, 2014, p. 6106-6110
[BREF, 2013] JRC Reference Reports - Best Available Techniques (BAT) Reference
Document for the Production of Cement Lime and Magnesium Oxide.
European Commission, 2013
[CEP, 2014] Chemical Engineering, Economic Indicators: Chemical Engineering Plant Cost
Index (CEPCI). 2014
[CHA, 2011] A. Charitos, et al.: Experimental Validation of the Calcium Looping CO2
Capture Process with Two Circulating Fluidized Bed Carbonator Reactors. Ind
Eng Chem Res, 50(16), p. 9685-9695 (2011)

Page 73
This project has received funding from the European Union's Horizon2020 Research and Innovation Programme under Grant Agreement No 641185. This work was supported by the Swiss State Secretariat for Education, Research and Innovation (SERI)
under contract number 15.0160.
[CON, 2012] S. Consonni, F. Viganò: Waste gasification vs. conventional Waste-To-
Energy: A comparative evaluation of two commercial technologies. Waste
Management, 32, p. 653-666 (2012)
[COO, 2017] CoolPack. Software. Available online at:
http://www.en.ipu.dk/Indhold/refrigeration-and-energy-
technology/coolpack.aspx
[DIE, 2014] H. Dieter, et al.: Development of the calcium looping CO2 capture technology
from lab to pilot scale at IFK, University of Stuttgart. Fuel, 217, p. 23-37
(2014)
[EBTF, 2011] EBTF: European best practice guidelines for assessment of CO2 capture
technologies. 2011
[ECR, 2009] ECRA CCS Project – Report about Phase II (TR-ECRA-106/2009). European
Cement Research Academy, 2009
[EUD, 2004] European Union – L32/183: establishing harmonised efficiency reference
values for separate production of electricity and heat in application of
Directive 2004/8/EC of the European Parliament and of the Council – Official
Journal of the European Union
[EUR1] Statistical Office of the European Union (Eurostat) - Supply, transformation,
consumption - electricity - annual data
[EUR2] Statistical Office of the European Union (Eurostat) - Electricity prices
components for industrial consumers - annual data
[EUR, 2017] Eurostat: Statistics Explained – Calculation methodologies for the share of
renewables in energy consumption. http://ec.europa.eu/eurostat/statistics-
explained/index.php/Calculation_methodologies_for_the_share_of_renewables
_in_energy_consumption [Accessed: 14.09.17]
[FRA, 2009] Franco et al. "Common Framework Definition Document". 2009
[GAL, 2006] E. Gal: Ultra cleaning of combustion gas including the removal of CO2. Patent
WO2006022885, USA, 2006
[GAL, 2008] E. Gal: Ultra Cleaning of Combustion Gas Including the Removal of CO2.
Patent US2008/0072762A1, USA, 2008
[GAL, 2011] E. Gal, et al.: Chilled ammonia based CO2 capture system with water wash
system. Patent US2011/0048239A1, USA, 2011
[GÖT, 2004] G. Göttlichter: The energetics of carbon dioxide capture in power plants.
National Energy Technology Laboratory, 2004
[GRA, 2006] G. Grasa, et al.: CO2 Capture Capacity of CaO in Long Series of
Carbonation/Calcination Cycles. Ind Eng Chem Res, 45(26), p. 8846-8851
(2006)
[GSS] GS software, GECoS, Politecnico di Milano.
www.gecos.polimi.it/software/gs.php
[GTW, 2015] Gas Turbine World 2015 Performance Spec

Page 74
This project has received funding from the European Union's Horizon2020 Research and Innovation Programme under Grant Agreement No 641185. This work was supported by the Swiss State Secretariat for Education, Research and Innovation (SERI)
under contract number 15.0160.
[IEA, 2005] CO2 emissions from fuel combustion. International Energy Agency (IEA),
Paris, France, 2005.
[IEA, 2008] IEAGHG: CO2 Capture in the Cement Industry (Report No.: 2008/3). IEA
Greenhouse Gas R&D Programme, 2008
[IEA, 2013] IEAGHG. Deployment of CCS in the cement industry (Report 2013/19). EA
Greenhouse Gas R&D Programme, 2013.
[IEA, 2014] IEAGHG: Assessment of emerging CO2 capture technologies and their
potential to reduce costs (Report No.: 2014/4). IEA Greenhouse Gas R&D
Programme, 2008
[IEA, 2016] IEAGHG: CO2 Capture in Natural Gas Production by Adsorption Processes for
CO2 Storage, EOR and EGR (Report No.: 2016/XX). IEA Greenhouse Gas
R&D Programme, 2016[IPCC, 2005] IPCC Special Report on Carbon
Dioxide Capture and Storage. 2005
[IEA2, 2016] Statistic: Electricity Information. International Energy Agency (IEA), 2016
[IEA, 2017] IEA: Frequently Asked Questions.
https://www.iea.org/statistics/resources/questionnaires/faq/ [Accessed:
14.09.17]
[IUP, 1996] IUPAC: Terminology for membranes and membrane processes. Pure & Appl.
Chem., Vol. 68, No. 7, p. 1479-1489 (1996)
[JAC, 2009] J.A. Jacobs, M. Schneider: Cogeneration application considerations. GE
Energy report, 2009. Available online at
http://site.geenergy.com/prod_serv/products/tech_docs/en/downloads/GER343
0G.pdf
[KOR, 2013] K. Koring, V. Hoenig, H. Hoppe, J. Horsch, C. Suchak, V. Klevenz, B.
Emberger: Deployment of CCS in the Cement industry. In: IEAGHG (Ed.),
2013
[KOZ, 2009] F. Kozak, et al.: Chilled ammonia process for CO2 capture. Energy Procedia,
1(1), p. 1419-1426 (2009)
[KUN, 2008] O. Kunz, W. Wagner: The GERG-2008 Wide-Range Equation of State for
Natural Gases and Other Mixtures: An expansion of GERG-2004
[LIN, 2014] K. Lindqvist, K. Jordal, G. Haugen, K.A. Hoff, R. Anantharaman: Integration
aspects of reactive absorption for post-combustion CO2 capture from NGCC
(natural gas combined cycle) power plants. Energy, 78, p 758-767 (2014)
[LOC, 2006] F.W. Locher: Cement – pronciples of production and use. Verlag Bau +
Technik, Düsseldorf, 2006
[MAR1, 2012] M. Marchi, et al.: Improved process for the production of cement clinker and
related apparatus (in Italian). Patent application MI2012 A00382, Italy, 2012
[MAR2, 2012] M. Marchi, et al.: Process and improved plant for the production of cement
clinker (in Italian). Patent application MI2012 A00383, Italy, 2012

Page 75
This project has received funding from the European Union's Horizon2020 Research and Innovation Programme under Grant Agreement No 641185. This work was supported by the Swiss State Secretariat for Education, Research and Innovation (SERI)
under contract number 15.0160.
[MEL, 2007] T. Melin, R. Rautenbach: Membranverfahren – Grundlagen, Verfahren und
industrielle Anwendungen, Wiley-VCH Verlag, 2007
[NET, 2011] NETL: "Quality guidelines for energy system studies: Cost estimation
methodology for NETL assessments of power plant performance". 2011
[MÜL, 1993] D. Müller: "Erstellung eines modellhaften Wärmenutzungskonzepts an einer
Anlage zur Zementproduction". Master thesis. 1993
[NET1, 2012] NETL: "Quality Guidelines for Energy System Studies: CO2 Impurity Design
Parameters". 2012
[NET2, 2012] NETL: "Quality guidelines for energy system studies: Technology learning
curve (FOAK to NOAK)". 2012
[OFX, 2017] OFX: "Historical Exchange Rates", 2017. Webpage. https://www.ofx.com/en-
gb/forex-news/historical-exchange-rates/ [accessed 13.03.17].
[ROB, 2008] L.M. Robeson: The upper bound revisited. Journal of Membrane Science,
320(1–2), p. 390-400 (2008)
[ROD, 2008] N. Rodríguez, et al.: Process for Capturing CO2 Arising from the Calcination
of the CaCO3 Used in Cement Manufacture. Environ Sci Technol, 42(18), p.
6980-6984 (2008)
[ROD, 2012] N. Rodríguez, et al.: CO2 Capture from Cement Plants Using Oxyfired
Precalcination and/or Calcium Looping. Environ Sci Technol, 46(4), p. 2460-
2466 (2012)
[ROM, 2013] M.C. Romano, et al., The Calcium Looping Process for Low CO2 Emission
Cement and Power. Energy Procedia, 37, p. 7091-7099 (2013)
[ROM, 2014] M.C. Romano, et al.: The Calcium looping process for low CO2 emission
cement plants. The 6th International Conference on Applied Energy. 2014:
Taipei, Taiwan
[SPL, 2010] H. Spliethoff: Power Generation from Solid Fuels. Springer-Verlag, Berlin
Heidelberg, 2010
[TEL, 2012] V. Telikapalli, et al.: CCS with the Alstom chilled ammonia process
development program–Field pilot results. Energy Procedia, 4, p. 273-281
(2011)
[TSC, 2003] I. Tschanun, M. Mineur: Biomass Combustion With State Of The Art
Bubbling Bed Steam Generators. Power-Gen Europe 2003
[VDI, 2003] VDI 2094: Emission Control Cement Plants. VDI-Handbuch Reinhaltung der
Luft, Band 3, 2003
[WER, 2014] M. Werner et al.: Flue gas CO2 mineralization using thermally activated
serpentine: from single- to double-step carbonation. Phys. Chem. Chem. Phys.,
16, p. 24978-24993 (2014);
DOI: 10.1039/C4CP02786H