Embed Size (px)
Citation preview

Interior Least Tern / John Brunjes
Action Plan to Respond to Climate Change in Kentucky
A Strategy of Resilience

Table of Contents Executive Summary……………………………………………………………......3 Intent of Climate Change Chapter of the Wildlife Action Plan………………...4 Climate Change Overview………………………………………………………...5 Historic Climate in Kentucky……………………………………………………..7 Current Climate Change Models and Predictions for Kentucky……………...12 Potential Impacts to Kentucky Habitats………………………………………...17 Potential Impacts to Kentucky Species of Greatest Conservation Need……...21 Potential Social Implications of Climate Change on Kentucky Biodiversity…26
A Strategy of Resilience: Kentucky’s Climate Change Action Items…………28
Conclusion………………………………………………………………………...32 Literature Cited…………………………………………………………………..33 List of Figures
Figure 1. Average annual precipitation for Kentucky 1951-2006…………….10 Figure 2. Average annual temperature for Kentucky 1951-2006 …………….11 Figure 3. Predicted average annual temperature increase through 2050 (º F)...15 Figure 4. Predicted average annual precipitation increase through 2050 (%)...16
List of Tables Table 1. Kentucky Climate Center Data for Historic Climate in Kentucky……9 Table 2. Ecosystem threats potentially arising as a result of warming temperatures and increased flood/drought events……………………...………18
2

Executive Summary
Kentucky’s Wildlife Action Plan (WAP) currently lists 301 species of greatest
conservation need (SGCN). These SGCN collectively depend on ten terrestrial and ten
aquatic habitat guilds represented in the Wildlife Action Plan. All of Kentucky’s habitat
guilds are currently threatened by fragmentation, degradation, and potential loss of
function as described by the 79 conservation issues listed in the WAP (Appendix 3.1).
Global climate change has the potential to compound existing threats to Kentucky’s
species and habitats of conservation concern; and the Environmental Protection Agency
(EPA) predicts the southeastern United States may be vulnerable to the worst of global
warming’s effects (EPA 2010a). In light of this threat, biologists and land managers have
begun to plan for these negative impacts. Although it is not yet known how climate
changes may affect Kentucky’s ecosystems, global models are rapidly being developed,
refined, and down-scaled. At the continental or hemispheric scale of modeling, existing
climate change models are not very effective for informing regional and state-level
management actions. Kentucky-specific predictions vary greatly depending on projected
carbon emissions and predictive model used. For example, The ClimateWizard’s (2008)
high emission scenarios for Kentucky range from a 10% predicted decrease in
precipitation to a 30% predicted increase in precipitation through 2080. The low
emission scenarios range from a 10% predicted decrease in precipitation to a 15%
predicted increase in precipitation (The ClimateWizard 2008). In light of the uncertainty
in these models, Kentucky’s climate change strategy is one of resilience, not resistance.
Instead of resisting the impacts of climate change by reacting to model-driven
predictions, we will adopt a strategy of increasing resilience through direct actions which
3

will increase the probability that species and habitats of conservation concern will adapt
to impacts of climate change throughout Kentucky. This climate change chapter of
Kentucky’s Wildlife Action Plan is meant to be a stand-alone first step towards planning
for and mitigating against negative impacts of climate change. As climate scientists
develop local and regionally-specific models with higher degrees of certainty, this plan
will be revised to focus on detailed, specific actions to safeguard Kentucky’s species and
habitats of greatest conservation need. Below are the six specific goals of Kentucky’s
Climate Change Plan:
The Six specific goals of Kentucky’s Climate Change Plan are as follows:
Goal 1: Conserve and restore functioning ecosystems in Kentucky
Goal 2: Create or protect “key” or “concentrating” habitats Goal 3: Implement multi-agency plans for wildlife corridors/connectivity in Kentucky Goal 4: Monitor fish, wildlife, and ecosystem responses to climate change Goal 5: Evaluate the effectiveness of actions implemented as a result of Kentucky’s Climate Change chapter, and adaptively manage populations and habitats based on monitoring results Goal 6: Continue efforts to educate the public about wildlife conservation and continue efforts to stay optimally informed of current climate change predictions and observed climate change.
Intent of Climate Change Chapter of the Wildlife Action Plan
4

The Kentucky Department of Fish and Wildlife Resources (KDFWR) will utilize existing
climate change resources and await refined models instead of investing time and money
into independent modeling efforts. In light of the need for refined climate change models
for regional and local scales, there will be considerable uncertainty about the rates of
change that can be expected for both temperature and precipitation as a result of global
changes in climate (Karl and Trenberth 2003). Consequently KDFWR’s climate change
strategy is one of resilience, not resistance (Millar et al. 2007). Instead of resisting the
impacts of climate change by reacting to model-driven predictions, Kentucky will adopt a
strategy of increasing resilience through direct actions which will increase the probability
that species and habitats of conservation concern will adapt to impacts of climate change
throughout Kentucky. This Climate Change chapter will be adaptively managed and
revised as new information becomes available. KDFWR will review and revise the
Climate Change chapter every ten years to build upon successful implementation efforts
and edit/adapt parts of this plan that have been unsuccessful.
Climate Change Overview
The international scientific community began dedicated efforts to assess global climate
change beginning in 1989 with the formation of the Intergovernmental Panel on Climate
Change (IPCC). The IPCC was established by the United Nations Environment
Programme (UNEP) and the World Meteorological Organization (WMO). This panel
formed with the intent to provide unbiased, policy-neutral, scientific information
pertaining to the state of climate change and any associated environmental and socio-
economic consequences that may occur as a result of climate change. Honored with the
5

Nobel Peace Prize in 2007, the IPCC is an intergovernmental body, open to all member
countries of the United Nations and the World Meteorological Organization
(http://www.ipcc.ch/organization/organization.htm). The most recent IPCC report (IPCC
Fourth Assessment Report: Climate Change 2007) states, “warming of the climate system
is unequivocal, as is now evident from observations of increases in global average air and
ocean temperatures, widespread melting of snow and ice and rising global average sea
level.” One outcome of the 2007 Intergovernmental Panel on Climate Change report
was a paradigm shift concerning climate change within the scientific community and the
general public. Primarily, the debate shifted from one questioning the existence of global
climate change to one questioning the cause of global climate change (human caused
versus natural). Regardless of the cause of global climate change, most governmental
entities, non-profit organizations, and private entities have now acknowledged that global
climate change is a phenomenon that will require planning actions on many different
fronts. Over the past five years, conservation communities have begun to emphasize
planning and mitigation efforts to minimize impacts of global climate change on
biodiversity. The Weather and Climate section of a recent report issued by the U.S. U.S.
Environmental Protection Agency (EPA 2010) corroborated the 2007 IPCC report by
providing long term trends for climate change indicators like temperature and sea level
between 1901 and 2009. The U.S. Environmental Protection Agency report (2010) noted
that average temperatures have risen across the lower 48 states since 1901, with an
increased rate of warming over the past 30 years. The EPA report also states that some
parts of the United States are warming more than others, with the North, West and Alaska
seeing temperature increases greater than parts of the South (EPA 2010). Precipitation
6
trends reported by EPA indicate that eight of the top 10 years for extreme one-day
precipitation events (between 1910 and 2008) have occurred since 1990, and sea levels
between 1993 and 2008 rose twice as fast as the long term recorded trends (EPA 2010).
As agencies come to a consensus that global changes in climate are occurring, the next
step is to design and implement response plans.
State fish and wildlife management agencies aim to conserve game and non-game fish
and wildlife resources for all citizens. In light of potential global climate change impacts
to ecosystems, several strategies have emerged. The two main strategies employed by
the conservation community to address potential changes are: 1) Strategies of resilience
which seek to help fish, wildlife and their habitats adapt to climate change; and 2)
Strategies of resistance which seek to use models to predict direct impacts of climate
change and employ actions to prevent these changes from impacting fish and wildlife
populations. Although direct impacts to fish and wildlife populations as a result of
climate change are difficult to predict, state fish and wildlife agencies across the nation
are dedicating thought to this issue in an attempt to proactively conserve fish and wildlife
populations amidst predicted global changes in climate.
Historic Climate in Kentucky
Prior to making an action plan aimed at conserving fish and wildlife populations in the
face of climate change, we must first obtain a thorough understanding of historic climate
parameters within the Commonwealth. Climatic data for Kentucky has been collected
since 1825 by various entities including: the U.S. Army, Smithsonian Institute, U.S.
7

Army Signal Corps, U.S. Department of Agriculture, U.S. Department of Commerce, and
the Kentucky Climate Center. The below table (Table 1) displays temperature and
precipitation changes for Kentucky between 1901-2008 and 1970 – 2008. Between 1901
and 2008, slight increases in temperature are evident in Kentucky for all seasons except
summer, and for 1970 through 2008, increasing temperature trends are evident for all
seasons (Table 1). Precipitation trends for Kentucky differ between 1901-2008 and
1970-2008, though statistical analyses of these data were not offered at the Kentucky
Regional Climate Change Forum (Foster 2009). Between 1970 and 2008, decreased
precipitation during the winter, spring, and summer months was offset by an increase in
fall precipitation, resulting in a slight increase (1.3%) in annual precipitation amounts
(Foster 2009). In contrast, between 1901 and 2008, precipitation amounts in Kentucky
were 5.7% greater than the annual average (climate records for Kentucky date back to
1825) with a deficit of 9.3% in the winter and a 13% increase in fall precipitation when
compared to average values (Table 1; Foster 2009). The Environmental Protection
Agency’s draft report on climate change impacts to the southeastern United States (EPA
2010a) displays the trend of increasing drought conditions throughout Kentucky between
1958 and 2007.
Then Nature Conservancy’s ClimateWizard is another source of historical climate data
for Kentucky. This model, developed by The Nature Conservancy, The University of
Washington, and The University of Southern Mississippi, is a web based program that
allows users to view historic temperature and rainfall maps, predictions of temperature
and rainfall, and climate change projections based on various carbon emission scenarios
8

through 2080. The ClimateWizard is a publicly available resource accessed here:
http://www.climatewizard.org/. ClimateWizard data for historical climate was provided
by PRISM Group, Oregon State University, created 4 Feb 2007, while base climate
projections were downscaled by Maureer et al. (2007) for use in ClimateWizard models.
Historical climate data maps within the ClimateWizard are created from thousands of
geographically distinct recording stations using Parameter-elevation Regressions on
Independent Slopes Models (PRISM).
Table 1. Historic climate in Kentucky. Temperature and precipitation changes for Kentucky. Data collected by the Kentucky Climate Center (http://kyclim.wku.edu/dataSources.htm). Table is based on statewide average temperature and precipitation. Values are calculated based on smoothed averages specific to 1901, 1970, and 2008. Smoothing is by LOESS nonparametric regression and 30-year span (Foster 2009).
Temperature Change in ºF Precipitation Change in %
1901-2008 1970-2008 1901-2008 1970-2008
Annual 0.9 1.4 Annual 5.7 1.3
Winter 2.2 1.9 Winter -9.3 -0.7
Spring 0.6 0.9 Spring 10.0 -0.1
Summer -0.6 0.8 Summer 6.1 -0.7
Fall 0.6 1.2 Fall 13.0 1.1
PRISM uses point measurements of precipitation and temperature to produce continuous
estimates of yearly climatic parameters. More information about PRISM can be found
here: http://www.prism.oregonstate.edu.
9

10

Figure 1 and Figure 2 display The ClimateWizard data for average annual temperature
and average annual precipitation amounts for the past 50 years (1951-2009).
The ClimateWizard models display average annual precipitation amounts (between 1951
and 2006) ranging from a high of 64.96 inches to a low of 39.16 inches (Figure 1). The
northern parts of Kentucky are typically drier, with the northeastern portion of the state
exhibiting the driest trends (Boone, Kenton, Campbell, Greenup, and Boyd Counties).
Southern areas in Kentucky display higher annual precipitation averages, particularly the
southeastern portion of the state. The wettest areas in Kentucky historically are in Harlan
and Bell Counties, in the Black Mountain/Pine Mountain areas. Average annual
temperature trends between 1951 and 2006 display a different pattern (Figure 2), with
the eastern portion of the state generally cooler and the western portion of the state
11

displaying warmer trends. The ClimateWizard’s average annual temperature trends in
Kentucky between 1951 and 2006 range from an average annual low of 52.11º F (Jackson
County, parts of Harlan and Bell Counties) to an average annual high of 59.31 º F (all
counties west of Land Between the Lakes). In contrast to the historic trends obtained
from the ClimateWizard, the rate of precipitation change between 1901 and 2008
reported by the U.S. Environmental Protection Agency for Kentucky (U.S. and Global
Precipitation 2010) displays a decreasing precipitation trend for southeastern Kentucky,
no change in precipitation for Northeast Region, and increases in precipitation of between
1 and 10% for the remainder of Kentucky. Although southeastern Kentucky is
historically the wettest region of the state (ClimateWizard 2008), this region of Kentucky
has experienced the largest decrease, up to a 10% decrease, in precipitation between 1901
and 2008 (EPA 2010).
Current Climate Change Models and Climate Predictions for Kentucky
Within the past decade, numerous climate change models have been developed. Thus far,
these models have been based on global trend data, then predictions have been
“downscaled” to the regional, state, or county level. It is important to keep in mind that
each time a model is “downscaled” the degree of model uncertainty increases. For
climate change predictions, The ClimateWizard uses a global climate model output, from
the World Climate Research Programme’s Coupled Model Intercomparison Project phase
3 multi-model dataset (Meehl et al. 2007). These data were downscaled as described by
Maurer et al. (2009) using the bias-correction/spatial downscaling method (Wood et al.
12

2004) to a 0.5 degree grid, based on the 1950-1999 gridded observations of Adam and
Lettenmaier (2003). The ClimateWizard allows the user to select various carbon
emission scenarios to evaluate the range of potential changes in temperature and
precipitation that may occur over the next several decades.
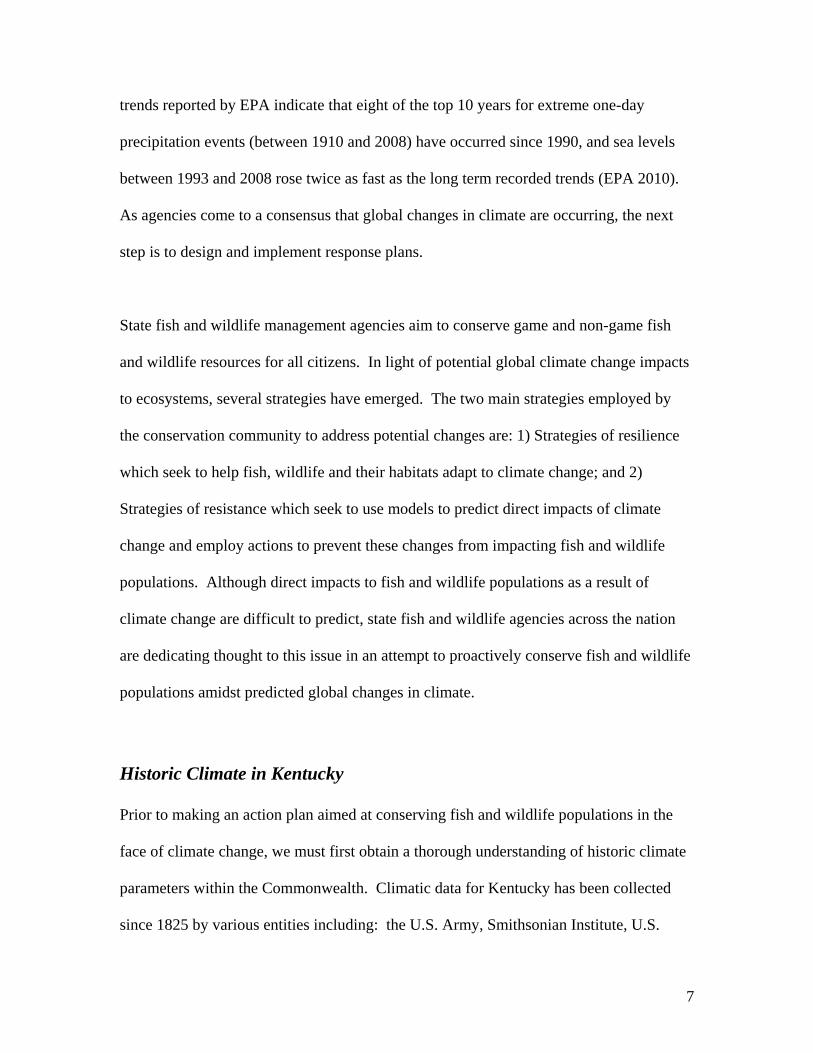
Depending on the emission scenario, which assumes different values for global
population, technology, energy, land use, economy, and agriculture, the ClimateWizard
estimates increases in average annual temperatures between 3.6º and 5.1º F for Kentucky
between 2006 and 2050 (Figure 3). The high emission models display greater
temperature increases for northern counties in Kentucky, while the low emission models
display greater temperature increases for the western portion of the state (e.g. Fulton,
Hickman Counties). For all emission scenarios, southeastern Kentucky is expected to
experience the least amount of change in average annual temperatures through 2050.
The ClimateWizard’s precipitation predictions for Kentucky are much less consistent
than temperature predictions. High emission scenarios range from a 10% decrease in
precipitation to a 30% increase in precipitation, while low emission scenarios range from
a 10% decrease in precipitation to a 15% increase in precipitation. Figure 4 displays
average annual percent precipitation change expected for Kentucky through 2050, using
average values for all low emission models and average values for all high emission
models. These models predict increases in precipitation ranging from 1.5% (using the
low emission model) to 8.6% (using the high emission model). Greatest increases from
average annual precipitation amounts are predicted to occur in the Bluegrass and
Southeast regions of Kentucky for all emission scenarios, while the Western Coal Field
13

and Mississippi Embayment regions of the state appear to be least affected (see Appendix
1.6 for map of Kentucky’s physiographic regions).
Regardless of deviations from average precipitation amounts, drought and flood events
are predicted to be more frequent, which means rainfall intensity/duration is expected to
fluctuate with global changes in climate, even if there is little overall departure from
historic precipitation amounts. The number of days per year exceeding the 90th
percentile for daily precipitation amounts have been increasing in the United States, and
these events are responsible for a disproportionate share of the observed increases in total
annual precipitation (Groisman et al. 1999; Karl and Knight 1998). The U.S.
Environmental Protection Agency reported an increasing trend in extreme one-day
precipitation events in the lower 48 states between 1990 and 2008 (EPA 2010).
Occurrence of extreme single-day precipitation events appeared to remain static between
1910 and 1980, but has recently risen in the lower 48 states. Between 1910 and 1980,
approximately 10% of the land area in the lower 48 states experienced extreme one-day
precipitation events in any given year. Between 1980 and 2008, 15% of land area in the
lower 48 states received extreme one-day precipitation events (EPA 2010). Coupled with
increasing trends in extreme single-day precipitation events, drought is expected to
become more prevalent throughout the United States and globally (Le Houerou 1996).
Horton (2009) displays drought trends for the United States between 1958 and 2007 and
characterizes all of Kentucky as “increasing drought.”
14

15

16
Potential Impact of Changing Climates to Habitats of Greatest
Conservation Need in Kentucky
Kentucky’s Wildlife Action Plan lists ten terrestrial and ten aquatic habitat guilds which
represent the ecosystems required by SGCN in Kentucky (Volume III, Appendix 3.5).
Although Kentucky’s Wildlife Action Plan lists 79 conservation issues for these habitats
(Volume III, Appendix 3.1), habitat alteration and fragmentation are the two greatest
threats to Kentucky’s Species and habitats of Greatest Conservation Need (SGCN).
Many of the 79 conservation issues listed in the Wildlife Action Plan have the potential
to cause major habitat changes which could result in population declines of SGCN.
Examples of conservation issues which negatively impact habitats include: stream
channelization/ditching (Issue 2E), coal mining (Issue 1A), road construction (Issue 1C),
and urban/residential development (Issue 3F). Climate change has the potential to
exacerbate existing conservation threats to habitat guilds in Kentucky by altering both
terrestrial and aquatic systems. Table 2 lists Kentucky’s terrestrial and aquatic guilds
and the threats potentially posed by global climate change. These threats (Table 2)
represent a “worst case scenario” of impacts to Kentucky’s habitat guilds. It is important
to note that human/nature/climate interactions are extremely difficult to forecast and the
actual impacts of future climate change may be very different from the threats listed
below.
17

Table 2. Ecosystem threats which may be exacerbated by clmate change (e.g. warming
temperatures, increased prevalence of drought, increased prevalence of flood conditions).
Guild Threats
Cave Streams • Increased siltation and turbidity caused by higher intensity/higher frequency of flood events.
• Increases in herbicide, fungicide, and insecticide pollution due to flood events and subsequent run-off into sink holes.
• Lowered levels of surface permeability in certain watersheds due to drought cycles.
• Invasion of non-native species • Potential loss of nutrients in cave streams due to
decreases in bat and cave invertebrate populations. Large rivers in current • Increased siltation and turbidity caused by higher
intensity/higher frequency of flood events. • Increased nutrient loads due to potential increase in
flood events/ run-off • Increases in herbicide, fungicide, and insecticide
pollution due to increase in flood events/ run-off • Lowered levels of surface permeability in certain
watersheds • Invasion of non-native species • Channel alteration/dredging • Altered hydrology due to increased water demands as
human populations shift inland Large rivers in slackwater • Increased siltation and turbidity caused by higher
intensity/higher frequency of flood events. • Increased nutrient loads due to potential increase in
flood events/ run-off • Increases in herbicide, fungicide, and insecticide
pollution due to increase in flood events/ run-off • Lowered levels of surface permeability in certain
watersheds • Invasion of non-native species • Channel alteration/dredging • Altered hydrology due to increased water demands as
human populations shift inland Lowland streams in riffle • Increased siltation and turbidity caused by higher
intensity/higher frequency of flood events. • Increased nutrient loads due to potential increase in
flood events/ run-off • Increases in herbicide, fungicide, and insecticide
pollution due to increase in flood events/ run-off • Lowered levels of surface permeability in certain
watersheds
18

• Invasion of non-native species Lowland streams in slackwater • Increased siltation and turbidity caused by higher
intensity/higher frequency of flood events. • Increased nutrient loads due to potential increase in
flood events/ run-off • Increases in herbicide, fungicide, and insecticide
pollution due to increase in flood events/ run-off • Lowered levels of surface permeability in certain
watersheds • Invasion of non-native species
Medium to large streams • Increased siltation and turbidity caused by higher intensity/higher frequency of flood events.
• Increased nutrient loads due to potential increase in flood events/ run-off
• Increases in herbicide, fungicide, and insecticide pollution due to increase in flood events/ run-off
• Lowered levels of surface permeability in certain watersheds
• Invasion of non-native species • Channel alteration/dredging
Small to medium streams • Increased siltation and turbidity caused by higher intensity/higher frequency of flood events.
• Increased nutrient loads due to potential increase in flood events/ run-off
• Increases in herbicide, fungicide, and insecticide pollution due to increase in flood events/ run-off
• Lowered levels of surface permeability in certain watersheds
• Invasion of non-native species Upland headwater streams in pools • Increased siltation and turbidity caused by higher
intensity/higher frequency of flood events. • Increased nutrient loads due to potential increase in
flood events/ run-off • Increases in herbicide, fungicide, and insecticide
pollution due to increase in flood events/ run-off • Lowered levels of surface permeability in certain
watersheds • Invasion of non-native species
Upland streams in pools • Increased siltation and turbidity caused by higher intensity/higher frequency of flood events.
• Increased nutrient loads due to potential increase in flood events/ run-off
• Increases in herbicide, fungicide, and insecticide pollution due to increase in flood events/ run-off
• Lowered levels of surface permeability in certain watersheds
• Invasion of non-native species Upland streams in riffles • Increased siltation and turbidity caused by higher
intensity/higher frequency of flood events.
19

• Increased nutrient loads due to potential increase in flood events/ run-off
• Increases in herbicide, fungicide, and insecticide pollution due to increase in flood events/ run-off
• Lowered levels of surface permeability in certain watersheds
• Invasion of non-native species Caves, rock shelters, and clifflines • Invasion of non-native species
• Sandstone formations, particularly south facing faces, may become drier and uninhabitable to unique plant communities.
Cumberland highland forest • Invasion of non-native species • Insect pest (e.g. Southern pine beetle, hemlock
whooly adelgid) infestations may intensify. Overall forest health may be adversely affected by increased insect populations, since insect development is temperature dependent (Simberloff 2000).
• South facing slopes may become more arid. • Extended periods of hot/dry weather may increase the
frequency of wildfires Emergent and shrub-dominated wetlands • Invasion of non-native species
• Wetland hydrology may be altered due to increasing temperatures and/or drought conditions.
Forested wetland • Invasion of non-native species • Wetland hydrology may be altered due to increasing
temperatures and/or drought conditions • Forest cover may increase if extent of rising
temperatures and/or drought decrease the amount of wetland coverage along the margins of the wetland.
Grassland/ agriculture • Invasion of non-native species • Public perception of prescribed fire may become
increasingly negative due to increased frequency of wildfires. Fire suppression in grassland habitats may result in succession to non-grassland habitats
Running water • Invasion of non-native species • Total guild area may decrease if drought conditions
become prevelant • Wetland hydrology may be altered due to increasing
temperatures and/or drought conditions • Increased siltation and turbidity • Increased nutrient loads due to potential increase in
flood events/ run-off • Increases in herbicide, fungicide, and insecticide
pollution due to increase in flood events/ run-off • Lowered levels of surface permeability in certain
watersheds Savanna/ shrub/scrub • Invasion of non-native species
• South facing slopes may become more arid. • Extended periods of hot/dry weather may increase the
20

frequency of wildfires Standing water • Invasion of non-native species
• Total guild area may decrease if drought conditions become prevelant
• Wetland hydrology may be altered due to increasing temperatures and/or drought conditions
• Increased siltation and turbidity • Increased nutrient loads due to potential increase in
flood events/ run-off • Increases in herbicide, fungicide, and insecticide
pollution due to increase in flood events/ run-off • Lowered levels of surface permeability in certain
watersheds Upland forest • Invasion of non-native species
• Insect pest (e.g. Southern pine beetle, hemlock whooly adelgid) infestations may intensify. Overall forest health may be adversely affected by increased insect populations, since insect development is temperature dependent (Simberloff 2000).
• South facing slopes may become more arid. • Extended periods of hot/dry weather may increase the
frequency of wildfires Urban/ suburban • Invasion of non-native species
• Extended periods of hot/dry weather may increase the frequency of wildfires
• Increase in total area of this guild in Kentucky is possible if human populations shift inland, away from turbulent coastal areas.
• Small size and lack of connectivity of urban/suburban natural areas may decrease the likelihood that local populations adapt to environmental changes.
Potential Impact of Changing Climates to Species of Greatest
Conservation Need in Kentucky
Kentucky’s Wildlife Action Plan currently lists 301 species of greatest conservation need
(SGCN) including the following taxonomic groups: mammals, birds, amphibians,
21

reptiles, mussels and fishes. An additional 25 crayfish species of greatest conservation
need will be added during the 2010 Wildlife Action Plan revision. Some of these species
have undergone significant population declines over the past three decades, some require
specialized habitats or breeding locations, some are endemics with very small
distributions in Kentucky, and some of these species are of concern because non-native
invasive species or diseases threaten population persistence. Since global climate change
has the potential to exacerbate existing threats to species and habitats of conservation
concern, we have compiled the below list of “worst case scenario” possible adverse
impacts to SGCN in Kentucky.
Fishes and Lamprey
• If stream temperatures become warmer, nonmigratory fishes may move upstream, seeking cooler areas to feed and reproduce. Habitat for cold and cool water fish in the United States may be reduced by up to 50% (Eaton and Scheller 1996).
• Higher temperatures in streams may lower dissolved oxygen levels and
negatively impact fish populations since stress levels for fishes will increase.
• Higher temperatures in headwater streams may result in declining populations or fragmentation of coldwater fish and/or headwater stream specialists (similar to model predictions developed for the Pacific Northwest salmon populations; Battin et al. 2007).
• If catastrophic rain events increase, increasing siltation, nonmigratory fishes
may move upstream, seeking more oxygenated waters.
• Increases in siltation may result in lowered recruitment for fishes whose eggs may be smothered by siltation.
• Fish kills may become more common as aquatic habitats become altered.
• Spawning patterns may be disrupted due to increased temperatures, siltation, or
alterations to tradition stream flows (e.g. due to increased prevalence of drought followed by flooding).
22

• Increased frequency of drought may reduce invertebrate productivity thereby
reducing food available to fish.
• Increased frequency of drought may result in increased demand for water resources. If water demand increases, microhabitat availability may decrease (less wet, emergent areas). In rivers with reduced discharge, up to 75% of local fish biodiversity may be at risk for extinction by 2070 (Xenopaulos et al. 2005).
• Year class failures may result from water level fluctuations and increased
turbidity (e.g. for Crappie, Tennessee Wildlife Resource Agency 2009).
• Flood control efforts resulting in dam installations could limit the ability for fish to migrate upstream/downstream in response to unfavorable local conditions. Northward flowing corridors (e.g. Kentucky River) may become increasingly important to fish and mussel adaptation.
• Endemic species and species that occur at low densities will be most at risk for
extinction (Schwartz et al. 2006).
Mammals
• Bat species have specific roost requirements. Oftentimes these requirements are met by only a small number of caves within the bat’s geographic range (Humphrey 1978; Tuttle 1979). Outside and interior cave temperatures are correlated (Smithson 1991). Winter cold snaps often contribute to ideal roosting conditions in caves since this cool air “settles” into passageways within the cave (John MacGregor, pers. comm.). If climate change results in fewer cold snaps, some hibernacula may be less conducive to hibernating bats.
• The push for alternative energy may result in increases in wind turbines and
increasing incidents of direct mortality in migrating bats.
• Warmer temperatures may increase stress to bat populations during hibernation, resulting in bats with lowered fat reserves during spring emergence.
• Warmer temperatures may facilitate the spread of mammalian diseases. Longer
activity periods and warmer fall temperatures may allow a longer transmission window for White Nose Syndrome in bats.
Amphibians
• The frequency of ephemeral breeding ponds holding water through
metamorphosis may decrease with increases in temperatures, or increases in drought, which would result in lower recruitment. In areas where rainfall
23

averages remain constant, amphibian recruitment may decrease if flood events occur during non-breeding times of the year.
• Amphibians have limited dispersal ability. As a result, moving to more favorable
breeding areas may be problematic, and may result in isolated populations and local/regional extirpation of populations. Limited dispersal abilities make amphibians especially vulnerable to rapid habitat changes and localized extirpations (Schneider and Root 1998).
• Aquatic salamander (Eastern Hellbender, Cryptobranchus alleganiensis, and
Mudpuppy, Necturus maculosus) populations may decline as a result of temperature increases in streams, increased turbidity, and increased siltation. Often limited by refugia (large boulders/rocks), these species may not be able to migrate upstream to cooler areas.
• Changes in climate may result in range expansions/contractions for amphibians.
Populations of salamanders inhabiting high elevations (e.g. Mountain Dusky Salamander, Desmognathus ochrophaeus and the Cumberland Plateau Salamander, Plethodon kentucki) may move higher in elevation, while some frog populations (e.g. Crawfish Frog, Rana areolata) may shrink in distribution as breeding habitats become unsuitable due to early drying.
• Changes in ambient and water temperatures may result in increased frequency of
mortality and morbidity events due to Batrachochytrium dendrobatidis (Chytrid Fungus), Ranavirus, and other amphibian diseases which have been linked to catastrophic amphibian declines worldwide (Skerratt et al. 2007).
Reptiles • Reptiles favoring wetland/mesic areas may have less available habitat if
warmer/drier trends and/or increasing drought trends continue.
• If warmer/drier weather patterns allow non-native species to invade open water and grassland areas, reptiles may have less available or more fragmented habitats.
• Road mortality and habitat fragmentation for reptiles may increase as the human
population moves inland to avoid coastal problems exacerbated by climate change (hurricanes, coastal degradation, tropical storms).
Birds
• Since avian ranges are strongly associated with temperature (Root 1988), ranges of breeding birds in North America may continue to shift northward at the current rate of 2.35 km/year, or more rapidly if warming trends become more pronounced (Hitch and Leberg 2007).
24

• Migrants may no longer arrive on breeding grounds in time for peak insect
emergence. Spring arrival dates of migratory breeding birds may differ from historic trends (Wilson 2007).
• If mistimed spring arrival occurs frequently, reproductive success of neotropical
migrants will decrease.
• Island breeding habitats (e.g. sand bar islands on the Mississippi and Ohio Rivers) may be inundated by flood events during prime breeding dates for species such as the Interior Least Tern (Sterna antillarum athalassos), resulting in lowered recruitment. Flood events may also decrease nest success of other SGCN which often nest close to water (e.g. Bald Eagle, Haliaeetus leucocephalus; Prothonotary Warbler, Protonataria citrea; Osprey, Pandion haliaetus).
• Laying dates for birds may advance in response to long-term increases in spring
temperatures. In North America, the long-term laying dates advanced over time for Red-winged Blackbirds (Agelaius phoeniceus, between 1956 and 2000), Eastern Bluebirds (Sialia sialis, between 1950 and 2000), and Song Sparrows (Melospiza melodia) between 1962 and 1993) (Torti and Dunn 2005). Similar trends may occur for SGCN.
• If drought conditions increase in frequency/severity, insect availability will be
reduced thereby reducing prey availability for birds.
• Short distance migrants may exhibit earlier spring arrival dates, earlier nesting, and some species may soon spend winters in Kentucky instead of migrating short distances to more southern wintering grounds.
• Possible changes in migratory patterns and species ranges due to climate change
have the potential to result in increased competition for resources for many SGCN.
• If tropical habitats become drier (more xeric), neotropical migrants may have
lower survival during spring migration, arrive on breeding grounds in poor condition, be more vulnerable to predation, and/or be less likely to successfully reproduce.
• Species that nest at high elevations (Golden-Winged Warbler, Vermivora
chrysoptera, Rose-Breasted Grosbeak, Pheucticus ludovicianus, Blackburnian Warbler, Dendroica fusca, Canada Warbler, Wilsonia Canadensis, and Least Flycatcher, Empidonax minimus) may no longer find suitable nesting habitat in Kentucky if high elevation areas become warmer and drier. Price (2002) predicts loss of several species which are specialists to high elevation habitats in Tennessee.
25

• If the Prairie Pothole region is severely impacted, waterfowl populations may shift to new breeding grounds which may result in lowered recruitment and productivity of populations. In a recent model published by Johnson et al. (2010), the Prairie Pothole region appears to be much more sensitive to warming and drying than previously thought. This model predicts major reductions in water volume, shortening of the time water remains in wetlands, and changes to wetland vegetation dynamics in an 800,000-square kilometer region in North and South Dakota, Montana, Minnesota, Iowa, and Canada. The most productive habitat for breeding waterfowl within the Prairie pothole region may shift to the wetter eastern and northern fringes, where most wetlands have been drained (Johnson et al. 2005).
• Northern breeding grounds may become drier (Johnson et al. 2005). This could
result in lower reproductive success for waterfowl currently breeding in these areas, which over-winter in Kentucky.
• Open water areas in the north may remain longer than usual due to warmer air
temperatures. This could result in declines in waterfowl and Bald Eagle populations utilizing southern states during the winter.
Freshwater Mussels
• Changes in stream flow (flood regimes, precipitation patterns) could impact
abundance and diversity of freshwater mussels. Large floods have been shown to adversely affect mussel populations (Hastie et al. 2003).
• Mussel populations may decline and recruitment may decline as a result of
increased sedimentation and turbidity in aquatic habitats. Streams with healthy groundwater (e.g. karst in the Green River system) will become critical in buffering impacts of climate change.
• Altered stream morphology may adversely affect populations.
• Flood control efforts could limit the ability for range shifts when dams are built.
Crayfish
• Increased human demands for water resources and/or prevalence of drought conditions may lower the water table and decrease suitable habitat for crayfish. Nonburrowing crayfish have been shown to exhibit large drought-induced population changes; specifically, reductions in adult population densities and body size (Taylor 1983).
• Warming temperatures may increase the likelihood of establishment of non-
native, invasive aquatic species of crayfish (Rahel and Olden 2008).
26

Potential Social Implications of Climate Change on Kentucky Biodiversity
Global climate change is predicted to potentially impact water resources in the United
States and coastal communities. The U.S. Environmental Protection Agency projects sea
level rise at a rate of 200 – 500 mm between the years 2000 and 2100 (2009). In addition
to predictions of rising sea levels, a report by the U.S. Climate Change Science Program
(2008) states, “based on a range of models, it is likely that future tropical cyclones
(typhoons and hurricanes) will become more intense, with larger peak wind speeds and
more heavy precipitation associated with increases of tropical storms.” With the
predicted increases in severity of hurricanes and tropical storms, coupled with potential
shore line losses in Florida and throughout the eastern seaboard, people may begin
migrations inland to the Midwestern United States and land-locked states such as
Kentucky. If and when these events occur, Kentucky may experience human population
growth unprecedented to the Commonwealth. During the last U.S. census survey (U.S.
Census Bureau 2000), most Kentucky counties exhibited trends of 4.4% -19.5%
population growth between 1990 and 2000. From 2001 through 2005, an estimated 105
acres of forest were lost every day in Kentucky to land-cover conversion (Zourarakis
2009). In contrast to Kentucky’s trends of 4.4% - 19/5% population growth, coastal
Florida was characterized by many counties with growth in the 45% - 191% range during
this same time period (1990 – 2000). If these trends were to reverse (e.g. migration of
people inland), Kentucky could experience a statewide boom in growth and development;
consequently, a statewide boom in habitat loss would also occur. In the case that a
human population boom were to occur in Kentucky, identifying and conserving key
conservation areas and wildlife corridors in Kentucky would become critical. Without
27

the identification of these connected parcels of habitat, wildlife managers and biologists
may not be able to minimize the impact of future increases in development and
urbanization on biodiversity within the state. The interaction of social changes and
climatic changes that may occur in the future could result in adverse affects to fish,
plants, and wildlife that are not currently foreseeable.
A Strategy of Resilience: Kentucky’s Climate Change Action Items
The main goal of this document is to outline actions designed to enhance ecosystem
resilience to climate change. The following actions seek to restore and maintain habitats
and populations of conservation concern, increase the ability of populations to adapt to
climate change-driven stressors, and reduce known stressors such as habitat
fragmentation, habitat loss, invasive species, and disease threats.
Goal 1: Conserve and restore functioning ecosystems in Kentucky; sustain social-ecological systems and functions. By conserving and restoring functioning ecosystems, Kentucky will harbor healthier SGCN populations. In turn, these populations will be able to persist despite environmental threats resulting from global climate change. Regional conservation actions which improve the capacity of both ecological and human systems to deal with the impacts of climate change (Game et al. 2010) will be optimally beneficial.
• Action 1a. Fully implement Kentucky’s Wildlife Action Plan
• Action 1b. Utilize Natural Resources Conservation Service (NRCS) programs and other funding sources to protect headwater streams and conserve and restore riparian buffers.
• Action 1c. Facilitate and assist with the development of Kentucky’s Prescribed
Fire Council and with the goals and objectives identified by this group.
• Action 1d. Create and implement habitat improvement teams on both private and public lands in Kentucky.
• Action 1e. Create early successional habitats on mitigated minelands to benefit
grassland guild species such as: Grasshopper Sparrow (Ammadramus
28
savannarum), Henslow’s Sparrow (Ammadramus henslowii), Northern Bobwhite (Colinus virginianus), Eastern Box Turtle (Terrapene Carolina), Coal Skink (Plestiodon anthracinus), Eastern Hog-Nose Snake (Heterodon platirhinos), American Woodcock (Scolopax minor), etc.
• Action 1f. Implement early detection and rapid response programs for non-native
invasive species such as Cogongrass, and Asian Carp.
• Action 1g. Implement early detection and rapid response programs for wildlife disease threats (e.g.Chytrid Fungus, Batrachochytrium dendrobatidis).
• Action 1h. Improve the quality of existing habitats to decrease the likelihood of
invasive species becoming established.
• Action 1i. Implement the Kentucky Department of Fish and Wildlife Resources Quail Restoration Plan (Morgan and Robinson, 2008) to benefit suites of grassland bird species.
• Action1j. Implement the Northern Bobwhite Conservation Initiative Quail Plan to
benefit suites of grassland bird species.
• Action 1k. Implement freshwater adaptation approaches (Groves et al. 2010) to enable aquatic ecosystems to provide for both human and wildlife needs in the face of changing climates (e.g. invest in applied research on the impacts of climate change on specific ecosystems and link adaptation strategies to this research).
Goal 2: Create or protect “key” habitats. “Key” habitats often harbor a high proportion of individuals for certain species. For example, a Priority 1 hibernacula for the federally listed Indiana Bat may harbor greater than 25% of Kentucky’s Indiana bat population in the winter months. Protecting these types of habitats is vital to long-term population persistence of multiple SCGN.
Action 2a. Identify and protect refugia and concentrating habitats for species of greatest conservation need, particularly subterranean systems and breeding areas. Identify and protect climatic refugia and associated biodiversity. “Climatic refugia” (Game et al. 2010) are areas that are least likely to undergo significant climate induced changes.
• Action 2b. Restore stream and river channels utilizing mitigation (FILO) and other
funding.
• Action 2c. Continue surveillance efforts for White Nose Syndrome in Kentucky. Implement Kentucky’s White Nose Syndrome response plan when/if this disease is detected in Kentucky.
29

• Action 2d. Create/restore breeding habitats for species for which breeding habitats
are limiting. Implement translocation programs for these species if necessary for population persistence.
• Action 2e. Facilitate Safe Harbor Agreements on private lands in Kentucky
housing key or concentrating habitats.
• Action 2f. Restore original air flow patterns in caves with evidence of large bat populations prior to human modification. Restoration practices may include creating air dams to cool caves and/or opening sink holes that have been filled with debris or human garbage.
Goal 3: Implement multi-agency plans for wildlife corridors/connectivity in Kentucky. Habitat loss and fragmentation are two of the greatest threats to biodiversity in Kentucky and globally. It is critical to identify and conserve wildlife corridors and establish connectivity between key habitats (e.g. breeding habitats and over-wintering habitats) for all taxonomic groups. If conservation and connectivity of is not established on a large scale for each habitat guild in Kentucky, population declines for many SGCN are inevitable. Furthermore, if temperature gradients change over time in Kentucky, corridors will facilitate the movement of fish and wildlife populations to suitable habitats/thermal regimes.
• Action 3a. Encourage the development of land trusts to work towards conserving areas of high importance in local communities.
• Action 3b. Implement habitat improvement teams aimed at restoring key
habitats/corridors in Kentucky.
• Action 3c. Implement riparian habitat protection programs which take advantage of existing riparian corridors. Work with partners to develop and encourage wider adoption of Best Management Practices (BMPs) along riparian corridors.
• Action 3d. Increase aquatic connectivity by removing defunct dams and replacing
culverts to facilitate dispersal and adaptation of fish and mussel species. Human safety is also a concern with these defunct dams; 26% of Kentucky’s dams are considered “High Hazard Potential” to humans (National Inventory of Dams, 2010). Partner with the U.S. Army Corps of Engineers and the Tennessee Valley Authority to install fish ladders on dams where fish passage is restricted.
• Action 3e. Form a working group with the Kentucky Department of
Transportation (KDOT) to begin incorporating wildlife-friendly underpasses into new transportation projects.
• Action 3f. Facilitate more frequent consideration of wildlife in land use planning
by partnering with city/county planners to use smart growth tools.
30

• Action 3g. Utilize priority conservation area plans of other government and non-
governmental agencies (e.g. The Nature Conservancy, Kentucky Division of Forestry, Kentucky State Nature Preserves Commission, Kentucky Natural Land Trust, etc.) to prioritize land acquisition efforts.
• Action 3h. Implement incentive programs for private landowners to encourage
conservation easements in key areas in Kentucky.
• Action 3i. Collaborate and coordinate with federal, state, and non-governmental organizations to identify and prioritize conservation corridors, and to design and implement regional conservation assessments and associated conservation plans (Game et al. 2010). Work with partners to facilitate regional and national corridor conservation efforts.
Goal 4: Monitor fish, wildlife, and ecosystem responses to climate change. To effectively conserve Kentucky’s fish and wildlife resources amidst changing environmental, climatic, and social conditions, we must monitor the success of our conservation actions and create future goals based on these results.
• Action 4a. Establish and maintain statewide monitoring protocols for all taxonomic groups listed in Kentucky’s Wildlife Action Plan.
• Action 4b. Establish and maintain statewide monitoring protocols for high-risk
habitats and ecosystems that may be adversely impacted by global climate change (e.g. high elevation forests).
• Action 4c. Design and implement specific projects to monitor fish and wildlife
responses to climate change indicators.
• Action 4e. Participate in regional and multi-state monitoring efforts to monitor fish, wildlife, and ecosystem responses to climate change.
Goal 5: Evaluate the effectiveness of actions implemented as a result of Kentucky’s Climate Change chapter, and adaptively manage populations and habitats based on monitoring results. Successful management of Kentucky’s fish, wildlife, and ecosystem resources relies on careful assessment of implementation activities and adaptive management of future practices based on critical evaluations of success/failure.
• Action 5a. Analyze and assess monitoring data every five years, at a minimum, for each taxonomic group and habitat type.
• Action 5b. Analyze results of projects monitoring fish, wildlife, and habitat
responses to climate change indicators. • Action 5c. Adaptively manage implementation efforts based on monitoring data.
31

Goal 6: Continue efforts to educate the public about wildlife conservation and continue efforts to stay optimally informed of current climate change predictions and observed climate change. Education is a key to long term conservation success. Informing and educating the public and private sectors is paramount to achieving conservation goals.
• Action 6a. Disseminate results of statewide monitoring efforts and research such that this information is available to private entities and the public sector.
• Action 6b. Design and implement educational programs facilitating Action items
listed in Kentucky’s Climate Change Chapter (e.g. educate the public regarding goals of the Kentucky Prescribed Fire Council, educate transportation planners regarding the importance of corridors for wildlife).
• Action 6c. Utilize Conservation Education Program Leaders (CEPL) to raise
awareness among students and inspire forward progress for action items listed in Kentucky’s Climate Change Chapter.
• Action 6d. Form partnerships and/or liaison positions to facilitate education of
other entities about KDFWR goals (e.g. with the Office of Surface Mining, Division of Forestry, Kentucky Transportation Cabinet, etc.).
• Action 6e. Within KDFWR, make efforts to obtain and disseminate up-to-date
information on current climate predictions and observed climate changes. Utilize partner resources (e.g. The Nature Conservancy, Association of Fish and Wildlife Agencies) and products to stay abreast of current climate change products (Groves et al. 2010).
Conclusion In addition to existing threats such as habitat loss and fragmentation, global climate
change has the potential to increase stressors to fish and wildlife populations and
ecosystems in Kentucky. One objective of the State Wildlife Grant program is to prevent
additional species from becoming federally listed under the Endangered Species Act. If
appropriately funded, Kentucky’s Action Plan to Respond to Climate Change in
Kentucky would increase the resilience of our resident fish and wildlife populations in
the face of climate change, and will increase the likelihood of survival and recruitment of
these populations. At current levels of funding (approximately 1 million dollars per year
32

in Kentucky), Kentucky will not be able to effectively implement this plan. The six goals
comprising this plan and the goals of the Wildlife Action Plan as a whole would require
far greater funding than the current level. Land managers and biologists across the nation
realize that long-term conservation of biodiversity requires corridors and intact habitat.
To effectively identify and conserve high-quality fish and wildlife corridors in Kentucky,
we are in desperate need of funding and spending authority for land acquisition,
conservation easements, and habitat restoration practices. In the absence of adequate
funding for Kentucky’s Wildlife Action Plan and Kentucky’s Action Plan to Respond to
Climate Change, Kentucky’s natural resources will continue to be degraded and
fragmented and fish and wildlife populations will continue to decline.
Literature Cited
Adam, J.C., and D.P. Lettenmaier. 2003. Adjustment of global gridded precipitation for systematic bias, Journal of Geophysical Research 108:1–14.
Battin, J., M.W. Wiley, M.H. Ruckelshaus, R.N. Palmer, R.N., Korb, E., Bartz, K.K., and Imaki, H. 2007. Projected impacts of climate change on salmon habitat restoration. Proceedings of the National Academy of Sciences U.S.A. 104:6720-6725.
Eaton, J.G., and R.M. Scheller, 1996. Effects of climate warming on fish thermal habitat in streams in the United States. Limnology and Oceanography 41:1109-1115.
Foster, S. 2009. The State of Kentucky’s Climate. Regional Climate Change Forum. Lexington, Kentucky, U.S.A.
Game, E.T., C. Groves, M. Anderson, M. Cross, C. Enquist, Z. Ferdana, E. Girvetz, A. Gondor, K. Hall, J. Higgins, R. Marshall, K. Popper, S. Schill, and S.L. Shafer. 2010. Incorporating climate change adaptation into regional conservation assessments. The Nature Conservancy. Arlington, Virginia.
33

Groisman, P.Y., T.R. Karl, D.R. Easterling, R.W. Knight, P.F. Jamason, K.J. Hennessy, R. Suppiah, C.M. Page, J. Wibig, K. Fortuniak, V.N. Razuvaev, A. Douglas, E. Forland, and P. Zhai. 1999. Changes in the probability of heavy precipitation: Important indicators of climatic change. Climaite Change 42:243-283.
Groves, C., M. Anderson, C. Enquist, E. Girvetz, T. Sandwith, L. Schwarz, and R. Shaw. 2010. Climate Change and Conservation: A primer for assessing impacts and advancing ecosystem-based adaptation in The Nature Conservancy. The Nature Conservancy. Arlington, Virginia. Notes: Available at: http://conserveonline.org/workspaces/climateadaptation/documents/a-primer-for-assessing-impacts.
Hastie, L.C., P.J. Cosgrove, N. Ellis, and M.J. Gaywood. 2003. The threat of climate change to freshwater pearl mussel populations. Royal Swedish Academy of Sciences 32:40-46.
Hitch, A.T., and P.L. Leberg. 2007. Breeding distributions of North American bird species moving north as a result of climate change. Conservation Biology 21: 534-539.
Horton, R. 2009. Climate change, impacts, and adaptation in Kentucky. Regional Climate Change Forum. Lexington, Kentucky, USA.
Humphrey, S. R. 1978. Status, winter habitat, and management of the endangered Indiana bat, Myotis sodalis. Fla. Sci., 41:65–76.
Intergovernmental Panel on Climate Change (IPCC), 2007: Summary for policymakers. In Climate Change 2007: Impacts, Adaptation and Vulnerability. Contribution of Working Group II to the Fourth Assessment Report of the Intergovernmental Panel on Climate Change. M.L. Parry, O.F. Canziani, J.P. Palutikof, P.J. van der Linden, and C.E. Hanson, Eds. Cambridge University Press, pp. 7-22.
Johnson, W.C., B.V. Millett, T. Gilmanov, R.A. Voldseth, G.R. Guntenspergen, and D.E.
Naugle. 2005. Vulnerability of Northern prairie wetlands to climate change. Bioscience 55:863-872.
Johnson, W.C., B. Werner, G.R. Guntenspergen, R.A. Voldseth, B. Millett, D.E. Naugle,
M. Tulbure, R.W. Carroll, J. Tracy, and C. Olawsky. 2010. Prairie wetland complexes as landscape functional units in a changing climate. Bioscience 60:128-140.
Karl, T.R., and R. W. Knight. 1998. Secular trends of precipitation amount, frequency, and intensity in the United States. Bulletin American Meteorological Society 79:1107-1119.
34

Karl T.R., and K.E. Trenberth. 2003. Modern global climate change. Science 302:1719-1723.
Le Houerou, H.N. 1996. Climate change, drought, and desertification. Journal of Arid Environments 34: 133-185.
Maurer, E.P., L. Brekke, T. Pruitt, and P.B. Duffy. 2007. Fine-resolution climate projections enhance regional climate change impact studies. Eos Transactions American Geophysical Union 88:504.
Maurer, E.P., J.C. Adam, and A.W. Wood. 2009. Climate Model based consensus on the hydrologic impacts of climate change to the Rio Lempa basin of Central America, Hydrology and Earth System Sciences 13:183-194.
Meehl, G. A., C. Covey, T. Delworth, M. Latif, B. McAvaney, J. F. B. Mitchell, R. J. Stouffer, and K. E. Taylor. 2007. The WCRP CMIP3 multi-model dataset: A new era in climate change research, Bulletin of the American Meteorological Society 88:1383-1394.
Millar, C. I., N. L. Stephenson, and S. L. Stephens. 2007. Climate change and forests of
the future: Managing in the face of uncertainty. Ecological Applications 17:2145-2151.
. Morgan, J., and B. Robinson. 2008. Road to Recovery. The Blueprint for Restoring the
Northern Bobwhite in Kentucky. Kentucky Department of Fish and Wildlife Resources. Frankfort, Kentucky, USA.
Price, J. 2002. Global warming and songbirds,Tennessee. American Bird Conservancy.
Notes: Avalable at: http://www.state.tn.us/twra/pdfs/tnclimatechange.pdf Rahel, F.J., and J.D. Olden. 2008. Assessing the effects of climate change on acquatic
invasive species. Conservation Biology 22:521-533. Root, T.L. 1988. Environmental factors associated with avian distributional boundaries.
Journal of Biogeography 15:489-505. Schneider, S.H., and T.L. Root. 1998. Climate change. Pages 89-116 in Mac, M.J.
Opler, P.A., Haecker, C.P., Doran, P.D., Eds. Status and Trends of the Nation’s Biological Resources, Volume I. Reston, Virginia: U.S. Department of the Interior, U.S. Geological Survey.
Schwartz, M.W., L.R. Iverson, A.M. Presad, S.N. Matthews, and R.J. O’Conner. 2006.
Predicting extinctions as a result of climate change. Ecology 84:1611-1615. Simberloff, D. 2000. Global climate change and introduced species in United States
rests. Science of the Total Environment 262:253-261.
35

Skerratt, L.F., L. Berger, R. Cashins, and K.R. McDonald. 2007. Spread of chytridiomycosis has caused the rapid global decline and extinction of frogs. Ecohealth 4: 125-134.
Smithson, P.A. 1990. Inter-relationships between cave and outside air temperatures. Theoretical Applications of Climatology 44:65-73.
Taylor, R.C. 1983. Droiught-induced changes in crayfish populations along a stream continuum. American Midland Naturalist 110:286-298.
Tennessee Wildlife Resources Agency. 2009. Tennessee’s Comprehensive Wildlife Conservation Strategy: Climate Change and Potential Impacts to Wildlife in Tennessee. Nashville, TN: Tennessee Wildlife Resources Agency.
The ClimateWizard, 2008. http://www.climatewizard.org/
Torti, V.M., and P.O. Dunn. 2005. Variable effects of climate change on six species of North American birds. Oecologica 145:486-495.
Tuttle, M.D. 1979. Status, causes of decline, and management of endangered gray bats. Journal of Wildlife Management 43:1–17.
United States Army Corps of Engineers. 2010. National Inventory of Dams. Available
online: http://geo.usace.army.mil/pgis/f?p=397:1:1879243994433896::NO. U.S. Census Bureau. 2000. People and Households: Projections. U.S. Department of
Commerce. Washington, D.C., USA. Available online: www.census.gov. U.S. Climate Change Science Program. 2008. Weather and Climate Extremes in a
Changing Climate. Regions of Focus: North America, Hawaii, Caribbean, and U.S. Pacific Islands. Synthesis and Assessment Product 3.3. Washington, D.C., USA.
U.S. Environmental Protection Agency (EPA), 2010. Climate Change Impacts in the Southeastern United States Draft Discussion Paper. Washington, D.C., U.S.A. Notes: Available at: http://www.tennessean.com/assets/pdf/DN161153721.PDF
U.S. Environmental Protection Agency (EPA), 2010a: Climate Change Indicators in the United States. Reference #: 430-R-10-007. Washington, D.C., U.S.A. Notes: Available at: http://www.epa.gov/climatechange/indicators.html.
36

37
U.S. Environmental Protection Agency (EPA), 2009: Climate Change Science: Sea Level Rise Projections to 2100. Notes: Available at: http://www.epa.gov/climatechange/science/futureslc_fig1.html.
Wood, A. W., Leung, L. 5 R., Sridhar, V., and D. P. Lettenmaier. 2004. Hydrologic implications of dynamical and statistical approaches to downscaling climate model outputs, Climatic Change 62:189–216.
Wilson, W.H. 2007. Spring arrival dates of migratory breeding birds in Maine: sensitivity to climate change. Wilson Journal of Ornithology 119:665-677.
Xenopoulos, M.A., Lodge, D.M., Alcamo, J., Marker, M., Schulze, K., and D.P. Vanvuuren. 2005. Scenarios of freshwater fish extinctions from climate change and water withdrawal. Global Change Biology 11:1557-1564.
Zourarakis, D.P. 2009. Land cover change entropy: the 2001-05 quadrennium in
Kentucky. Fifth International Workshop on the Analysis of Multi-temporal Remote Sensing Images, July 28-30, 2009, Groton, Connecticut, USA.