Embed Size (px)
Citation preview

Action Spectra and Chromatic Mechanisms of
Cells in the Median Ocelli of Dragonflies
R I C H A R D L. CHAPPELL and ROBERT D. DEVOE
From the Department of Biological Sciences, Hunter College of the City University of New York, New York 10021 and the Department of Physiology, Johns Hopkins Univerlity School of Medicine, Baltimore, Maryland 21205
ABSTRACT Spectral sensitivities were recorded intracellularly in median ocelli of Anax junius, Aeschna tuberculifera, and Libellulapulchella. All cells had peak sensitivi- ties at 360 and 500 nm while UV-blueWgreen cells found only in Anax had a third peak sensitivity at 440 nm. Ratios of UV-to-green sensitivities varied from cell to cell in each ocellus, but no UV-only or green-only cells were recorded. Half of the cells tested had a reverse Purkinje shift: They were more sensitive in the green at low illuminations but more sensitive in the UV at high illuminations; their intensity-response curves at 370 and 520 nm crossed but became parallel for large responses. Wave-lengths 420 nm and shorter elicited a family of low intensity-response curves with one slope; wavelengths 440 nm and longer elicited a family of curves with another slope. Orange-adapting lights selectively adapted sensitivity in the green, but UV-adapting lights had little selective effect. Amounts of log-selective adaptation were proportional to log orange-adapting intensity. It is concluded that two spectral mechanisms can be recorded from each cell, possibly by coupling of UV and green cells or possibly because each cell contains two visual pigments. Selective chromatic adaptations may provide the ocellus with a kind of "automatic color control," while the reverse Purkinje shift could extend the ocellus' sensitivity to prevailing skylight.
I N T R O D U C T I O N
M a n y roles are ascribed to insect dorsal ocelli (cf. Goodman , 1970), bu t color vision has yet to be proven to be one of them. Electrophysiological studies, using the e lec t rore t inogram (ERG) , have indicated potentialit ies for color vision: Goldsmi th and R u c k (1958) observed tha t dorsal oceUi of honeybees had peak sensitivities in both the U V and the blue-green. However, Gold- smith (1960) found tha t the bees' compound eyes alone media ted a phototac- tic preference for U V vs. green light. Cockroach dorsal ocelli appeared to possess sensitivity only in the blue-green (Goldsmith and Ruck, 1958). M o r e promising perhaps were recordings f rom the dorsal ocelli of the dragonf ly Libellula luctuosa, where Ruck (1965) observed sensitivities in the visible and (to
THE JOURNAL OF GENERAL PHYSIOLOGY • VOLUME 65, 1975 • p a g e s 3 9 9 - 4 1 9 3 9 9

400 T H E J O U R N A L O F G E N E R A L P H Y S I O L O G Y " V O L U M E 65 • i975
an u n d e t e r m i n e d extent) in the U V , as well as differences in waveforms of E R G ' s at wavelengths above and below 410 nm. F r o m these results he con- e luded tha t two (or more) cell types, sensitive to different parts of the spec t rum, existed in d ragonf ly ocelli and could provide a basis for color vision.
In the present paper , we reassess this conclusion using in t racel lu lar record- ings f rom single cells of the dragonf ly med ian ocellus (Chappel l and DoMing , 1972). O u r results indicate not tha t there are popula t ions of cells with sensitivi- ties in di f ferent par ts of the spect rum, bu t tha t all cells respond max ima l ly in bo th the U V and the visible. In addi t ion, f rom considerat ions of waveforms of responses, rat ios of U V to visible sensitivities, intensi ty-response funct ions as funct ions of wavelength , and selective ch romat i c adapta t ions , we conc lude tha t two (or three) ch roma t i c mechanisms con t r ibu te to the spectral responses re- co rded f rom wi th in single cells.
M A T E R I A L S A N D M E T H O D S
Preparation of the Animal
Dragonflies of the species Anax junius, Aeschna tuberculifera, and LibeUula pulchella were raised from nymphs in the laboratory (Chappell, 1970) and were used no sooner than 1 day after eelosion of the adults. Experiments on Anax and Aeschna were performed in early fall, while further experiments on Aeschna and one experiment on Libellula were made in late spring. An animal's head was cut off and a portion of the exoskeleton was removed from the front of the head, exposing the median ocellus. The head was then waxed to a cork such that the optical axis of the median oceUus was approximately horizontal. The whole head was next covered with a dragonfly Ringer's (Fielden and Hughes, 1962). Finally, a small portion of the pigmented capsule of the oeellus was torn away, using fine tweezers, and revealing the white, pigment-free interior. With this preparation, the microelectrode could approach the retinular ceils of the ocellus perpendicular to their long axes and without having to penetrate the tough, ocellar capsule. All experiments were done at 20-22 °C. Further details of the preparation are given in Chappell and Dowling, 1972.
Intracellular Recording
Successful micropipette electrodes were pulled from 1-mm OD Pyrex glass tubing con- taining soft glass fibers, were filled with 2 M KC1 by injection, and had tip resistances of 25-200 Mf~ in Ringer's. Cells were most easily penetrated by briefly applying ex- cess negative-capacity compensation to the recording amplifier and allowing it to oscillate. The indifferent electrode was placed in the Ringer's bath and resting poten- tials were measured with respect to it using a calibrated bucking potential. Further details of the recording apparatus are given by DeVoe, 1972.
Optical Stimulation
The details of the automated monochromator system have been given previously (DeVoe et al., 1969; DeVoe, 1972). In essence, the system consists of a monochroma- tor with a xenon arc light source and colored glass filters to reduce stray light; a mer-

CHAPPELL AND D~.VoE Action Spectra and Chromatic Mechanisms in Dragonflies 4ox
cury arc lamp with a UV filter to isolate the 365-nm spectral line for UV adaptations; and a quartz-halogen lamp with a long-pass, orange-appearing filter to provide adap- tation at visible wavelengths. All light sources were run from regulated power sup- plies. The UV and orange-adapting beams were combined by means of a dichroic beam splitter (Laser Energy Inc., Rochester, N.Y., type SWP-450). The adapting beams and the monochromator beam were combined with a quartz beam splitter of 45 % reflection, 45% transmission (Esco Products, Oak Ridge, N. J.). All com- bined beams were then focused by a quartz objective lens (Esco)upon a 0.5 mm, near-UV conducting, glass fiber-optic (type ULGM, American Optical Corp., South- bridge, Mass.). The other end of this fiber optic bundle lay in the Ringer's solution directly in front of the lens of the ocellus.
The automated monochromator system utilized paper tapes which were prepro- grammed to provide flashes eliciting approximately equal amplitudes of response during scans of 18-20 wavelengths from 350 to 650 nm and in the reverse direction. In addition, the tapes provided a range of stimulus intensities at least one wavelength in the UV (370 rim) or in the visible (520 nm). In this way, nearly equal-amplitude re- sponses could be obtained at all wavelengths, while the exact intensities that should have been used to elicit equal, criterion amplitudes of response (usually 4 mV) could be interpolated from the slopes of the intensity-response curves at 370 and/or 520 nm. When necessary, flash wavelengths and/or intensities could also be set by hand. Unless otherwise specified, flash durations were I00 ms, which were found to be long enough to elicit maximum amplitudes of response from most cells. However, for a few cells, which responded exceptionally slowly, flash durations had to be lengthened to 200 ms. With a timer, intervals between flashes were set in the range of 5-10 s, sufficiently long that we observed no progressive light adaptation.
Calibrations
The quantum fluxes, in quanta per second emerging from the end of the fiber optic bundle (in air), were measured using a P IN - IO U V photocliode (United Detector Technology Inc., Santa Monica, Calif.) calibrated by the factory and operated in the photovoltaic mode. These are the fluxes we cite as quanta per second upon the eye, as we do not know the illuminations of the receptor cells within the eye. Flux densities, as quanta per second per square centimeter at the end of the fiber optic bundle, would be about 500 times greater than the numbers we give. Between experiments, the cali- brated fiber optic bundle was stored in a tube to reduce breakage to its individual fibers. This necessitated refocusing of the light beams onto the fiber optic bundle at the beginning of each experiment. Initially, it was thought to be sufficient to align the fiber optic bundle each time so as to maximize output in the UV (at 370 nm), as had been done during the original calibrations. As it was more convenient, these subsequent realignments were made using a cadmium-sulphide photometer (Science and Me- chanics, New York, N.Y.), rather than the calibrated photodiode. However, it was found later that this realignment method did not inevitably result in the same fluxes at all wavelengths as in the original calibrations. Rather, near the point of optimum focus of UV wavelengths upon the fiber optic, output in the visible was very sensitive to small changes in focus, output in the UV, hardly at all. Presumably, this was be- cause we used a nonachromatic, quartz condensor. In any event, the effect was to in-

402 T H E J O U R N A L O F G E N E R A L P H Y S I O L O G Y • V O L U M E 65 • 1975
crease the quantum fluxes at visible wavelengths by up to 0.5 log units more than in the original calibrations. This may mean that the quantum fluxes at visible wavelengths given in some of the figures are too low, which is to say that sensitivities in the visible are too high, relative to the UV, by an unknown amount of up to 0.5 log units. In later experiments, the fiber optic bundle was realigned before each experiment using the calibrated photodiode, so that the UV intensity (at 370 nm) and the visible in- tensity (at 520 nm) were in the same ratio as during the calibrations. Intensities at other wavelengths were then found to be in the correct ratios also. As expected, aver- age relative green sensitivities were then somewhat lower in these later experiments, but otherwise we obtained the same results.
RESULTS
Properties of the Cells.
Some impaled cells survived long enough after pene t ra t ion for us to de t e rmine sensitivities a t 18-20 wavelengths, usually increasing f rom 350 to 650 nm, bu t sometimes decreasing f rom 650 to 350 n m as well. These we call fully ana lyzed cells. O t h e r cells survived im p a l em en t on ly long enough for us to measure the i r spectral sensitivities at two wavelengths, 370 and 520 (or 500) nm. These we call par t ia l ly ana lyzed cells. T a b l e I lists, for bo th kinds of cells, average minutes held, initial resting potentials recorded, and m e a n resting potentials averaged over the n u m b e r of minutes held. Cells f rom Libellula had signifi-
T A B L E I
S U M M A R Y OF DATA ON RESTING POTENTIALS AND SURVIVAL TIMES OF ALL IMPALED CELLS IN DRAGONFLY OCELLI
Mean resting No. of Average initial potentials averaged cells Average rain held ra t ing potentials over rain held
Anax and Fully analyzed 32 25 --604-15 --554-16 Aeschna cells (range 3-106) (range 41-97) (range 31-95)
Part ial ly analyzed 38 4 --584-17 --574-17 cells (range 1-12) (range 33-102)
Libellula Part ial ly analyzed 8 22 --41-4-10 --43/:17 cells (range 1 68) (range 20-52) (range 26-73)
For technical reasons, no full analyses were made of cells from Libellula. Resting potent ials were measured relat ive to the Ringer ' s solution ba th ing the preparat ion, using a cal ibrated bucking potential . For Anax and Aeschna, these rest ing potent ials are somewhat higher than previously measured (Chappell and Dowling, 1972), when a ca l ibra ted bucking potent ia l was not avai lable and resting potent ials were measured as differences of potent ia l between the tissue outside a cell and the potent ia l in the cell jus t after penetra t ion. Rest ing potent ials of cells from Libellula were significantly lower (P < 0.01) than those from Anax and Aeschna, al though survival times after impalement were equally good. There were no significant differences between initial and mean resting potentials. Values are given as means 4- SD.
CHAPPF, LL AND DF.Vo~ Action Spectra and Chromatic Mechanisms in Dragonflies 403
cantly lower resting potentials than did cells from Anax and Aeschna (P < 0.01); they also had significantly different spectral properties (see Table II, and below).
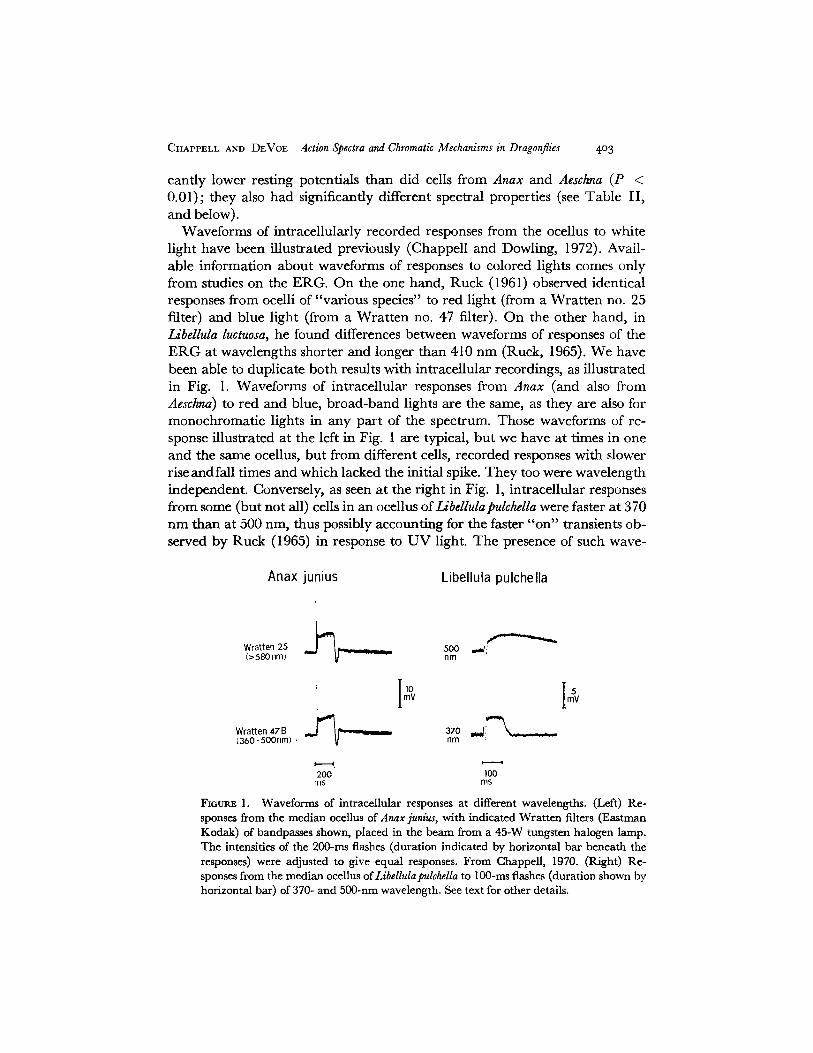
Waveforms of intracellularly recorded responses from the ocellus to white light have been illustrated previously (Chappell and Dowling, 1972). Avail- able information about waveforms of responses to colored lights comes only from studies on the ERG. On the one hand, Ruck (1961) observed identical responses from ocelli of "various species" to red light (from a Wrat ten no. 25 filter) and blue light (from a Wrat ten no. 47 filter). On the other hand, in Libellula luctuosa, he found differences between waveforms of responses of the E R G at wavelengths shorter and longer than 410 nm (Ruek, 1965). We have been able to duplicate both results with intracellular recordings, as illustrated in Fig. 1. Waveforms of intraeellular responses from Anax (and also from Aeschna) to red and blue, broad-band lights are the same, as they are also for monochromatic lights in any part of the spectrum. Those waveforms of re- sponse illustrated at the left in Fig. 1 are typical, but we have at times in one and the same ocellus, but from different cells, recorded responses with slower rise and fall times and which lacked the initial spike. They too were wavelength independent. Conversely, as seen at the right in Fig. 1, intracellular responses from some (but not all) cells in an ocellus of Libellula pulchella were faster at 370 n m than at 500 nm, thus possibly accounting for the faster "on" transients ob- served by Ruck (1965) in response to U V light. The presence of such wave-
Anax junius Libellula pulchella
Wratten 25 (>580nml
, =~ 500 ~ ! n m
Wratten 47 B (360- 5oonm).
- 370 , a " k . . . . .
n m : . . . . .
1 - - - - - 4 . ;
200 100 ms ms
FmURE l. Waveforms of intracellular responses at different wavelengths. (Left) Re- sponses from the median ocellus of Anax junius, with indicated Wratten filters (Eastman Kodak) of bandpasses shown, placed in the beam from a 45-W tungsten halogen lamp. The intensities of the 200-ms flashes (duration indicated by horizontal bar beneath the responses) were adjusted to give equal responses. From Chappell, 1970. (Right) Re- sponses from the median oeellus of Libellulapulchella to lO0-ms flashes (duration shown by horizontal bar) of 370- and 500-nm wavelength. See text for other details.

404 THE JOURNAL OF GENERAL PHYSIOLOGY • VOLUME 6 5 • 1975
l e n g t h - d e p e n d e n t d i f fe rences in wavefo r rns o f i n t r ace l l u l a r responses does speak
aga i n s t R u c k ' s conc lu s ion t h a t such d i f fe rences in the E R G , b y themselves ,
i n d i c a t e the exis tence o f two, spec t r a l ly d i f f e ren t types o f cells in t he ocellus.
Spectral Sensitivities
O u r r e c o r d i n g s (of spec t ra l sensitivities) f r o m wi th in single cells d i s t i ngu i shed
two b r o a d b u t o v e r l a p p i n g classes o f cells: U V - g r e e n a n d U V - b l u e + g r e e n .
W i t h i n e a c h class, t he re was l a rge va r i ab i l i t y in re la t ive s h o r t - t o - l o n g w a v e -
l e n g t h sensitivities. S o m e typ ica l e x a m p l e s o f re la t ive spec t ra l sensitivities o f
ful ly a n a l y z e d , U V - g r e e n cells f r o m Anax a n d Aeschna are s h o w n in Fig. 2.
.-8- ~o.~.
cr
k
y ,og ~ T
1 l i i L I i
550 4 5 0 550 650
wavelength,nrn
FIOURE 2. Relative spectral sensitivities of dark-adapted, UV-green cells of Anax ]unius (top curve) and Aeschna tuberculifera (bottom two curves). (Ordinate) Log units of relative spectral sensitivity for 4-mV criterion responses; curves have been displaced vertically an arbitrary amount for clarity. (Abscissa) Wavelengths of 100-ms test flashes, in nan- ometers. From top to bottom: dashed lines fitted to points in the visible represent nomo- gram curves (Dartnall, 1953) at 513, 504, and 502 nm, respectively. The full extents of the nomogram curves are not drawn, since their flanks were generally broader at long wavelengths than the data. Solid lines through the remaining points were drawn by eye. In the top two curves, data points came from duplicate spectral scans on the two cells, first from 350 to 640 rim, and then from 640 to 350 nm; they show the reproducibility of the data. The points on the bottom curve came from one spectral scan, 350--640 nm. The log ratios of UV sensitivity to green sensitivity in the three curves are shown; a negative ratio indicates that the cell was more sensitive in the green. The log quantum fluxes on the eye for a 4-mV response at 520 nm were 7.41, 11.6, and 10.04 for the upper, middle, and lower curves, respectively.

CHAPPELT. AND DEVoE Action Spectra and Chromatic Mechanisms in Dragonflies 405
One example from a fully analyzed, UV-blue+green cell, (found only in Anax) is shown in Fig. 3. Dashed lines representing nomogram curves (Dart- nail, 1953) have been drawn in the visible part of the spectrum in both figures where they fit most closely. At long wavelengths where the nomogram curves are a bit too broad, solid lines through the data points have been drawn in- stead for clarity. All points were considered, however, in making the best fit by shifting the Dartnall nomogram to obtain the location of the peak. Locating the blue peak in this manner was clearly an approximation but gave more re-
I0 :° u~
E !0
[0 ~
E
g
°,\ ........ 437- n m nomogram ~
curve \ t
. . . . 500-nm nomogrom curve
I l V l I | 350 450 550
wavelength~ nm
141
12
-~10 o
8
~ 6
4
i
-0.5
f u l l y a n a l y z e d c e i l s
~ U V - g reen n : 2 2
J U V - b l u e + g reen n = l O
partial ly analyzed cells
~ ~ 1 HEll ~ , I , 0.0 0.5 LO 1.5 2.0 25
UV sensit iv i ty log
8R sensi t iv i ty
FIOUR.E 3 FmURE 4
FIGURE 3. Spectral sensitivity of a dark-adapted UV-blue +green cell from Anax junius, with an intermediate blue shoulder. (Ordinate) Quantum flux upon the eye, in quanta per second, from 100-ms test flashes needed to elicit 4-mV criterion responses at each wavelength, given in nanometers on the abscissa. Dashed line is a nomogram curve at 500-nm; dotted line is a nomogram curveat 437 nm. Of 17 fullyanalyzed cells from Anax, 10 had similar shoulders in the blue at an average peak wavelength of 442 nm (see Table II). FIOURE 4. Histogram of log UV-to-visible peak (green) sensitivity ratios for dark- adapted cells from Anax and Aeschna. The ordinate gives the observed frequencies of oc- currence of cells with the different log ratios of UV-to-green sensitivities shown on the abscissa. Ratios are rounded to the nearest 0.1 log unit. UV-green cells whose complete spectral sensitivities were determined across the spectrum (fully analyzed ceils) are de- picted by the shaded areas. Fully analyzed UV-blue +green cells are depicted in black for the ratios of UV and green sensitivities only. Cells whose sensitivities in the UV and in the visible were determined only at 370 and 520 (or 500) nm (partially analyzed cells) are depicted by open areas. All ceils that were subsequently fully analyzed were first par- tially analyzed immediately after impalement, and comparisons of log UV-to-green sensitivity ratios determined on the same cells both from the partial and from the full analyses showed these ratios to be the same (P > 0.7). Hence we feel justified in com- bining the results from fully and partiaUy analyzed cells in the same histogram. Data from cells in Libellula are not included because their log ratios were significantly higher than the other cells (P < 0.01).

406 THE JOURNAL OF GENERAL PHYSIOLOGY - VOLUME 65 • I975
producible results than trying to choose the peak by eye. Table II shows wave- lengths of peak sensitivities, determined in the visible by means of the nomo- gram curves and in the U V by inspection. It can be seen that all cells have the same wavelengths of peak sensitivity in the U V and in the green, while the UV-blue +green cells have a third, consistent peak of sensitivity at about 440 r im .
Where cells do differ from one another is in the ratios of UV-to-green (or blue) sensitivities. The variability of the log ratios of UV-to-green sensitivity is illustrated in Fig. 4 for all cells from Anax and Aeschna. Numerical values are given in Table II. What is important here is that these log ratios do not ap- pear to subdivide into three main groups, as might have occurred had each of the three cells usually making up a retinula (Chappell and Dowling, 1972) had its own characteristic spectral sensitivity. In addition, no cell had such a low relative U V sensitivity or low relative green sensitivity that it could be con- sidered to be essentially a green cell or a U V cell, respectively. Uncertainties in light calibrations (see Methods) may have affected the absolute values of
T A B L E I I
SUMMARY OF DATA ON RELATIVE SENSITIVITIES AND WAVELENGTHS OF PEAK SENSITIVITIES
Wavelengths of peak setmitivities Log s e n s i t i v i t y . . . . . . . . . . . . . . . . . . . . . .
ratios UV Blue Green
UV-visible cells, Anax and Aeschna
Fully analyzed UV/green 0. 364-0.33
Partially analyzed UV/green 0.444-0.41
UV-b lue+green cells, Anax
Fully analyzed UV/green 0. 98-4-0 . 50 UV/blue 0.57:k:0.46 blue/green 0. 364-0.33
Libellula cells Partially analyzed
UV/green 1.494-0.88
Dark-adapted 360+7 501 4-5 UV-adapted 361 4-6 4984-2 Orange-adapted 358-t-6 4994-4
Dark-adapted 3544-6 4424-12 503±5
Wave lengths of peak UV sensitivity read by eye to nearest 5 or 10 rim; wavelengths of peak blue and green sensitivities read from nomogram curves fitted to the data. All values are given as means 4- SD. Log UV/green sensitivity ratios of UV-b lue+green cells and Libellula ceils are both signifi- candy different from those of UV-visible cells (P < 0.05 and P < 0.01, respectively). Log U V / green sensitivity ratios of fully and partially analyzed UV-green cells are not significantly differ- ent from each other (P > 0.4). UV-green cells and UV-b lue+green cells do not have significantly different wavelengths of peak sensitivity in the UV and green (P > 0.3).

CHAPPELL AND D ~ V o E Action Spectra and Chromatic Mechanisms in Dragonflies 4o7
some of the ratios in Fig. 4, but as variabilities of ratios were found within each experiment, this rules out calibration errors being the cause of such varia- bilities. Thus, the appearance of dual spectral sensitivities recorded from within single cells suggests that variable sums of two spectral mechanisms, each with a constant wavelength of max imum sensitivity are involved, and that in the green, at least, most likely being due to the absorption properties of a single visual photopigment (as determined by the fit of the nomogram curves). The possibility of a third spectral mechanism in the blue is indicated and requires further study.
Intensity-Response Curves
In most studies of spectral properties of single a r thropod visual cells (cf. Wasserman, 1973), the finding has been that intensity-response curves re- corded from within single cells have had shapes independent of wavelength, that is, they have been parallel to one another. For this reason, it is generally necessary to record an intensity-response curve at only one wavelength in order to convert amplitudes of responses at other wavelengths into equivalent sensi- tivities (see Methods). We initially assumed this would be true for cells of dragonfly ocelli as well and so accompanied each of our spectral scans of these cells with measurements of one intensity-response curve, either at 370 or 520 nm. However, in our early experiments, we did hold 12 of the 30, fully analyzed cells long enough to measure intensity-response curves in both the U V and the green. For 6 of these 12 cells, the two intensity-response curves were not parallel: The curve measured at 370 n m was steeper and crossed the curve measured at 520 rim. The insert in Fig. 5 illustrates a case where the curves so crossed. The cell f rom which these data came was more sensitive to U V light at higher intensities but was more sensitive to green light at lower intensities. Clearly, the shape of the spectral sensitivity curve of this cell is dependent on the criterion amplitude of response chosen, and so too is the ratio of its UV-to- green sensitivity. Possibly this might have been true for half of all our cells, so that the histogram in Fig. 4 might have been dependent on criterion ampli- tudes of response used for measuring spectral sensitivities.
From two cells, we were able to obtain intensity-response curves for intensi- ties up to saturation. Fig. 5 (main part) shows the results from the one of these two cells whose curves would have crossed at low intensities. However, above 8 m V of response, the curves measured at wavelengths of 370 and 520 n m be- came parallel to each other. This is shown by the same solid line drawn through both sets of da ta? The other cell, stimulated over an equally large range of re-
x D u r i n g review it was poin ted out to us tha t these da t a can be fitted by power functions, the lower pa r t of the da ta a t 500 n m hav ing an exponen t ha l f t ha t of the uppe r par t a n d of the da ta at 370 nm. This re la t ionship mi gh t be helpful in deve lop ing a model of the sys tem a l though its m e a n i n g is unc lear a t present.

4o8 T H E J O U R N A L O F G E N E R A L P H Y S I O L O G Y • V O L U M E 65 . i 9 7 5
55
• 5 7 0 n m •
6
30 1 45
25
~ 2 0 I ° ~ ko,O :o" 2~ quan tum f l ux on eye
~ 15 o .>
E I0
• .570 nm
o o 520 nm 5 o O O
0 I I I I I
IO 7 108 109 I0 Io IO n I0 Iz i0 t3 quantum f lux on eye
FIGURE 5. U V and green intensity-response curves over large ranges of intensities. At responses 8 mV and over, the intensity-response curve at 370 nm (filled circles) and at 520 nm (open circles) were parallel up to and including saturation at 33-mV response. The ordinate gives the millivolts of peak response to 100-ms flashes whose intensifies are given on the abscissa in quanta per second upon the eye. The solid lines represent the same curve, which was fitted by eye to both sets of data where they were parallel and to the data at 370 nm alone where the responses were less than 7 inV. Below 7 mV, the inten- sity-response curves converge; however, we did not measure responses at amplitudes less than the crossing amplitude, estimated to be 2.6 mV for this U V - b l u e + g r e e n cell from Anax. (Inset) Crossing of U V and green intensity-response curves. In 6 of 12 cells for which intensity-response curves were measured in the U V (at 370 nm) and in the visible (at 520 nm), the curves crossed at an average amplitude of 3.3 mV (range: 1.8-4.4 mV). The solid and filled circles here represent one such cell's amplitudes of response (ordinate) at 370 and 520 nm, respectively, to 100-ms flashes whose intensities in quanta per second are given on the abscissa. The solid curves were drawn by eye. UV-green cell from Aeschna.
sponses, had curves parallel to each other at both low and high intensities. From the results on these two cells, it appears that spectral sensitivities would have been criterion independent had we chosen criterion amplitudes of re- sponse of 8 mV or greater. In our experiments, we generally used 4-mV cri-

CHAPPELL AND DEVoE Action Spectra and Chromatic Mechanisms in Dragonflies 409
terion responses, both to avoid progressive light adaptations that brighter flashes might have caused and because during chromatic adaptations dis- cussed below, 4 mV was often the maximum response we could elicit at all. This 4 m V criterion response is near the average of 3.3 mV of response at which in- tensity-response curves crossed, when they did. Thus the effect of our choice of criterion response was to minimize the ratios of UV-to-green sensitivities, compared with having used a much larger or much smaller criterion ampli- tude of response.
Subsequent to the above experiments, we measured the intensity-response curves in one cell at various wavelengths randomly presented, in order to see how many families of such curves there might be. There were systematic de- viations from originally fitted, parallel, common curves, such that the data could be fitted better by two families of curves. This can be seen in Fig. 6. The change between the two families of curves occurs between 420 and 440 nm, which is to say at approximately the wavelengths of minimum sensitivity in UV-green cells (cf. Fig. 2). The solid lines in Fig. 6 have been fitted by eye and seem to have different shapes than in the less extensive results in the inset in Fig. 5, although we do not know what this means. As it happened, the
I2 I- . 12~- I1~- wavelengths ~ " II tO~-'h 3 5 0 - 420 nm ~>='= IO CO el)
i:i 7 g9
o / o 360 nm ~ 5 o 370 nm --
380 nm >o 4 S IE/~ : 390 nm
• 400 nm "~ e 410 nm 2
+ 420 nm 1
OI j ~ I = =
log relative quantum flux
wave leng ths ' / 4 4 0 - 6 2 0 nm ~
~ x 440 nm '~="= o 480 nm
/ c 500 nm • 520 nrn 0* • 540 nm
,=..~.. .~.~; = 560 nm • 580 nm
x ÷ 6OOnm • 620 nm
i i i i i
log relative quantum flux
FIGURE 6. Comparisons of intensity-response curves measured across the spectrum Data were taken from the most stable of cells in Aeschna (impalement time: I06 min; rest- ing potential: 95-97 mY). The relative log quan tum flux of 100-ms flashes is given on the abscissa vs. peak amplitudes of response, in miIlivolts, on the ordinate. Data points for the wavelength ranges 350-420 n m and 440-620 n m were arbitrarily slld along the log intensity axis for best fit by eye; solid lines were drawn by eye. Wavelengths were pre- sented in random order, while several control curves were measured at 520 nm, inter- spersed among the other measurements as a check on the reproducibility of the prepara- tion. The spectral sensitivity of this cell, measured at a 4-mY criterion amplitude of re- sponse, had the same shape as the bottom curve in Fig. 2 (log UV-to-green sensitivity ratio of 0.8). For the data of this and Fig. 5, care was taken to avoid spuriously large readings of amplitudes caused by abortive initial spikes.

4IO T H E J O U R N A L O F G E N E R A L P H Y S I O L O G Y - V O L U M E 6 5 - ~975
curves at 370 and 500-520 nm did not cross for this cell, the cell being so much less sensitive (by five times) in the green at all intensities.
In summary, then, we find that intensity-response curves at low amplitudes of response of half the cells tested are parallel to each other only within given regions of the spectrum and that these regions correspond to those spectral mechanisms with constant wavelengths of peak sensitivity found during de- terminations of spectral sensitivity. At large amplitudes of response, however, intensity-response curves became parallel to each other and independent of wavelength; or, if they were parallel at low amplitudes of response, remained parallel at high amplitudes as well.
In our early determinations of spectral sensitivities, we did not have available the results shown in Fig. 6, although in effect we anticipated them : For most of those cells whose intensity-response curves at 370 and 520 nm did cross, we used the curve at 370 nm for converting amplitudes of responses at 350-420 nm into sensitivities, and the curve at 520 nm for converting amplitudes of responses at 440-650 nm. At most, there would have been errors of up to 0.2 log units in relative UV-to-visible sensitivities had we not done this.
Selective Chromatic Light Adaptations
Finally, we tested to see if we could selectively reduce the sensitivities recorded in single cells to one or the other end of the spectrum by light adapting the ocelli with constant background illuminations of U V or long wavelengths. For six cells with log UV-to-green sensitivity ratios of from 0.0 to 0.8, we measured complete spectral sensitivities when adapted to the dark and to backgrounds of 365 nm or to backgrounds with wavelengths 550 nm and longer (orange adaptions) (Fig. 7 illustrates results obtained when adapting lights were ad- justed in intensity to reduce the sensitivities equally in the U V (left) or in the green (right). We have also used the maximum available intensities of both adapting lights, with equivalent results (not shown). The points in Fig. 7 are given in terms of absolute sensitivities, as measured, and the distances be- tween curves give the amounts of log adaptation. Nomogram curves (dashed lines) have been drawn through the points in the visible, where they fit.
The results of these and similar experiments are clear-cut: Spectral sensitivi- ties do not remain the same for both U V and orange adaptations. In general, U V adaptations reduced sensitivities equally across the spectrum, so that the top curves in Fig. 7, representing spectral sensitivities in the dark, were simply shifted downwards along the ordinate (sensitivity on a log scale). In only one cell did U V adaptat ion cause a small decrease in relative U V sensitivity. With orange adaptations, it was otherwise: Strong orange-adapting lights reduced sensitivity more in the visible than in the UV. This is especially clear at the left in Fig. 7, where the adapting lights used adapted the cell equally in the U V but unequally in the visible. It is also true, but not as obvious, at the right

CI-IA]PPI~LL AND DEVOE Action Spectra and Chromatic Mechanisms in Dragonflies 4 z z
i0 '0
= ~ I0" o
>
i O i Z
-- I013
E = i014
g
io Is
• dark-adapted ---502-nrn nomogram loll
c u r v e = .Y ",,
~ i p t e d ="
I013
g IO,S o
. _ .
curves ,~a I I i i i i f
350 450 550 650 wavelength, nm
¢¢- B "S..g
• dark-adapted ~ . A UV- a d o p t e d o o r a n g e - a d o p t e d
---50"~nrn (upper) or 505-rim ( l o w e r ) nomogram curves
I l i i I I
550 450 550 wavelength, nm
lolwz is =7
650
FIGURE 7. Chromatic adaptations of two single cells from Aeschna. Ordinates show abso- lute intensities, in quanta per second upon the eye, of 100-ms test flashes of the wave- lengths indicated on the abscissa, needed to elicit 4-mV incremental responses at each of the stated conditions of adaptation. Experimental points have been drawn as measured and have not been shifted on the vertical axis. For both cells, the experimental sequence was: dark adapted, U V adapted, and orange adapted. With other cells, the order of chromatic adaptations was reversed with the same quali tat ive results as here. At the left, the intensities of U V - and orange-adapting lights were adjusted so that the sensitivities at 370 nm were the same in both conditions of chromatic adaptation. At the right, the adapting intensities were adjusted so that the sensitivities at 520 nm were the same in both conditions of chromatic adaptation. Dashed lines through the data in the visible region of the spectrum are nomogram curves (Dartnall, 1953) with the peak wavelengths indicated in the figure. Solid lines were fit by eye to the remaining points. The pre- dominant wavelength of the UV-adapt ing fight was at 365 nm from a mercury arc lamp. The orange-adapting fight was derived from a tungsten-halogen lamp by a sharp-cut, glass filter passing all wavelengths over 550 nm.
in Fig. 7; when an orange-adapting light was as effective as a UV-adapting light in reducing sensitivity in the visible, it was less effective in reducing sensi- tivity in the UV. However, despite these asymmetries in adaptation, there were no significant shifts in wavelengths of peak sensitivity in the U V or in the visible, as can be seen in Table II. These results come only from UV-green cells; we have not tried chromatic adaptations of UV-b lue+green cells of Anax.
Selective Adaptation as a Function of Adapting Intensities
One cell, light adapted by 1 log unit with U V and orange backgrounds, seemed to show none of the above, selective adaptation. All other cells were adapted by 1.5 log units or more and showed selective adaptation. Possibly, therefore,

412 T H E J O U R N A L O F G E N E R A L P H Y S I O L O G Y • V O L U M E 6 5 • 1975
there was a threshold amount of light adaptation needed for the selective effects illustrated in Fig. 7. To test for this, we measured sensitivity decreases of cells relative to sensitivity in the dark, as functions of intensities of adapting backgrounds. To minimize the dangers of losing a cell before a series of adapta- tions was complete, we saved time by measuring only the incremental sensi- tivities at 370 and 500 nm, wavelengths near the peaks of sensitivity in the U V and visible, respectively. The experiment was performed on five cells; typical results, from one cell, are shown in Fig. 8. There, it can be seen that sensitivities
UV-adopling l ight orange-adapting l ight
4 • 570 nm ~ 4 • 570 nm
~ ° ~ ~ o
: ~ 2 "~
~o ~' i r t i ~ l I I i t
I08 I09 I0 m I0 u lO ~2 lO ~s IO s lO ~° I 0 ~t i0 ~ i0 t3
quantum f lux at 365 nm equiva lent f lux at 5 0 0 nm in UV-adap t ing beam in orange-adapt ing beam
FIoum~ 8. Log incremental sensitivity changes in the UV- and green- vs. chromatic- adapting intensities on a log scale. For determinations of sensitivity decreases as functions of increasing adapting intensities, sensitivities for 4-mV criterion responses were deter- mined first in the dark and then for each amount of adaptation, first for orange back- grounds and then for UV backgrounds. Additionally, the dark-adapted cell's responses to flashes from the adapting beams were used to calibrate these beams by comparisons with responses to known fluxes from the monochromator; the UV-adapting beam was also calibrated radiometrically with equivalent results. Intensities of the orange-adapting beam (wavelengths 550 nm and longer from a tungsten halogen lamp) are given as fluxes of equally bright 500-nm flashes. Slope of change of log sensitivity (the Weber fraction) at 370 nm as a function of log intensity of the orange background is 0.55, or about half the slope of 0.95 for the other three curves, through each of which a line having this slope has been drawn by eye. Similar results were found in two other cells from Aeschna and from two cells from Libellula, although the absolute values of the slopes varied from cell to cell and were usually less than those shown here. Data from same cell as in Fig. 6.
at 370 and 500 nm fall in parallel with increasing amounts of UV-adaptating intensities, but that sensitivity falls more rapidly at 500 nm than at 370 nm with increasing intensities of the orange-adapting light. Straight lines have been drawn by eye through the data in Fig. 8; the slopes of these lines (log AI vs. log I) give the Weber fraction. For the cell in Fig. 8, the Weber fraction was nearly 1 (0.95) for both 370- and 500-nm test flashes against the U V background and for the 500-nm test flashes against the orange background. The Weber fraction was only about half of this, or 0.55, for 370-nm flashes against the orange background. In the four other cells tested, the Weber frac- tions were smaller although in roughly the same proportions as in Fig. 8. For

CHAPPELL AND DEVoE Action Spectra and Chromatic Mechanisms in Dragonflies 4 t 3
all cells, however, there had to be about 0.5-1 log unit of total adaptation be- fore adaptation became selective, although it appears in Fig. 8 that there is no abrupt threshold for selective adaptation.
Finally, for the experiment illustrated in Fig. 8, we calibrated the back- ground intensities using the cell itself to compare flashes of orange background lights with calibrated 500-nm flashes from the monochromator and flashes of U V background lights with 365-nm light from the monochromator. We also calibrated the U V background intensity radiometrically, with equivalent results. Then, both curves at 500 nm being parallel in Fig. 8, it can be de- termined at a UV-adapting background need be only about ~ 0 (1.1 log units) as bright as an orange-adapting background to provide the same amount of adaptation at 500 nm. As the cell in question was about 10 times (0.8 log units) more sensitive in the UV, it appears that adapting efficiencies at 500 n m of the two background lights were approximately proportional to relative spectral sensitivities recorded in the cell. Since there was no selective adapta- tion for small amounts of light adaptation, the same proportionality would ap- ply for adapting efficiencies at 370 n m at these small amounts of adaptation, but not at larger amounts.
All told then, it appears that the selective adaptation we have measured is a phenomenon graded with the intensity of the adapting light, that it works only upon that mechanism in the visible which has a peak sensitivity at 500 nm, that it is found only with orange-adapting lights that would be absorbed preferentially or exclusively by the mechanism in the visible, but that efficiency of adaptation in the visible by UV and orange-adapting lights is roughly pro- portional to the sensitivities recorded in the cell in the UV and visible, re- spectively.
D I S C U S S I O N
The results of the present experiments demonstrate that two (and possibly three) spectral mechanisms contribute to the electrical responses recorded from within single cells in the median ocelli of dragonflies. The spectral sensi- tivities of all cells exhibited maxima in the U V and green regions of the spec- t rum (Figs. 2, 3, and 7), whereas 50% of those in Anax had, in addition, a dis- cernable peak at about 440 n m (Fig. 3).
Cells in ocelli of dragonflies differ in their spectral properties in four ways from most other arthropod visual cells with peak sensitivities in two regions of the spectrum. First, there are large cell-to-cell variabilities in any one ocellus in the relative UV-to-green sensitivities (and in UV-to-blue-to-green sensi- tivities in some ceils in Anax). This was illustrated in Figs. 2 and 4. In cells from most other arthropods, there are neither large differences between rela- tive UV and visible sensitivities nor large variabilities from cell to cell (Wasser- man, 1973). Possible exceptions are the UV-green cells in anterior median

414 THE JOURNAL OF GENERAL PHYSIOLOGY • VOLUME 65 • ~975
eyes of wolf spiders, which have even larger variabilities and differences (DeVoe, 1972), and the rare U V - V I S cells in median ocelli of Limulus, where there are 2-3 log units of difference between U V and visible sensitivities (Nolte and Brown, 1969, 1972 a).
Second, in some (but not all) ocellar cells of l_a'bellula, we found wavelength- dependen t waveforms of responses (Fig. 1), the responses at 370 n m being faster than those at 500 nm. We did not use intermediate wavelengths, so we do not know at which wavelength(s) the transition occurs. Wavelength- dependen t responses have been detected in only a few other ar thropod cells. Nolte et al. (1968) originally reported finding biphasic, wavelength-dependent responses in the U V and the VIS cells of the Limulus ocellus but have since concluded that the initial hyperpolarizations were due to pickup of extra- cellular currents (Nolte and Brown, 1972 a). Long-lasting "tails," dependent on wavelengths of st imulation with extremely bright flashes, have been found in ocellar cells of both Limulus (Nolte and Brown, 1969, 1972 b) and the barnacle (Hochstein, Minke and Hillman, 1973). However, we did not find biphasic responses nor did we need bright lights to elicit wavelength-de- pendent waveforms of responses from cells of Libdlula. Most similar are the UV-green cells in anterior median eyes of j ump ing spiders, where purely depolarizing responses to weak U V lights are slower than purely depolarizing responses to weak visible lights (DeVoe). ~
Third, in about half the cells tested in Anax and Aeschna, the intensity- response curves were steeper at 370 n m than 520 n m and crossed each other. This occurred both in UV-blueq-green cells of Anax and in UV-green cells (large plot and inset, respectively, of Fig. 5). At low intensities, these cells were more sensitive to visible wavelengths, at high intensities, to U V wave- lengths. In essence, these cells underwent a reverse Purkinje shift. The in- tensity-response curves of most ar thropod visual cells have slopes independent of wavelength, the known exception being in the lateral eye of Limulus. There, Adolph (1968) found the frequency of q u a n t u m bumps to increase more slowly as a function of intensity at 397 n m than at wavelengths of 460 n m and longer. However, judging from the responses of one dragonfly ocellar cell ( that in Fig. 5), we found that intensity-response curves f rom cells of dragonfly ocelli became parallel at high intensities; that is, their slopes too became inde- pendent of wavelength. The shift at low intensities from one wavelength- dependen t slope of an intensity-response curve to the other slope seemed to occur (Fig. 6) between 420 and 440 nm, namely, in the region of the spectral sensitivity curves (Fig. 2) where there was a m i n i m u m of sensitivity between the U V and the visible peaks. Finally, slopes of intensity-response curves seemed to be independent of adapta t ion (not illustrated); they simply shifted
DeVoe, R. D. Ultraviolet and green receptors in principal eyes of j umping spiders. 1V[anuseript submitted for publication.

CHAPPELL AND DEVoE Action Spectra and Chromatic Mechanisms in Dragonflies 415
for the most part along the log intensity axes (the abscissae in Figs. 5 and 6). For fear that we would lose a cell before completing all adaptations upon it, we never attempted to record complete intensity-response curves (in addition to the portion around 4 mV of response) at both UV and visible wavelengths during chromatic adaptations. Thus, we cannot say with certainty that in- tensity-response curves at 370 and 520 nm which were not parallel for the dark-adapted cell were also not parallel for the chromatically adapted cell.
Fourth, we have been able to change the relative spectral sensitivities of cells in dragonfly ocelli by chromatic adaptations with visible, but not UV, wavelengths. Such selective adaptations of single cells have previously suc- ceeded only in UV-VIS cells of l.dmulus ocelli (Nolte and Brown, 1969) and UV-green cells in anterior median eyes of wolf spiders, Lycosa (DeVoe, 1972). Hence all ceils which have been successfully selectively adapted have had great variabilities in ratios of UV to visible sensitivities and/or large differ- ences in UV to visible sensitivities. Cells which consistently have almost equal UV and visible sensitivities have not been selectively adapted with chromatic lights (cf. Wasserman, 1973). Other features which selectively adaptable cells have had in common are, first, that wavelengths of peak sensitivity do not change during selective adaptations, and second, in none of the cells have adaptations been completely selective. That is, all adapting backgrounds have reduced sensitivities all across the spectrum; selectivity results because sensitivities are reduced more in one region of the spectrum than another. However, only in dragonfly ocellar cells have UV backgrounds usually failed to adapt more in the UV than in the visible, as they do in ocelli of Limulus and Lycosa (Nolte and Brown, 1969; DeVoe, 1972). Likewise, onlyfor dragon- fly ocellar cells have the adapting lights themselves been calibrated, with the resultant finding that efficiencies of adaptation by UV and orange background lights, tested with 500 nm incremental flashes, are roughly proportional to the spectral sensitivity of the dark-adapted cell.
Our demonstration of two discriminable spectral mechanisms in recordings from single cells in the median ocelli of dragonflies raises the question of whether the observations are accounted for by coupling between cells or by the presence of two photopigments in each cell. Couplings between cells could be electrical, as proposed in models for the Limulus lateral eye (Smith and Baumann, 1969) or ocellus (Nolte and Brown, 1972 a), and for the compound eye of the honeybee (Shaw, 1969; Snyder et al., 1973; Menzel and Snyder, 1974). Alternatively, coupling in the dragonfly ocellus might occur via the receptor-receptor synapses found in the plexus (Dowling and Chappell, 1972), although to our knowledge no such couplings between visual cells of unlike spectral sensitivities have been suggested. The other basic explanation, two photopigments in a single receptor cell, has been proposed to account for

416 T H E J O U R N A L O F G E N E R A L P H Y S I O L O G Y • V O L U M E 6 5 - 1975
spectral sensitivities in the compound eye of the locust (Bennett et al., 1967) and in the anterior median ocelli of the wolf spider (DeVoe, 1972).
We have found no simple way to fit our findings into either of these ex- planations. We have considered a coupling model based on that of Shaw (1969) to see if dragonfly ocellar UV-green cells might be couplings of hypo- thetical UV and green cells, much as the UV-VIS cells of Limulus ocelli are the result of couplings between known UV and VIS ceils (Nolte and Brown, 1972 a). It appears to us that we would need many ad hoc assumptions to fit a coupling hypothesis to our data. Some of these assumptions cannot be justified by, and may even be in contradiction to, data from other visual systems, and for these reasons a discussion of them best awaits further experimentation. Similarly, there are neither kinetic models nor experimental data for inter- actions of two photopigments in a single cell against which we could test our results, and we have no basis for constructing such a model. The most reason- able course at this time is to decide which hypothesis should be pursued further by testing (a) if there is any coupling at all between cells and (b) the the possibility that there are two photopigments in a single cell. Intercellular diffusion of Procion Dyes (Kaneko, 1971) and dual electrode studies (Shaw, 1969) can be used to test for electrical coupling between receptor cells. In the dual electrode studies, intracellular injections of different Procion Dyes into the two cells will show how close together they are (Kaneko, 1971 ; Mote and Goldsmith, 1971). Coupling via receptor-receptor synapses in the plexus can be tested pharmacologically (Klingman and Chappell, 1974). The other hypothesis, the presence of two photopigments in each cell, can be tested by finding the spectral sensitivity of the early receptor potential, as has been done for single photpigments and their photoproducts in other arthropod visual cells (Smith and Brown, 1966; Brown et al., 1967; Minke et al., 1973; Pak and Lidington, 1974).
Color Vision in the Ocellus
In this study of color sensitivities of cells in dragonfly ocelli, we have found both UV-green cells, with peak sensitivities at 360 and 500 nm, and (in Anax) UV-blue +green cells with peak sensitivities at 355, 440, and 500 nm (round- ing off the wavelengths of peak sensitivities in Table II to the nearest 5 nm). The roles, if any, of such cells in color vision by the ocellus would thus appear to be based on broad-band cells as opposed to receptors turned to a selective wavelength region of the spectrum (see Wasserman, 1973). Cells individually sensitive to one or another of each of these wavelengths have been found in compound eyes of the same genera (Autrum and Kolb, 1968; Horridge, 1969; Eguchi, 197 I). Ocellar cells thus provide no information about regions of the spectrum not already available, in a way more useful for color vision, in the compound eye, Moreover, poor imaging by the ocellar lens and high con-

CHAPPELL AND DEVoE Action Spectra and Chromatic Mechanisms in Dragonflies 4t 7
vergence of receptors onto second-order fibers might be thought to obviate contributions of individual receptors to color vision. However, the observation that movement information is conveyed from the median ocellus of dragon- flies to the cervical nerve chain (Zenkin and Pigarev, 1971) indicates that sensory information from individual receptors or from small groups of re- ceptors may become available to the animal. Assuming this to be so, then neural differencing or comparing of cells (in groups or alone) with both high and low relative visible sensitivities could provide information about relative UV-to-visible intensities. This might be particularly usetul for analyzing the skylight towards which the median ocellus looks and might be important to the animal if the ocellus played a role in diurnal rhythms, that is, to estimate the time of day (cf. Goodman, 1970).
The selective chromatic adaptations we observed could be interpreted as a kind of "automatic color control," possibly useful in spectral analysis of sky- light: During the day, the median ocellus would be strongly light adapted by the predominantly UV light scattered from the sky. Such UV adaptation keeps the relative UV-to-visible sensitivities of ocellar cells constant. At twi- light, when the proportions of short-to-long wavelength light in the sky are lower, UV sensitivities of ocellar cells would be less strongly adapted, thus compensating for decreased amounts of UV light. However, selective adapta- tion would disappear at light levels lower still, and the reverse Purkinje shift would occur in some, perhaps half, of the cells: Due to crossing of intensity- response curves, these cells would change from more-sensitive-to-UV light to more-sensitive-to-visible light, of which the intensities are higher at first or last light and at night (Menzel and Knaut, 1973). Since the spectral mecha- nisms that we found in ocellar cells have not been found in cells of the com- pound eyes, this could mean that the ocellus might furnish to the animal color information unavailable from the compound eyes.
We thank Maureen E. Bell for technical assistance,. This research was supported in part by N.I.H. Research Grants EY00777 (to Dr. Chappell) and EY00008 (to Dr. DeVoe).
Received for publication 15 February 1974,
REFERENCES
ADOLeH, A. K. 1968. Thermal and spectral sensitivities of discrete slow potential in Lfm~ eye. J. Gen. Physiol. 52:584.
A~rRLr~, H., and G. KOLB. 1968. Spektrale Empfmdlichkelt einzelner Sel~ellen der Aeschni- den. Z. Vgl. Pl~siol. 60:450.
BENNETT, R. R., J. TUNSTALL, and G. A. HORRIVO~.. 1967. Spectral sensitivity of single retinula cells of the locust. Z. Vgl. Physiol, 55:195.
BROWN, J. E., J. R. MURRAY, and T. G. SMITH. 1967. Photoelectric potential from photore- ceptor cells in ventral eyes of Limulus. Science (Wash. O. C.). 158:665.
CHAPPELL, R. L. 1970. Intracellular responses in the Anisopteran ocellus. Ph.D. Thesis. Johns Hopkins University, Baltimore, Md.

418 T H E J O U R N A L OF G E N E R A L P H Y S I O L O G Y • V O L U M E 65 - I 9 7 5
CHAPPELL, R. L., and J. E. DOWLING. 1972. Neural organization of the median ocellus of the dragonfly. I. Intracellular electrical activity. J. Gen. Physiol. 60:121.
DARTNALL, H. J. A. 1953. The interpretation of spectral sensitivity curves. Br. Med. Bull. 9: 24.
DEVOE, R. D. 1972. Dual sensitivities of ceils in wolf spider eyes at ultraviolet and visible wave- lengths of light. J. Gen. Physiol. 59:247.
DEVOE, R. D., R. J. W. SMALL, and J. E. ZVARGULIS. 1969. Spectral sensitivities of wolf spider eyes. J. Gen. Physiol. 54:1.
DowLmo, J. E., and R. L. C~IAPPELL. 1972. Neural organization of the median ocellus of the dragonfly. II. Synaptic structure J. Gen. Physiol. 60:148.
EGUCHI, E. 1971. Fine structure and spectral sensitivities of retinular ceils in the dorsal sector of compound eyes in the dragonfly Aeschna. Z. Vgt. Physiol. 71:201.
FmLDEN, A., and G. M. HUGHES. 1962. Unit activity in the abdominal nerve cord of a dragon- fly nymph. J. Exp. Biol. 39:3t.
GOLDSMITH, T. H. 1960. The nature of the retinal action potential and the spectral sensitivities of ultraviolet and green receptor systems of the compound eye of the worker honeybee. J. Gen. Physiol. 43:775.
GOLDSMITH, T. H., and P. R. RUCK. 1958. The spectral sensitivities of the dorsal ocelli of cock- roaches and honeybees. An electrophysiological study. J. Gen. Physiol. 41:1171.
GOODMAN, L. J. 1970. The structure and function of the insect dorsal ocellus. Adv. Insect Physiol. 7:97.
HOCHSTEIN, S., B. MXNKE, and P. HmLUAN. 1973. Antagonistic complements of the late receptor potential in the barnacle photoreceptor arising from different stages of the pigment process. J. Gen. Physiol. 621105.
HORmDOE, G. A. 1969. Unit studies on the retina of dragonflies. Z. Vgl. Physiol. 62:1. KANEKO, A. 1971. Electrical connexions between horizontal cells in the dogfish retina. J.
Physiol. (Lord.). 213:95. KLmOMAN, A., and R. L. CHAPPELL. 1974. Synaptic pharmacology in a simple retina. Assoda-
tion for Research in Vision and Ophthalmology, Abstracts. Spring Meaing:4 7. MENZEL, R., and R. KNAUT. 1973. Pigment movement during light and chromatic adaptation
in the retinula ceils of Formiea polyaena. (Hymenoptera, Formiddae). J. Comp. Physiol. 86:125. M~.NZEL, R., and A. W. SNYDER. 1974. Polarized light detection in the bee, Apis mellifera. J.
Comp. PhysioL 88:247. MINKE, B., S. HOCHSa'EXN, and P. HILLMAN. 1973. Early receptor potential evidence for the
existence of two thermally stable states in the barnacle visual pigment. J. Gen. Physiol. 62:87. Moax, M. I., and T. H. GOLDSmTH. 1971. Compound eyes: localization of two color receptors
in the same ommatidium. Science (Wash. D. C.). 171:1254. NoLam, J., and J. E. BROWN. 1969. The spectral sensitivities of single cells in the median ocellus
of Limulus. J. Gen. Physiol. 54:636. NOLa'E, J., and J. E. BRowN. 1972 a. Eleetrophysiological properties of cells in the median
oceUus of Limulus. J. Gen. Physiol. 59:167. NoLax, J., and J. E. BRowN. 1972 b. Ultraviolet-induced sensitivity to visible light in ultra-
violet receptors of Limulas. J . Gen. Physiol. 59:186. NOLTE, J., J. E. BROWN, and T. G. SMrm, JR. 1968. A hyperpolarizing component of the re-
ceptor potential in the median ocellus ofLimulus. Sdeme (Wash. D. C.). 162:677. PA~¢, W. L., and K. J. LIDXNOTO~. 1974. Fast electrical potential from a long-lived, long-wave-
length photoproduet of fly visual pigment. J. Gen. Physiol. 63:740. Ruox, P. 196I. Electrophysiology of the insect dorsal ocellus. I. Origin of the components of the
electroretinogram. ,7. Gen. Physiol. 44:605. RUCK, P. 1965. The components of the visual systems of a dragonfly. J. Gen. Physiol. 49:289. SHAW, S. R. 1969. Interreceptor coupling in ommatidia of drone honeybee and locust com-
pound eyes. Vision Res. 9:999. SMITH, T. G., and F. BAtr~ANN. 1969. The functional organization within the ommatidium of
the lateral eye of Limulus. Prog. Brain Res. 31:313.

CHAPPELL AND DEVo~ Action Spectra and Chromatic Mechanisms in Dragonflies 419
SMITH, T. G., and J. E. BROWN. 1966. A photoelectric potential in invertebrate cells. Nature (Lond.). 212:1217.
SNYD~n, A. W., R. MENZEL, and S. B. LAUGHLIN. 1973. Structure and function of the fused rhabdom. J. Comp. Physiol. 87:99.
WASS~aMAN, G. S. 1973. Invertebrate color vision and the tuned receptor paradigm. Science (Wash. D, C.). 180:268.
ZENKIN, G. M., and I. N. PIGAREV. 1971. Visually conditioned activity in dragonfly neck-chain. Biofizika 16:299.