Embed Size (px)
Citation preview
Actionable Data for Antibiotic Stewardship: Case ExamplesMay 8, 2018
Melinda Neuhauser, PharmD, MPH, Centers for Disease Control and PreventionErik Stensgard, PharmD, BCPS, Minneapolis Veterans Affairs Health Care System
Clark Force, RPh, BCPS, Tucson Medical CenterCatherine Lexau, PhD, MPH, RN, Minnesota Department of Health

Housekeeping
• Participant phone/microphone lines are muted.
• Questions/comments? Type your questions in the chat box.
• Slides will be provided after the call.
2
Agenda
3
1. View on Antibiotic Use Reporting from the CDC
Melinda Neuhauser, PharmD, MPH, Centers for Disease Control and Prevention
2. Introduction to the Antimicrobial Use and Resistance Module for Antimicrobial Use Reporting
Catherine Lexau, PhD, MPH, RN, Minnesota Department of Health
3. Antibiotic Use Visualization and Assessment at the Unit Level Using an Excel-based tool
Erik Stensgard, PharmD, BCPS, Minneapolis Veterans Affairs Health Care System
4. Practical Application of NHSN Antimicrobial Use Data
Clark Force, RPh, BCPS, Tucson Medical Center
5. Wrap-Up and Questions

View on Antibiotic Use Reporting from the CDC
Melinda Neuhauser, PharmD, MPH, Centers for Disease Control and Prevention
4
National Center for Emerging and Zoonotic Infectious Diseases
CDC Updates: NHSN AU Option
Melinda Neuhauser, PharmD, MPHPharmacist and Acute Care LeadOffice of Antibiotic StewardshipDivision Quality Healthcare Promotion
May 8, 2018
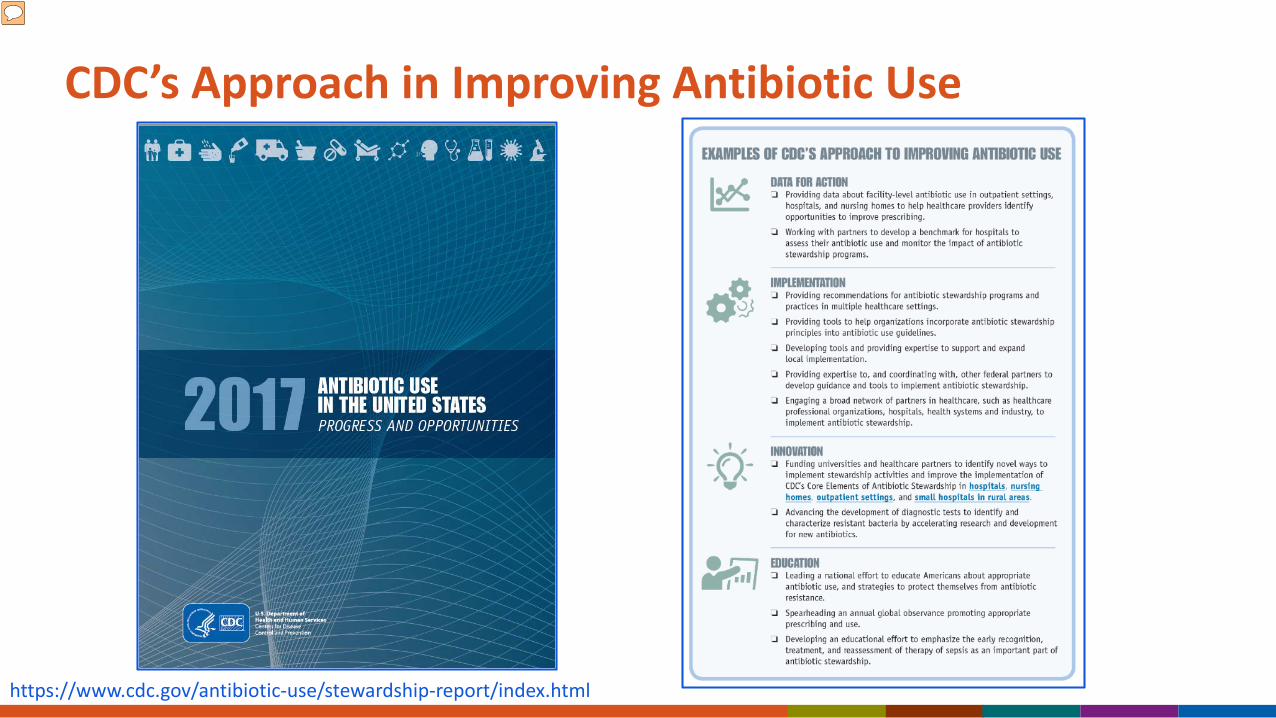
CDC’s Approach in Improving Antibiotic Use
https://www.cdc.gov/antibiotic-use/stewardship-report/index.html
*As of April 1, 2018
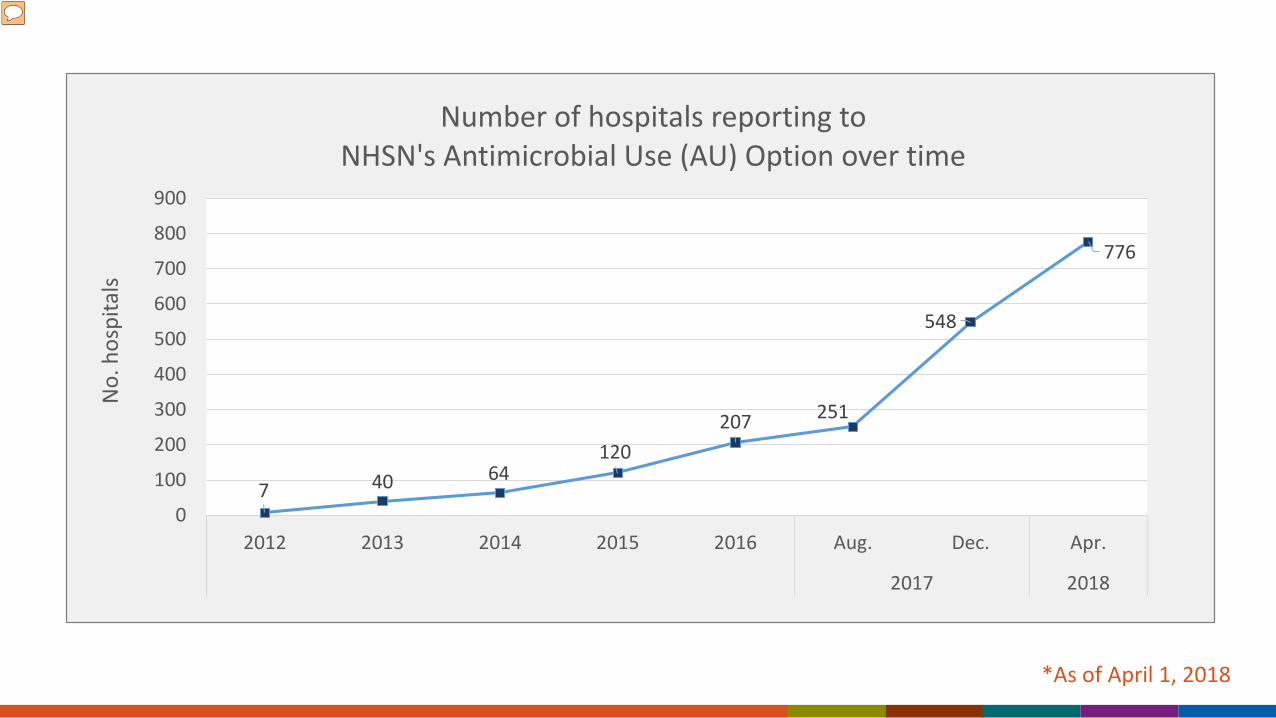
7 40 64120
207 251
548
776
0
100
200
300
400
500
600
700
800
900
2012 2013 2014 2015 2016 Aug. Dec. Apr.
2017 2018
No.
hos
pita
lsNumber of hospitals reporting to
NHSN's Antimicrobial Use (AU) Option over time
*As of April 1, 2018
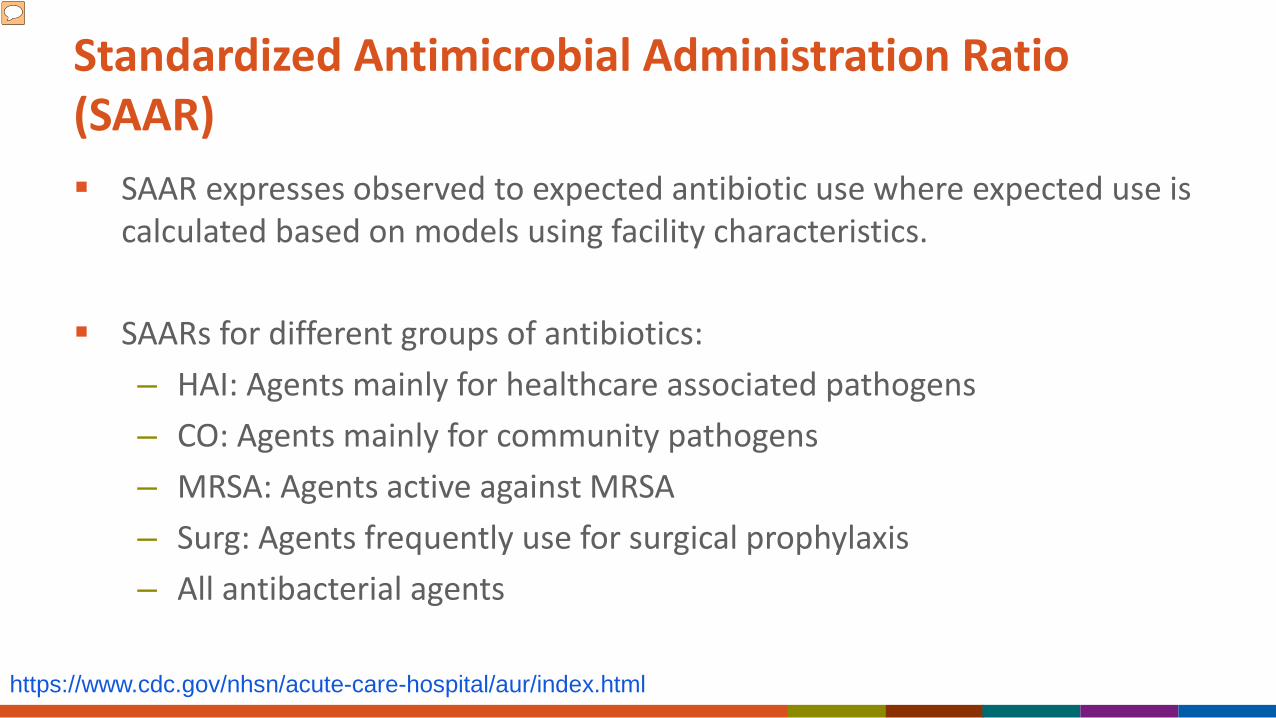
Standardized Antimicrobial Administration Ratio (SAAR) SAAR expresses observed to expected antibiotic use where expected use is
calculated based on models using facility characteristics.
SAARs for different groups of antibiotics:– HAI: Agents mainly for healthcare associated pathogens – CO: Agents mainly for community pathogens– MRSA: Agents active against MRSA– Surg: Agents frequently use for surgical prophylaxis– All antibacterial agents
https://www.cdc.gov/nhsn/acute-care-hospital/aur/index.html
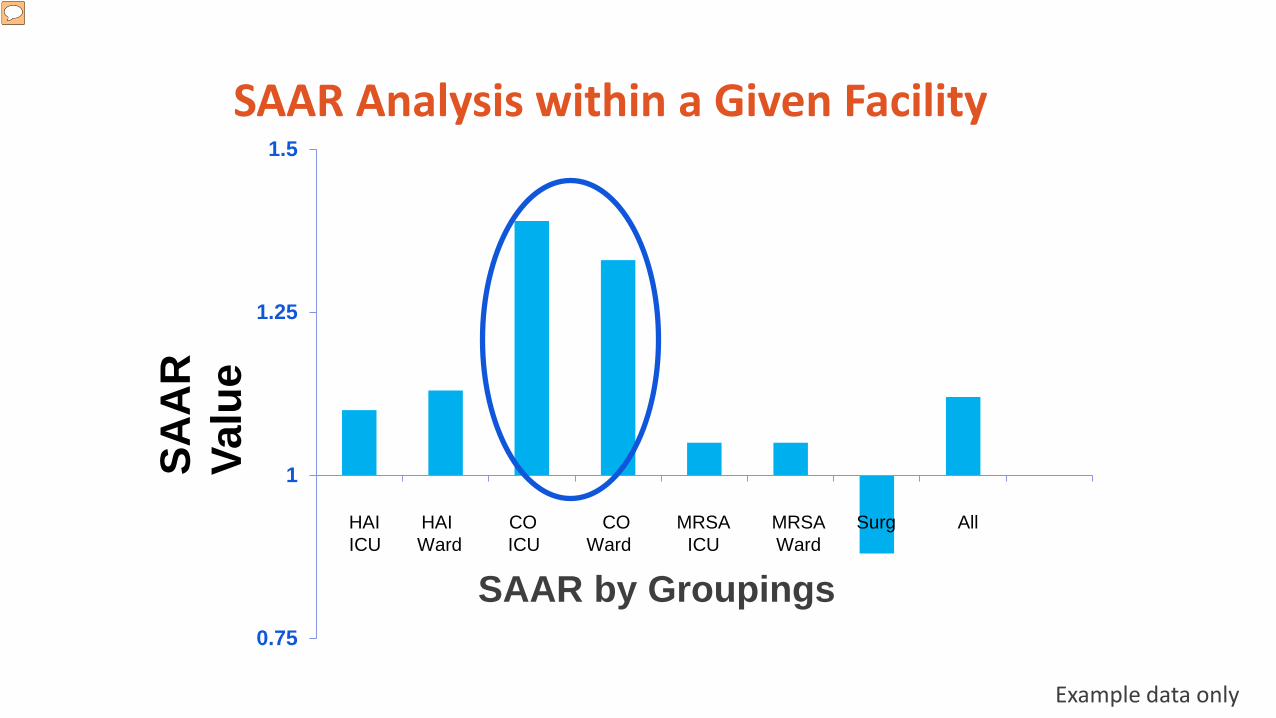
SAAR Analysis within a Given Facility
0.75
1
1.25
1.5
SAAR by Groupings
HAI HAI CO CO MRSA MRSA Surg All ICU Ward ICU Ward ICU Ward
Example data only
SAA
R
Valu
e
SAAR Updates Adult and Pediatric SAARs being updated with 2017 AU data
– Seeking input from adult and pediatric experts to optimize SAAR categories
– Anticipated launch ~January 2019
NICU SAARs being developed – Seeking input from Vermont Oxford Network– Anticipated launch ~ January 2020
Advancing the SAAR Measure
The Duke Antimicrobial Stewardship Outreach Network (DASON) was awarded funding to enroll a group of hospitals in NHSN AU option and then implement and/or expand stewardship efforts.– Does the SAAR help find improvement opportunities?– Does the SAAR change in response to stewardship?
Duke University was awarded funding to identify patient- and facility-level factors predictive of antimicrobial use that can be used in risk adjustment strategies for benchmarking antimicrobial use.
For more information, contact CDC1-800-CDC-INFO (232-4636)TTY: 1-888-232-6348 www.cdc.gov
The findings and conclusions in this report are those of the authors and do not necessarily represent the official position of the Centers for Disease Control and Prevention.

Introduction to the Antimicrobial Use and Resistance Module for Antimicrobial Use Reporting
Catherine Lexau, PhD, MPH, RN, Minnesota Department of Health
14
What is the National Healthcare Safety Network?
The National Healthcare Safety Network (NHSN) is the CDC system for tracking and reporting health care-associated infections (HAIs)
NHSN establishes standard definitions and detailed protocols for each metric
After submission, CDC securely stores data on its servers and facilities maintain access to their own data.
15
What is the National Healthcare Safety Network?
Neither NHSN nor CDC “requires” any data submission, but the Centers for Medicare and Medicaid Services (CMS) requires submission of some data to NHSN as a condition for participation in programs like Value Based Purchasing.
NHSN Antimicrobial Use data discussed today are not publically reported nor is reporting mandated by CMS.
16
NHSN Antimicrobial Use and Resistance (AUR) Module
Purpose:
Track hospital antimicrobial use (AU) and antimicrobial resistance (AR)
Highlight patient care areas for possible intervention
Facilitate benchmarking with other hospitals
Key Features:
Data useable by multiple entities, including submitting hospitals, CDC and state public health agencies
Single set of technical specifications and standard definitions
17
AUR Module: Antimicrobial Use Option
Data sources: Electronic
Medication administration data
Admission and transfer data
Data submission to NHSN
Unlike HAI/other NHSN data, electronic file submission only
No personal identifiers
18
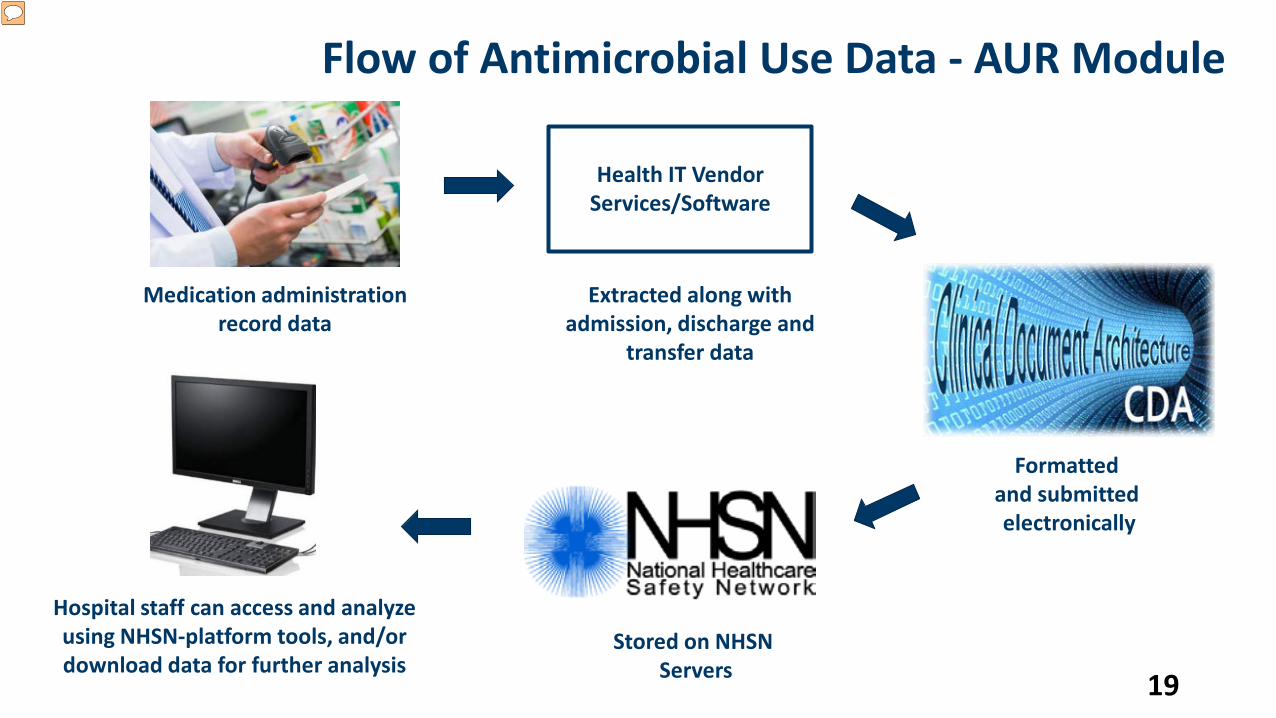
Hospital staff can access and analyze using NHSN-platform tools, and/or download data for further analysis
19
Flow of Antimicrobial Use Data - AUR Module
Health IT Vendor Services/Software
Medication administration record data
Extracted along with admission, discharge and
transfer data
Formatted and submitted electronically
Stored on NHSN Servers
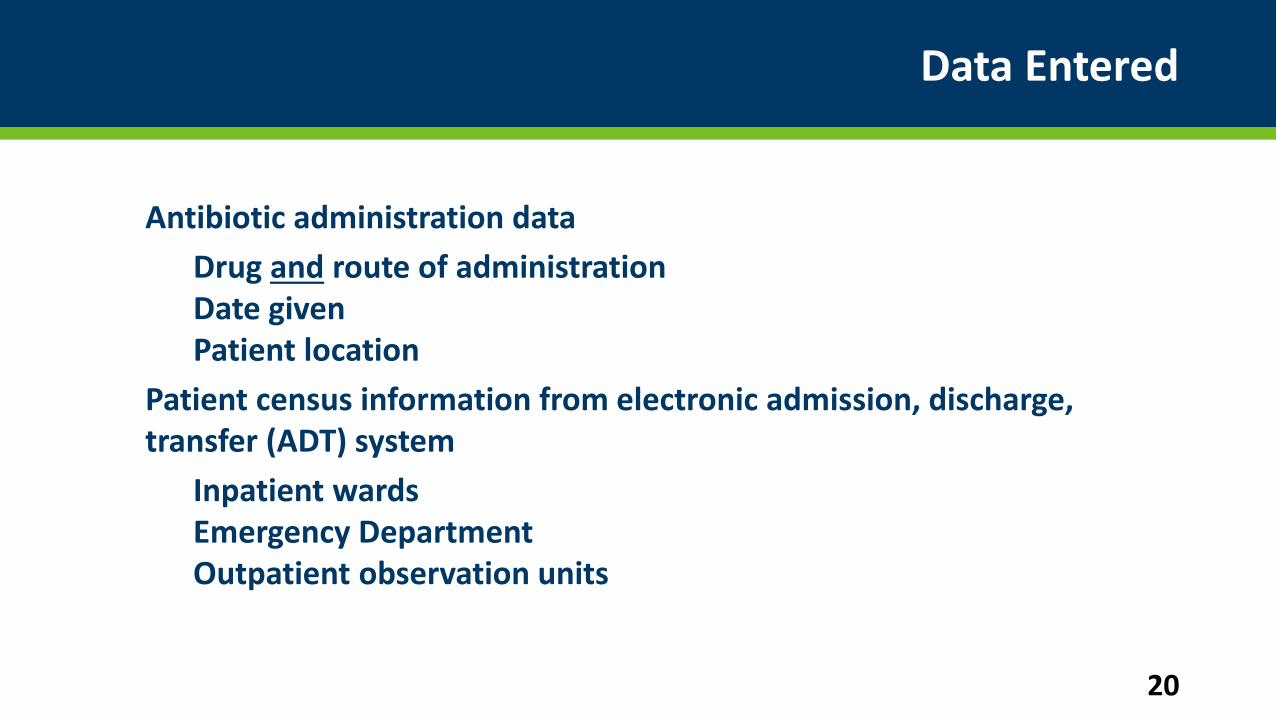
Data Entered
Antibiotic administration dataDrug and route of administrationDate given Patient location
Patient census information from electronic admission, discharge, transfer (ADT) system
Inpatient wardsEmergency DepartmentOutpatient observation units
20
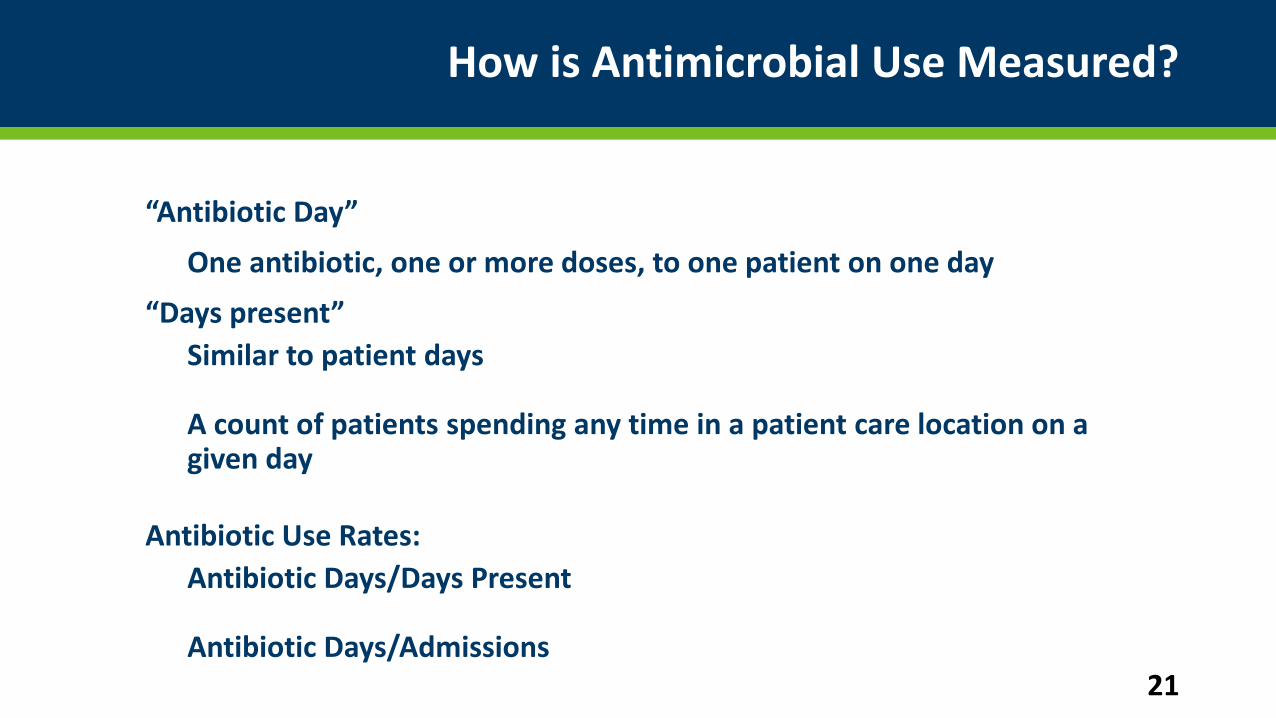
How is Antimicrobial Use Measured?
“Antibiotic Day”
One antibiotic, one or more doses, to one patient on one day
“Days present”Similar to patient days
A count of patients spending any time in a patient care location on a given day
Antibiotic Use Rates:Antibiotic Days/Days Present
Antibiotic Days/Admissions21
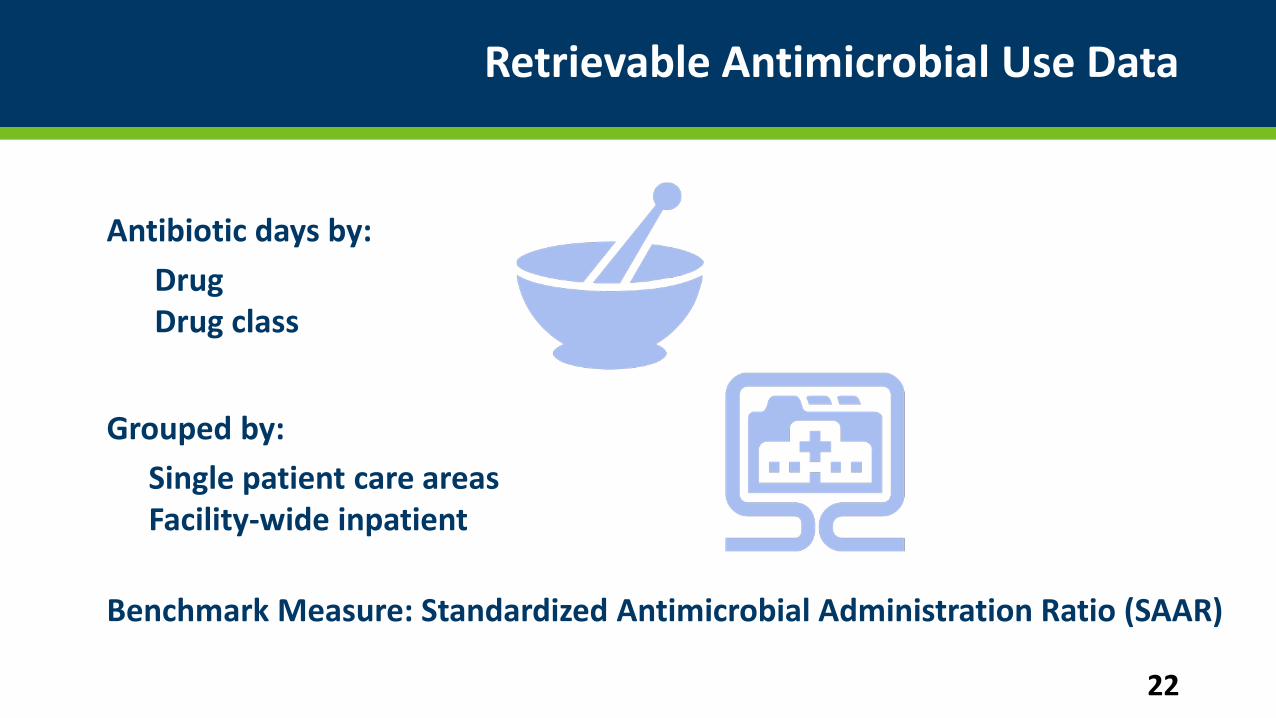
Retrievable Antimicrobial Use Data
Antibiotic days by:DrugDrug class
Grouped by:Single patient care areasFacility-wide inpatient
Benchmark Measure: Standardized Antimicrobial Administration Ratio (SAAR)
22
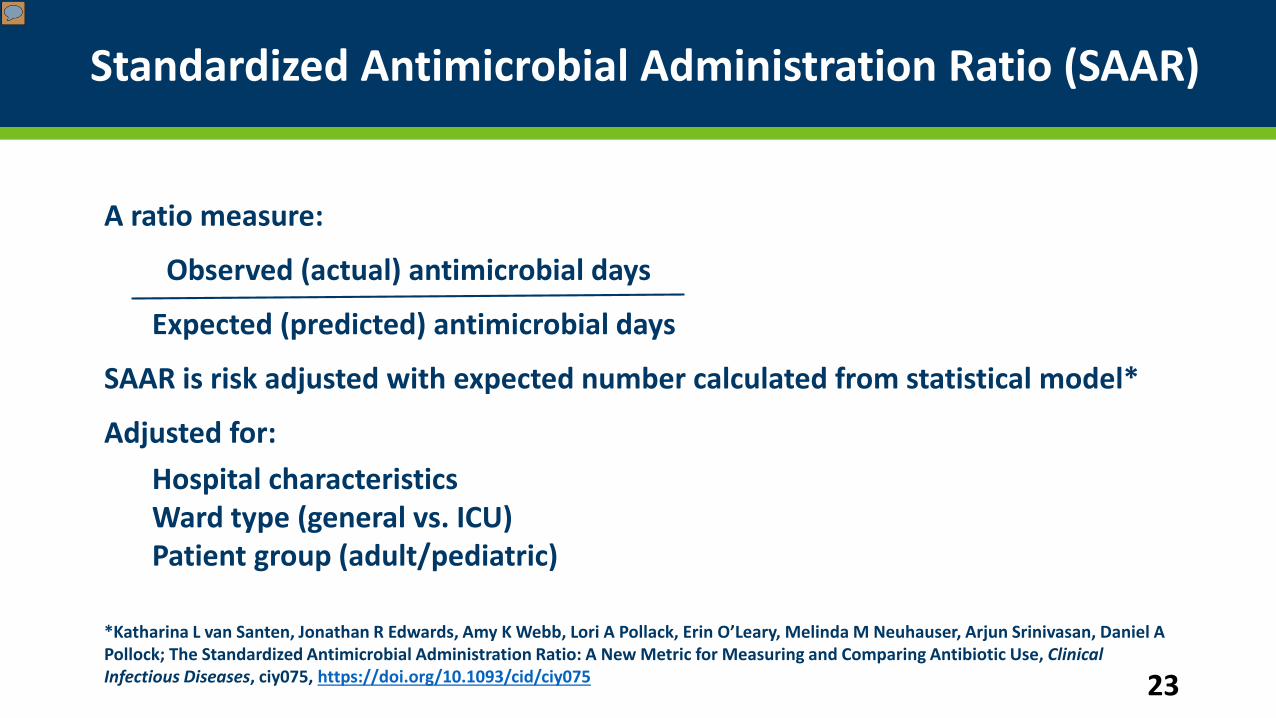
Standardized Antimicrobial Administration Ratio (SAAR)
A ratio measure:
Observed (actual) antimicrobial days
Expected (predicted) antimicrobial days
SAAR is risk adjusted with expected number calculated from statistical model*
Adjusted for: Hospital characteristicsWard type (general vs. ICU) Patient group (adult/pediatric)
*Katharina L van Santen, Jonathan R Edwards, Amy K Webb, Lori A Pollack, Erin O’Leary, Melinda M Neuhauser, Arjun Srinivasan, Daniel A Pollock; The Standardized Antimicrobial Administration Ratio: A New Metric for Measuring and Comparing Antibiotic Use, Clinical Infectious Diseases, ciy075, https://doi.org/10.1093/cid/ciy075 23
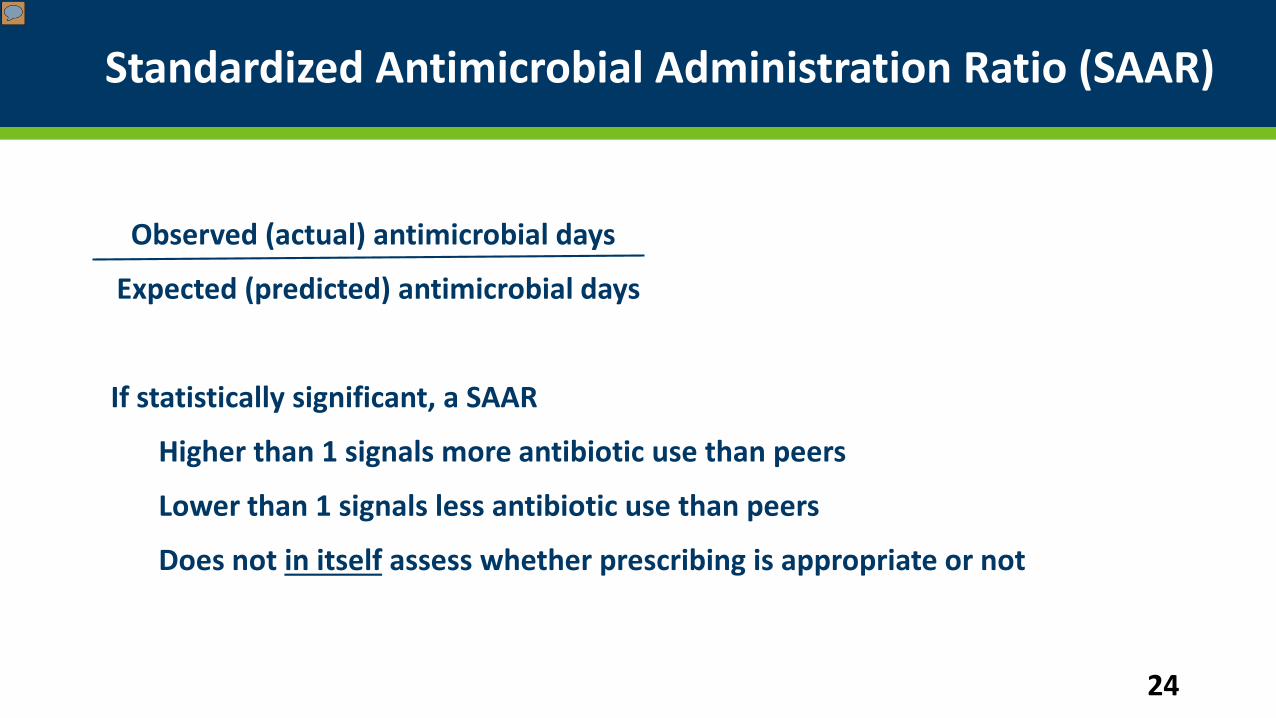
Standardized Antimicrobial Administration Ratio (SAAR)
Observed (actual) antimicrobial days
Expected (predicted) antimicrobial days
If statistically significant, a SAAR
Higher than 1 signals more antibiotic use than peers
Lower than 1 signals less antibiotic use than peers
Does not in itself assess whether prescribing is appropriate or not
24
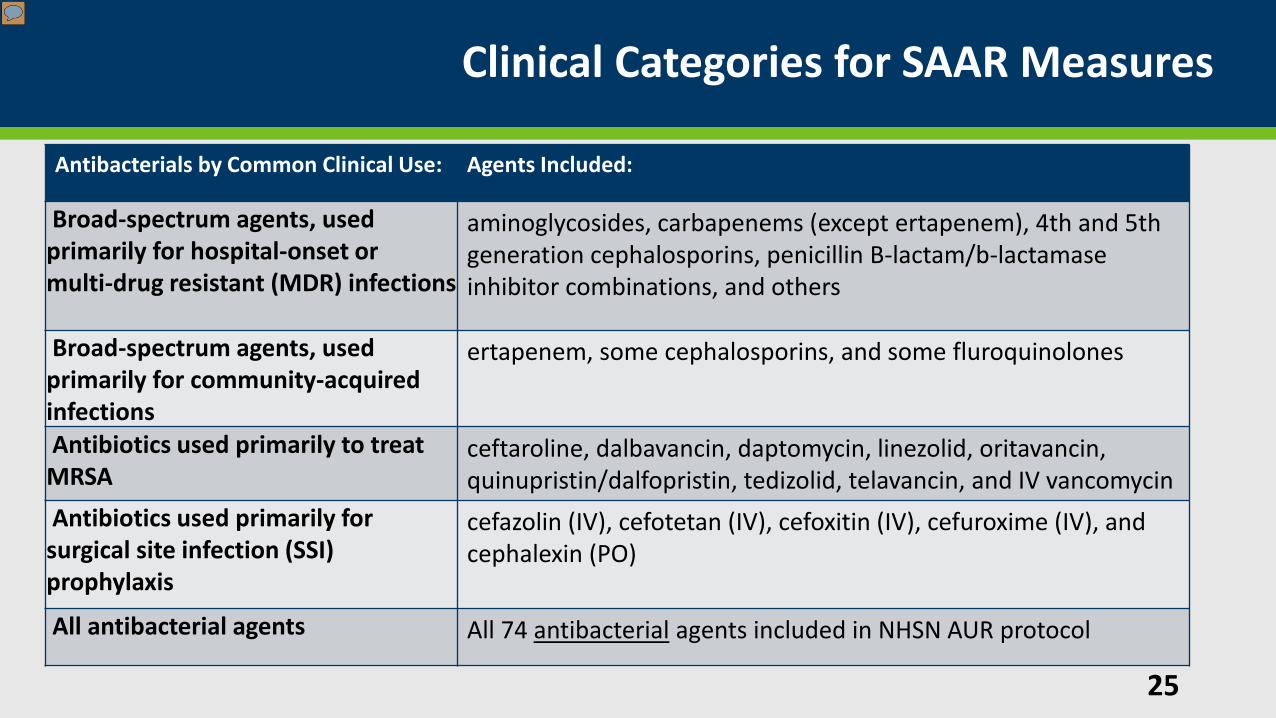
Clinical Categories for SAAR Measures
25
Antibacterials by Common Clinical Use: Agents Included:
Broad-spectrum agents, used primarily for hospital-onset or multi-drug resistant (MDR) infections
aminoglycosides, carbapenems (except ertapenem), 4th and 5th generation cephalosporins, penicillin B-lactam/b-lactamase inhibitor combinations, and others
Broad-spectrum agents, used primarily for community-acquired infections
ertapenem, some cephalosporins, and some fluroquinolones
Antibiotics used primarily to treat MRSA
ceftaroline, dalbavancin, daptomycin, linezolid, oritavancin,quinupristin/dalfopristin, tedizolid, telavancin, and IV vancomycin
Antibiotics used primarily for surgical site infection (SSI) prophylaxis
cefazolin (IV), cefotetan (IV), cefoxitin (IV), cefuroxime (IV), and cephalexin (PO)
All antibacterial agents All 74 antibacterial agents included in NHSN AUR protocol
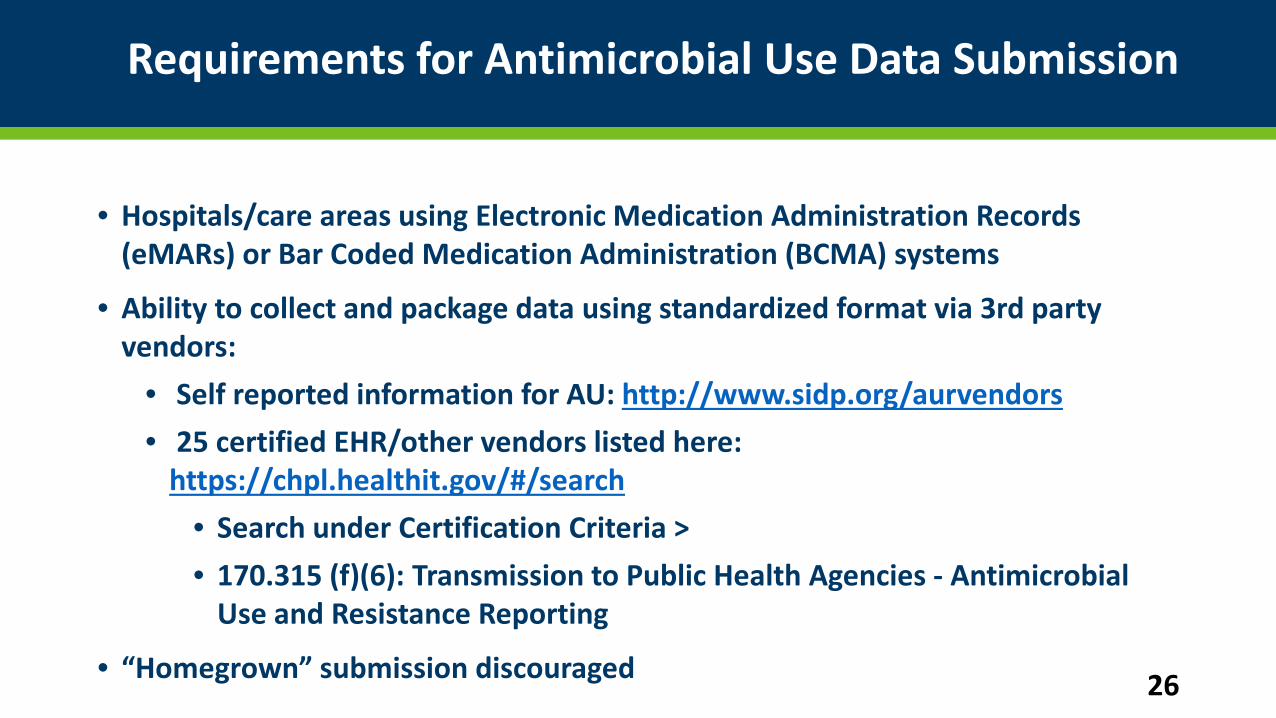
Requirements for Antimicrobial Use Data Submission
• Hospitals/care areas using Electronic Medication Administration Records (eMARs) or Bar Coded Medication Administration (BCMA) systems
• Ability to collect and package data using standardized format via 3rd party vendors:
• Self reported information for AU: http://www.sidp.org/aurvendors• 25 certified EHR/other vendors listed here:
https://chpl.healthit.gov/#/search• Search under Certification Criteria > • 170.315 (f)(6): Transmission to Public Health Agencies - Antimicrobial
Use and Resistance Reporting
• “Homegrown” submission discouraged 26
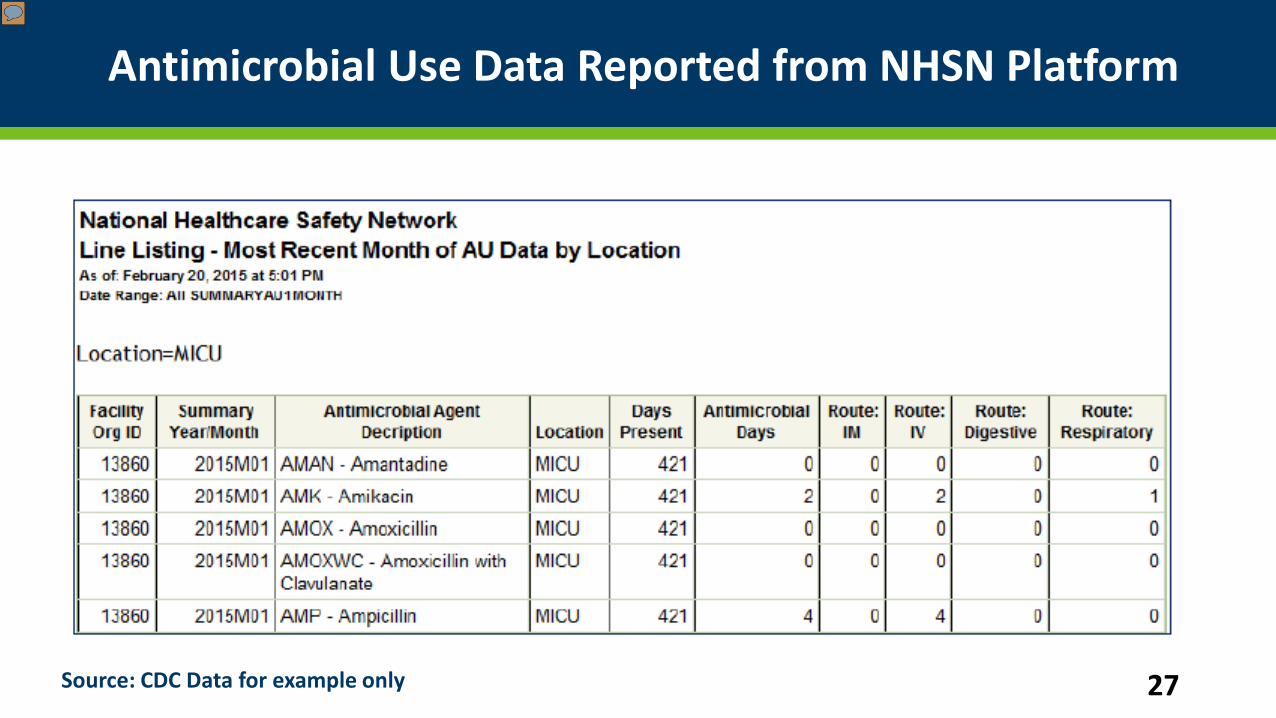
Antimicrobial Use Data Reported from NHSN Platform
27Source: CDC Data for example only
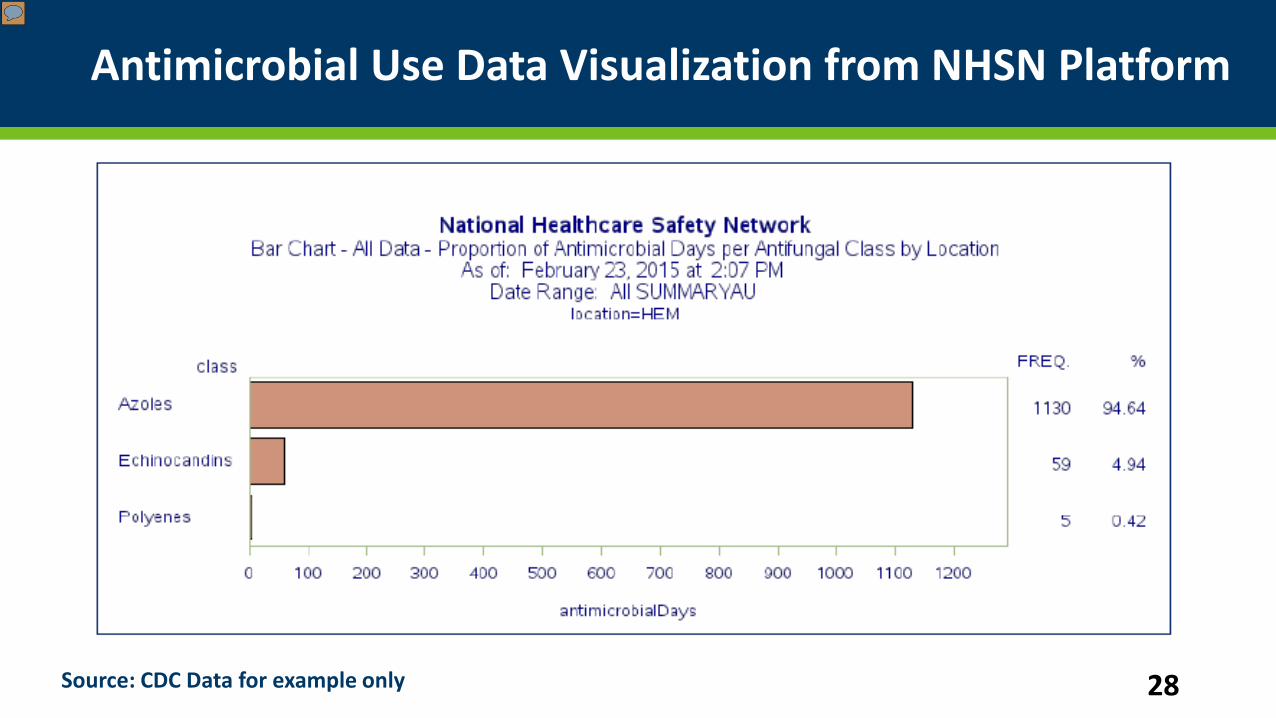
Antimicrobial Use Data Visualization from NHSN Platform
28Source: CDC Data for example only
Antibiotic Use Data Visualization and Assessment at the Unit levelUsing Excel-based tool
Erik Stensgard, PharmD, BCPS
Antimicrobial CDSS Program Manager
Minneapolis Veterans Affairs Health Care System 29
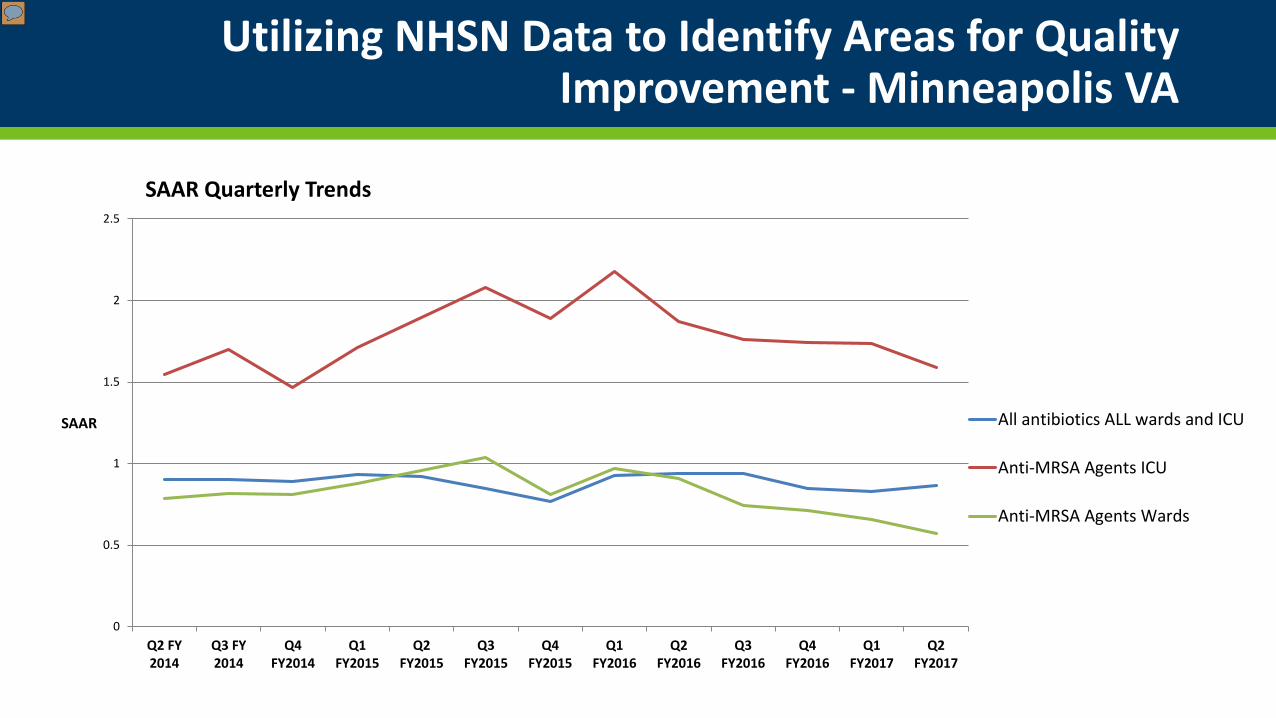
Utilizing NHSN Data to Identify Areas for Quality Improvement - Minneapolis VA
0
0.5
1
1.5
2
2.5
Q2 FY2014
Q3 FY2014
Q4FY2014
Q1FY2015
Q2FY2015
Q3FY2015
Q4FY2015
Q1FY2016
Q2FY2016
Q3FY2016
Q4FY2016
Q1FY2017
Q2FY2017
SAAR
SAAR Quarterly Trends
All antibiotics ALL wards and ICU
Anti-MRSA Agents ICU
Anti-MRSA Agents Wards
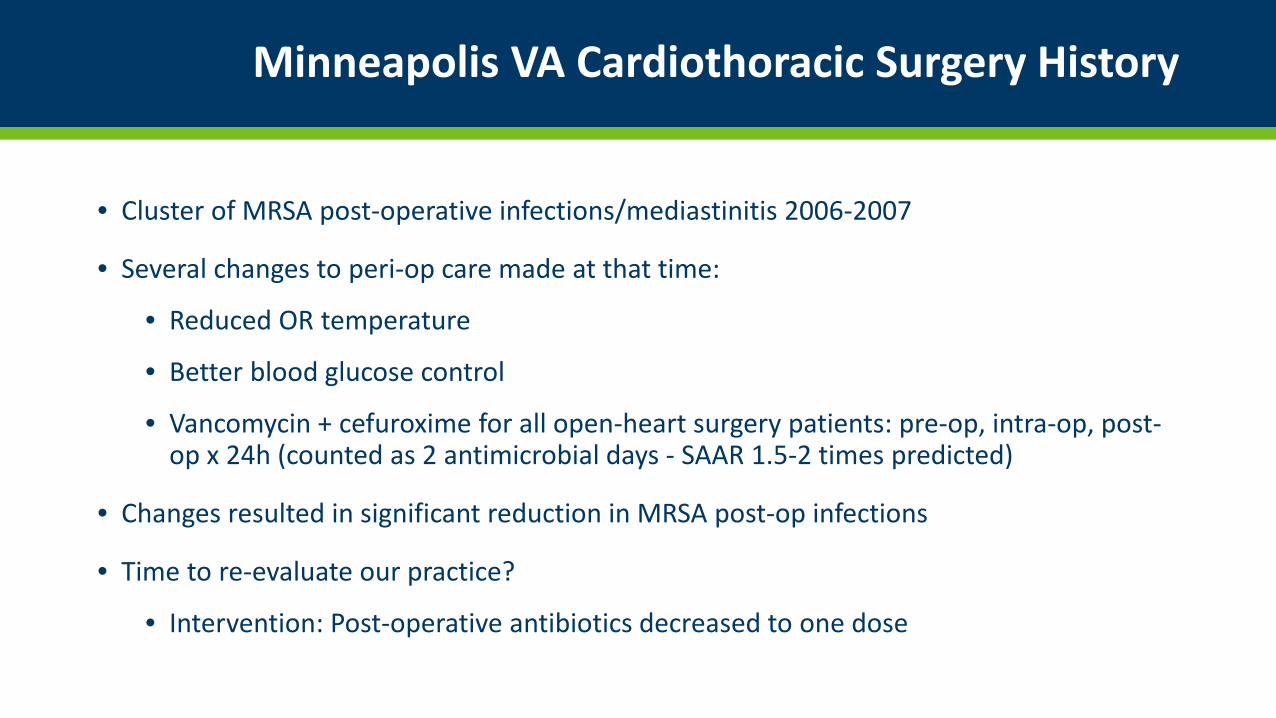
Minneapolis VA Cardiothoracic Surgery History
• Cluster of MRSA post-operative infections/mediastinitis 2006-2007
• Several changes to peri-op care made at that time:
• Reduced OR temperature
• Better blood glucose control
• Vancomycin + cefuroxime for all open-heart surgery patients: pre-op, intra-op, post-op x 24h (counted as 2 antimicrobial days - SAAR 1.5-2 times predicted)
• Changes resulted in significant reduction in MRSA post-op infections
• Time to re-evaluate our practice?
• Intervention: Post-operative antibiotics decreased to one dose
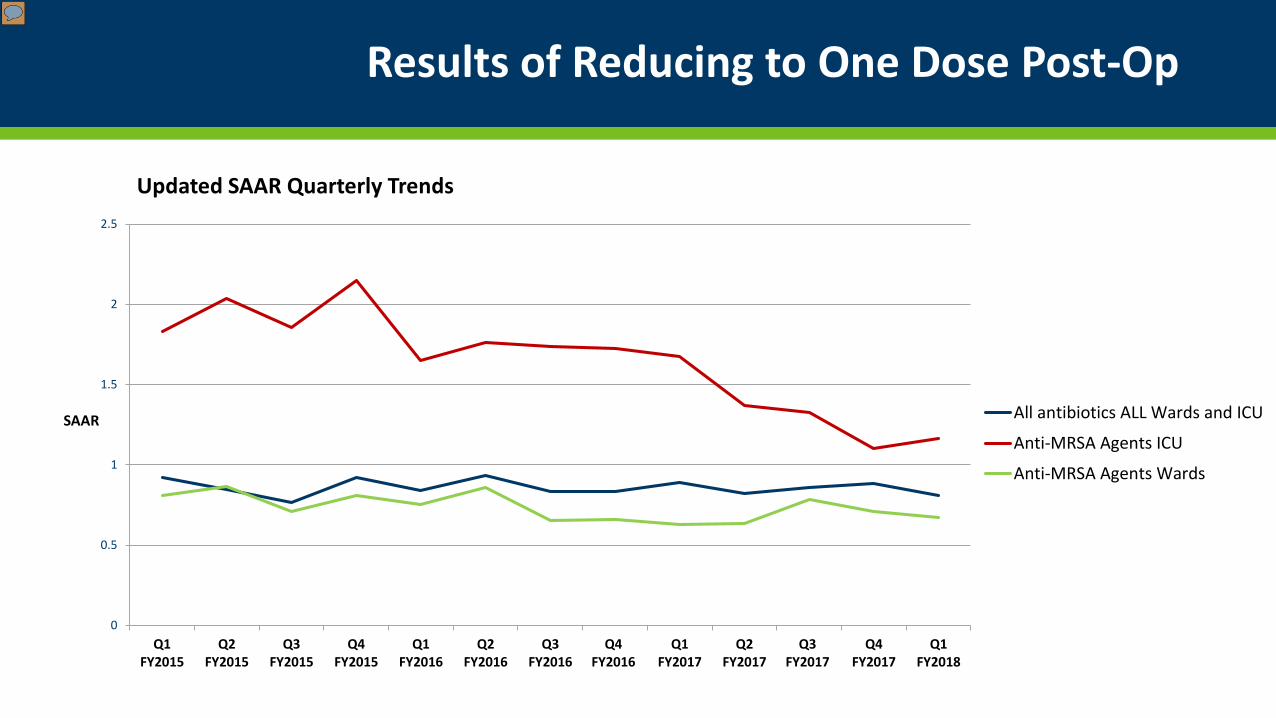
Results of Reducing to One Dose Post-Op
0
0.5
1
1.5
2
2.5
Q1FY2015
Q2FY2015
Q3FY2015
Q4FY2015
Q1FY2016
Q2FY2016
Q3FY2016
Q4FY2016
Q1FY2017
Q2FY2017
Q3FY2017
Q4FY2017
Q1FY2018
SAAR
Updated SAAR Quarterly Trends
All antibiotics ALL Wards and ICU
Anti-MRSA Agents ICU
Anti-MRSA Agents Wards
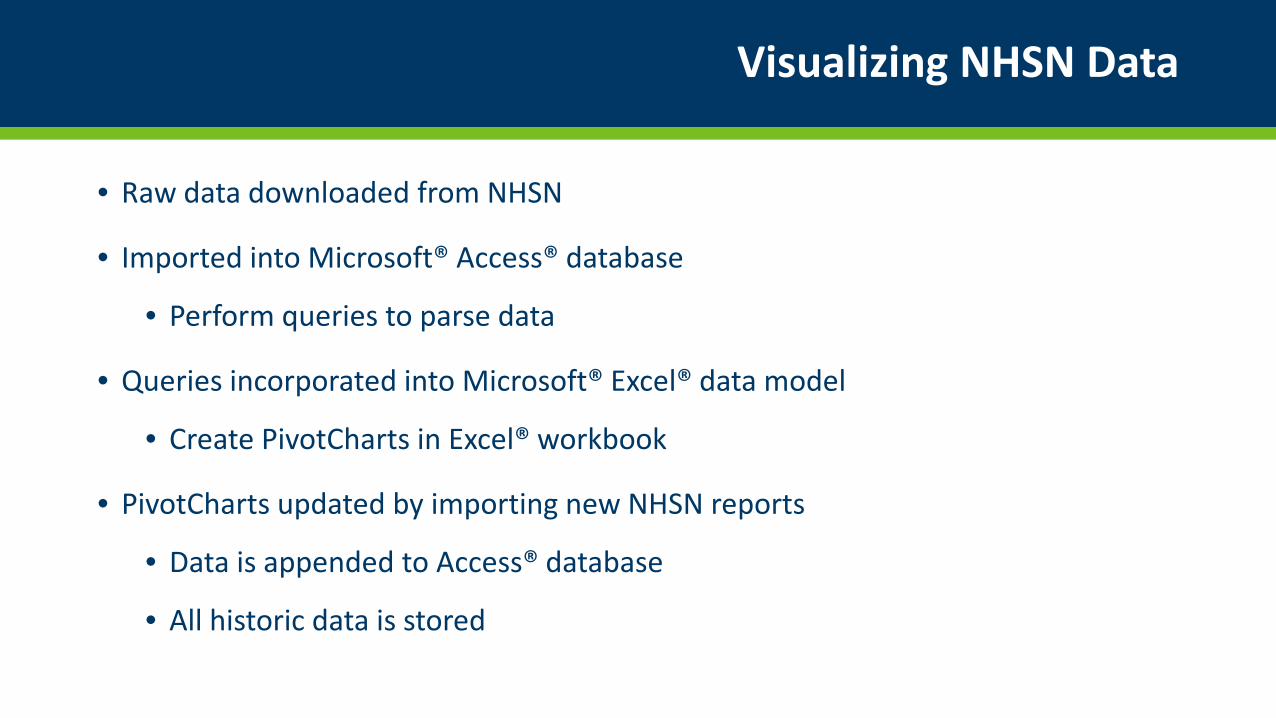
Visualizing NHSN Data
• Raw data downloaded from NHSN
• Imported into Microsoft® Access® database
• Perform queries to parse data
• Queries incorporated into Microsoft® Excel® data model
• Create PivotCharts in Excel® workbook
• PivotCharts updated by importing new NHSN reports
• Data is appended to Access® database
• All historic data is stored
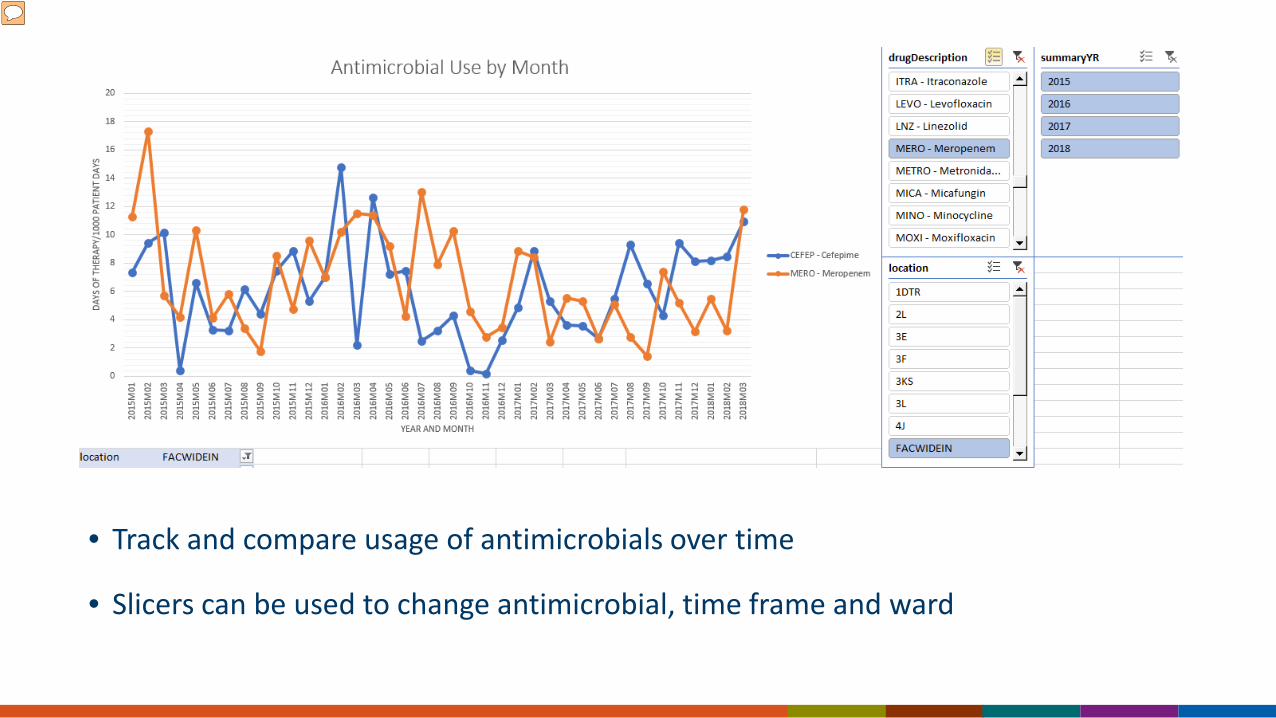
• Track and compare usage of antimicrobials over time
• Slicers can be used to change antimicrobial, time frame and ward
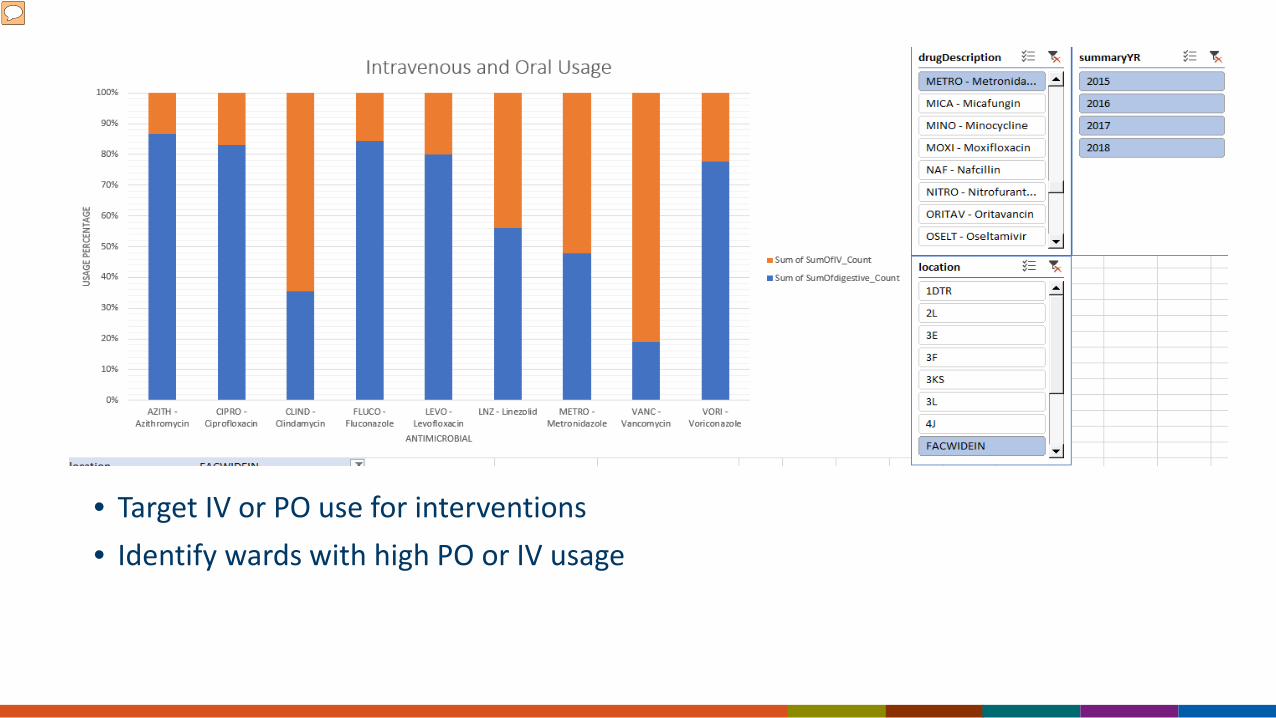
• Target IV or PO use for interventions• Identify wards with high PO or IV usage
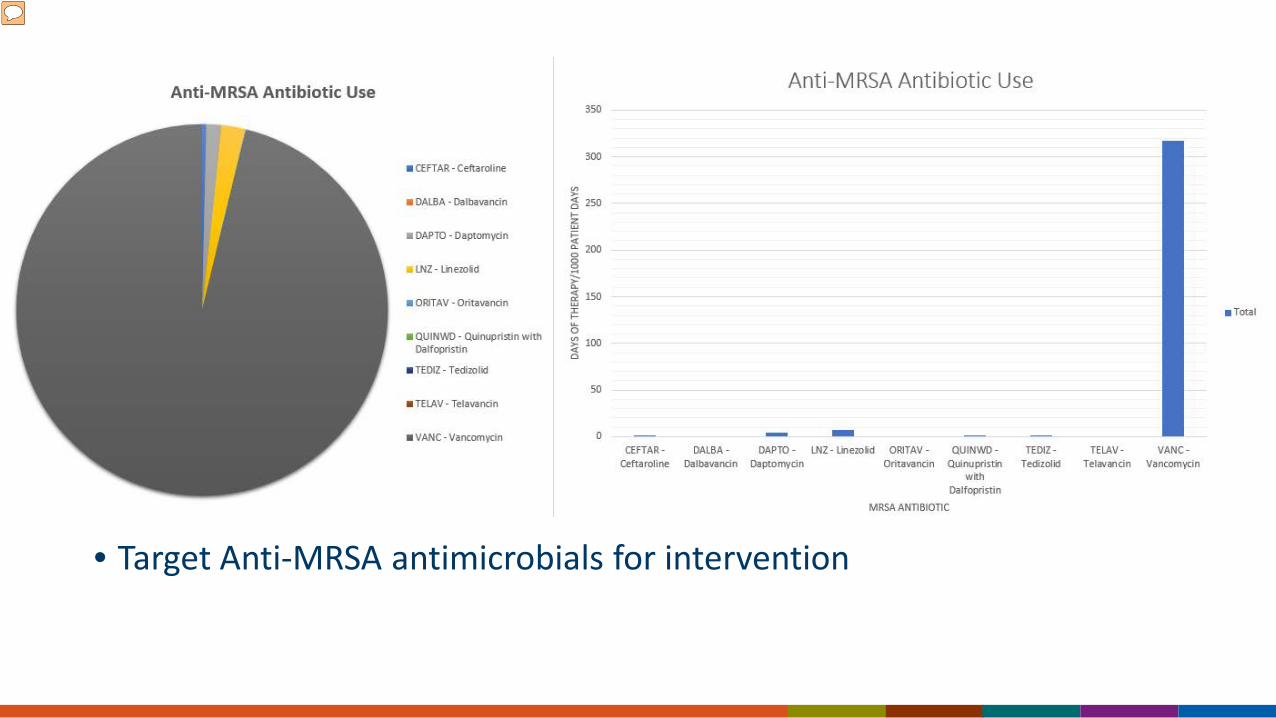
• Target Anti-MRSA antimicrobials for intervention
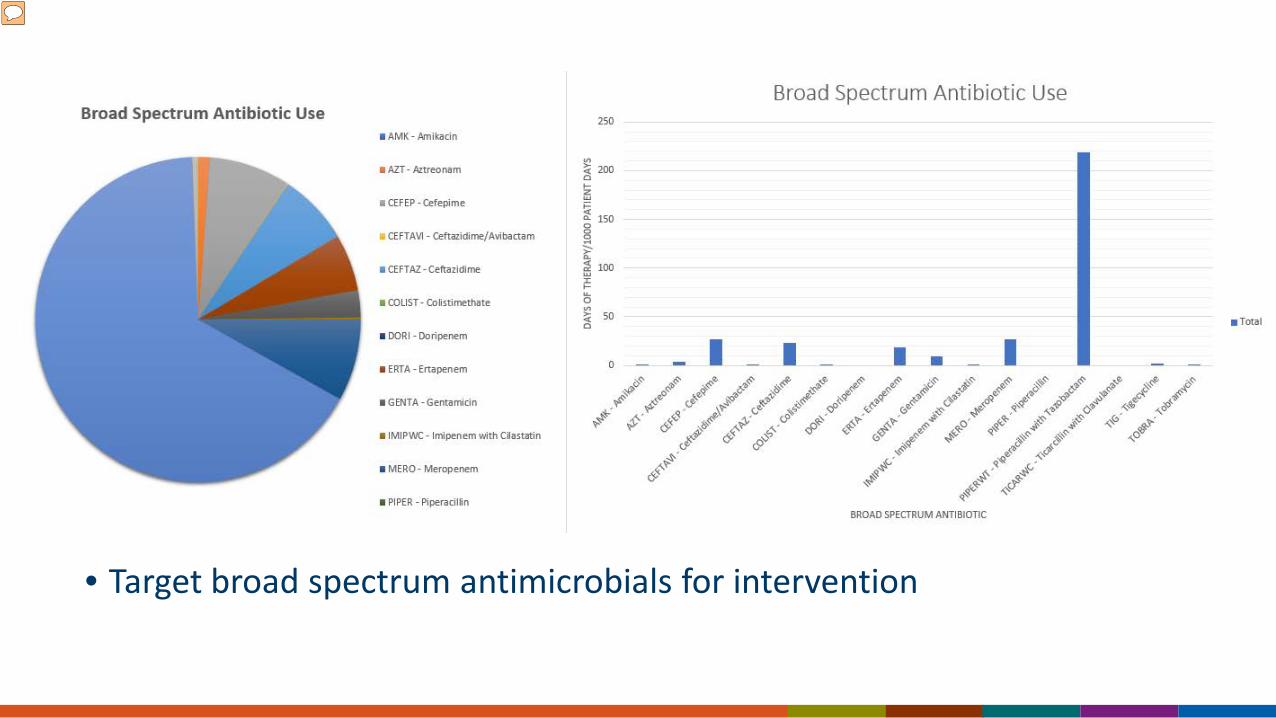
• Target broad spectrum antimicrobials for intervention
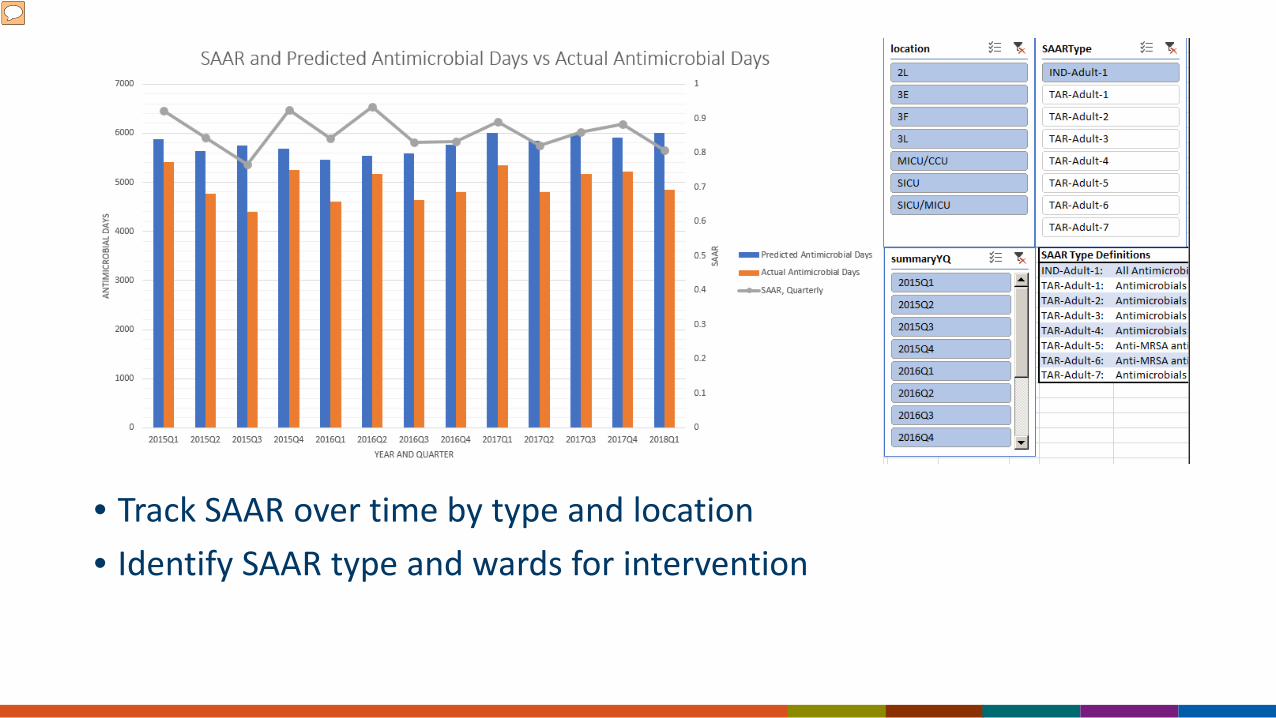
• Track SAAR over time by type and location• Identify SAAR type and wards for intervention
Credits
• Andrea Aylward, PharmD, NHSN Dashboard Developer
• Dimitri Drekonja, MD, Chief of ID MVAHCS
• Makoto Jones, MD, VA NHSN Support Group Salt Lake City
• Bobbie Masoud, PharmD, NHSN Administrator VISN 23
• Lauren Rademacher, Antimicrobial Stewardship Pharmacist MVAHCS
• Micheal Vasek, MBA, NHSN Dashboard Developer
Practical Application of NHSN Antimicrobial Use Data
Clark Force, RPh, BCPS
Antimicrobial Stewardship Pharmacist
Tucson Medical Center 40
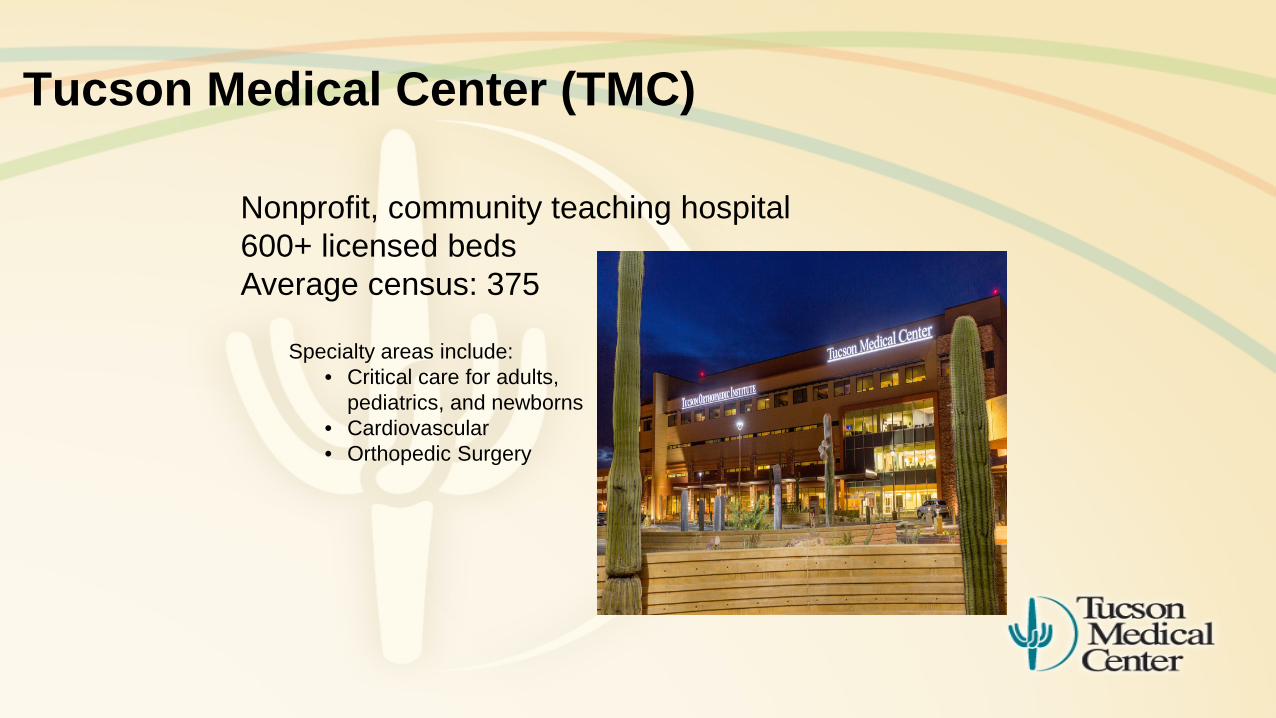
Tucson Medical Center (TMC)
Specialty areas include: • Critical care for adults,
pediatrics, and newborns• Cardiovascular• Orthopedic Surgery
Nonprofit, community teaching hospital600+ licensed bedsAverage census: 375
Background:
Spring 2016:
Request from TMC Administration and Infection Control for the Antimicrobial Stewardship Program (ASP) to initiate an improvement project to help meet the hospital goal of reducing the incidence of Hospital-Onset C. difficile Infections (HO-CDI)
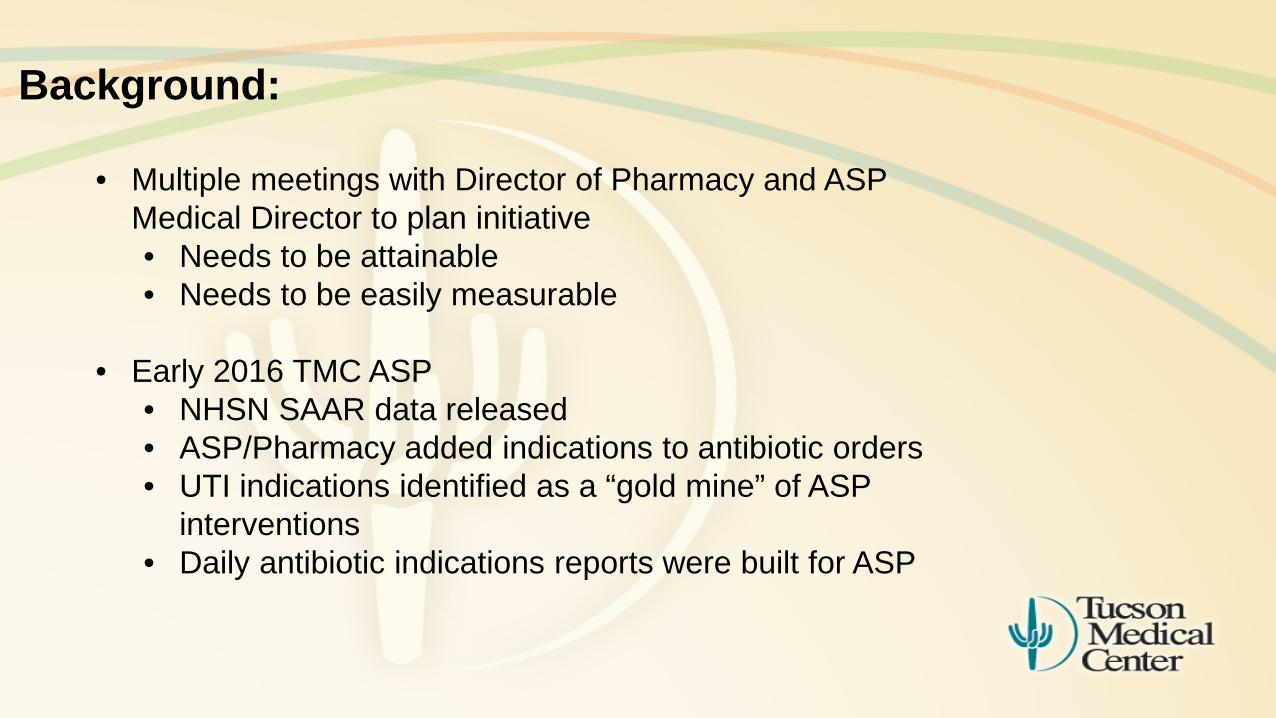
Background:
• Multiple meetings with Director of Pharmacy and ASP Medical Director to plan initiative• Needs to be attainable• Needs to be easily measurable
• Early 2016 TMC ASP • NHSN SAAR data released• ASP/Pharmacy added indications to antibiotic orders• UTI indications identified as a “gold mine” of ASP
interventions• Daily antibiotic indications reports were built for ASP
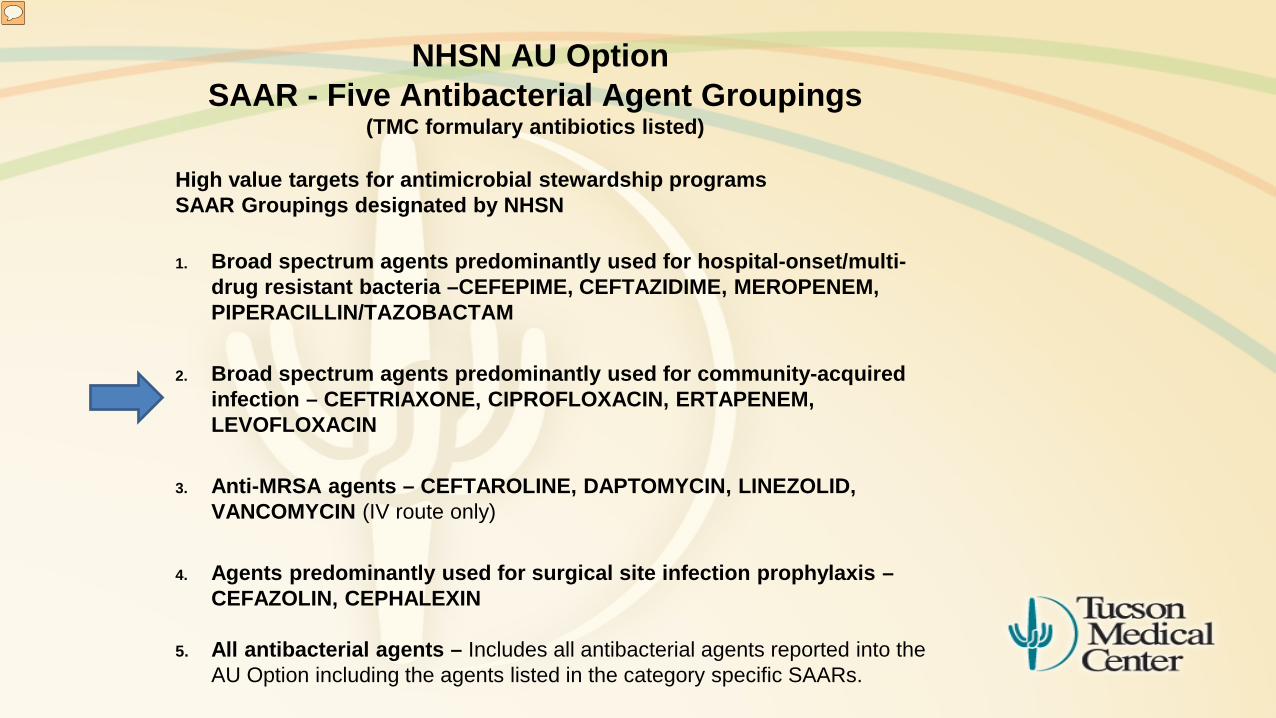
NHSN AU OptionSAAR - Five Antibacterial Agent Groupings
(TMC formulary antibiotics listed)
High value targets for antimicrobial stewardship programs SAAR Groupings designated by NHSN
1. Broad spectrum agents predominantly used for hospital-onset/multi-drug resistant bacteria –CEFEPIME, CEFTAZIDIME, MEROPENEM, PIPERACILLIN/TAZOBACTAM
2. Broad spectrum agents predominantly used for community-acquired infection – CEFTRIAXONE, CIPROFLOXACIN, ERTAPENEM, LEVOFLOXACIN
3. Anti-MRSA agents – CEFTAROLINE, DAPTOMYCIN, LINEZOLID, VANCOMYCIN (IV route only)
4. Agents predominantly used for surgical site infection prophylaxis –CEFAZOLIN, CEPHALEXIN
5. All antibacterial agents – Includes all antibacterial agents reported into the AU Option including the agents listed in the category specific SAARs.
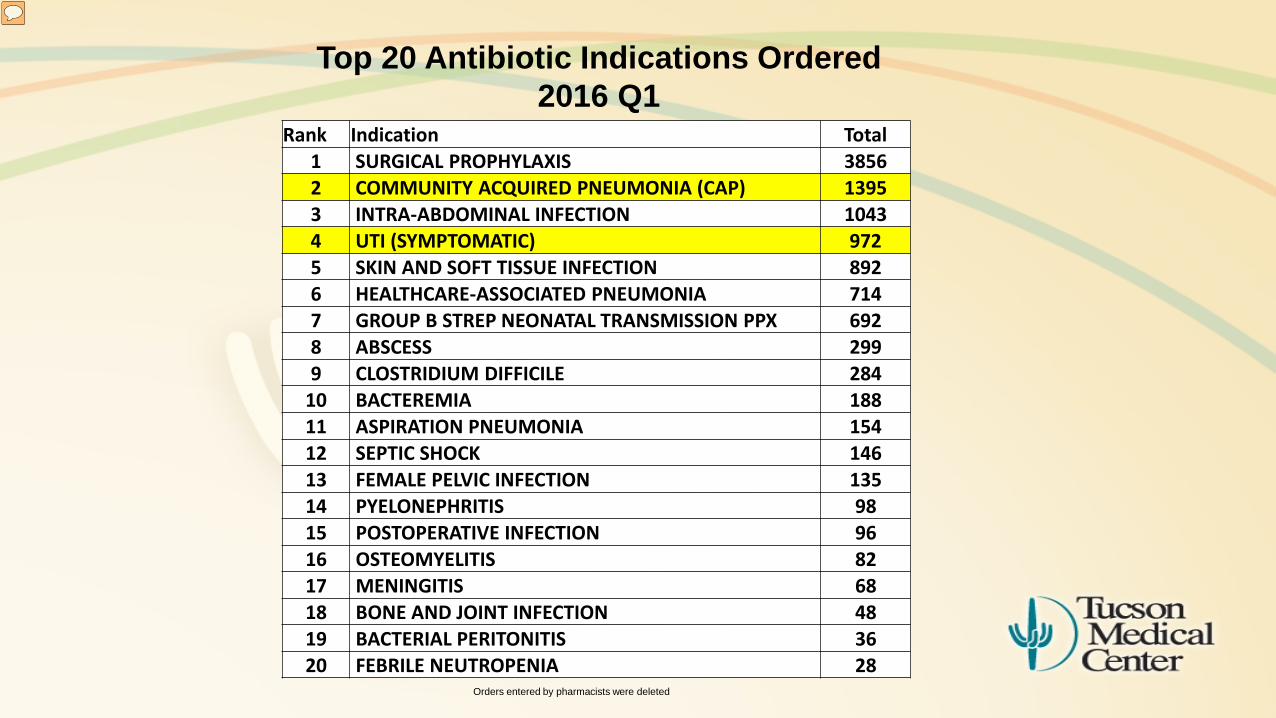
Top 20 Antibiotic Indications Ordered2016 Q1
Orders entered by pharmacists were deleted
Rank Indication Total1 SURGICAL PROPHYLAXIS 38562 COMMUNITY ACQUIRED PNEUMONIA (CAP) 13953 INTRA-ABDOMINAL INFECTION 10434 UTI (SYMPTOMATIC) 9725 SKIN AND SOFT TISSUE INFECTION 8926 HEALTHCARE-ASSOCIATED PNEUMONIA 7147 GROUP B STREP NEONATAL TRANSMISSION PPX 6928 ABSCESS 2999 CLOSTRIDIUM DIFFICILE 284
10 BACTEREMIA 18811 ASPIRATION PNEUMONIA 15412 SEPTIC SHOCK 14613 FEMALE PELVIC INFECTION 13514 PYELONEPHRITIS 9815 POSTOPERATIVE INFECTION 9616 OSTEOMYELITIS 8217 MENINGITIS 6818 BONE AND JOINT INFECTION 4819 BACTERIAL PERITONITIS 3620 FEBRILE NEUTROPENIA 28
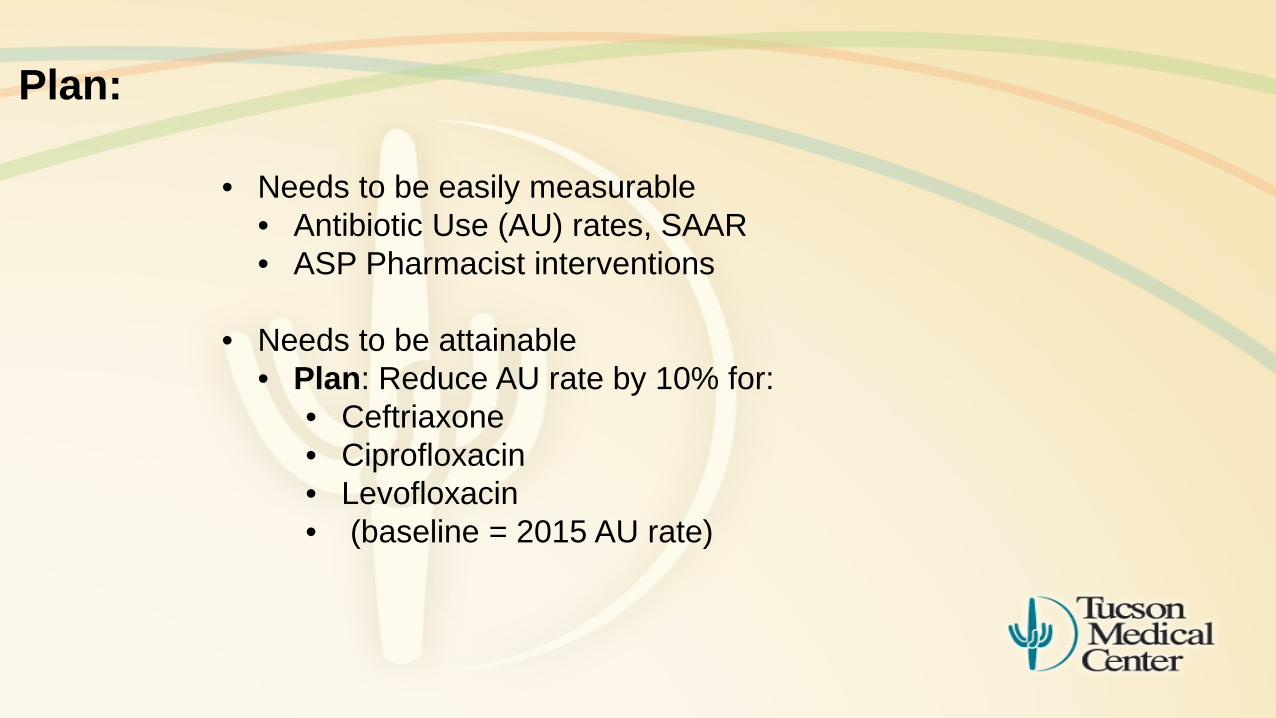
Plan:
• Needs to be easily measurable• Antibiotic Use (AU) rates, SAAR • ASP Pharmacist interventions
• Needs to be attainable • Plan: Reduce AU rate by 10% for:
• Ceftriaxone• Ciprofloxacin • Levofloxacin• (baseline = 2015 AU rate)
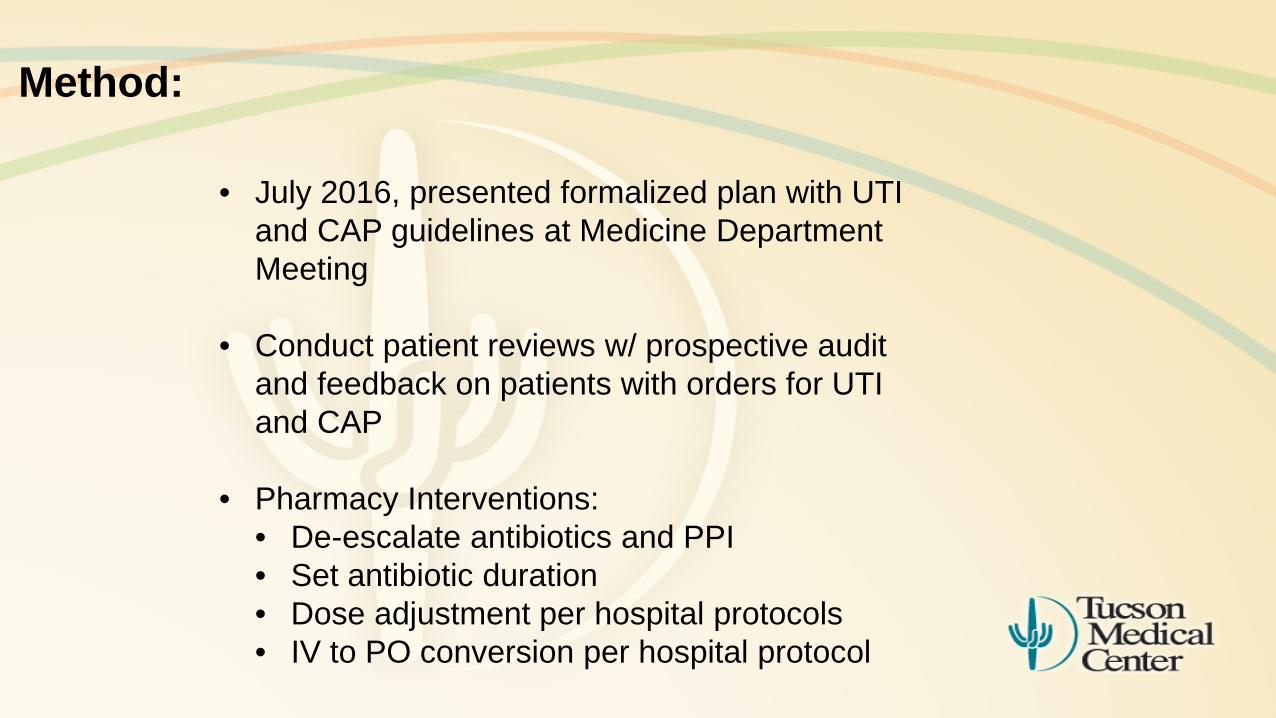
Method:
• July 2016, presented formalized plan with UTI and CAP guidelines at Medicine Department Meeting
• Conduct patient reviews w/ prospective audit and feedback on patients with orders for UTI and CAP
• Pharmacy Interventions:• De-escalate antibiotics and PPI• Set antibiotic duration • Dose adjustment per hospital protocols• IV to PO conversion per hospital protocol
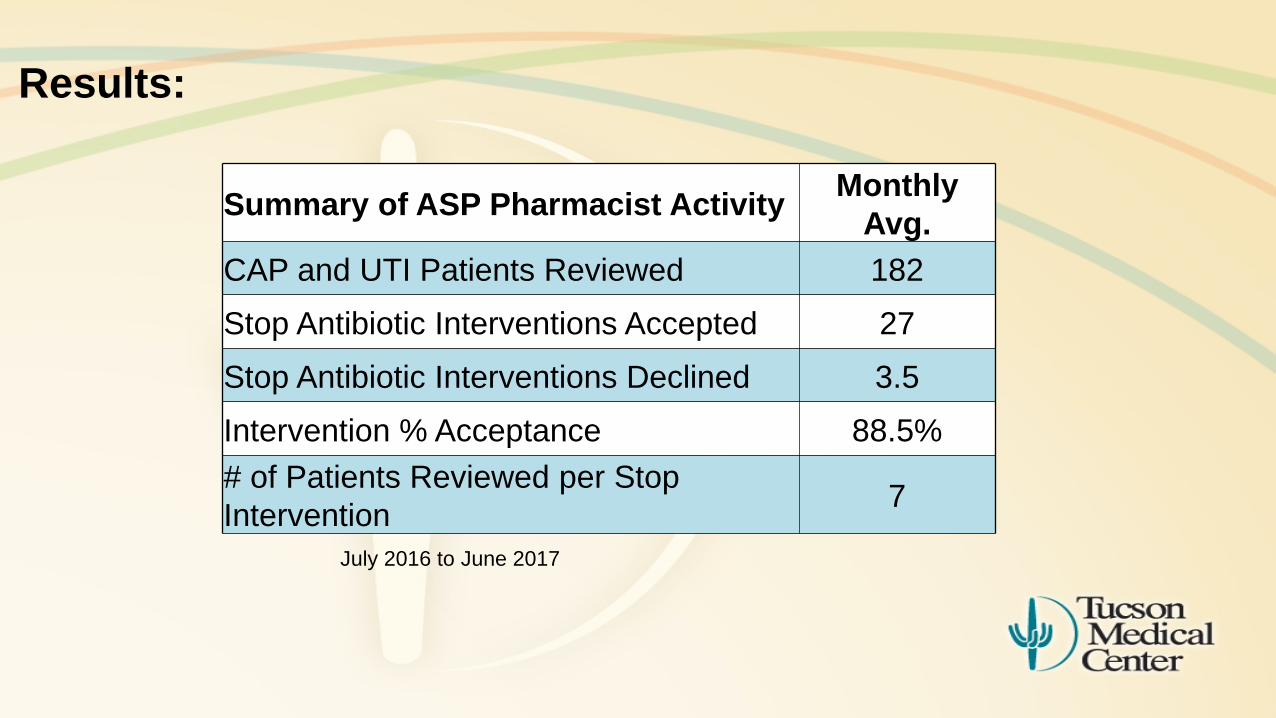
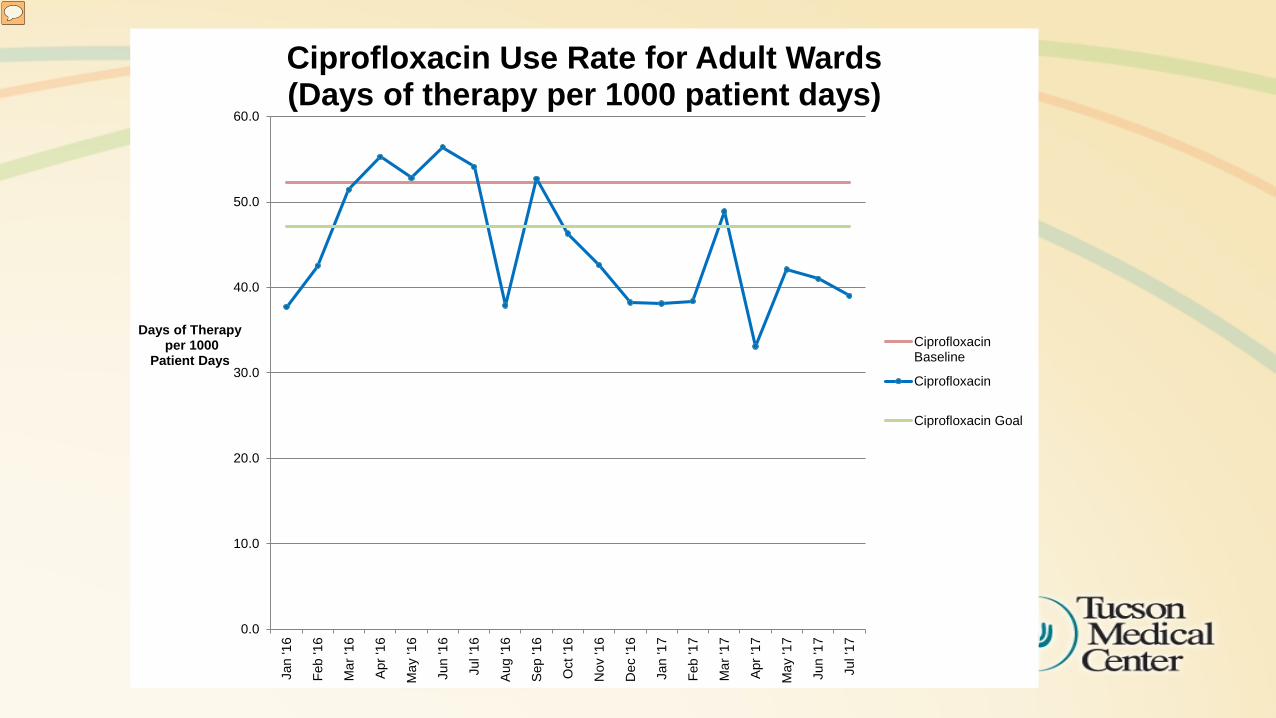
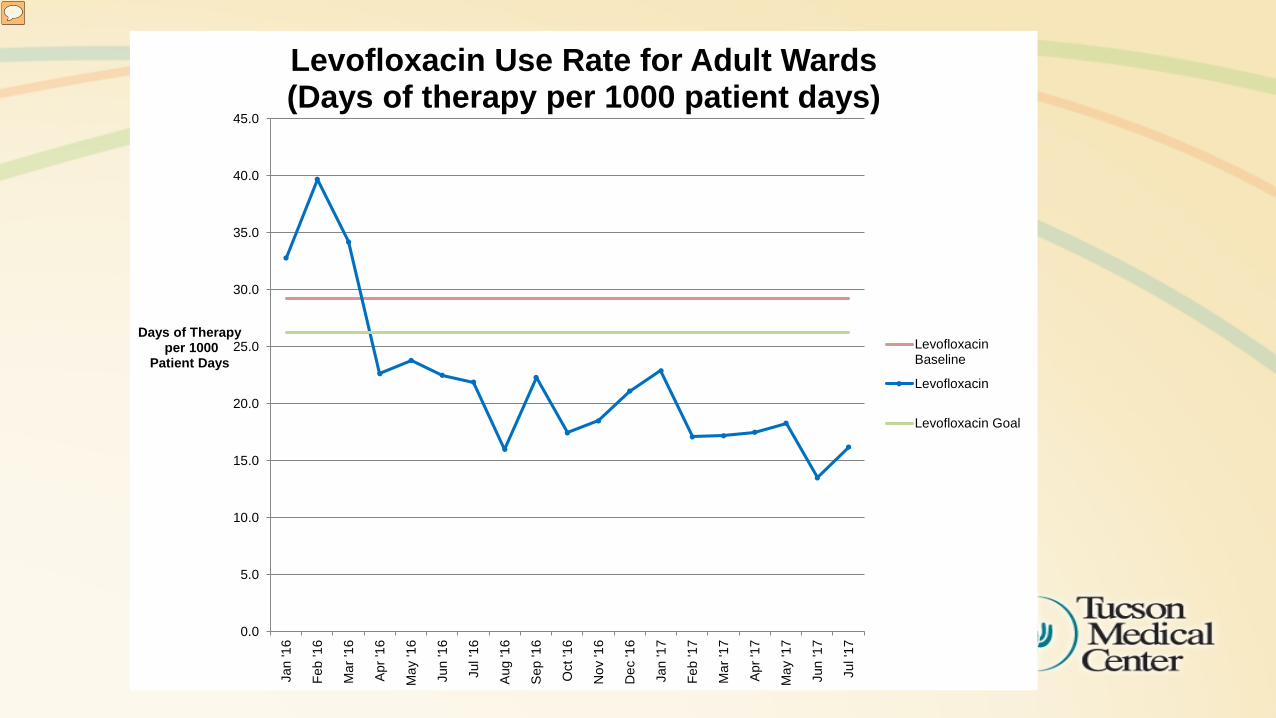
Results:
Summary of ASP Pharmacist Activity MonthlyAvg.
CAP and UTI Patients Reviewed 182Stop Antibiotic Interventions Accepted 27Stop Antibiotic Interventions Declined 3.5Intervention % Acceptance 88.5%# of Patients Reviewed per Stop Intervention 7
July 2016 to June 2017
0.0
10.0
20.0
30.0
40.0
50.0
60.0
Jan
'16
Feb
'16
Mar
'16
Apr '
16
May
'16
Jun
'16
Jul '
16
Aug
'16
Sep
'16
Oct
'16
Nov
'16
Dec
'16
Jan
'17
Feb
'17
Mar
'17
Apr '
17
May
'17
Jun
'17
Jul '
17
Days of Therapyper 1000
Patient Days
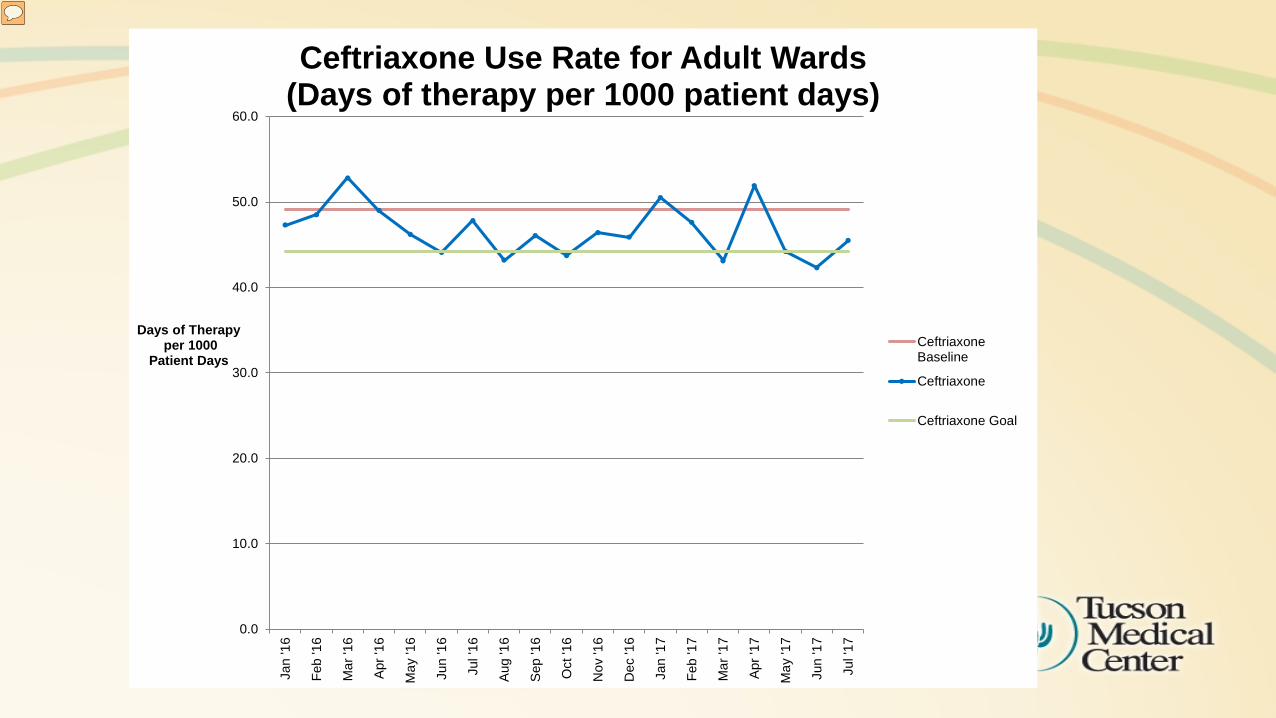
Ceftriaxone Use Rate for Adult Wards(Days of therapy per 1000 patient days)
CeftriaxoneBaseline
Ceftriaxone
Ceftriaxone Goal
0.0
10.0
20.0
30.0
40.0
50.0
60.0
Jan
'16
Feb
'16
Mar
'16
Apr '
16
May
'16
Jun
'16
Jul '
16
Aug
'16
Sep
'16
Oct
'16
Nov
'16
Dec
'16
Jan
'17
Feb
'17
Mar
'17
Apr '
17
May
'17
Jun
'17
Jul '
17
Days of Therapyper 1000
Patient Days
Ciprofloxacin Use Rate for Adult Wards(Days of therapy per 1000 patient days)
CiprofloxacinBaseline
Ciprofloxacin
Ciprofloxacin Goal
0.0
5.0
10.0
15.0
20.0
25.0
30.0
35.0
40.0
45.0
Jan
'16
Feb
'16
Mar
'16
Apr '
16
May
'16
Jun
'16
Jul '
16
Aug
'16
Sep
'16
Oct
'16
Nov
'16
Dec
'16
Jan
'17
Feb
'17
Mar
'17
Apr '
17
May
'17
Jun
'17
Jul '
17
Days of Therapyper 1000
Patient Days
Levofloxacin Use Rate for Adult Wards(Days of therapy per 1000 patient days)
LevofloxacinBaseline
Levofloxacin
Levofloxacin Goal
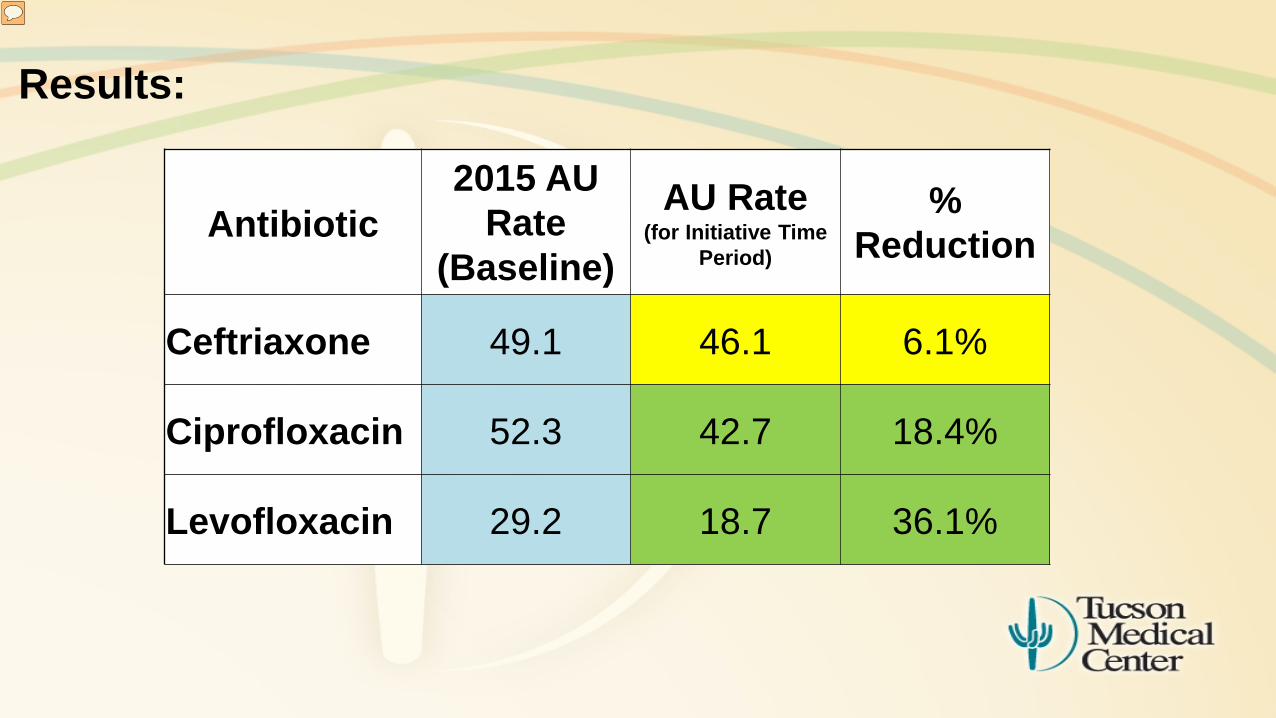
Results:
Antibiotic 2015 AU
Rate (Baseline)
AU Rate (for Initiative Time
Period)
% Reduction
Ceftriaxone 49.1 46.1 6.1%
Ciprofloxacin 52.3 42.7 18.4%
Levofloxacin 29.2 18.7 36.1%
Results:
ASP initiative was part of the 2016 hospital-wide C diff reduction program which also included changes to:
• Environmental cleaning • Hand hygiene • C diff testing
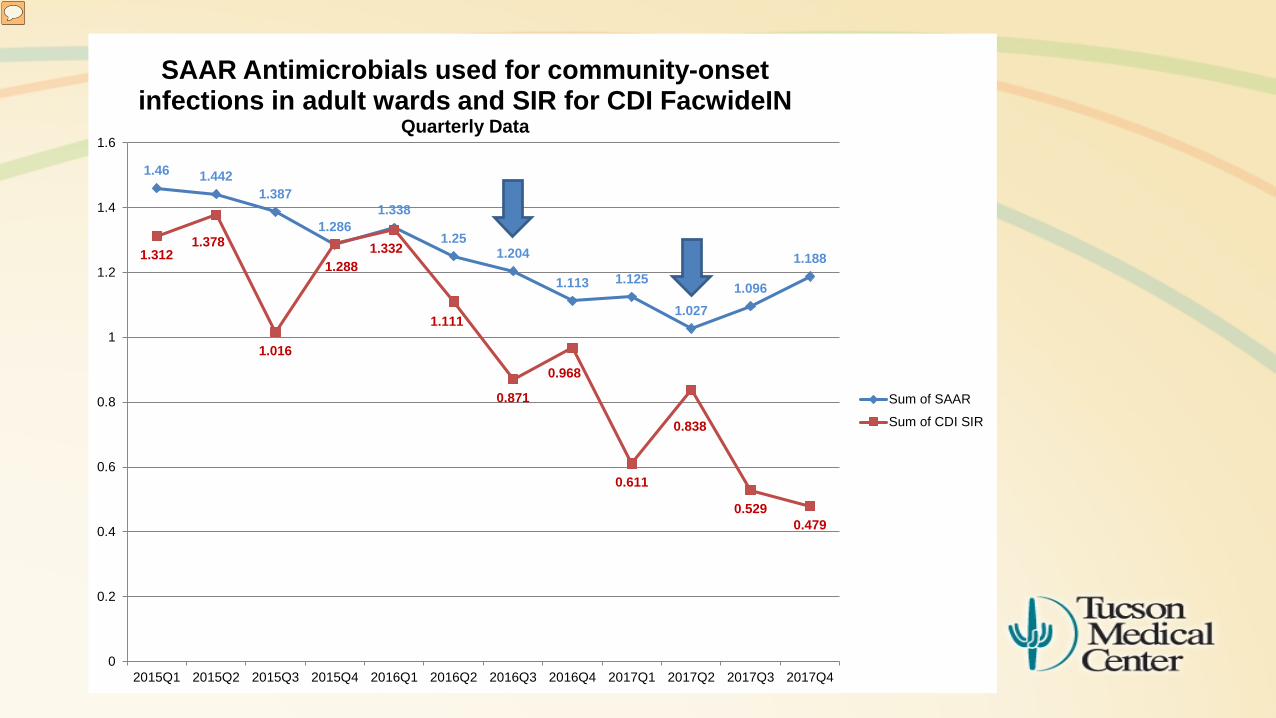
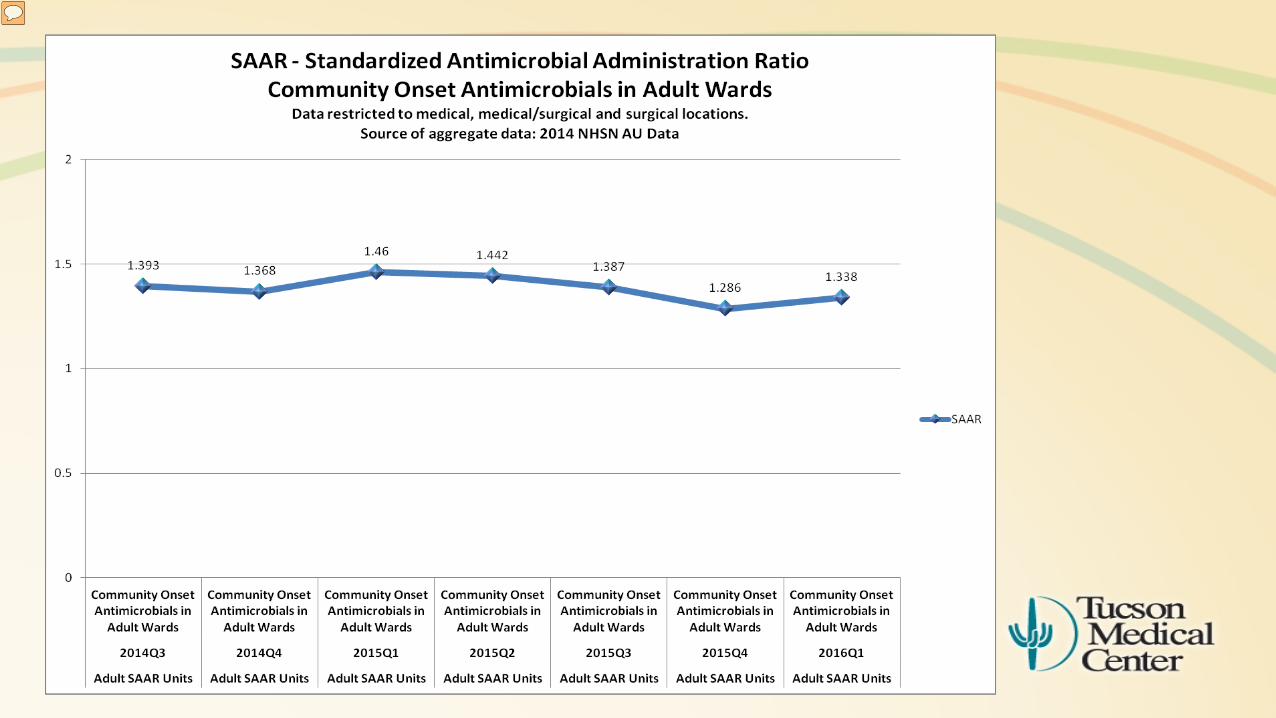
1.46 1.4421.387
1.2861.338
1.251.204
1.113 1.125
1.0271.096
1.1881.3121.378
1.016
1.2881.332
1.111
0.871
0.968
0.611
0.838
0.5290.479
0
0.2
0.4
0.6
0.8
1
1.2
1.4
1.6
2015Q1 2015Q2 2015Q3 2015Q4 2016Q1 2016Q2 2016Q3 2016Q4 2017Q1 2017Q2 2017Q3 2017Q4
SAAR Antimicrobials used for community-onset infections in adult wards and SIR for CDI FacwideIN
Quarterly Data
Sum of SAAR
Sum of CDI SIR
Conclusions:
• With prospective audit and feedback, over a 12 month period we applied downward pressure on the Ward SAAR for Community Onset Infections and saw reduction in use of the targeted antibiotics. Although it is part of a multi-pronged approach, we feel it is an important contributor towards the decrease in HO-CDI at our institution.
• Access to NHSN AU data• Directed us to target an improvement• Allowed for easy tracking of progress
• Antibiotic indications reporting helped us focus on specific patients/orders.
Lessons Learned:
• This initiative includes the following CDC ASP (Joint Commission) core elements of:• Tracking: AU data• Action: Prospective audit and feedback,
improve AU• Education: Providers• Reporting: Hospital administration, ASP
• UTI and CAP guidelines are a good starting point to “train” providers to de-escalate and set durations
• SAAR has no seasonal variation
Next Steps:
• In November 2017, we rotated to new indications group: • Intra-abdominal infections• Healthcare-associated pneumonia• Skin and soft tissue infections
• Will progress be from CAP and UTI reviews sustained?
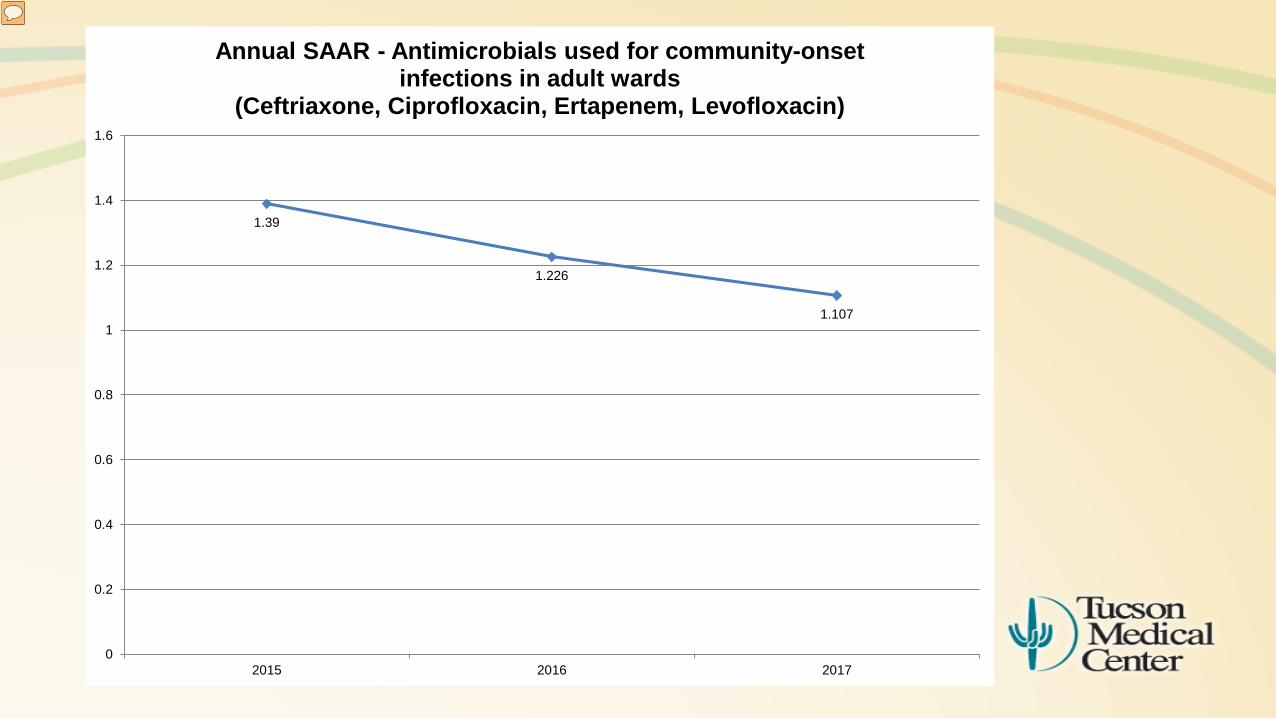
1.39
1.226
1.107
0
0.2
0.4
0.6
0.8
1
1.2
1.4
1.6
2015 2016 2017
Annual SAAR - Antimicrobials used for community-onset infections in adult wards
(Ceftriaxone, Ciprofloxacin, Ertapenem, Levofloxacin)
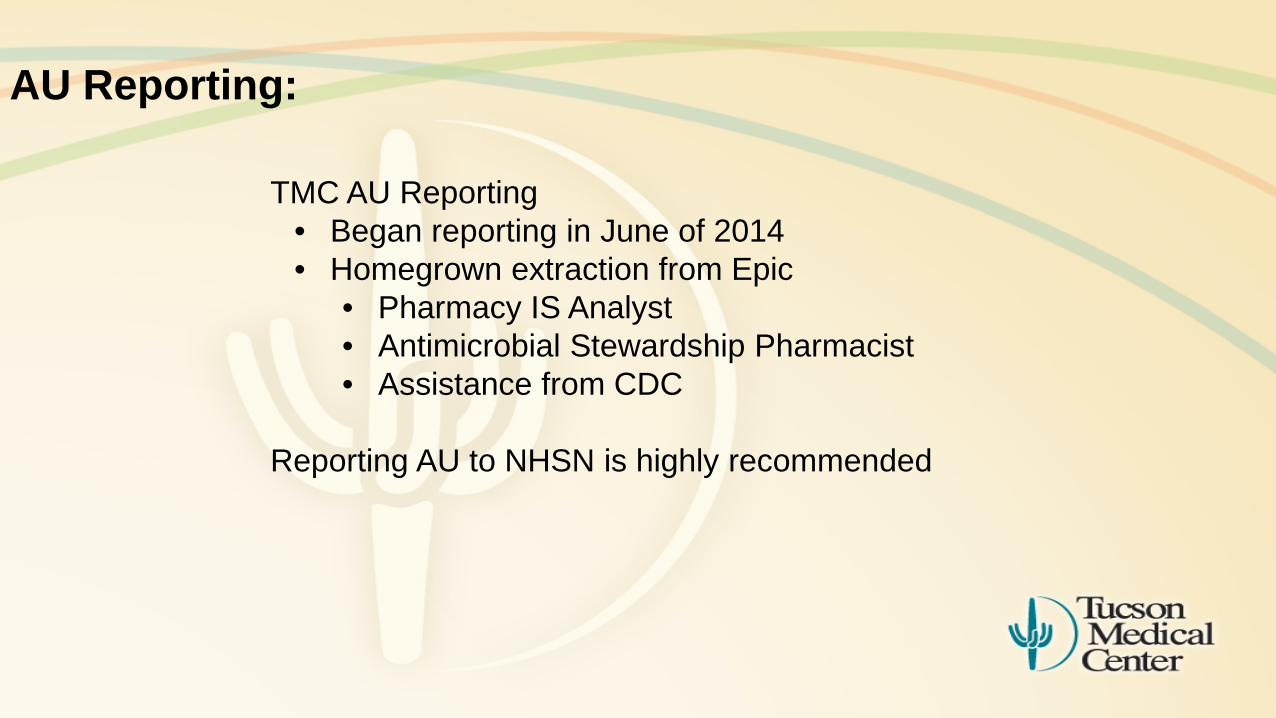
AU Reporting:
TMC AU Reporting • Began reporting in June of 2014• Homegrown extraction from Epic
• Pharmacy IS Analyst• Antimicrobial Stewardship Pharmacist• Assistance from CDC
Reporting AU to NHSN is highly recommended

Wrap-up
Catherine Lexau, PhD, MPH, RN, Minnesota Department of Health
62
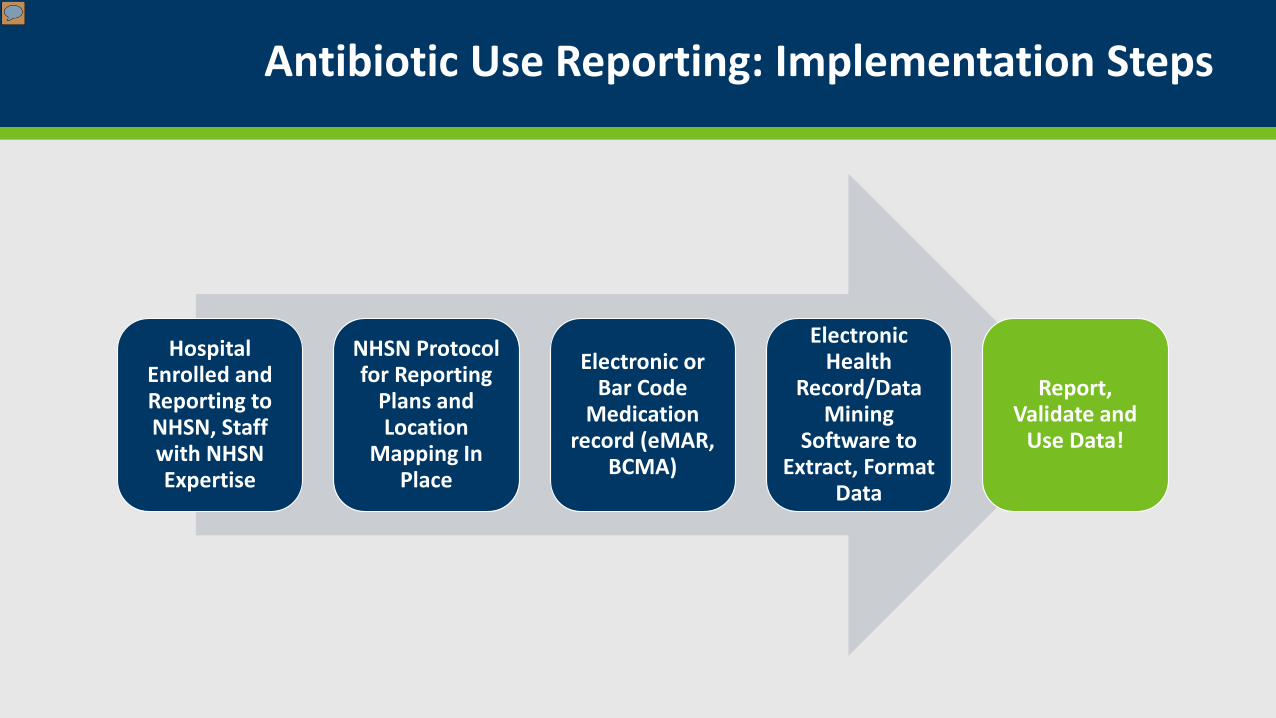
Antibiotic Use Reporting: Implementation Steps
Hospital Enrolled and Reporting to NHSN, Staff with NHSN Expertise
NHSN Protocol for Reporting
Plans and Location
Mapping In Place
Electronic or Bar Code
Medication record (eMAR,
BCMA)
Electronic Health
Record/Data Mining
Software to Extract, Format
Data
Report, Validate and
Use Data!
Acknowledgements:
Dawn Chen, Amanda Beaudoin and Ashley Fell from MDHAmy Webb, Wendy Wise and Chaity Naik from CDC
64
Questions!
Please Enter Your Questions in the Chat Box
More detailed information on NHSN AUR Module:
Protocol: https://www.cdc.gov/nhsn/pdfs/pscmanual/11pscaurcurrent.pdf
AUR Toolkit from this site: https://www.cdc.gov/nhsn/cdaportal/toolkits.html
AU Option FAQs: https://www.cdc.gov/nhsn/faqs/faq-au.html
65