Embed Size (px)
Citation preview

Università degli Studi di Trieste
Graduate School in MOLECULAR BIOMEDICINE
PhD Thesis
Activation of stem cells compartment during
hepatocarcinogenesis in a HBV-transgenic
mouse model
Beatrice Anfuso
XXVI ciclo – Anno Accademico 2012-2013


Supervisor:
Prof. Claudio Tiribelli
University of Trieste, Italy
Fondazione Italiana Fegato, Trieste - Italy
Tutor:
Dr. Caecilia H.C. Sukowati
University of Trieste, Italy
Fondazione Italiana Fegato, Trieste - Italy
External Advisor:
Dr. Daniela Cesselli
University of Udine, Italy
Opponents:
Prof. Fabio Farinati
University of Padua, Italy
Dr. Francesco Paolo Russo
University of Padua, Italy

Thesis Committee:
Prof. Carlo Pucillo
University of Udine, Italy
Dr. Roberta Benetti
University of Udine, Italy
Prof. Karl Loher
University of Graz, Austria

i
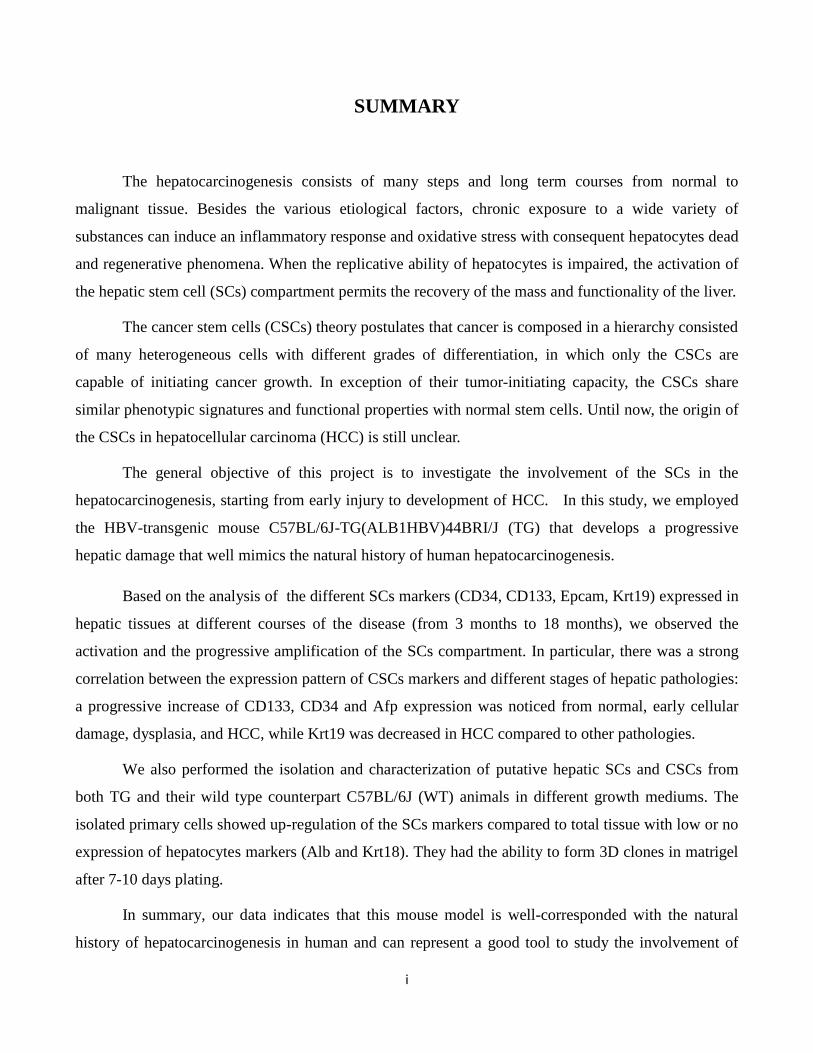
SUMMARY
The hepatocarcinogenesis consists of many steps and long term courses from normal to
malignant tissue. Besides the various etiological factors, chronic exposure to a wide variety of
substances can induce an inflammatory response and oxidative stress with consequent hepatocytes dead
and regenerative phenomena. When the replicative ability of hepatocytes is impaired, the activation of
the hepatic stem cell (SCs) compartment permits the recovery of the mass and functionality of the liver.
The cancer stem cells (CSCs) theory postulates that cancer is composed in a hierarchy consisted
of many heterogeneous cells with different grades of differentiation, in which only the CSCs are
capable of initiating cancer growth. In exception of their tumor-initiating capacity, the CSCs share
similar phenotypic signatures and functional properties with normal stem cells. Until now, the origin of
the CSCs in hepatocellular carcinoma (HCC) is still unclear.
The general objective of this project is to investigate the involvement of the SCs in the
hepatocarcinogenesis, starting from early injury to development of HCC. In this study, we employed
the HBV-transgenic mouse C57BL/6J-TG(ALB1HBV)44BRI/J (TG) that develops a progressive
hepatic damage that well mimics the natural history of human hepatocarcinogenesis.
Based on the analysis of the different SCs markers (CD34, CD133, Epcam, Krt19) expressed in
hepatic tissues at different courses of the disease (from 3 months to 18 months), we observed the
activation and the progressive amplification of the SCs compartment. In particular, there was a strong
correlation between the expression pattern of CSCs markers and different stages of hepatic pathologies:
a progressive increase of CD133, CD34 and Afp expression was noticed from normal, early cellular
damage, dysplasia, and HCC, while Krt19 was decreased in HCC compared to other pathologies.
We also performed the isolation and characterization of putative hepatic SCs and CSCs from
both TG and their wild type counterpart C57BL/6J (WT) animals in different growth mediums. The
isolated primary cells showed up-regulation of the SCs markers compared to total tissue with low or no
expression of hepatocytes markers (Alb and Krt18). They had the ability to form 3D clones in matrigel
after 7-10 days plating.
In summary, our data indicates that this mouse model is well-corresponded with the natural
history of hepatocarcinogenesis in human and can represent a good tool to study the involvement of

ii
SCs and CSCs in the progression of the disease. In addition, the possibility to isolate SCs and CSCs
will be a potent tool to study the differences of developmental and oncogenic molecular pathways
between normal SCs and CSCs and to develop novel CSCs-targeted therapy.

iii
RIASSUNTO
L’epatocarcinogenesi è un processo lungo caratterizzato da varie fasi che portano dal tessuto
sano a quello tumorale. Indipendentemente dai vari fattori eziologici, l’esposizione cronica a un ampio
spettro di sostanze può indurre una risposta infiammatoria e la comparsa di stress ossidativo che
insieme portano a fenomeni di morte cellulare e rigenerazione. Quando le capacità replicative degli
epatociti sono compromesse, l’attivazione del compartimento staminale epatico (SCs) permette il
recupero della massa e delle funzionalità epatiche.
La teoria delle cellule tumorali staminali (CSCs) ipotizza che il tumore sia composto da cellule
eterogenee con diversi gradi di differenziamento organizzate in maniera gerarchica, tra cui solo le
CSCs sono in grado di sostenere la crescita tumorale. Oltre la capacità di iniziare il tumore, le CSCs
condividono un fenotipo e una marcatura molecolare simile a quella delle cellule staminali normali
(SCs). Ad oggi, l’origine delle CSCs nell’epatocarcinoma (HCC) è ancora poco chiara.
Lo scopo generale di questo progetto è lo studio del coinvolgimento delle SCs nel processo di
trasformazione neoplastica, dall’iniziale danno epatico allo sviluppo dell’HCC. In questo studio
abbiamo utilizzato il topo transgenico per HBV C57BL/6J-TG(ALB1HBV)44BRI/J (TG) che sviluppa
un danno epatico progressivo che ripercorre la storia naturale dell’epatocarcinogenesi nell’uomo.
In base all’analisi di vari marcatori per le SCs (CD34, CD133, Epcam, Krt19) nel tessuto
epatico a vari stadi della patologia (da 3 a 18 mesi), abbiamo osservato l’attivazione del compartimento
epatico staminale e una sua progressiva amplificazione durante la progressione del danno. In
particolare, abbiamo osservato una forte correlazione tra il pattern di espressione dei marcatori delle
SCs e lo stadio della patologia: l’esperssione di CD133, CD34 e Afp è progressivamente aumentata
nella progressione da tessuto normale a danno cellulare epatico lieve, displasia e HCC, mentre
l’espressione di Krt19 ha dimostrato una riduzione nell’espressione nel HCC rispetto le altre patologie.
Abbiamo anche isolato e caratterizzato delle SCs e CSCs putative sia da animali TG che da
animali wild type C57BL/6J (WT) cresciute in diversi terreni. Le cellule primarie isolate hanno
mostrato una maggiore espressione dei marcatori staminali rispetto al tessuto totale di origine e nessuna
o bassa espressione di marcatori per gli epatociti (Alb e Krt18). Inoltre queste cellule hanno dimostrato
la capacità di formare cloni tridimensionali in Matrigel dopo 7-10 giorni di coltura.

iv
Per concludere, questi dati indicano che il modello murino utilizzato ben rappresenta la storia
naturale dell’epatocarcinogenesi umana e può rappresentare un buon strumento per lo studio del ruolo
delle SCs e delle CSCs nella progressione della malattia. Inoltre, la possibilità di isolare SCs e CSCs
rappresenta un potente strumento per lo studio delle differenze tra le vie molecolari coinvolte nello
sviluppo e nella trasformazione oncogenica tra SCs e CSCs e per lo sviluppo di nuove strategie
terapeutiche specifche per le CSCs.
v
LIST OF PUBLICATION
Full article:
Sukowati CHC, Anfuso B, Torre G, Francalanci P, Crocè LS, et al. The expression of CD90/Thy-1 in
hepatocellular carcinoma: an in vivo and in vitro study. PLoS ONE 2013; 8(10): e76830. doi:
10.1371/journal.pone.0076830
Sukowati CHC, Rosso N, Pascut D, Anfuso B, Torre G, Francalanci P, Crocè LS, Tiribelli C. Gene and
functional up-regulation of the BCRP/ABCG2 transporter in hepatocellular carcinoma. BMC
Gastroenterol. 2012; 12: 160. doi: 10.1186/1471-230X-12-160
Anfuso B, Tiribelli C, Sukowati CHC. Recent insights on hepatic cancer stem cells. Hepatol Int.
Supplement ALPD. 2013. doi: 10.1007/s12072-013-9498-0
Sukowati CHC, Anfuso B, Crocè LS, Tiribelli C. Mutual talk between the multipotent stem-like cells
and the cancer cells during hepatocarcinogenesis. (submitted).
Abstract:
Sukowati CHC, Anfuso B, Ie SI, Crocè LS, Tiribelli C. Cross talk between the multipotent stem-like
cells and the cancer cells during hepatocarcinogenesis. J Hepatol. 2014.
Anfuso B, El Khobar KE, Sukowati CHC, Tiribelli C. Cancer stem cell markers analysis in a HBV-
transgenic HCC mouse model. Hepatol Int 2013 Jun; 7 supplement1: s580.
Anfuso B, El Khobar KE, Sukowati CHC, Tiribelli C. Stem cells compartment activation during
hepatocarcinogenesis in a HBV-transgenic mouse model. J Hepatol 2013 Apr; 58 supplement 1: s423-
s424.
Sukowati CHC, Anfuso B, Crocè LS, Tiribelli C. The plasticity of the stem cells in the
hepatocarcinogenesis and metastasis: study in vitro and in vivo. Hepatology 2012 Oct; 56 (suppl4):
804a-805a.
Sukowati CHC, Anfuso B, Crocé SL, Tiribelli C. Stem cells in the development of hepatocellular
carcinoma: identification and expression. Hepatology 2011 Oct; 54 (suppl4): 963a.
vi
Congress oral and poster presentation:
Anfuso B, El Khobar KE, Sukowati CHC, Tiribelli C. Cancer stem cell markers analysis in a HBV-
transgenic HCC mouse model. The Liver Week of the Asian Pacific Association for The Study of the
Liver (APASL). Singapore, 2013 (poster).
Anfuso B, El Khobar KE, Sukowati CHC, Tiribelli C. Stem cells compartment activation during
hepatocarcinogenesis in a HBV-transgenic mouse model. The International Liver Congress of the
European Association for the Study of the Liver (EASL). Amsterdam, Netherland. 2013 (oral e-poster
and poster).
Sukowati CHC, Anfuso B, Crocè L, Tiribelli C. The plasticity of the stem cells in the
hepatocarcinogenesis and metastasis: in vitro and in vivo studies. The Liver Meeting of the American
Association for the Study of Liver Diseases (AASLD). Boston, USA. 2012 (poster).
Anfuso B, Sukowati CHC, Tiribelli C. Stem cell markers during hepatocarcinogenesis in a HBV-
transgenic mouse model. International HCC conference. Heidelberg, Germany. 2012 (oral and poster).
Sukowati CHC, Anfuso B, Crocè L, Tiribelli C. Stem cells in the development of hepatocellular
carcinoma: identification and expression. The Liver Meeting of the American Association for the Study
of Liver Diseases (AASLD). San Francisco, USA. 2011 (poster).
Anfuso B, Sukowati CHC, Crocè LS, Tiribelli C.The significance of the CD90/Thy-1 expression in
human primary liver cancer. 2011 IRCC conference"molecular clinical oncology”. Turin, Italy. 2011
(poster).
Sukowati CHC, Anfuso B, Crocè LS and Tiribelli C. The role of stem cells in human primary liver
cancers: identification and expression. SIBBM 2011 Frontiers in Molecular Biology. Trieste, Italy.
2011 (poster).
Sukowati CHC, Anfuso B, Crocè LS, Tiribelli C. The identification of cancer stem cells from primary
human liver cancers. Keystone Symposia 'Stem cells, cancer, and metastasis'. Keystone, Colorado,
USA. 2011 (poster).

vii

viii
CONTENTS:
Page
Summary i
Riassunto iii
Publications v
Contents viii
List of figures xi
List of tables xiii
Abbreviation xiv
Chapter I. Introduction 1
1.1 Primary liver cancer 2
1.1.1 Epidemiology and primary liver cancer classification 2
1.1.2 HCC prevention, staging and treatment 9
1.2 Hepatocarcinogenesis 12
1.2.1 Cellular and molecular mechanism of hepatocarcinogenesis 12
1.2.2 Ductural reaction 14
1.2.3 Precancerous lesion 18
1.3 Cancer stem cells 21
1.3.1 Cancer initiation theories 21
1.3.2 Cancer stem cell in HCC 24
1.4 Experimental mouse model for cancer research 28
1.4.1 Chemically-induced HCC models 28
ix
1.4.2 Xenograft and xenotransplantations models 30
1.4.3 Genetically modified mouse models 31
1.4.4 C57BL/6J-TG(ALB1HBV)44BRI/J transgenic mouse 32
Chapter II: Aim of the study 34
Chapter III: Materials and methods 37
3.1 Materials 38
3.2 Methods 40
Chapter IV: Results 1. Hepatocarcinogenesis in the transgenic mouse model 49
4.1 Gross appearance of the liver 50
4.2 Liver histology 52
4.3 Presence of HBV envelope protein (HBsAg) in TG mice 55
4.4 Body weight 56
4.5 Serum transaminase 57
Chapter V: Results 2. Analysis of the expression of stem cells markers in TG mouse
liver tissue 59
5.1 CD133 expression 61
5.2 CD34 expression 63
5.3 Krt19 expression 65
5.4 Afp expression 67
5.5 CD90 expression 68
5.6 Epcam expression 70
5.7 Sca1 expression 71
5.8 Sox9 expression 73
5.9 Differential expression between tumoral and non-tumoral tissues 74
5.10 Association between CSCs markers and liver pathology 76

x
5.11 Immunohistochemistry analysis 78
Chapter VI: Results 3. Isolation of and characterization of hepatic progenitor cells 81
6.1 Hepatic primary cell culture from neonatal mice P2 82
6.2 Hepatic primary cell culture from adult WT and TG mice 87
Chapter VII: Results 4. Development of a new method of alphafetoprotein detection
in mouse serum with AlphalISA® technology 94
7.1 The AlphaLISA® methodology 95
7.2 Selection and optimization of antibodies pair and assay buffer 96
7.3 Construction of a standard curve and sensitivity of the assay 98
7.4 Correction of serum matrix interference 99
7.5 Quantification of samples 101
Chapter VIII: General discussion
8.1. Hepatic damage in TG mouse 105
8.2. Expression of stem cells markers in TG liver 106
8.3. Stem cells isolation from hepatic liver tissue 108
Chapter IX: Conclusion 112
Acknowledgments 114
Reference List 115
xi
List of Figures
Chapter 1 Page
1.1 World incidence and mortality distribution of PLCs 4
1.2 Hepatocarcinogenesis 13
1.3 Hepatic stem/progenitor cells (HPCs) 17
1.4 Schematic illustration of preneoplastic lesion and their location in the multistep process
of hepatocarcinogenesis 20
1.5 Sources of heterogeneity within cancer 23
Chapter 4
4.1 Gross appearance of the livers 51
4.2 Hematoxylin & Eosin (H&E) and Gomori staining on WT liver 53
4.3 Hematoxylin & Eosin (H&E) and Gomori staining on TG liver. 54
4.4 HBsAg staining on TG and WT liver 55
4.5 Body weight of WT and TG animals 56
4.6 Serum ALT and AST quantification of WT and TG 57
Chapter 5
5.1 Expression of CD133 mRNA in liver tissue of WT and TG mice 61
5.2 CD133 protein expression in total liver tissue 62
5.3 Expression of CD34 mRNA in liver tissue of WT and TG mice 64
5.4 CD34 protein expression in total liver tissue 64
5.5 Expression of Krt-19 mRNA in liver tissue of WT and TG mice 66
5.6 Expression of Afp mRNA in liver tissue of WT and TG mice 67
5.7 Expression of CD90 mRNA in liver tissue of WT and TG mice 68
5.8 CD90 protein expression in total liver tissue 69
xii
5.9 Expression of Epcam mRNA in liver tissue of WT and TG 70
5.10 Expression of Sca1 mRNA in liver tissue of WT and TG mice 71
5.11 Expression of Sox9 mRNA in liver tissue of WT and TG mice 73
5.12 The mRNA expression ratio between tumoral and non tumoral tissues 75
5.13 Expression of SCs/CSCs markers mRNA in TG liver tissue in different hepatic diseases 76
5.14 Expression of SCs/CSCs markers mRNA in TG liver tissue in different hepatic diseases 77
5.15 Immunostaining of CD34 protein in liver tissue of WT and TG mice 78
5.16 Immunostaining of CD34 protein in liver tissue of TG mice 79
5.17 Immunostaining of CD133 protein in liver tissue of TG mice 80
Chapter 6
6.1 Primary cells culture in medium 1 83
6.2 Primary cells culture in medium 2 and 3 84
6.3 mRNA expression of HPCs, hepatocytes,a nd cholangiogytes markers in different culture
medium 86
6.4 Primary cells culture in Medium 4 88
6.5 mRNA expression of primary cells culture in Medium 4 89
6.6 Immunostaining of CSC markers in hepatic primary cells in Medium 4 90
6.7 3D clonogenic potential of hepatic primary cells in Medium 4 90
6.8 mRNA expression of hepatic primary cells during subcultures in Medium 4 91
6.9 mRNA expression of hepatic primary cells cultures of WT and TG mice in Medium 5 92
6.10 The ratio of mRNA expression of Medium 5 conpared to medium 4 93
Chapter 7
7.1 Schematic overview of the AlphaLISA® assay principles 96
7.2 Dot blot and Western blot of the anti-AFP antibody and the biotinylated anti-AFP
Antibody 97
7.3 Antibodies cross titration 97
7.4 The hook effect 98
7.5 AFP standard curve 99
7.6 Spike-in and linearity experiments using an adult WT mouse serum 100

xiii
List of Tables
Page
Chapter 1
1.1. Primary liver cancer classification 4
1.2. HCC risk factors 5
1.3. CSCs markers in HCC cell lines and human primary HCC tissue 27
Chapter 3
3.1 List of antibody 47
3.2 List of primer 48
Chapter 7
7.1. Final setting for mouse AFP detection with AlphaLISA® 101
7.2. AFP quantification in mouse serum with AlphaLISA® assay 102

xiv
Abbreviations
AASLD America Association for the Study of Liver Diseases
AFB Aflatoxin B
AFP Alpha Fetoprotein
ALT Alanin aminotransferase
ANAFLD Non-alcoholic fatty liver disease
ASR Age standardized rate
AST Aspartate aminotransferase
BCLC Barcellona Clinic Liver Cancer
BDA Bile duct adenoma
CAF Cancer associated fibroblast
CC Cholangiocarcinoma
CCl4 Carbon Tetrachloride
CDD Coline deficient diet
CLIP Cancer of the Liver Italian Program
CoH Canal of Hering
CSC Cancer stem cell
DEN N-nitrosodiethhylamine
DN Dysplastic nodule
EASL European Accociation for the Study of the Liver
EGF epidermal growth factor
FAH Fumarylacetoacetate hydrolase
FNH Focal nodular hyperplasia
GMM Genetically modified mouse
H&E Hematoxylin and eosin
HA Hepatiocellular adenoma
HB hepatoblastoma
HBsAg Hepatitis B Surface Antigen
HBV Hepatitis B virus
HCC Hepatocellular carcinoma
HCV Heptitis C virus
HEH Hepatic epithelioid hemangioendothelioma
HPC Hepatic stem/progenitor cell
HSC Hematopoietic stem cell
IU International Unit
JIS Japanese Integrated Staging

xv
LCC Large cell change
LDL Lower detection limit
MSC Mesenchymal stem cell
NASH Non-alcoholic steatohepatitis
NOD Non-obese diabetic
OS Oxidative stress
PDGF Platelet derived growth factor
PLC Primary liver cancer
PP Peroxisome proliferator
PTEN Phosphatase and tensin homolog
Rb Retinoblastoma
RNS Reactive nitrogen species
ROS Reactive oxygen species
RT Reverse transcription
SC Stem cell
SCC Small cell change
SCID Severe combined immunodeficiency
SP Side population
TAA Thiacetamide
TACE Transcatheter arterial chemoembolization
TG C57BL/6J-TG(ALB1HBV)44BRI/J
TGF-α Transforming growth factor α
TNM Tumor node metastasis
WT Wilde Type C57BL/6J

xvi

xvii

1
Chapter 1
Introduction
2
1.1 Primary liver cancer
1.1.1 Epidemiology and classification of primary liver cancer
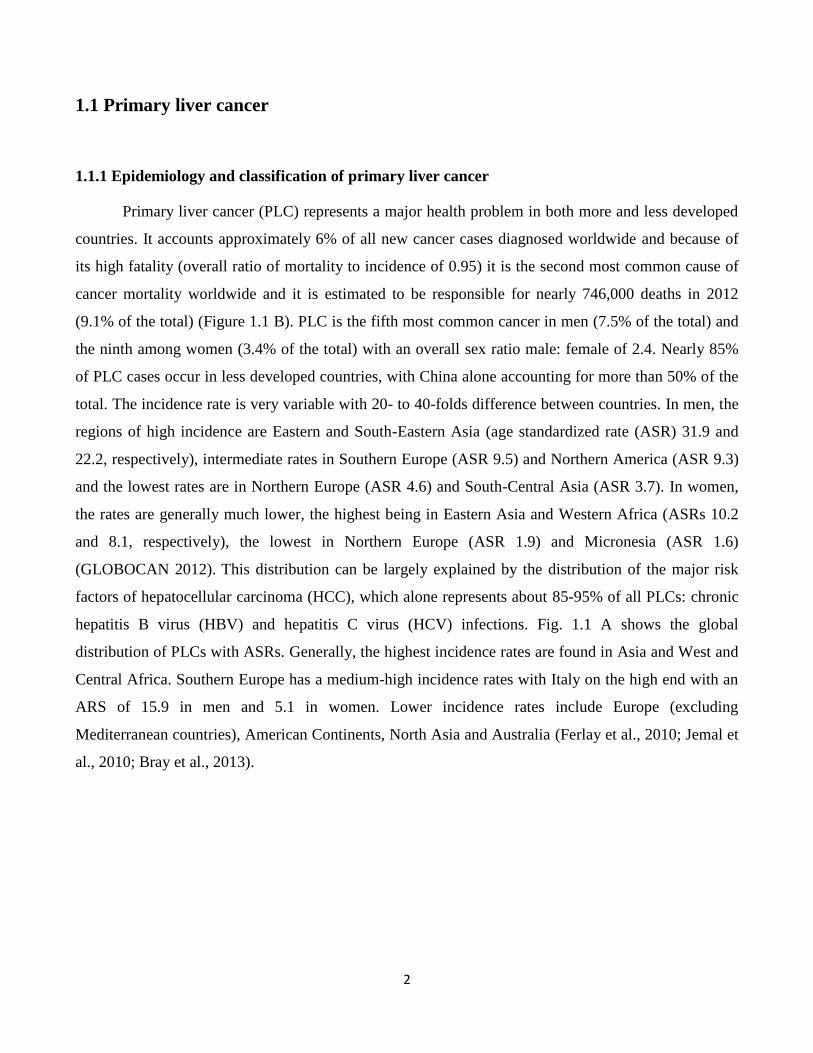
Primary liver cancer (PLC) represents a major health problem in both more and less developed
countries. It accounts approximately 6% of all new cancer cases diagnosed worldwide and because of
its high fatality (overall ratio of mortality to incidence of 0.95) it is the second most common cause of
cancer mortality worldwide and it is estimated to be responsible for nearly 746,000 deaths in 2012
(9.1% of the total) (Figure 1.1 B). PLC is the fifth most common cancer in men (7.5% of the total) and
the ninth among women (3.4% of the total) with an overall sex ratio male: female of 2.4. Nearly 85%
of PLC cases occur in less developed countries, with China alone accounting for more than 50% of the
total. The incidence rate is very variable with 20- to 40-folds difference between countries. In men, the
regions of high incidence are Eastern and South-Eastern Asia (age standardized rate (ASR) 31.9 and
22.2, respectively), intermediate rates in Southern Europe (ASR 9.5) and Northern America (ASR 9.3)
and the lowest rates are in Northern Europe (ASR 4.6) and South-Central Asia (ASR 3.7). In women,
the rates are generally much lower, the highest being in Eastern Asia and Western Africa (ASRs 10.2
and 8.1, respectively), the lowest in Northern Europe (ASR 1.9) and Micronesia (ASR 1.6)
(GLOBOCAN 2012). This distribution can be largely explained by the distribution of the major risk
factors of hepatocellular carcinoma (HCC), which alone represents about 85-95% of all PLCs: chronic
hepatitis B virus (HBV) and hepatitis C virus (HCV) infections. Fig. 1.1 A shows the global
distribution of PLCs with ASRs. Generally, the highest incidence rates are found in Asia and West and
Central Africa. Southern Europe has a medium-high incidence rates with Italy on the high end with an
ARS of 15.9 in men and 5.1 in women. Lower incidence rates include Europe (excluding
Mediterranean countries), American Continents, North Asia and Australia (Ferlay et al., 2010; Jemal et
al., 2010; Bray et al., 2013).

3
Figure 1.1. World incidence and mortality distribution of PLCs. A. Incidence is reported as age-standardized
rates in both sexes. B. Incidence and mortality distribution sorted by sex. Source: GLOBOCAN 2012.

4
PLCs may be classified based on the cellular origin of the primary tumor as listed in Table 1.1.
HCC, hepatoblastoma (HB), adenoma and focal nodular hyperplasia (benign tumors) may derive from
the liver parenchyma. Cholangiocarcinoma (the second most common PLC) and cholangioadenoma
arise from the epithelial cells of the biliary tract. Moreover, the liver is richly sprinkled of blood vessel
that can generate benign hemangiomas or different types of malignant tumor (i.e. epithelioid
hemangioendothelioma and hemangiosarcoma) (Ahmed and Lobo, 2009; Ercolani et al., 2010).
Table 1.1. Primary liver cancer classification
Cells of origin Primary liver cancer frequency Refrence
Liver parenchyma Hepatocellular carcinoma 85-90% of all PLCs El Serag et al., 2007
Hepatoblastoma
0.5-2% of all pediatric tumor
7% of all PLCs
Spector et al.,2012;
Kaatsch et al., 2010
Ahmed and Lobo, 2009
Hepatocellular adenoma Rare, 1 case per 100,000 women Zucman-Rossi et al.,2004
Focal nodular hyperplasia 0.31% Nahm et al., 2011
Biliary cells Cholangiocarcinoma 6% of all PLCs Shin et al., 2010
Bile duct adenoma 1.3% of all PLCs Kim et al., 2010
Endothelial blood vessel cells Angiosarcoma >2% of all PLCs
5% of all angiosarcoma
Bruegel et al., 2013
Zheng et al., 2013
Epithelioid Hemangioendothelioma rare Ercolani et al., 2010
Hemangioma 7% Ercolani et al., 2010
Hepatocellular carcinoma
HCC is the most common PLCs and accounts for 85-90% of all PLCs (El Serag and Rudolph,
2007). In around 80% of patients, HCC is preceded by cirrhosis or advanced fibrosis of the liver and it
is estimated that about one-third of cirrhotic patients will develop HCC during their lifespan
(Sangiovanni et al., 2004; Ioannou et al., 2007). The global age distribution of HCC vary by region but
in almost all areas, female rates peak in the age group 5 years older than the peak group of male. In
low-risk population, the highest age-specific rates occur among persons aged 75 and older, in contrast

5
the rate in high-risk African male population tend to peak between age 60-65 (El Serag and Rudolph,
2007). In almost all population, male have higher HCC incidence than female, with male:female ratio
averaging between 2:1 and 4:1 (Nordenstedt et al., 2010).
In children, HCC is a rare malignancy with an incidence of 0.5–1.0 cases per million. As in
adults, it is more frequent in boys, with a 2:1 ratio. Pediatric HCC has been related to preexisting liver
cirrhosis, most often because of biliary atresia, total parenteral nutrition, Fanconi’s syndrome, and
HBV (Emre et al., 2012).
Well known HCC risk factors are hepatitis viruses, which alone accounts for 75-80% of PLCs,
exposure to chemicals as aflatoxin B, alcohol, or vinyl chloride, obesity-related disease as non-
alcoholic fatty liver disease (NAFLD) and non-alcoholic steatohepatitis (NASH), and congenital
disorders such as hemochromatosis (Severi et al., 2010). Table 1.2 resumes the most common HCC
risk factors.
Table 1.2. HCC risk factors
From Severi et al., 2010
Major HCC risk factors
80% Cirrhosis or advanced fibrosis, mostly due to
- Hepatitis B virus
- Hepatitis C virus
- Alcohol
- NASH
- Congenital disorders such as hemocromatosis, Wilson’s disease, etc.
20% In the absence of cirrhosis or advanced fibrosis
- Hepatitis B virus
- Aflatoxin (mostly combined with HBV)
- Some genetic disorders such as Tyrosinosis
- Drug induced (i.e. anabolic steroid)

6
Overall, 75% to 80% of PLCs are attributed to persistent viral infection with either HBV (50-
55%) or HCV (25-30%) (Bosch et al., 2004) with an annual HCC incidence of 3-8% in HBV-related
cirrhotic patients and 1-7% in HCV-related cirrhotic patients (Kim and Han, 2012; Fattovich, 2003).
HBV infection generally dominates in high-risk areas, and HCV infection in low-risk areas, with the
exception of Japan were HCV infection is the major risk factor. The greater majority (between 70-90%)
of HBV-related HCCs develops in livers already affected by cirrhosis; however HBV may acts as
oncogenic factors also in the absence of cirrhosis (Nordenstedt et al., 2010). Another potential
contributor to the incidence of HCC in high-risk area is dietary exposure to aflatoxin. This potent
oncogene is produced by some Aspergillus species and is found in peanut, grain, legumes, corn and
fermented soy beans. Aflatoxin was found to be associated with a characteristic mutation in the p53
gene and to have a synergic effect in combination with HBV to induce HCC (Wu and Santella, 2012;
Yu et al., 1997).
In lower-risk area, HCV and alcohol intake are the major HCC risk factor. The mechanism by
which alcohol consumption increases the risk of HCC is primarily through the development of
cirrhosis, moreover some studies pointed out the correlation between genetic polymorphisms of the
enzymes participating in the metabolic pathway of ethanol and the increased risk of HCC in heavy
alcohol drinkers (Covolo et al., 2005; Munaka et al., 2003). Evidence for a synergistic effect of heavy
alcohol ingestion (> 60 g per day) for a prolonged period with HCV and HBV was also reported
(Donato et al., 2002; Lin et al., 2013).
Fatty liver disease is a heterogeneous condition characterized by fatty degenerative changes of
hepatocytes. NAFLD can be induced by visceral obesity, type 2 diabetes mellitus, hypertension and
hyperlipidemia. The histology of fatty liver disease extends from steatosis to NASH, the severest form
of NAFLD, and can evolve in fibrosis and cirrhosis (Severi et al., 2010; Siegel and Zhu, 2009).
Inflammation, angiogenetics changes and the generation of reactive oxygen species seem to play a
pivotal role in the progression of NAFLD and NASH in cirrhosis and HCC (Ascha et al., 2010;
Hashimoto et al., 2009).

7
Hepatoblastoma
HB is the most common hepatic tumor in children representing 78-80% of all the pediatric liver
cancer. Its incidence rate varies little among nations, ranging between 0.5 and 2% among children 0-14
years of age, even if the data suggests the incidence may be increasing 5% annually. The ratio boys to
girls ranges between 1.2 and 3.6 and its diagnosis is associated to one of the lowest median age (one
years and four months) (Emre et al., 2012; Kaatsch, 2010).
HBs derived from undifferentiated embryonic tissue carrying significant similarities to
pluripotent hepatoblast. Histologically, they can be composed by epithelial or mixed
epithelial/mesenchymal cells (Emre et al., 2012). HBs are usually not associated with any
environmental risk factor, and most causes are sporadic; however, it was recently associated to parental
smoking. Some familial disease as Beckwith-Wiedemann syndrome, familial adenomatous polyposis
and the trisomy 18 have been shown to increase the risk of HB occurrence by 1000-2000 times (Emre
et al., 2012; Spector and Birch, 2012).
Surgical resection provides the only chance of cure, but the addition of chemotherapy can
improve the survival in patients who have unresectable or metastatic disease, by reducing the tumor
size and permitting complete tumor resection or transplantation (Emre et al., 2012).
Hepatocellular adenoma and focal nodular hyperplasia
Hepatocellular adenoma (HA) is a rare benign liver tumor which usually occurs in young
woman taking oral contraceptives for more than two years. HBs result from a benign proliferation of
hepatocytes and usually appear as single and hyper-vascularized mass even if in some rare cases more
than 10 nodules were observed in patients. This condition is known as liver adenomatosis and its
development does not appear to be closely related to the use of oral contraceptive as it is diagnosed in
both sexes. Occasionally HAs can undergo to malignant transformation (Zucman-Rossi, 2004; Lin et
al., 2011).
Focal nodular hyperplasia (FNH) is the second most common benign tumor after liver
haemangioma with an incidence of about 0.3% in the population. It occurs mainly in women with a
reported female to male ratio between 8:1 and 12:1. The classic histopathological description of FNH is
that of a non-encapsulated nodule with a central fibrous body from which septa divide nodules of
hyperplastic hepatocytes sometimes forming plates of two cells thick. FNH is therefore considered the
8
result of a hyperplastic response to increased blood flow, and, accordingly, it usually does not bleed or
undergo malignant transformation, justifying therapeutic abstention (Nahm et al., 2011; Rebouissou et
al., 2008).
Cholangiocarcinoma and cholangioadenoma
Cholangiocarcinoma (CC) is a malignant tumor arising from the epithelial cells of the bile ducts
and is the second most common malignant neoplasia in the liver; it accounts for about 15% of all PLCs
but its incidence greatly varies among countries with the highest incidence in north-east Thailand (with
80-90 cases per 100,000 people), and the lowest in Australia (with 0.4 cases per 100,000 people) (Shin
et al., 2010; Zabron et al., 2013). Notably, the incidence of CC is increasing worldwide for unknown
reasons (Khan et al., 2012). The etiology of CC in Asian countries appears to be mostly linked to
infection and inflammation, especially due to liver flukes. In addition, infection with HBV and HCV
are significantly associated with the development of CC (Shin et al., 2010). On the contrary, in the
Western countries, 80% of CCs cases are sporadic and have no identifiable risk factor (Khan et al.,
2012). However its development might be associated to chronic biliary inflammation as primary
sclerosing cholangitis (Zabron et al., 2013).
CC can be classified as intrahepatic or extrahepatic, based on its location. Morphologically,
intrahepatic CCs are categorised into mass-forming, periductular-infiltrating or intraductal. Treatment
options for CC include surgery, limited pharmacological treatment and palliative biliary stenting but
only surgical resection represents a curative treatment for CCs (Friman, 2011)
Intrahepatic bile duct adenoma (BDA) is a rare benign epithelial liver tumor derived from bile
duct cells. It represents about 1.3% of all primary liver tumors and it is mainly found incidentally. BDA
is a well-circumscribed, not encapsulated mass ranging in size from 1 to 20 mm. Histologically, BDA
is characterized by a confluent proliferation of bile ductules in a connective tissue stroma which show
variable degrees of inflammation and fibrosis. BDA has been reported to show benign behaviour and
have limited growth potential (Kim et al., 2010).

9
Angiosarcoma, epithelioid hemangioendothelioma and haemangioma
Primary hepatic angiosarcoma is a very rare and aggressive malignancy of mesenchymal origin,
accounting for less than 2% of all primary liver neoplasms. This tumor most commonly affects men
and is well known for its association with exposure to several environmental carcinogens, such as
thorotrast, arsenic, and vinyl chloride. However, for most cases the etiology is still unknown (Bruegel
et al., 2013). Surgical resection alone or in combination with adjuvant therapies is the optimal treatment
choice while transcatheter arterial chemoembolization (TACE) represents the treatment for no-
resectable tumor (Zheng et al., 2013).
Primary hepatic epithelioid hemangioendothelioma (HEH) is a rare soft tissue vascular tumor
with an intermediate clinical course between benign hemangioma and malignant angiosarcoma. No
definitive etiology has been confirmed as a causative factor, even if several factors have been
correlated to HEH such as vinyl chloride, asbestos and thorotrast (Ercolani et al., 2010).
Hepatic hemangioma is the most frequent benign liver tumor with an estimated prevalence in
autopsy and imaging studies of up to 7% (Ercolani et al., 2010). The majority of the patients are
asymptomatic thus these lesions are usually detected incidentally. Most hemangiomas are usually small
and require no treatment or further follow-up. Only giant liver hemangiomas, defined by diameter
larger than 5 cm, may give rise to mechanical complaints requiring intervention (Erdogan et al., 2007).
1.1.2. HCC prevention, staging and treatment
As described above, chronic liver damage due to any agents might increase the risk of HCC,
thus a preventive strategy to block the transmission of hepatitis viruses in population, to reduce alcohol
consumption in daily life and to avoid exposure to toxic compound will be essential. Vaccination
against HBV represents the primary prevention of HCC. The universal Taiwanese HBV vaccine
program launched in 1984 had significantly decreased the HCC incidence 20 years after vaccination
(Chang et al., 2009). World Health Organization recommends HBV vaccination to all newborn since
prenatal or post-natal transmission is an important cause of chronic HBV infection (World Health
organization, 2009). In contrast, until now potent and effective HCV vaccine is not yet available, so the
only way to prevent HCV spread is a healthy life style, proper health care conditions and efficient
public health campaigns, as well as to prevent alcoholism (Bruix et al., 2004).

10
If primary prevention has not been successful, the health strategy should aim to eradicate the
acquired risk factor, to reduce its capacity to induce liver damage and cirrhosis and to improve early
detection of disease. For viral infections, a regiment therapy against HBV, using interferon, peg-
interferon, and nucle(t)side analogs is available. The treatment of HCV with interferon and ribavirin,
another nucleoside analog, is almost effective. However, beside the high cost and side effects of the
treatment, when cirrhosis is established, there is no proof that any interventions is effective in
preventing HCC (Chen et al., 2012a). Only surveillance can give the possibility to promptly diagnose
early appearance of HCC.
The possible therapeutic approach for HCC patients has to consider several different aspects:
the tumor stage (early or late/advanced HCC), the severity of underlying hepatic liver disease (residual
liver function) and the patients performance status (Bruix et al., 2004). Until now, several staging score
systems for HCC qualifications had been used: the Barcelona Clinic Liver Cancer (BCLC) (Llovet et
al., 1999), the Cancer of the Liver Italian Program (CLIP) (Gallo and the Cancer of the Liver Italian
Program (CLIP) investigators, 1998), the tumor, node, metastatis (TNM) (Lei et al., 2006), the Okuda
(Okuda et al., 1985), and the Japanese Integrated Staging (JIS) (Kudo et al., 2003). The BCLC staging
system, even with some limitations, is the most complete system linking the stage stratification with a
recommend treatment strategy and defining standard of care for each tumor stage. BCLC system is
currently endorsed by HCC management guideline of the European Association for the Study of the
Liver (EASL) (Bruix et al., 2001), the American Association for the Study of Liver Diseases (AASLD)
(Bruix and Sherman, 2011), and the Italian Association for the Study of the Liver (AISF) (Bolondi et
al., 2013).
Patients diagnosed at early stages can benefit from curative treatment such as surgical resection,
transplantation or percutaneous ablation. Even if only about 30% of the patients with HCC are eligible
for surgical resection, it represents the most efficacious treatment with an expected 5 year survival of
70% (Belghiti and Fuks, 2012). Liver transplantation is the best option for patients with decompensated
cirrhosis. Candidates for liver transplantation are patients with tumors that have favorable pathological
features and therefore a low likelihood of recurrence (Vivarelli et al., 2013). However, due to the
shortage of donors and the long waiting time between enlistment and transplantation, it can only be
offered to a limited number of patients. Third curative treatment option that may provide long-term
cure is percutaneous ablation, such as ethanol injection and radiofrequency. These procedures are

11
performed under image guide and are very effective for nodule <3 cm where complete response rates
account for 80% of cases (Lencioni and Crocetti, 2012).
Unfortunately, for advanced HCC patients, until now there is no effective curative therapy
available. TACE, the delivery of a chemotherapeutic agent into the arterial branches, is the most
common treatment for large, multifocal unresectable HCC. Antineoplastic drugs doxorubicin,
epirubicin and cis-platinum are the most used therapeutic agents in clinics (Lencioni, 2012; Takayasu
et al., 2006). Systemic therapy, such as tamoxifen, immunotherapy or anti-androgen have been
evaluated in many clinical trials, but no single agent or combinations-regiments therapy show
beneficial effect on survival rates (Rampone et al., 2009). Sorafenib, a multi-tyrosine kinase inhibitor,
is an FDA-approved drug that had demonstrated survival benefit in patients with advanced HCC
(Llovet et al., 2008; Abou-Alfa et al., 2006).
12
1.2. Hepatocarcinogenesis
1.2.1. Cellular and molecular mechanism
HCC development is a multi-step process where several mutations stimulate malignant
transformation, growth and metastatic behavior, during a long time course. Over the recent years, it has
become evident that not only tumor cells their self play a major role in HCC development, but it is also
influenced by the tumor microenvironment. This microenvironment complex is composed by cellular
and noncellular components, including immune cells, fibroblasts, myofibroblast, vascular cells as well
as various cytokines and extracellular matrix that are essential for survival, growth, proliferation and
metastatic capacity (Leonardi et al., 2012).
Chronic exposure to a wide variety of substances (alcohol metabolites, aflatoxin, drugs or other
toxic compounds) can induce an inflammatory response when hepatic metabolism fails to convert
drugs to non-reactive or non-immunological compounds. These toxic intermediates may directly
damage hepatocytes or trigger the activation of Kupffer cells (macrophages) and others cell. Moreover
viral proteins may also elicit host immune response (Severi et al., 2010; Hernandez-Gea et al., 2013),
resulting a severe immunological response.
A variety of cells play a role in the inflammatory reaction. Liver is composed by hepatocytes,
cholangiocytes and non parenchymal cells which play a pivotal role in the development of chronic liver
diseases. In particular resident immunological active resident cells as Kuppfer cells, liver dendritic
cells, T cells and natural killer are able to recruit non-resident immune cells and mount a strong
inflammatory response (Ramakrishna et al., 2013). Inflammatory intermediates induce the activation of
hepatic stellate cells and fibroblast that acquire a myofibroblastic phenotype and lead to liver fibrosis
through the excess deposition of extracellular matrix. Fibrosis then can develop into cirrhosis, one of
the most important risk factor for HCC development. Even if the molecular mechanism by which
cirrhosis promote cancer is not still well understood, it is hypothesized that the chronic liver cell
necrosis and regeneration, rends these cells to be more sensitive to mutagenic agents (Severi et al.,
2010).
During this process, the oxidative stress (OS) plays a central role in tissue damage. OS is due to
the imbalance between reactive oxygen (ROS) and nitrogen (RNS) species and the cellular mechanisms
that detoxify these reactive intermediates and repair the induced damage. The presence of ROS/RNS
producing cells creates a strong pro-oxidant environment where highly reactive radicals can insult the

13
stability of DNA, RNA, protein and lipids. Despite the DNA repair mechanisms, defect or reduction in
these processes increase susceptibility to cancer (Severi et al., 2010; Marra et al., 2011). Subsequently,
high level of ROS promotes invasiveness of hepatic tumor cells through matrix metalloproteinase
regulation (Chung et al., 2012). Fig. 1.2 summarizes the molecular mechanism implied in
hepatocarcinogenesis.
Figure 1.2. Hepatocarcinogenesis. Potential cellular and molecular mechanisms triggered by various risk factors to
induce hepatocarcinogenesis in the liver. From Aravalli et al., 2012.
During the course of extensive liver damage or when the regenerative capabilities of
hepatocytes are compromised, proliferation of a facultative stem cell compartment is observed. This

14
process, named as “ductural reaction” is the amplification and maturation of the hepatic
stem/progenitors cells (HPCs), located in the Canal of Hering (CoH), near the smallest branches of the
biliary tree. Several studies highlighted the presence of HPCs in chronic liver disease, cirrhotic
parenchyma as well in HCC tissues, both in human and animal model (Xiao et al., 2004; Ijzer et al.,
2010).
1.2.2. Hepatic stem/progenitor cells and ductural reaction
Liver is the largest internal organ in human body with a high regenerative potential. It is
characterized by its peculiar capability to regenerate and maintain constant volume, even after wide
hepatectomy, serious toxic, ischemic, or viral damages (Mao et al., 2014).The regenerative ability of
the liver was first demonstrated by Higgins and Anderson in 1931 in a murine model of partial
hepatectomy: after the removal up of 2/3 of the liver, it completely recovered the hepatic mass in about
one week (Higgins and Anderson, 1931). Even though normal liver tissue has a slow turnover, ranging
from 0.0012% to 0.01% mitotic cells to the total hepatocytes number, when an acute damage occurs,
the hepatocytes can quickly enter in the cell cycle and repair the damage (Christ and Pelz, 2013).
Subsequent serial transplantation experiments performed in fumarylacetoacetate hydrolase (FAH)-
deficient mice demonstrated that adult hepatocytes could replicate 70- 80 times or even more (Overturf
et al., 1997). Nevertheless, there is evidence that the replicative activity of hepatocytes diminishes in
advanced cirrhosis in humans and in chronic liver injury in mice, reaching a state of replicative
senescence as consequence of telomere shortening (Wiemann et al., 2002).
When severe and chronic damages prevent hepatocytes replication, the activation of an
alternative stem cells compartment will replenish the hepatocytes and cholangiocytes loss. In human,
this stem cells response is commonly known as “ductural reaction” and it corresponds to the
appearance and proliferation of oval cells in rodents. Oval cells have been most extensively studied in
rodents and similar cells have been found in various human liver diseases, such as in chronic viral
hepatitis, alcoholic liver disease and non-alcoholic fatty liver, and also implicated in tumorigenesis
(Katoonizadeh et al., 2006; Lowes et al., 1999; Fausto, 2004; Fausto and Campbell, 2003).
The HPCs reside in the CoH, the most proximal and smallest branch of the intrabiliary ductural
system. The CoHs connect the biliary canalicula that reside within the hepatocytes and the interlobular
ducts and represent the anatomic and physiological link between hepatocytes and the biliary tree

15
(Alison et al., 1996; Roskams et al., 2004). These cells are normally quiescent but after massive
damage they are able to produce progeny cord that spread across the liver lobule into the parenchyma.
The hepatic SCs are small in size (around 10 um), with a large nucleus-to-cytoplasm ratio, an
oval-shaped nucleus, and have the bipotential capacity to generate both hepatocytes and
cholangiocytes. They share marker expression with biliary and hepatic epithelial cells such as CK7,
CK8, CK18, CK19, with fetal hepatoblasts (AFP, c-glutamyltranspeptidase), and with hematopoietic
cells (Thy-1, c-kit, CD34, CD133) (Alison et al., 2004; Fausto, 2004; Koike and Taniguchi, 2012).
They also express neuroendocrine markers chromogranin-A, the neural cell adhesion molecule
(NCAM) (Zhou et al., 2007), EpCAM (Schmelzer and Reid, 2008; Okabe et al., 2009), and many
others and are recognized by the monoclonal antibodies OV6 (Roskams et al., 1998) and OV1 (Ruck
et al., 1997) in human and rat and by A6 in mouse (Petersen et al., 2003). Some evidences indicate a
possible contribution of bone marrow-derived cells as source for HPCs through trans-differentiation or
fusion of bone-marrow derived cells with hepatocytes (Petersen et al., 1999; Lee et al., 2009).
During activation, the HPCs extensively proliferate in the periportal area and then infiltitrate
into the parenchyma through the biliary canalicula reaching the damaged area. Afterward they
differentiate into either hepatocytes or cholangiocytes based on the multiple environmental signals. In
the hepatocytes regeneration, HPCs irradiate from the portal tracts, in which they are sheathed in
laminin, which facilitates their expansion. Upon exit from the laminin niche, these cells are subject to
differentiation cues from activated macrophage, such as Wnt and HGF signaling pathways, which
activate the pro-hepatocyte transcriptional cascade in HPCs. In biliary (cholangiocytes) regeneration,
HPCs emerge in a similar fashion, but they remain in the laminin extracellular matrix, in which
fibroblasts are able to influence their maturation though activation of the Notch signaling pathway. This
pathway influences the activation of the HNF6/HNF1β transcriptional network to correctly specify
cholangiocytes (Boulter et al., 2012). This mechanisms give rise to trans-amplifying cells with
different intermediate phenotype thus during liver regeneration different subpopulation of HPCs at
different level of differentiation can be recognized.
This ductural reaction in response to hepatic damage had been described in different hepatic
pathologies such as chronic viral hepatitis (Clouston et al., 2005), alcoholic and non alcoholic
steatohepatopatitis (Roskams et al., 2003; Richardson et al., 2007), cholangiopatitis (Crosby et al.,
1998), hereditary hepatic diseases (Wood et al., 2013) and others (Roskams, 2003) and correlated with
the severity of the disease. A positive correlation of the stem cells compartment activation with Model

16
for End-Stage Liver Disease (MELD) and fibrosis stage was reported in different studies
(Katoonizadeh et al., 2006; Lowes et al., 1999) (Fig. 1.3).
Moreover, many studies, using both global gene profiling and/or single marker study, had
demonstrated that HCC with stem cells features have poorer prognosis compared to that of hepatocytes
features. Gene array studies showed significant survival difference between HCC patients with a
hepatocytes-like phenotipes and hepatoblast-like phenotypes (Lee et al., 2006) and a recent meta-
analysis study correlate CD133 progenitor’s marker with poor survivor and disease-free survivor (Ma
et al., 2013). Other studies found a prognostic relevance of cytokeratin 7, 19, and 10 (Durnez et al.,
2006; Yang et al., 2008a), EpCAM and AFP (Yamashita et al., 2008) or multipotent genes (Yin et al.,
2013) expressions in patients with poor prognosis, early recurrence and aggressive tumor behavior.

17
Figure 1.3. Hepatic stem/progenitor cells (HPCs). HPCs are induced during hepatic damages when replicative
capacity of hepatocytes is impaired. Expanded HPCs can differentiate into hepatocytes or cholangiocytes based on the
external signals. From Tanaka et al., 2011.

18
1.2.3. Preneoplastic lesion
From histopatological point of view, HCC is always associated and preceded by the appearance
of different kinds of preneoplastic lesion. However, not all preneoplastic lesions are precursor of HCC.
Nevertheless basic studies on any alterations in preneoplastic course in the liver can give important
insights on early steps of hepatocarcinogenesis, development of novel therapies to slow down or arrest
HCC in cirrhotic patients, and it could be a useful marker to predict the patients outcome (Libbrecht et
al., 2005).
Preneoplastic lesions can be recognized morphologically to be dysplastic lesion (dysplastic foci
and dysplastic nodules) and small cancerous lesion (≤ 2 cm in diameter). The smallest preneoplastic
lesions, the dysplastic foci, are less than 1mm in diameter and can be observed in chronic liver disease,
particularly in cirrhosis. Based on the cell morphology, they can be classified in small cell changes
(SCC) or large cell changes (LCC). The SCCs are composed by cells with decreased cytoplasmic
volume, slight nuclear pleomorphism, increased nucleocytoplasmic ratio and higher proliferative
activity than the surrounding hepatocytes. Telomerase shortening, p21 checkpoint inactivation together
with chromosomal instability and a morphological resemblance to well-differentiated HCC, support the
precancerous nature of these lesions (Marchio et al., 2001; Plentz et al., 2007). Immunohistochemical
analysis indicated a possible progenitor origin of a part of these lesions (Libbrecht et al., 2000). The
LCCs are composed by atypical hepatocytes with large nuclei, normal nucleocytoplasmic ratio, nuclear
pleomorfism and frequent multinucleation. It is not clear whether these lesions are direct precursor of
HCC. A low proliferation activity, increased apoptosis and the absence of histological continuum with
HCC supports the idea that LCCs are reactive process related to chronic injury and senescence
(Marchio et al., 2001; Lee et al., 1997). On the contrary, abnormal DNA content, chromosomal
aberration and telomerase shortening demonstrate LCCs are precancerous lesion (Plentz et al., 2007). It
had been demonstrated that HBV-related LCCs are more consistent with dysplastic rather than merely
reactive hepatocytes, whereas cholestatic LCCs more likely represents reactive change with more
stringent cell cycle checkpoint control (Kim et al., 2009). All together this data indicate the existence of
heterogenic LCCs based on the hepatic setting in which they develop (Park and Roncalli, 2006).
Dysplastic nodules (DNs) are usually detected in cirrhotic liver but occasionally they can be
detected in setting of chronic liver disease without cirrhosis. DN is a nodular lesion that measure about
1 cm in diameter, bulges from the surrounding liver on a cut surface and differs from it in term of color
and texture. DNs can be classified as low-grade DNs or high-grade DNs depending on the degree of
19
atypia. Low-grade DNs show mild increase in cell density, a monotonous pattern and/or clonal
changes. Cytologic atypia is mild and no clear architectural atypia is observed. High-grade DNs always
show some degree of cytological and architectural atypia but insufficient for a diagnosis of HCC.
Increased cell density with irregular trabecular pattern is frequent combine to the presence of SCC foci
within the nodule (Roncalli et al., 2011). Clinical follow-up studies have revealed that a considerable
portion of high-grade DNs progress in HCC with a four-fold higher risk to develop HCC in patients
carrying high-grade DNs. In contrast, the risk of malignant transformation of low-grade DNs is much
lower than high-grade DNs (Borzio et al., 2003).
Small HCC is defined as carcinoma measuring less than 2.0 cm and is commonly divided in
early HCC and progressed HCC. The first are low-grade, early-stage tumors with a vaguely nodular
shape even if the nodular margin is not well distinct because of the lack of the capsule. Histologically,
early HCC consist of small neoplastic cells with increased nuclear to cytoplasmic ratio arranged in
irregular, thin trabeculae and pseudo-glandular structures. The cell density is more than 2 time higher
than the surrounding parenchyma and fatty change is reported in 40% of early HCC. Tumor cells often
invade the fibrous tissue of portal tract but it does not show vascular invasion and metastases. Early
HCC is considered to be a precursor of nodular HCC. Progressed HCC may develop from dysplastic
nodule or early HCC showing the appearance of the so-called nodule in nodule. They are characterized
by a destructive and pushing growth pattern with complete neoarterialization. Portal tracts are no
longer present and the borders of the lesion are rimmed by a condensed fibrosis showing up as a tumor
capsule. Histologically progressed HCCs are well to moderately differentiated and rarely steatotic (Di
Tommaso et al., 2013; Park, 2011). Fig. 1.4 shows types of preneoplastic lesions described in this
subchapetr and their location in the multistep process of hepatocarcinogenesis.

20
Figure 1.4. Schematic illustration of preneoplastic lesion and their location in the multistep process of
hepatocarcinogenesis. SCC: small cell changes, LCC: large cell changes, DN: dysplastic nodule, HCC: hepatocellular
carcinoma. From Di Tommaso et al. 2013
21
1.3. Cancer stem cells
1.3.1. Cancer initiation theories
It is widely accepted that most of tumors are composed by phenotypically and functionally
heterogeneous cells that harbor different properties. Since tumor is composed mostly by clonal cells,
this heterogeneity can arise in multiple ways. One of the classic and most well-established mechanisms
involved in the intrinsic differences among cancer cells are caused by stochastic genetic (Nowell, 1976)
and epigenetic changes (Baylin and Jones, 2011). Differences among cancer cells can also arise
through extrinsic mechanism in which different microenvironments within a tumor confer phenotypic
and functional differences upon cancer cells in different location (Polyak et al., 2009). Finally, some
cancers follow a stem cell (SCs) model in which tumoral cells are in a hierarchical organization where
cancer stem cells (CSCs) are at the top of the hierarchy (Hamburger and Salmon, 1977; Magee et al.,
2012).
The stochastic model in tumor initiation was first proposed by Nowell in 1976 and it postulates
the tumor develops as consequence of the progressive accumulation of genomic mutations and
epigenetic alteration occurring in a single cell (Nowell, 1976; Baylin and Jones, 2011). As the early
step is the expression of a “mutator” phenotype in genes responsible in the maintenance of genomic
stability. This first hit is manifested by increase mutation rate and the accumulation of random
mutations (Loeb, 2001) then the progressively altered cells can acquire mutation. Initially they are
associated to dysplastic phenotype and gradually transform into malignant phenotype thanks to the
advantageous properties acquired by new driver mutations in some cancer subpopulation. In particular
the alteration of subset of genes (tumor suppressor genes or oncogenes) triggers unregulated
proliferation and permits the acquisition of the “hallmarks of cancer” that are observed in most cancers
(Hanahan and Weinberg, 2011). This model, essentially based on the Darwinian model of evolution,
take also into account the selection pressure imposed by the tumor microenvironment on the selective
outgrowth of clone with a malignant phenotype (Nowell, 1976; Marjanovic et al., 2013).
The cancer stem cell model is based on the concept that tumor is composed by a hierarchy of
cells with different grade of differentiation. CSCs represent the top of the hierarchy and they are the
only population able to sustain the tumor as well as giving rise to proliferating but progressively
differentiated cells. The concept of CSCs was first proposed by Hamburger and Salmon in 1977
(Hamburger and Salmon, 1977) but only during recent decades their presence was confirmed. The first
22
conclusive evidence was demonstrated by the group of John Dick in mid 1990’s in acute myeloid
leukemia cells in which a single subpopulation is capable in initiating tumors in immunodeficient mice
(Lapidot et al., 1994; Bonnet and Dick, 1997). Afterward it was followed by the increase evidences on
for the existence of CSCs, not only in hematologic tumor, but also in solid tumor such as breast (Al-
Hajj et al., 2003), brain (Singh et al., 2004), lung (Kim et al., 2005), prostate (Collins et al., 2005), and
many others .
The central concept of the CSCs model is that a small subpopulation of cells within the tumor
drives the growth and progression of the tumor as whole, in regards to its ability to undergo symmetric
and asymmetric division. Asymmetric division generates fast dividing transit-amplifying cells that
differentiate in cells with limited potential to divide and more differentiated that produce the bulk of the
tumor (Reya et al., 2001). As most of conventional antineoplastic agents are effective on dividing cells,
CSCs might be resistant to therapy and it can be responsible of chemoresistance, tumor relapses, even
metastasis (Clarke et al., 2006; Rebucci and Michiels, 2013).
These theories mentioned above are not exclusive and are not independently separated one to
others. Even if a tumor follows the CSCs model, it is contemporary subjected to the clonal evolution as
well as heterogeneity from environmental differences within tumors. Thus, these sources of
heterogeneity are not mutually exclusive and may each apply to variable extents depending on the
cancer (Magee et al., 2012), as well summarized in Fig. 1.5

23
Figure 1.5. Sources of heterogeneity within cancer. A. Stochastic genetic and epigenetic changes confer heritable
phenotypic and functional differences upon cancer cells. B. Heterogeneity can arise in response to extrinsic environmental
differences within tumors: cancer cells (blue) adjacent to blood vessels (red) are different from cancer cells further from
blood vessels (white). C. Cancers that follow the stem cell model contain intrinsically different subpopulations of
tumorigenic (red) and nontumorigenic cells (yellow and green) organized in a hierarchy. D. Cancers that follow the stem
cell model are also subject to clonal evolution as well as heterogeneity from environmental differences within tumors.
Cartoon and caption from Magee et al. 2012

24
1.3.2. Cancer stem cell in HCC
As widely known, HCC is morphologically heterogeneous cancers with different grades of
differentiation phenotype. Based on the Edmonson-Steiner’s criteria introduced in 1958, HCC can be
classified into 4 subgroups: from a well differentiated HCC (Edmonson’s group 1-2) to poor or not
differentiated, (Edmonson’s groups 3-4) (Edmondsond and Steiner, 1954; Callea, 1988).
The presence of cells with stem cells (SCs) or progenitor cells phenotype in HCC was first
studied by imunohistochemistry on human HCC and dysplastic lesion (Van Eyken et al., 1988;
Libbrecht et al., 2000; Wu et al., 1996). This finding had been corroborated by many evidences in other
pathologies in human (chronic liver disease, cirrhosis), and supported by time-dependent observation
using chemical-induced hepatocarcinogenesis in rodents.
In accordance with the rapid progress in molecular and cellular techniques in biology, the
identification and the isolation of the CSCs, both from total tissues and established cell lines had been
improved, rendering further possibility to characterize these cells. The most common methods to
isolate the CSCs are the isolation of side population (SP), the cells sorting based of CSCs markers
positivity, and the 3-dimensional sphere culture.
The SP method is based on the capacity of a cell population to efflux the Hoechst 33342 dye
due to the activity of the ATP Binding Cassette transporters ABCG2 (BCRP) on their plasma
membrane. This method was first proposed by Goodell and colleagues in 1996 to isolate stem cells
from mouse bone marrow (Goodell et al., 1996). The isolated cells were highly enriched for long term
repopulating cells, expressed high level of stem-like genes and possessed multi-potent differentiation
potential. SP had been isolated from a variety of normal tissue (Challen and Little, 2006) and from
tumors, including leukemia (Wulf et al., 2001), ovarian (Szotek et al., 2006), brain (Fukaya et al.,
2010), lung (Ho et al., 2007), thyroid (Mitsutake et al., 2007), and many others.
In HCC, CSCs were first isolated from hepatoma cell lines using this SP method by two
separate groups. SP cells showed high self-renewal capacity, generating both SP and non-SP cells and
high proliferative potential, anti-apoptotic properties and chemoresistance to anticancer agents,
including doxorubicin, 5-fluorouracil, and gemcitabine. Immunocytochemistry examination showed
that SP fractions contained a large number of cells presenting characteristics of both hepatocyte and
cholangiocyte lineages. SP population also possessed tumorigenic properties when injected into non-
obese diabetic/severe combined immunodeficiency (NOD/SCID) xenograft mice. Microarray analysis

25
discriminated a differential gene expression profile between SP and non-SP cells, and several so-called
"stemness genes" were upregulated in SP cells in HCC cells (Haraguchi et al., 2006b; Haraguchi et al.,
2006a; Chiba et al., 2006).
The expression of ABCG2, as molecular determinant of SP phenotype, was subsequently
confirmed in a wide variety of hepatic cancer cell lines (Shi et al., 2008; Hu et al., 2008) and human
samples (Zen et al., 2007; Sukowati et al., 2012). However, a recent work of Nakayama reported the
isolation of a SP from a primary tumor that does not full fit with the accepted stem cell properties,
introducing the possibility that the concept of SP cells as a universal marker for CSC may not be apply
to all the HCCs (Nakayama et al., 2013).
The ability of SCs to form sphere in culture was first demonstrated by Reynolds and Weiss in
1992. They demonstrated that cells isolated from the striatum of adult mouse brain could be clonally
expanded by culturing spheres and that these cells could generate both astrocytes and neurons
(Reynolds and Weiss, 1992). Subsequently, this assay was used to isolate CSCs from brain tumor both
in children and adults (Singh et al., 2003; Singh et al., 2004). In HCC cell lines and tissue, CSCs sphere
with different markers had been isolated and characterized. These cells possessed the key criteria that
define CSCs: persistent self-renewal, extensive proliferation, drug resistance, over expression of liver
CSCs related proteins and were able to form tumors in NOD/SCID mice (Kamohara et al., 2008;
Uchida et al., 2010; Cao et al., 2011). Nowadays, the sphere forming assay is widely used as evidence
of stemness properties of putative CSCs isolated with other methods.
Cells surface markers have been used as the most common mean of identification and isolation
of the CSCs. Most of the markers utilized are based on the knowledge of tissue development and/or are
derived from hematopoietic or embryonic stem cells. The most commonly used surface markers in
CSCs identification in tumors are CD133 and CD44. CD133 (Prominin-1) is a transmembrame
glycoprotein with five trans-membrane domains and two large N-glycosilated extracellular loops.
Human surface antigen AC133, a homologue for mouse prominin-1, was discovered by generating a
monoclonal antibody to CD34+ hematopoietic stem cells isolated from fetal liver, bone marrow, and
cord blood(Yin et al., 1997). Even though the function of CD133 is not clear, it has been found to be a
marker for many of the CSCs identified to date, include those from gliomas, colon, lung, liver and
prostate (Grosse-Gehling et al., 2013).

26
CD44 is a glycoprotein that is the receptor for hyaluronan, a major component of the
extracellular matrix. CD44, a multistructural and multifunctional membrane molecule, detects changes
in extracellular matrix components, and thus is well positioned to provide appropriate responses to
changes in the microenvironment. The potential involvement of CD44 variants (CD44v), especially
CD44v4–v7 and CD44v6–v9 in tumor progression has been confirmed in many tumor types in
numerous clinical studies. CD44 also play an important role in invasion of a variety of tumor as breast,
pancreas and colon tumor (Misra et al., 2011). Other CSCs markers in current studies are more tissue-
specific , and derived from knowledge about the development of the target tissue.
In HCC, different markers have been efficiently used to isolate and characterize putative CSCs
both in established cell lines and primary tumors. However, not like in several other tumors, until now
there is no definite CSCs marker in HCC, and therefore the number of discovery of new CSCs markers
rapidly increase. The use of CD133 (Prominin-1) (Ma et al., 2007; Suetsugu et al., 2006; Yin et al.,
2007; Zhu et al., 2010), CD90 (THY-1) (Yang et al., 2008c; Yang et al., 2008b; Sukowati et al., 2013),
CD44 (Zhu et al., 2010; Yang et al., 2008b), CD326 (EpCAM) (Yamashita et al., 2009; Kimura et al.,
2010), CD24 (Lee et al., 2011) and CD13 (Haraguchi et al., 2010), allows to select specific
populations of cells with CSCs properties. Although single marker for CSCs isolation have been
reported, it may not be sufficient to fully define a specific CSCs subpopulation, leading to combination
of several accepted CSCs markers. CSCs subpopulation with CD133+CD44+ (Zhu et al., 2010),
CD133+ALDH+ (Ma et al., 2008a; Lingala et al., 2010), CD133+EpCAM+ (Chen et al., 2012b),
CD90+CD44+ (Yang et al., 2008b), CD90+CD133+ (Jia et al., 2013), and other combinations,
although sometime contradictory, were reported to have higher tumorigenicity capacities to the related
negative counterpart (Anfuso et al., 2013).
Moreover, it is important to notice that beside the heterogeneity of HCCs among different
patients, HCCs from a single patient can also harbor different tumorigenic cell types. They may express
varieties of morphological and phenotypical markers and different gene expression profiles, because of
high genetic instability in the clonal cancer cells. This aspect must be considered during isolation and
characterization of a single subpopulation of CSCs or when therapy against CSCs is developed. In 2011
Colombo and colleagues isolated three phenotipically distinct populations from a single HCC
specimen, that differently expressed a number of tumour-associated stem cell markers, including
EpCAM, CD49f, CD44, CD133, CD56, THY-1, ALDH and CK19. They also showed different
doubling times, drug resistance and tumorigenic potential (Colombo et al., 2011). Recently it had been
27
demonstrated that the CSCs markers EpCAM and CD90 are independently expressed in liver cancer. In
primary HCC, EpCAM+ cells had features of epithelial cells whereas CD90+ cells had those of
vascular endothelial cells. In vivo and in vitro studies indicated EpCAM + cells have high proliferative
capacity whereas CD90+ cells have high metastatic capacity and abundant expression of c-Kit and in
vitro chemosensitivity to imatinib mesylate. Furthermore, CD90+ cells enhanced the motility of
EpCAM+ cells when co-cultured in vitro through the activation of transforming growth factor beta
(TGF-β) signaling (Yamashita et al., 2013), indicating not only the presence of different CSCs
population in a single tumor but also the existence of complex interaction within them. Several
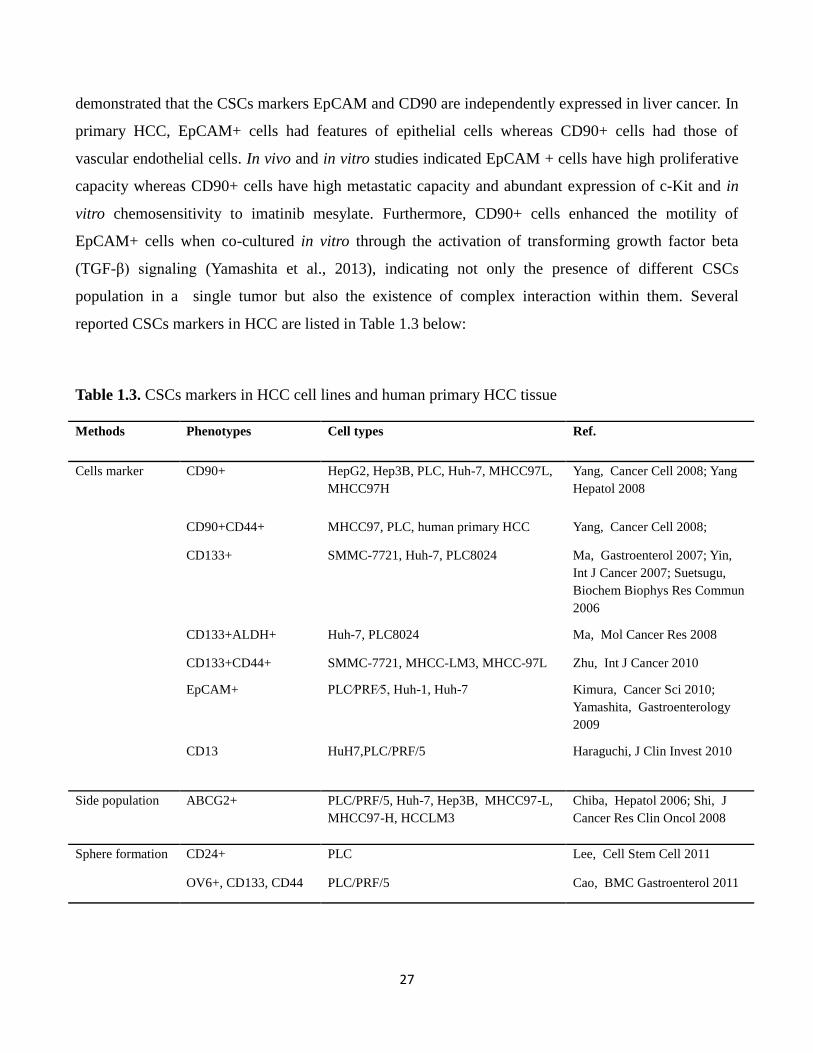
reported CSCs markers in HCC are listed in Table 1.3 below:
Table 1.3. CSCs markers in HCC cell lines and human primary HCC tissue
Methods Phenotypes Cell types Ref.
Cells marker CD90+ HepG2, Hep3B, PLC, Huh-7, MHCC97L,
MHCC97H
Yang, Cancer Cell 2008; Yang
Hepatol 2008
CD90+CD44+ MHCC97, PLC, human primary HCC Yang, Cancer Cell 2008;
CD133+ SMMC-7721, Huh-7, PLC8024 Ma, Gastroenterol 2007; Yin,
Int J Cancer 2007; Suetsugu,
Biochem Biophys Res Commun
2006
CD133+ALDH+ Huh-7, PLC8024 Ma, Mol Cancer Res 2008
CD133+CD44+ SMMC-7721, MHCC-LM3, MHCC-97L Zhu, Int J Cancer 2010
EpCAM+ PLC⁄PRF⁄5, Huh-1, Huh-7 Kimura, Cancer Sci 2010;
Yamashita, Gastroenterology
2009
CD13 HuH7,PLC/PRF/5 Haraguchi, J Clin Invest 2010
Side population ABCG2+ PLC/PRF/5, Huh-7, Hep3B, MHCC97-L,
MHCC97-H, HCCLM3
Chiba, Hepatol 2006; Shi, J
Cancer Res Clin Oncol 2008
Sphere formation CD24+ PLC Lee, Cell Stem Cell 2011
OV6+, CD133, CD44 PLC/PRF/5 Cao, BMC Gastroenterol 2011
28
1.4. Experimental mouse models for cancer research
In patients, progressive and follow-up observation on the molecular and cellular mechanisms
happen during hepatocarcinogenesis is very difficult to observe. Delayed observation of the tumor is
very common in most of cases and it is usually noticeable in later stages. Continuous examination and
biopsy are invasive and not preferable. Furthermore, because of the variability of risk factors and long
term development, with the addition of life style, the characteristic of liver cancer between individuals
are somehow unique. In order to better understand the process of liver cancer development, several
models have been used, such as in vitro and ex vivo using HCC cell lines and HCC specimens, and in
vivo such as clinical trials and animal experimental models.
Several animal models have been used to study the pathogenesis of HCC and have contributed
to the current knowledge of HCC. Because of the physiologic and genetic similarities to humans, their
short lifespan and high breeding capacity, rodents are a good model for cancer research. Although
many experiments focusing on liver physiology have been conducted in rats due to their propensity to
develop fibrosis, laboratory mouse (Mus musculus) is considered the best model system for cancer
because of the viability of gene targeting methods. Furthermore, their small size, breeding capacity,
lifespan up to three years, and the physiological and molecular similarities to human biology, is a
essential benefit for the study. Different techniques can be used to induce HCC in mice: chemical
induction, xenograft transplantation and genetic modification (Heindryckx et al., 2009; Newell et al.,
2008). In addition to rat and mouse as models, woodchuck and groundhog (Marmotta monax) are used
for studies of HBV-induced HCC.
1.4.1. Chemically-induced HCC models
Several chemical compounds have the ability to induce HCC in rodents when administrated in
sufficient high dose and period. Carcinogens can be divided in genotoxic compounds that directly
induced DNA damage and promoting compounds which enhance tumor formation after initiation by a
hepatotoxic compound (Heindryckx et al., 2009).
N-nitrosodiethylamine (Diethylnitrosamine, DEN) is one of the most common chemical
compounds used as carcinogenic reagent in rodents. Its carcinogenic activity is due to the capability to
alkylating DNA structure that results in the formation of tumor in gastrointestinal tract as well as in

29
skin, respiratory tract and hematopoietic system (Verna et al., 1996). The tumor formation mechanism
also involves the induction of oxidative stress (Kolaja and Klaunig, 1997). A two-stage model in which
DEN can be used as initiator and phenobarbital as promoting agent is also used to increase the toxic
effects (Chakraborty et al., 2007; Imaoka et al., 2004). Mice tumor induced by DEN harbor activating
mutations in the H-ras proto-oncogene that in human are observed mainly in HCC associated with poor
prognosis and metastasis (Stahl et al., 2005).
Carbon tetrachloride (CCl4) is a potent hepatotoxin. Its activity well recapitulates the cellular
mechanism observed in human hepatocarcinogenesis. CCl4 is metabolized by cytochrome P450 and the
free radicals produced induce lipid peroxidation and membrane damages. Afterward, the Kuppfer cells
induce an inflammatory response that results in the recruitment of inflammatory cells, induction of
fibrosis and eventually HCC (Avasarala et al., 2006; Sheweita et al., 2001).
Coline deficient diet (CDD) develops tumor in 50-52 weeks trough the induction of
steatohepatitis in mice. The proposed mechanism of carcinogenicity by CDD involves the depletion of
antioxidant mechanisms that induces the activation of the oval cells (Tarsetti et al., 1993). CDD can be
combined with hepatotoxic compound such as DEN or CCl4 to study steatohepatitis with further
development of HCC (de Lima et al., 2008).
The hepatotoxin aflatoxin B (AFB) is a well known human risk factor for HCC thus its
administration to mice could clarify the mechanism involved in AFB-induced hepatocarcinogenesis.
AFB is metabolized by the liver microsomal system to the exo-8,9-epoxide intermediate that bind to
guanine residue and mutate to thymine (Gallagher et al., 1994). Chromosomal aberration or strand
break, sister chromatide exchange, DNA-adducts and uncontrolled DNA synthesis results in HCC
development (Wang and Groopman, 1999).
Peroxisome proliferators (PPs) are drugs able to induce HCC after a latency period as a response
to a long-term repetitive exposure to these xenobiotics. Metyl clofenapate, ciprofibrate, fenofibrate and
clofibrate are some examples of PPs that induce HCC in rodens (Heindryckx et al., 2009). These
compound induce the activation of the peroxisome proliferators activated receptor α (PPARα), a
receptor involved in the regulation of several genes, including those involved in cell proliferation and
apoptosis as well as lipid homeostasis and ROS production. PPs induced tumors are well-defined HCCs
with trabecular histological pattern but it is still uncertain if these carcinogenic compounds for rodents
represent a hazard for human (Misra and Reddy, 2014).

30
Thiacetamide (TAA) is a hepatotoxin that can be administered either orally or by intraperitoneal
injection. It induce fibrosis resembling alcoholic liver fibrogenesis as it shares a number of metabolic
and histological alterations usually found in the livers of human (Salguero Palacios R. et al., 2008). The
hepatotoxic action is a result of oxidant properties of the compound, leading to hepatic oxidative stress
and liver damage (Heindryckx et al., 2009).
1.4.2. Xenograft and xenotransplantations models
In xenograft and xenotransplantation models, tumor cells or tissues from different species,
usually from human cell lines or patient’s specimens are introduced into immunedeficient mice.
Athymic nude or SCID mice are often used as host. For HCC studies, in the ectopic xenograft model,
cells are injected subcutaneously in the flank of mice while in the orthotopic xenograft model cells are
injected intrahepatically. The second technique is more suitable for extrapolation to humans and can
give information about the metastatic spread of the tumor (Heindryckx et al., 2009).
Usually, xenograft models require short time to develop tumor and allow further studies for in
vivo toxicity, absorption and pharmacokinetics of a trial compound in preclinical studies. In CSCs field,
the proof of a cells population as a CSCs has to be confirmed in xenograft model. It is the golden
standard to demonstrate that the CSCs posses the ability to recapitulate similar human HCC as in
observed on donor tissues, comprise tumor heterogeneity, and can be passed in serial transplantations.
Another important aspect to take into account when working with xenograft model is that normally
HCCs develop in an underlying hepatic disease where tumoral cells interact with the surrounding
environment. One of the interesting approachs is injection of tumor cells into a fibrotic setting
previously induced with TAA, CCl4 or oral alcohol intake. These models showed faster and greater
tumor growth and the ability to metastasize compared to the non fibrotic setting (Kornek et al., 2008).
Comparing the results obtained in xenograft models with various cell lines or samples with
different phenotype and aggressiveness could help to clarifying the difference observed in patients'
tumor outcome, development and responsiveness to chemotherapeutic agents. However, to notice to
notice that HCC cell lines and human samples are highly heterogeneous, it is important to test multiple
samples especially in drug screening. For example, Matsuo et al. demonstrated that EGRF-inhibitor
inhibits tumor growth and metastasis of about 50%, and on the contrary, the seven cell lines used by
Huynh did not show the same behavior. (Matsuo et al., 2003; Huynh et al., 2006)

31
1.4.3. Genetically modified mouse models
Genetically modified mouse (GMM) model are engineered to mimic the pathophysiological and
molecular features of human malignancies. They can be either transgenic or endogenous models and
enable the investigation of the effect of oncogene or tumor suppressor and pathway cooperativity and
dependency when mice harbor multiple mutations. These models have many advantages as the
histological similarity to human tumors, the tumor develop in a complex microenvironment in
immunocompetent mice and the metastasis show a distribution similar to those observed in human.
Among the disadvantages cost of production and screening of the models, the host genetic background
and the strong expression or suppression of the mutated genes are the major limits. Based on the
genetic modification carried by the GMM, they can be dividing in: viral model, model with altered
expression of oncogene or onco-suppressor and models with altered microenvironment.
Tissue-specific expression can be achieved by using specific promoter, for hepatic GMMs the
albumin promoter is often used (Heindryckx et al., 2009). Mice are resistant to infection by human
hepatitis B or C viruses, thus transgenic mice were initially developed to model the chronic carrier state
of HBV infection, where viral DNA sequences integrate in the host genome (Babinet et al., 1985;
Chisari et al., 1986). Since these first reports in 1985, multiple transgenic mice have been generated
carrying the full HBV genome or single HBV genes, e.g. encoding for surface envelope proteins
(HBsAg), X protein (HBx), core and pre-core proteins, either under the control of the HBV promoter or
liver-specific host promoters, such as albumin. Likewise, the HCV polyprotein, and the core protein
alone or in combination with envelope proteins have been expressed in transgenic mice (McGivern and
Lemon, 2011). These studies have enabled the investigation of general pathogenetic mechanisms of
liver injury and malignant transformation in vivo and the HBV or HCV transgenic models have
provided definitive proof that viral genes can initiate and promote liver carcinogenesis. Interestingly,
only the large HBV envelope and the HBx protein were found carcinogenic and the HCV core protein
is the major contributing factor to HCV-related hepatocarcinogenesis (Chisari et al., 1989; Lakhtakia et
al., 2003; Moriya et al., 1998).
Based on knowledge about the molecular alterations observed in human HCC and in in vitro
system different model carrying ectopic hepatic expression of oncogenes, cell cycle proteins, growth
factors and in general genes known play important roles in liver cancer were. GMMs mutated for Myc,
β-catenin, the transforming growth factor α (TGF-α) and the epidermal growth factor (EGF) or
knocked-out for tumor suppressor genes as the retinoblastoma (Rb) gene are widely studied (Newell et

32
al., 2008; Heindryckx et al., 2009).In the models with altered microenvironment, genetic alterations
mimic the sequence injury-fibrosis-HCC observed in human. The deletion of the alpha-1 antitrypsin
(AAT) and phosphatase and tensin homolog (PTEN) or the over expression of the transforming growth
factor-beta (TGF-β) or some members of the platelet derived growth factor (PDGF) family develop
hepatic disease as fibrosis, inflammation and steatosis followed by cirrhosis and HCC (Heindryckx et
al., 2009).
In accordance with findings of molecules involved in pathogenesis of HCC, the strains and
number of GMMs to study HCC had been rapidly increased in recent years. This variation allows
researchers to use the best model based on the research interest. Furthermore, by cross-breeding and
mutation selection, a specific molecule targeting in drug development can be assessed. Detailed
description of the many use of mouse models in HCC research was reviewed by Heindryckx et al.,
2009.
1.4.4. C57BL/6J-TG(ALB1HBV)44BRI/J transgenic mouse
The C57BL/6J-TG(ALB1HBV)44BRI/J transgenic mouse model was developed by Chisari et
al. in 1986 by microinjection of the HBV BglII A fragment cloned into the pAlb-PSX plasmid
immediately downstream of the mouse albumin promoter. The HBV BglII A fragment contains the
entire envelope coding region and lead to the formation of long filamentous of hepatitis B surface
antigen (HBsAg) particles (Chisari et al., 1986). The hepatic intracellular accumulation of HBsAg
increases progressively during the first 4 months of mouse life. The proteins accumulate within a
greatly expanded ribosome-poor endoplasmic reticulum compartment and fail to be efficiently
transported to the Golgi apparatus and subsequently secreted (Chisari et al., 1987).
The toxic accumulation of HBsAg into hepatocytes induces a severe and prolonged
hepatocellular injury that initiates a response within the liver characterized by inflammation,
regenerative hyperplasia, ground glass hepatocytes, transcriptional deregulation, aneuploidy, and
eventually HCC. First signs of liver injury begin early in the mouse: chronic hepatitis consisting of
hepatocellular necrosis, Kupffer cell hyperplasia and a nonimmunologic inflammatory response with
mononuclear cell infiltrate can be observed starting from two-three months of age and persist during
the entire lifespan of the mice. Preneoplastic lesions appear in the liver beginning with the seventh
month. These lesions consist at first of nodular areas of hepatocytes with clear cytoplasm without

33
compression of adjacent hapatocytes consistent with altered foci. Later nodular masses of hepatocytes
appeared with compression of adjacent hepatocytes consistent with nodular hyperplasia, or
regenerating nodules. Irregular areas of smaller basophilic hepatocytes and bile duct proliferation
resembling oval cell proliferation are also observed at this time. First neoplastic masses appear at nine-
twelve months of age together with an increase of AFP production. The tumors are usually highly
vascularized and firm in texture, with colour varying from pale yellow to dark brown. In most cases
multiple tumors of various sizes are present in the same liver, one or two large tumors (1.0-2.0 cm)
dominate the process, with numerous smaller tumors scattered throughout. Occasionally, an enlarged
liver with numerous small (1-2 mm) nodules can be observed. In older mice abdominal distension due
to massive tumor growth, ruffled fur, decreased activity, tremulousness, ataxia or somnolence are signs
of preterminal stage. Despite the extensive and aggressive local growth characteristics of these tumors,
no metastases are observed.
The tumors themselves are heterogeneous, both within the same liver as well as from animal to
animal, displaying the cytological and histological characteristic of adenomas and carcinomas.
Adenomas are the first tumors that appear in the liver at around eight-nine months of mice age. The
lesions are very variable: many adenomas consist of solid masses of benign-appearing hepatocytes with
clear or acidophilic cytoplasm arranged in distorted trabeculae of one-two cells of thickness. Others
display varying degree of cellular atypia with areas of abnormal trabecular differentation or foci of
cytological pleomorphism with enlarged nuclei and increased number of mitotic figure. These foci can
represent emerging microcarcinomas which start to appear at around twelve months of age. Two
general subset of HCC can be observed: some are trabecular, well differentiated, and mitotically quiet,
while others were solid, consisting of sheet of poorly differentiated epithelial cells and mitotically
active. In general, the incidence of HCC in this model corresponds to the frequency, severity, and age
of onset of liver cell injury, which itself correspond to the intrahepatic concentration of hBsAG and is
influenced by genetic background and sex (Chisari et al., 1989; Dunsford et al., 1990).

34
Chapter 2
Aim of the study

35
Hepatocellular carcinoma (HCC) is one of most common cancers with high mortality rate. The
hepatocarcinogenesis is a complex mechanism in which different cell types and environmental stimuli
interact and participate in the neoplastic transformation. Even though liver cells has intrinsic
regenerative potential to repair its tissue, when severe and chronic damages impair hepatocytes
replication, the activation of an alternative stem cells (SCs) compartment helps to replenish the
hepatocytes and cholangiocytes loss.
The cancer stem cells (CSCs) theory postulates that tumor is a hierarchy consisted by many
heterogeneous cells with different grades of differentiation in which only CSCs are capable of
sustaining the tumor as well as giving rise to proliferating but progressively differentiating cells that
compose the tumor mass. Whereas the CSCs play a pivotal role in the genesis, development, metastasis
and recurrence, most of the “differentiated” cells only have relative proliferation ability and die after
limited proliferation and differentiation. The origin of CSCs may derive from mutations occurring in
the activated SCs (either resident or circulating SCs) or from the dedifferentiation of hepatocytes or
progenitor cells.
In patients, the molecular mechanism of hepatocarcinogenesis is very difficult to observe,
delayed observation is very common and the tumor is usually noticeable in later stages. Moreover
continuous examination and biopsy are invasive and not preferable. Furthermore, because of the
variability of risk factors and long term development, the characteristic of liver cancer in single patient
and between individuals are unique. Therefore, the use of HCC animal model will give a good
comprehensive understanding on the cellular and molecular processes during hepatocarcinogenesis
and to draw an inclusive conclusion.
The general objective of this project is to investigate the involvement of the SCs in the
hepatocarcinogenesis, starting from early injury (chronic disease) to HCC. In this study, we employed
the HBV-transgenic mouse strain C57BL/6J-TG(ALB1HBV)44BRI/J (TG) compared to their
C57BL/6J counterpart. This transgenic strain contains Hepatitis B Virus (HBV) fragment in its genome
codifies the envelope protein (HBsAg) under the control of endogenous albumin promoter. This model
develops a progressive hepatic damage from chronic hepatitis until HCC, which well mimics the
natural history of human hepatocarcinogenesis.

36
The main aim of this study is divided into two major tasks: an in vivo and an in vitro study. In
the in vivo study we analyzed the progression of the disease in the TG model at different age points: at
3 month, (chronic hepatitis), 6 month (hyperplasia), 9 month (first early nodule), 12, and ≥15 month
(HCC) of age. We evaluated the expressions of most common SCs and CSCs markers in liver tissues to
observe the SCs compartment activation. In the in vitro study, we isolated and characterized the hepatic
stem/progenitor cells from both strains at different stages of the disease. In this thesis, we also
introduced a new method to quantify the mouse Alpha Fetoprotein (AFP) in the serum.
The observation of the HCC progression in these mice is reported in Chapter 4, the in vivo
analysis of the SCs and CSCs markers in hepatic tissues in Chapter 5, the in vitro analysis of
stem/progenitor cells isolation in Chapter 6, and mouse AFP quantification in Chapter 7.
37
Chapter 3
Materials and methods

38
3.1. Materials
Animals
Male heterozygous C57BL/6J-TG(ALB1HBV)44BRI/J transgenic mice (TG) breeder were
kindly supplied by the Department of Clinical and Biological Sciences of the University of Turin, Italy.
Female breeders C57BL/6J (WT) were purchased from Charles River (Charles River Laboratories
Italia, SRL, Lecco, Italy). All animals were maintained at the animal facility of the University of
Trieste, Italy. Experimentation was carried out in accordance with the recommendations in the Guide
for the Care and Use of Laboratory Animals and all efforts were made to minimize suffering.
The protocol and animal study were approved by the ethical committee of the University of
Trieste and responsible administration of the Ministry of Health (D.M. 57/2012-B).
Genotyping
Heterozygous TG male and WT female breeders were used to obtain heterozygous TG and WT
male. Genotyping was performed in accordance with the Jackson Laboratories protocol. Briefly, rapid
whole genome DNA extraction was performed using HotSHOT method: 2mm of mouse tail was heated
at 98°C for 1 hour in 25 mM NaOH/02. mM EDTA in water solution and then neutralized with an
equal volume of 40mM Tris HCl (pH5.5). The crude DNA solution was used for detection of control
gene and transgene in a multiplex PCR method. Standard PCR solutions were used according to the
manufacturer’s instructions (Invitrogen, Carlsbad, CA). PCR conditions were set for 2 min pre-
denaturation phase at 94°C, followed by 35 cycles of denaturation, annealing, and elongation steps,
each at 94°C for 30sec, 55°C for 1min, and 72°C for 1min, respectively. Final elongation was
performed at 72°C for 2min at the end of the cycles, followed by hold at 4°C. PCR products underwent
electrophoresis using 2% agarose gel. The PCR products were observed under UV light with a
transluminator (Euroclone) and pictures were taken with a KODAK DC290 Zoom Digital Camera.
Liver and blood collection
Experimental male heterozygote TG and WT were maintained in standard conditions until they
reached the desired experimental age points. In detail: 17 TG and 16 WT were sacrificed at 3 months,

39
20 TG and 23 WT at 6 months, 20 TG and 20WT at 9 months, 38 TG and 30 WT at 12 months, and 19
TG and 16 WT between 15 and 18 months of age.
At the moment of the sacrifice, animal were weighted and deep-anesthetized with intra-
peritoneal injection of Xilazina (5 mg/kg) and Zoletil (10 mg/kg). Blood was collected by cardiac
puncture and liver was extracted immediately after sacrification by cervical dislocation. Liver tissues
were sliced and collected in several different tubes: sterile 15 ml tube for primary cell culture, sterile
cryotube for RNA extraction and tissue conservation, and formalin-containing tubes for histochemical
analysis.
40
3.2. Methods
Serum transaminase quantification
After collection, whole blood samples were maintained at room temperature until the clot was
formed. Then samples were centrifuged at 11,000 rpm for 20-30 minutes and the serum was moved
into a new tube and stored at -80°C until analyzed. Serum alanin aminotransferase (ALT) and serum
aspartate aminotransferase (AST) were quantified with the standard enzymatic methods on a Roche
Cobas analyzer at the IRCCS Burlo Garofalo children hospital (Trieste, Italy).
Hematoxylin & Eosin and Gomori staining
Diagnosis of the hepatic pathologies was based on histological analysis on 3.5 um paraffinated
tissue section using Hematoxylin & Eosin (H&E) and Gomori staining of each analyzed age points.
The H&E staining was done in a routine examination in a fully automated system. Gomori staining is
used to stain the reticulin fibers network in the tissue using employs silver nitrate, potassium
hydroxide, and ammonia water. Both staining was performed at the University Hospital Santa Maria
della Misericordia, Udine, Italy. Histological analysis of at least three different liver sections for each
age/genotype was examined by a single pathologis.
Hepatitis B Surface Antigen staining
The presence of Hepatitis B Surface Antigen (HBsAg) of the Hepatitis B Virus was detected on
3.5 µm paraffinated tissue section each analyzed age points using immunologic reaction between Anti-
HBs and HBsAg. The quantification was performed based on HBsAg positive area per total area (%).
The staining was performed at the University Hospital Santa Maria della Misericordia, Udine, Italy.
Immunohistochemistry
The immunostaining of CD34 and DD133 was performed on 3.5 µm paraffinated tissues. After
de-paraffinization with xylene and rehydration with gradual concentration of ethanol (100%, 95%,
80%, and 70% in distilled water) endogenous peroxidases were inhibited with 3% hydrogen peroxide
solution for 15 minutes. Antigen retrieval was performed in heated 10 mM sodium citrate, 0.2%
tween20 solution (pH 6.0) and unspecific bound were blocked with 5% BSA in PBS solution overnight

41
at 4°C with agitation. Tissues were incubated with primary antibody overnight in a humidified chamber
at 4°C. Second α-Rat-biotinylated antibody (Vectastain Elite ABC Kit) was incubated for 1 hour at
room temperature, then streptavidin-peroxidase incubation and color development was carried out
following the protocol of the DBA peroxidase substrate kit (Vector laboratories, UK). Nuclei were
stained with hematoxylin and tissue was dehydrating with gradual concentration of ethanol (70%, 80%,
95%, and 100% in distilled water). Cover slip was mounted with Eukitt mounting medium (Fluka).
Slides were observed under Leica DM2000 microscope. Primary antibodies used in this study are listed
in Table 3.1.
Total RNA isolation
Total RNA from the hepatic tissues was extracted using the EuroGold RNA Pure solution
according to the manufacture’s protocol (EuroClone, Milan, Italy). A total of 475 hepatic samples from
107 TG and 97 wt mice were homogenized in a glass-potter with 1 mL of EuroGold RNA Pure solution
and kept on ice for 5 minutes. After addition of 200 µL chloroform per 1 mL EuroGold RNA Pure, the
tube was centrifuged at 12,000 rpm for 15 minutes at 4°C and the upper layer containing RNA was
removed to a new microtube. For RNA precipitation, 500 µL isopropanol per 1 mL EuroGold RNA
Pure was added. The tube was centrifuged at 12,000 rpm for 10 minutes at 4°C and the supernatant was
discarded. The RNA pellet was washed with 1 mL of cold ethanol 75% and centrifuged at 12,000 rpm
for 5 minutes at 4°C. After air-drying for 15 minutes, the pellet was diluted in sterile water.
Total RNA from primary cells cultures was extracted using the TriReagent solution according
to the manufacture’s protocol (Sigma–Aldrich, Milan, Italy). The cells on culture plate or flask were
washed two times with PBS and lysed with 1 mL of TriReagent. After scrapping and pipetting, the
lysate was removed to a microtube and homogenized by vortexing. After addition of 200 µL
chloroform per 1 mL TriReagent, the tube was centrifuged at 12,000 rpm for 15 minutes at 4°C and the
upper layer containing RNA was removed to a new microtube. For RNA precipitation, 500 µL
isopropanol per 1 mL TriReagent® was added. The tube was centrifuged at 12,000 rpm for 10 minutes
at 4°C and the supernatant was discarded. The RNA pellet was washed with 1 mL of cold ethanol 75%
and centrifuged at 8,000 rpm for 5 minutes at 4°C. After air-drying for 15 minutes, the pellet was
diluted in 10 – 50 µL of sterile water.

42
Total RNA samples were quantified in a spectrophotometer at 260 nm. Absorbance ratio at
260/280 nm and 260/230 nm was used to assess the purity of the samples. Agarose gel electrophoresis
and staining with ethidium bromide indicated that the RNA preparations were of high integrity.
Reverse transcription (RT) and real time quantitative reverse transcription polymerase chain
reaction (qRT-PCR)
The RT using 1 ug of total RNA was performed with an iScript cDNA synthesis Kit (Bio-Rad
Laboratories, Hercules, CA, USA) according to the manufacture’s suggestions. A total of 20 uL
volume reaction was conducted in a thermocycler (Gene Amp PCR System 2400, Perkin-Elmer,
Boston, MA, USA) at 25 °C for 5 min, 42 °C for 45 min, 85 °C for 5 min. The final cDNA was
conserved at -20 °C until used.
The qRT-PCR was performed according to the SsoAdvanced SYBR Green Supermix (Bio-Rad
Laboratories, Hercules, CA, USA) protocol. PCR amplification was carried out in 15 uL reaction
volume containing 15 ng of cDNA, 1x SsoAdvanced SYBR Green Supermix and 250 nM gene specific
sense and anti-sense primers. Reactions were run and analyzed on a Bio-Rad iCycler iQ real-time PCR
detection system (iCycler IQ5 software, version 3.1; Bio-Rad) together with reference genes. Cycling
parameters were determined and analyzed using the Pfaffl modification of the ΔΔCt equation with
taking accounts to the efficiency of the reaction (Pfaffl, 2001; Bustin et al., 2009).
Primer design
The primers for qRT-PCR were designed using software Beacon Designer Version 7.9 (Premier
Biosoft International, Palo Alto, CA, USA). Primer sets were built across two exons to avoid
contamination of genomic DNA. Nucleotide BLAST was performed to check the specificity of the
sequences. Melting curve analysis and agarose gel electrophoresis were carried out to asses templates
products. The list of the primers description and sequences were shown in Table 3.2.

43
Statistical analysis
Box and bar plot graphics and statistical analysis were constructed using software GraphPad
Prism Version 5.0 (GraphPad Software, Inc., La Jolla, CA, USA). The student’s t test was performed
for statistical comparison between groups. Value of p<0.05 was regarded as statistically significant.
Protein extraction
For total protein extraction from tissue, samples were dissolved in cell lysis buffer (PBS
containing 1% v/v of a protease inhibitor cocktail [Sigma-Aldrich, Milan, Italy] and 2 mM
phenylmethylsulfonylfluoride). Cells were then placed on ice for 10 minutes and disrupted with potter.
Protein lysate were obtained by centrifugation at 14,000 rpm for 10 minutes at 4°C.
For total protein extraction from primary cell culture, TriReagent solution was used according
to the manufacture’s protocol (Sigma–Aldrich, Milan, Italy). The cells on culture flask were washed
two times with PBS and lysed with 1 mL of TriReagent. After scrapping and pipetting, the lysate was
removed to a microtube and homogenized by vortexing. After addition of 200 µL chloroform per 1 mL
TriReagent, the tube was centrifuged at 12,000 rpm for 15 minutes at 4°C and the upper layer
containing RNA was removed to a new tube for RNA extraction. 300 µL of ethanol 100% per 1 mL
TriReagent was added to the interphase and lower phase and centrifuged at 2,000 rpm for 5 minutes at
4°C. For protein precipitation the supernatant was removed into a new tube and 1.5 mL of isopropanol
per 1 mL of TriReagent was added. The tube was centrifuged at 12,000 rpm for 10 minutes at 4°C and
the supernatant was discarded. The protein pellet was washed three times with 2 mL of 0.3 M
guanidine hydrochloride in ethanol 95% solution per 1 mL of TriReagent. During each wash, samples
were stored at room temperature for 20 minutes and centrifuged at 7,000 rpm for 5 minutes at 4°C.
After air-drying for 15 minutes, the pellet was diluted in SDS 1% and centrifuged at 10,000 rpm for 10
minutes at 4°C to precipitate insoluble materials. Supernatant was moved to a new tube and stored at -
80°C until use.
Protein concentration was determined by copper (II) sulphate solution (Sigma-Aldrich, Milan,
Italy) and bicinchonic acid solution (Sigma-Aldrich, Milan, Italy) protein assay following the
manufacturer’s instructions.

44
Western Blot
Proteins of desired quantity (in µg) were size-separated, together with molecular weight
standards (Fermentas, SM1811), by (SDS–PAGE) on 10% polyacrylamide gel, using a Mini Protein III
Cell (Bio-Rad, Hercules, CA, USA). After SDS–PAGE, proteins were electro-transferred with a semi-
dry blotting system at 100V for 90 min onto immune-blot PVDF membranes (Bio-Rad) using a Mini
Trans-Blot Cell (Bio-Rad). Membrane was incubated overnight at 4°C with first antibody at dilution
1:200 to 1:2500 in 5% skim milk or 4% BSA in T-TBS buffer (0.1% Tween 20 in TBS) or T-PBS
buffer (0.1% Tween 20 in PBS). After three washes with T-TBS or T-PBS the membranes were
incubated with secondary antibodies with peroxidase conjugate at dilution 1:1000 in 5% skim milk or
4% BSA in T-TBS or T-PBS for 1 hour in room temperature. The peroxidase reaction was obtained by
exposure of membrane in the ECL-Plus Western blot detection system solutions (ECL Plus Western
blotting Detection Reagents, GE-Healthcare Bio-Sciences, Italia). Primary antibodies used in this study
are listed in Table 3.1.
Establishment of stem cells primary culture from mouse liver tissues
Primary cell cultures from total liver tissue
The primary cell cultures of mouse liver were obtained from both WT and TG mice at different
ages. Directly from the animal facility, the tissues were kept in a falcon tube without any buffers and
keep it in ice for maximum 3 hours before processing.
Under the sterile hood, the tissue was washed twice with pre-warmed PBS. Then the tissue was
cut into small pieces using blade and scalpel and dissociated using 1 mg/mL collagenase type 4
(Sigma-Aldrich) in PBS for 40-50 minutes in a CO2 incubator 37°C, 95% humidity, 5% CO2. The
enzyme activity was blocked with a minimum an equal volume of 5% BSA in PBS. After
centrifugation (1,400 rpm, room temperature, 5 minutes) the cells were washed twice with PBS and
filtered through a 40 µm cell strainer gradually several times. The flow through was washed and plated
on 60mm dishes in the medium described below. The cells were grown in a CO2 incubator: 37°C, 95%
humidity, 5% CO2 with media changes every 3-4 days.

45
Medium 1
Dulbecco’s modified Eagle’s medium/F12 (Gibco, NY, USA) was supplemented with B27
(Gibco), ITS-X (Gibco), 10 mM HEPES, 20 ng/mL epidermal growth factor (PeproTech,NJ, USA), 20
ng/mL fibroblast growth factor bFGF (PeproTech), 10 ng/mL hepatocyte growth factor HGF
(PeproTech), and 1% antibiotics. Cells were plated onto dishes coated with type I collagen (Gibco) at
the density of 5 µg/cm2.
Medium 2
Dulbecco’s modified Eagle’s medium high glucose (Euroclone) was supplemented with 10
µg/mL insulin (Sigma-Aldrich), 1mM Glutamax, 10% fetal bovine serum (FBS), and 1% antibiotics.
Medium 3
William’s E medium was supplemented with µg/mL insulin (Sigma-Aldrich), 10% FBS, and
1% antibiotics.
Primary cell cultures from non-parenchymal liver cells
The primary cell cultures of mouse liver were obtained from both WT and TG mice at 3, 6, 9,
12, and ≥15 months of age. Directly from the animal facility, the tissues were kept in a falcon tube
without any buffers and keep it in ice for maximum 3 hours before processing.
Under the sterile hood, the tissue was washed twice with pre-warmed Krebs Ringer buffer
(Sigma-Aldrich). After the tissue was cut into small pieces using blade and scalpel and dissociated
using collagenase type 4 (Sigma-Aldrich) for 40-50 minutes in a CO2 incubator 37°C, 95% humidity,
5% CO2. The enzyme activity was blocked with a minimum an equal volume PEB buffer (0.5% BSA,
2mM EDTA in PBS). After centrifugation (1,400 rpm, room temperature, 5 minutes) they were washed
twice with pre-warmed PBS and filtered through a 40 µm cell strainer gradually several times. Then the
flow through was centrifuged at 600 rpm for 1 minute at 4°C three times to remove contaminating
hepatocytes. The remaining cells were collected by centrifugation at 1,400 rpm and incubated in 10 mL
of 1X red blood cells lysis solution (Miltenyi Biotec, Bergisch Gladbach, Germany) for 5 minutes at
room temperature. After two washing with PEB buffer the cells were plated in different growth
46
mediums described below. The cells were grown in a CO2 incubator: 37°C, 95% humidity, 5% CO2
with media changes every 3-4 days.
Medium 4
MyeloCult® M5330 (StemCells Tech., Vancouver, Canada) medium was filtered before use
with 0.2 µm filter and supplemented with 10 µM Hydrocortisone sodium succinate and 1% antibiotics
(Sigma-Aldrich).
Medium 5
Dulbecco’s modified Eagle’s medium/F12 (Gibco) was supplemented with 10% heat
inactivated FBS, 1 µg/mL insulin (Sigma-Aldrich), 5mM HEPES, 50ng/mL HGF (PeproTech), 20
ng/mL EGF (PeproTech), and 1% antibiotics (Sigma-Aldrich)
Immunocytochemistry
Primary cells were grown on cover slip until they reached 70-80% of confluence. After washing
with PBS, cells were fixed with 3% paraformaldehyde for 10 minutes at room temperature. Unspecific
bound were blocked with 5%BSA in PBS solution overnight at 4°C with agitation. Cells were
incubated with primary antibody overnight in a humidified chamber at 4°C. Second α-Rat-biotinylated
antibody (Vectastain Elite ABC Kit) was incubated for 1 hour at room temperature, then streptavidin-
peroxidase incubation and color development was carried out following the protocol of the DBA
peroxidase substrate kit (Vector laboratories, UK). Nuclei were stained with hematoxylin and tissue
was dehydrating with gradual concentration of ethanol (70%, 80%, 95%, and 100% in distilled water).
Cover slip was mounted with Eukitt mounting medium (Fluka). Slides were observed under Leica
DM2000 microscope. Primary antibodies used in this study are listed in Table 3.1.
3D clonogenic assay
Single primary cells suspension was diluted in serum-free medium at the concentration of
10,000 cell/mL. A plating concentration of 500 cells/well was prepared in a thick gel of mixture
matrigel : medium (1:2) in a 96-well plate. Gel was left to solidify at 37°C for 30 minutes, and then 100
µl of culture medium was added onto gel. Growth medium was changed every two days and colony
growth was observed every two days under light microscopy.

47
Table 3.1 List of antibody
Markers Clone Company Application Dilution Buffer
CD34 MEC 14.7 Santa Cruz Biotech. Western Blot 1:200 4% BSA in T-TBS
Immunohistochemistry 1:100 5% BSA in PBS
CD133 13A4 eBioscience Western Blot 1:200 5% milk in T-PBS
Immunohistochemistry 1:100 cells
1:25 tissue
5% BSA in PBS
CD90 OX7 Santa Cruz Biotech. Western Blot 1:200 4% BSA in T-TBS
Immunohistochemistry 1:100 5% BSA in PBS
AFP Polyclonal R&D System Western Blot 1:1000 5% BSA in PBS
AFP Polyclonal abcam Western Blot 1:2500 5% BSA in PBS
Actin 2066 Sigma Western Blot 1:1000 4% BSA in T-TBS

48
Table 3.2 List of primer
Gene Accession no. Length Sequence F Sequence R Exons Position size
Reference
Β-actin NM_007393 1892 CCTTCTTGGGTATGGAATCCTGTG CAGCACTGTGTTGGCATAGAGG 4-5 874-977 104
GAPDH NM_008084 1228 CCAGTATGACTCCACTCACG CTCGCTCCTGGAAGATGGTG 2 181-281 101
18S NR_003278 1870 TCCGATAACGAACGAGAC CTAAGGGCATCACAGACC 1372-1507 136
Target
CD133 NM_001163577.1 3766 GACATCTCAGTTGATTCCAAGG- CATGGCGCATTCTGCTTCTGC 3a-4b 499-677 179
CD34 NM_001111059.1 2621 ATATGCTTACACATCATCTTCT AACCTCACTTCTCGGATT 3-4 613-690 78
Krt19 NM_008471 1509 CAGGTCAGTGTGGAGGTG TCAATCCGAGCAAGGTAGG 4-5 763-878 134
Afp NM_007423.4 2086 GTTCCTTATTGGTTACACGAG CAGGGCTTGCTTCATTCC 11-12 1345-1532 188
CD90 NM_009382.3 1753 AACTTCACCACCAAGGAT TTGTCTCTATACACACTGATACT 3-4 398-498 101
Epcam NM_008532.2 2061 ATTGTGGTGGTGTCATTAG TCCTTTATCTCAGCCTTCT 8-10 1272-1369 97
Sca1 NM_010738.2 842 AGGAGGCAGCAGTTATTGTG TATTAGGAGGGCAGATGGGTAA 3-4 205-282 78
sox9 NM_011448.4 4146 CCTCACTACAGCCCCTCCTA TCTGATGGTCAGCGTAGTCG 3 1645-1708 64
Krt18 NM_010664.2 1400 GCACTCAAGGAAGAACTT TCCACAGTCAATCCAGAG 3-4 655-749 95
Krt7 NM_033073.3 1602 AATGAGATTGCGGAGATG ATGCTGGACTCTAACTTG 6-7 969-1060 92
Alb NM_009654.3 2043 GTAGAAGAGCCTAAGAACT GGTGTAGCGAACTAGAAT 10-11 1259-1354 96
CD45 NM_001111316.2 5568 TCACAAGCATGCATCCATCC TTCCAAGAGATTGAACAAGGCA 31-32 3578-3662 85
Fsp1 NM_011311.2 531 CAGAAGGTGATGAGCAACT AGGACAGGAAGACACAGTA 3 218-275 76
49
Chapter 4
Results 1
Hepatocarcinogenesis in the transgenic
mouse model

50
4.1. Gross appearance of the liver
At the moment of the sacrifice, normal WT livers appeared as classic reddish-brown colour at
each age point and no macroscopic alterations were observed (Fig. 4.1 A). On the contrary, TG livers
showed a progressive changing both in colour and texture.
At 3 months, TG livers had normal colour and texture and no substantial alterations were found
(Fig. 4.1 B). Starting from 6 months, liver colour was variably changed from greyish-brown to pale–
brown and tissue became softer in consistency (Fig 4.1 C and D). At 12 months, first macroscopic
lesions appeared: 20 out of 28 mice (71%) presented lesion of different sizes spread on hepatic tissue as
single or multiple nodules: 12 (60%) mice had lesions smaller than 1 cm and 8 (40%) showed at least
one lesion bigger than 1 cm. At 15 months, the incidence and the size of the tumoral masses became
more evident: 19 out of 21 livers (91%) had neoplastic lesion, in which 10 (52%) presented at least one
mass bigger than 1 cm. Most of the big tumors were vascularised and firm in texture with varied colour
from white-pale yellow to light brown (Fig. 4.1 E-I).

51
Figure 4.1. Gross appearance of the livers. WT at month 3 months (A), TG at month 3 (B), 6 (C), 9 (D), 12 (E-F),
and ≥ 15 (G-I).

52
4.2. Liver histology
For the diagnosis of the liver pathology, we performed hematoxylin and eosin staining (H&E
staining) together with Gomori staining on WT and TG liver tissue slides. H&E staining is the most
common staining for histological diagnosis, while the Gomori staining is used to stain the reticulin
fibers network in the tissue. Histological analysis of at least three different liver sections for each
age/genotype was examined by a single pathologist.
A total of 25 slides from 24 WT animals were examined. WT liver tissue showed a normal
lobular and cellular organization: hepatocytes sheets radially from the terminal vein to the portal triad
(Fig. 4.2 A-B). A weak cellular edema was observed in 9 out of 25 slides (36%) (Fig. 4.2 C), while rare
to weak inflammation in 5 out of 25 slides (20%) (Fig. 4.2D). Only one liver showed 5-10% steatosis
(Fig. 4.2 C). The reticulum was thin and regular in 21 animals (Fig. 4.2 E), only 4 animals showed a
weak, mostly perivascular thickening of the reticulum corresponding mainly to a perivascular fibrosis
(Fig. 4.2 F).
A total of 41 slides from 31 TG animals were examined. At 3 months, in general, livers were
architecturally and cytologicaly normal, moderate cellular edema was observed in only two animals. At
six months, first evidence of hepatic damage was noticed: all of the 6 animals analyzed presented
cellular and nuclear alterations as edema, apoptotic body and nuclear pleomorfism. Reticulum was
thicker than WT, regular in three animals and irregular in two, indicating hepatocytes death. These
kinds of damages persisted and worsened during subsequent liver injury.
In TG animals with 12 and ≥15 months old, in addition to the alteration observed in the
preceding age points, the appearance of ground glass hepatocytes, clear cells, ballooning and necrosis
characterized the process. Moreover, stronger cellular and nuclear alteration as cellular polymorphism,
intracellular acidofilic bodies, Mallory bodies, huge nuclei and nucleoli were evident. All 17 animals
analyzed presented some different degrees of dysplasia both of small and large cells type. The
reticulum was thicker, regular in 3 and irregular in 10 animals. Among these, 4 animals presented
complete (1 animal) or almost complete (3 animals) nodule septa. In six animals the diagnosis of HCC
was confirmed by the absence of reticulum network with Gomori staining.

53
These animals were also characterized by the presence of flogosis and activated resident
immunological cells as Kupffer cells (10 animals), perivascular fibrosis (7 animals), and variable
degree of steatosis (intensity ranged from <5% to 80% in 11 animals) but not advanced fibrosis or
cirrhosis (Fig. 4.3).
Figure 4.2. Hematoxylin & Eosin (H&E) and Gomori staining on WT liver. A-B. H&E staining of a normal
liver at 15 months. C. H&E staining at 12 months with steatosis and cellular edema. D. H&E staining at 3 months with
flogosis and perivascular fibrosis. E-F. Gomori staining of two 3 months: normal reticulin distribution (E) and thicker
reticulum (F). Objective: 10X (A) 20X (B-F).
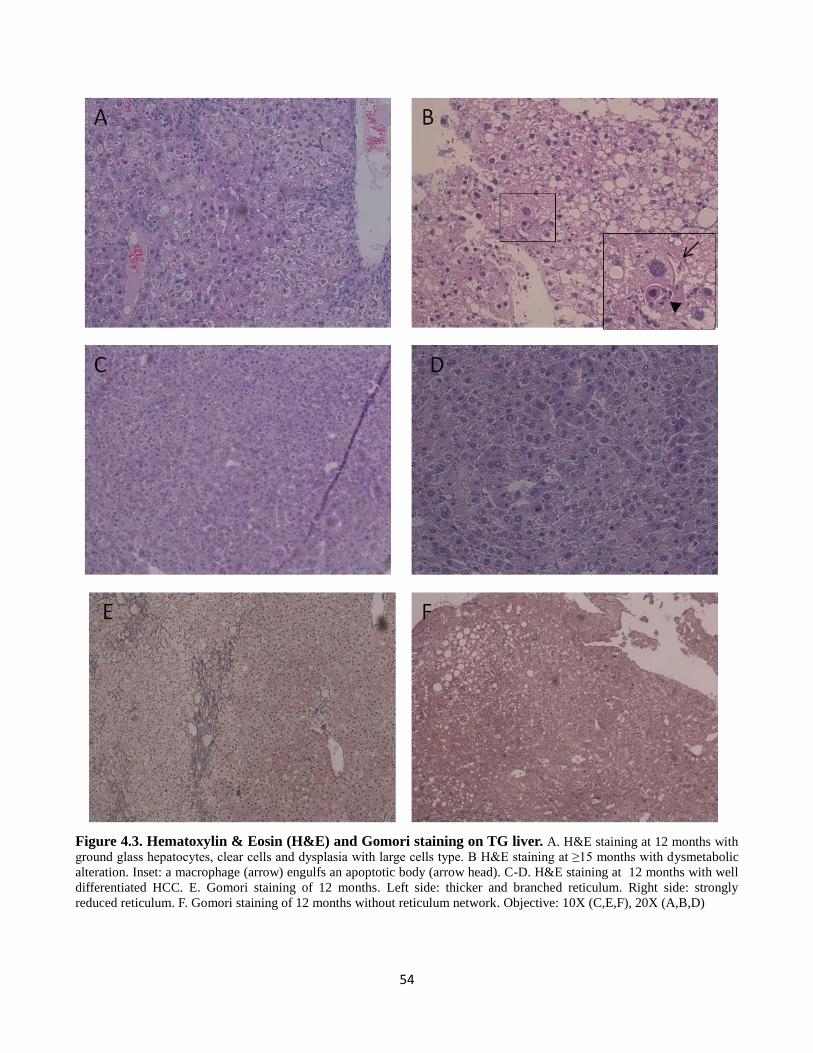
54
Figure 4.3. Hematoxylin & Eosin (H&E) and Gomori staining on TG liver. A. H&E staining at 12 months with
ground glass hepatocytes, clear cells and dysplasia with large cells type. B H&E staining at ≥15 months with dysmetabolic
alteration. Inset: a macrophage (arrow) engulfs an apoptotic body (arrow head). C-D. H&E staining at 12 months with well
differentiated HCC. E. Gomori staining of 12 months. Left side: thicker and branched reticulum. Right side: strongly
reduced reticulum. F. Gomori staining of 12 months without reticulum network. Objective: 10X (C,E,F), 20X (A,B,D)

55
4.3. Presence of HBV envelope protein (HBsAg) in TG mice
Using immunostaining, we had evaluated the presence of the Hepatitis B Surface Antigen
(HBsAg) protein in the liver of TG mice at the different age points. A total of 30 TG and 26 WT livers
as control were analyzed. As expected, the WT livers were all HBsAg negative (Fig. 4.4A), on the
contrary, a strong positive staining was observed in all TG animals (Fig. 4.4B-F) . In TG animals, in
particular, at 3 months most of the hepatocytes were stained for HBsAg with different degrees of
intensity (Fig. 4.4B) with the exception of small group that were completely negative (Fig.4.4C).
During the progression of the disease, a higher variability in the HBsAg expression was
observed. At 6 and 9 months (Fig. 4.4E) larger negative areas appeared and persisted during aging (Fig.
4.4F). In three animals, very low percentage of positive cells (10-25%) was observed (Fig. 4.4D).
Figure 4.4. HBsAg staining on TG and WT liver. A. WT liver at 6 months. B-C. TG liver at 3 months. D-F. TG liver
at 6 (D), 9 (E), and 12 (F) months. Objective: 10X (A,B,D-F), 20X (C).

56
4.4. Body weight
Body weight is considered a generic parameter of healthy status. Body weight was measured in
179 animals (95 TG and 84 WT) at the moment of the sacrifice.
In WT animals, body weight significantly increased between 3 and 6 months (p<0.001) and then
stabilized during following ages. Median values were 38.4, 34.1, 37.9, 40.9, and 38.0 g at 3, 6, 9, 12,
and ≥15 months, respectively .In TG animals, similar trend of body weight was observed as it in the
WT. A slight significant increase was noticed between 3 and 6 months (p<0.05). Median values were
29,0 34.7, 38.0, 38.9, and 38.5 g at 3, 6, 9, 12, and ≥15 months, respectively. No significant differences
were observed between TG and WT at each time points (Fig. 4.5).
Figure 4.5. Body weight of WT and TG animals. Box and whiskers represent respectively 25°and 75° percentile and
minimum and maximum values; the line within the box represents the median value. White box: WT; grey box: TG serum.
Total n: 179 animals (WT 3 months [13], 6 months [18], 9 months [18], 12 months [20], ≥ 15 months [15]; TG 3 months
[11], 6 months [16], 9 months [19], 12 months [31], ≥15 months [18]).
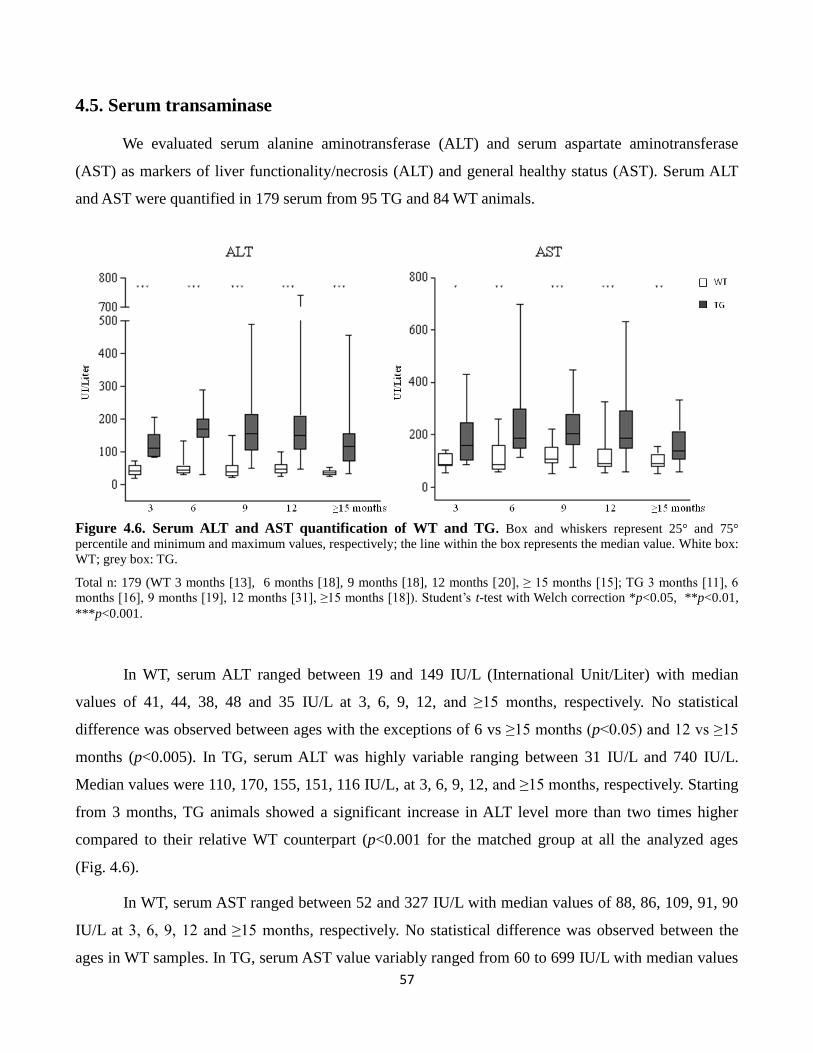
57
4.5. Serum transaminase
We evaluated serum alanine aminotransferase (ALT) and serum aspartate aminotransferase
(AST) as markers of liver functionality/necrosis (ALT) and general healthy status (AST). Serum ALT
and AST were quantified in 179 serum from 95 TG and 84 WT animals.
Figure 4.6. Serum ALT and AST quantification of WT and TG. Box and whiskers represent 25° and 75°
percentile and minimum and maximum values, respectively; the line within the box represents the median value. White box:
WT; grey box: TG.
Total n: 179 (WT 3 months [13], 6 months [18], 9 months [18], 12 months [20], ≥ 15 months [15]; TG 3 months [11], 6
months [16], 9 months [19], 12 months [31], ≥15 months [18]). Student’s t-test with Welch correction *p<0.05, **p<0.01,
***p<0.001.
In WT, serum ALT ranged between 19 and 149 IU/L (International Unit/Liter) with median
values of 41, 44, 38, 48 and 35 IU/L at 3, 6, 9, 12, and ≥15 months, respectively. No statistical
difference was observed between ages with the exceptions of 6 vs ≥15 months (p<0.05) and 12 vs ≥15
months (p<0.005). In TG, serum ALT was highly variable ranging between 31 IU/L and 740 IU/L.
Median values were 110, 170, 155, 151, 116 IU/L, at 3, 6, 9, 12, and ≥15 months, respectively. Starting
from 3 months, TG animals showed a significant increase in ALT level more than two times higher
compared to their relative WT counterpart (p<0.001 for the matched group at all the analyzed ages
(Fig. 4.6).
In WT, serum AST ranged between 52 and 327 IU/L with median values of 88, 86, 109, 91, 90
IU/L at 3, 6, 9, 12 and ≥15 months, respectively. No statistical difference was observed between the
ages in WT samples. In TG, serum AST value variably ranged from 60 to 699 IU/L with median values

58
of 160, 189, 205, 189, 139 IU/L at 3, 6, 9, 12 and ≥15 months, respectively. Starting from 3 months, TG
animals showed a significant increase in AST level which were about two times higher compared to
their relative WT counterpart (3 months WT vs TG p<0.05, 6 and ≥15 months WT vs TG p<0.01, 9 and
12 months WT vs TG p<0.001).

59
Chapter 5
Results 2
Analysis of the expression of stem cells
markers in TG mouse liver tissue

60
As mentioned in the Introduction, hepatic stem cells are involved in regenerative phenomena
when liver damage is chronic. The stimulation of hepatic stem cells (SCs) niche might be prone to the
alteration and mutation that may switch the nature of stem cells to cancer stem cells (CSCs). As
previously described, the presence of CSCs in HCC had been widely demonstrated. To understand the
suitability of the model for the study of the hepatic SCs compartment activation during liver injury and
its role in the process of hepatocarcinogenesis, the expression of the most common hepatic SCs
markers was evaluated.
We analysed the expression of the normal SCs and CSCs markers CD133 (Prominin1), CD34,
Epcam, CD90 (Thy1), Krt19, Afp, Sca1 and the hepatic progenitor marker Sox9 at the ages of 3, 6, 9,
12 and ≥15 months, both in TG and WT livers. A total of 475 tissue samples from 107 TG and 97 WT
animals were analysed by RT-qPCR. The mRNA level in the samples was calculated as au (arbitrary
unit) compared to one WT sample at 3 months (defined as 1.00 au). TG liver samples at 12 and ≥15
months were divided in two groups of non-tumoral and tumoral samples based on the macroscopic
appearance of the liver tissue at the moment of the sacrifice.
The gene expression of target gene was correlated with its protein data. Protein expressions of
CD133, CD34, and CD90 were evaluated by Western Blot analysis. The distribution and positivity of
CD133 and CD34+ cells in liver tissues was conducted by immunohistochemistry on paraffin-
embedded tissue sections.
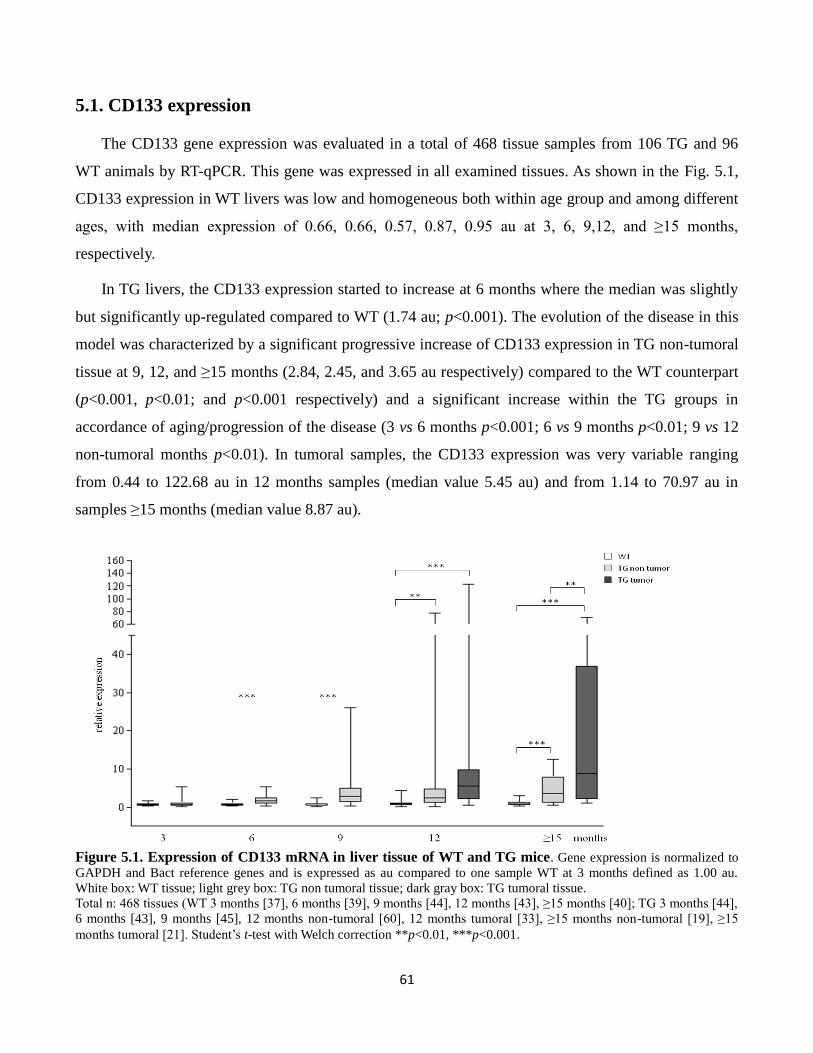
61
5.1. CD133 expression
The CD133 gene expression was evaluated in a total of 468 tissue samples from 106 TG and 96
WT animals by RT-qPCR. This gene was expressed in all examined tissues. As shown in the Fig. 5.1,
CD133 expression in WT livers was low and homogeneous both within age group and among different
ages, with median expression of 0.66, 0.66, 0.57, 0.87, 0.95 au at 3, 6, 9,12, and ≥15 months,
respectively.
In TG livers, the CD133 expression started to increase at 6 months where the median was slightly
but significantly up-regulated compared to WT (1.74 au; p<0.001). The evolution of the disease in this
model was characterized by a significant progressive increase of CD133 expression in TG non-tumoral
tissue at 9, 12, and ≥15 months (2.84, 2.45, and 3.65 au respectively) compared to the WT counterpart
(p<0.001, p<0.01; and p<0.001 respectively) and a significant increase within the TG groups in
accordance of aging/progression of the disease (3 vs 6 months p<0.001; 6 vs 9 months p<0.01; 9 vs 12
non-tumoral months p<0.01). In tumoral samples, the CD133 expression was very variable ranging
from 0.44 to 122.68 au in 12 months samples (median value 5.45 au) and from 1.14 to 70.97 au in
samples ≥15 months (median value 8.87 au).
Figure 5.1. Expression of CD133 mRNA in liver tissue of WT and TG mice. Gene expression is normalized to
GAPDH and Bact reference genes and is expressed as au compared to one sample WT at 3 months defined as 1.00 au.
White box: WT tissue; light grey box: TG non tumoral tissue; dark gray box: TG tumoral tissue.
Total n: 468 tissues (WT 3 months [37], 6 months [39], 9 months [44], 12 months [43], ≥15 months [40]; TG 3 months [44],
6 months [43], 9 months [45], 12 months non-tumoral [60], 12 months tumoral [33], ≥15 months non-tumoral [19], ≥15
months tumoral [21]. Student’s t-test with Welch correction **p<0.01, ***p<0.001.
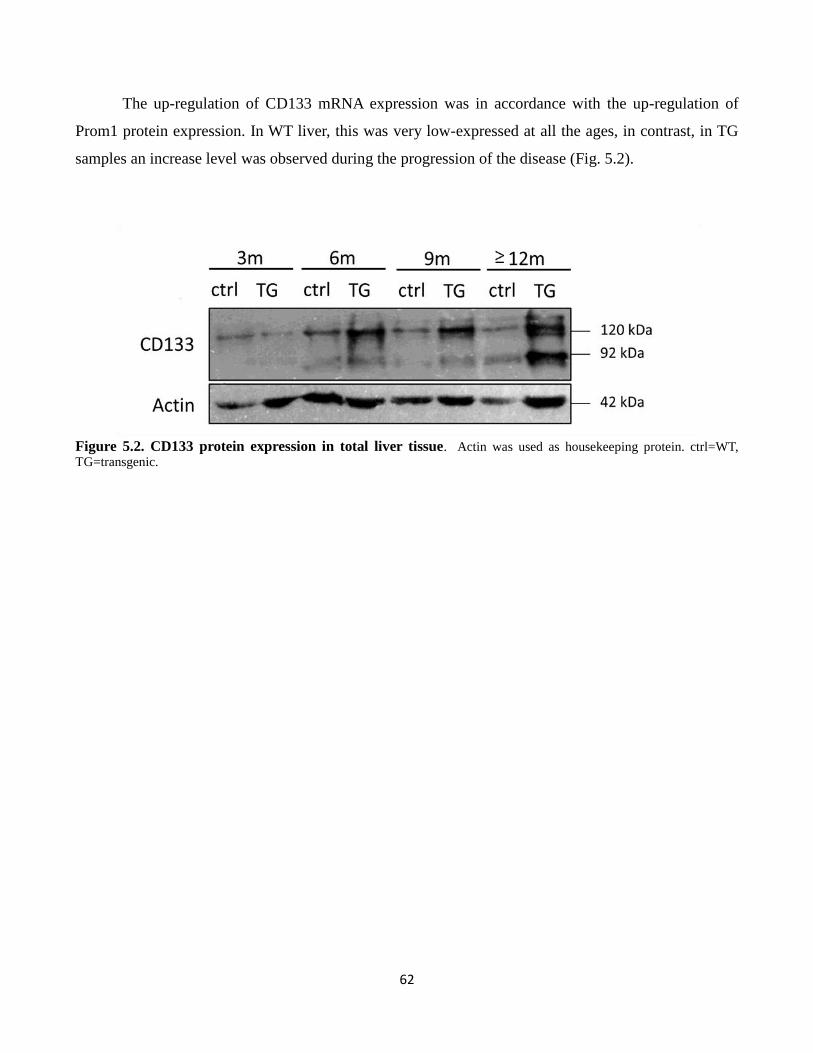
62
The up-regulation of CD133 mRNA expression was in accordance with the up-regulation of
Prom1 protein expression. In WT liver, this was very low-expressed at all the ages, in contrast, in TG
samples an increase level was observed during the progression of the disease (Fig. 5.2).
Figure 5.2. CD133 protein expression in total liver tissue. Actin was used as housekeeping protein. ctrl=WT,
TG=transgenic.
63
5.2. CD34 expression
The CD34 gene expression was evaluated in a total of 473 tissue samples from 107 TG and 96 WT
animals by RT-qPCR. This gene is expressed in all examined tissues. In WT livers, the expression was
homogeneous both within the same age group and among the different ages, with the median
expression of 0.86, 0.73, 0.67, 0.86, 0.80 au at 3, 6, 9, 12, and ≥15 months respectively.
In TG livers, the CD34 expression showed a similar increasing pattern to CD133 distribution and
corresponded to the progression of the disease. CD34 expression was significantly up-regulated
compared to WT starting from the first hepatic damage at 3 months of age with an expression of 1.13
au (p<0.5) and progressively increase from 3 to 9 months (2.34 and 2.56 au at 6 and 9 months; 3 vs 6
months p<0.01; 6 vs 9 months p<0.05). In non-tumoral liver at 12 and ≥15 months, the median values
of CD34 were 2.4 and 2.45 au, similarly to that observed at 9 months (12 months WT vs TG non
tumoral p<0.001; ≥15 months WT vs TG non tumoral p<0.001). As also seen in CD133 expression,
tumoral TG tissues showed highly variable CD34 expression ranging from 0.88 to 19.62 au at 12
months and from 0.91 an 19.34 au at ≥15 months. CD34 expression was significantly up-regulated
compared to both TG non-tumoral and WT groups (12 months WT vs tumoral p<0.001; 12 months TG
non tumoral vs tumoral p<0.01; ≥15 months WT vs tumoral p<0.001; ≥15 months TG non tumoral vs
tumoral p<0.05) (Fig. 5.3)
The up-regulation of CD34 mRNA expression was in accordance with the up-regulation of
CD34 protein expression. In WT liver, this protein was stable during aging, in contrast, in TG samples
an increase level was observed during the progression of the disease (Fig.5.4).
.

64
Figure 5.3. Expression of CD34 mRNA in liver tissue of WT and TG mice. The expression is normalized on
GAPDH and Bact reference genes and is expressed as au compared to one sample WT at 3 months set as 1.00 au. White
box: WT tissue; grey box: TG non tumoral tissue; black box: TG tumoral tissue.
Total n: 473 tissues (WT 3 months [38], 6 months [41], 9 months [44], 12 months [43], ≥15 months [40]; TG 3 months [44],
6 months [43], 9 months [44], 12 months non-tumoral [61], 12 months tumoral [33], ≥15 months non-tumoral [22], ≥15
months tumoral [21]. Student’s t-test with Welch correction *p<0.05, **p<0.01, ***p<0.001.
Figure 5.4. CD34 protein expression in total liver tissue. Actin was used as housekeeping protein. ctrl=WT,
TG=transgenic

65
5.3 Krt19 expression
The Krt19 gene expression was evaluated in a total of 466 tissue samples from 107 TG and 96 WT
animals by RT-qPCR. This gene is expressed in all the examined tissues. As shown in the Fig. 5.5, the
expression in WT livers is homogeneous both within the same age group and among the different ages,
with a median value of 1.02, 0.75, 0.52, 0.57, 0.89 au at 3, 6, 9, 12, and ≥15 months respectively.
In TG livers, starting from 6 months of age, Krt19 expression progressively increased in the TG
non tumoral samples with a moderate but significant up-regulation compared to the paired WT (1.55,
1.53, 2.24, 2.29 au at 6, 9, 12 and ≥15 months respectively). Within the TG groups a significant
increase was observed moving from 3 to 6 and 9 months (p<0.01 and p<0.05 respectively) and from 6
and 9 months to 12 non-tumoral samples (p<0.001 and p<0.01 respectively). On the contrary, the Krt-
19 expression in TG tumoral samples showed an opposite trend with a decrease from 1.42 au at 12
months to 0.54 au at ≥15 months. Moreover at both groups 12 months and ≥15 months of TG, Krt19
expression in tumoral was lower than in non tumoral tissue (12 months: TG non-tumoral 2.24 au and
tumoral 21.42 au; ≥15 months: TG non-tumoral 3.29 au and tumoral 0.54 au, p = 0.0003).

66
Figure 5.5. Expression of Krt19 mRNA in liver tissue of WT and TG mice. The expression is normalized on
GAPDH and Bact reference genes and is expressed as au compared to one sample WT at 3 months set as 1.00 au. White
box: WT tissue; grey box: TG non tumoral tissue; black box: TG tumoral tissue.
Total n: 466 tissues (WT 3 months [38], 6 months [37], 9 months [44], 12 months [41], ≥15 months [40]; TG 3 months [43],
6 months [42], 9 months [45], 12 months non-tumoral [60], 12 months tumoral [33], ≥15 months non-tumoral [22], ≥15
months tumoral [21]. Student’s t-test with Welch correction **p<0.01, ***p<0.00 1.
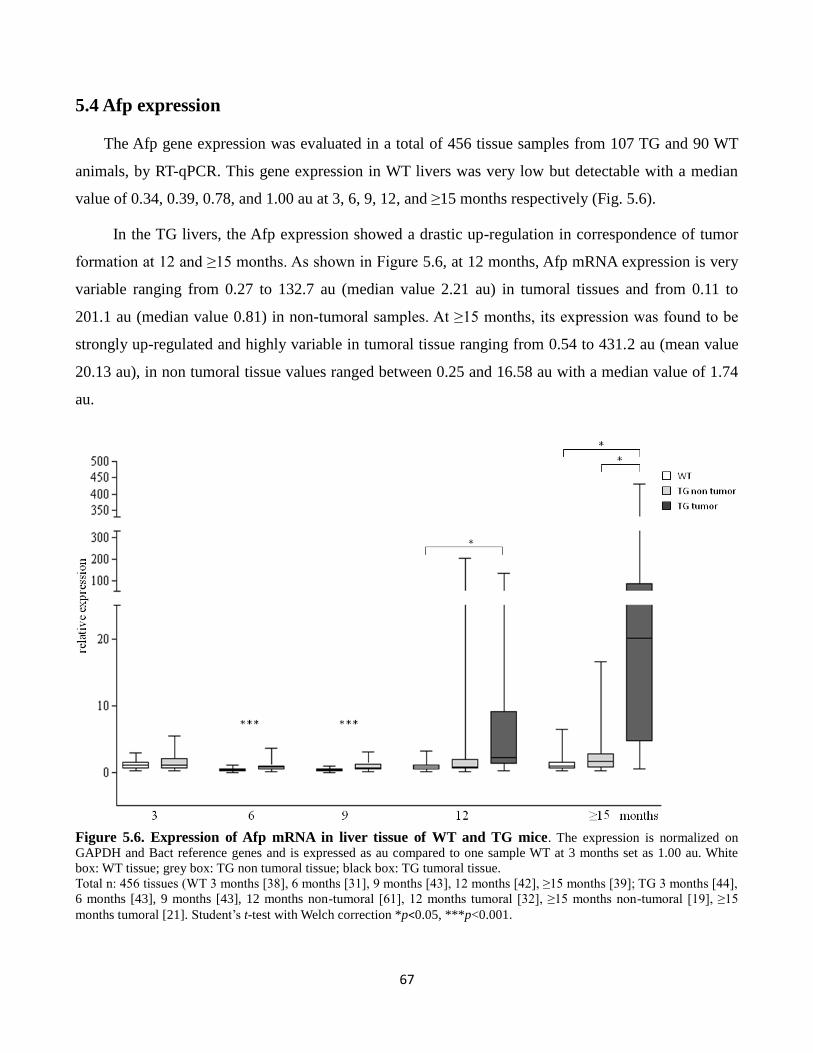
67
5.4 Afp expression
The Afp gene expression was evaluated in a total of 456 tissue samples from 107 TG and 90 WT
animals, by RT-qPCR. This gene expression in WT livers was very low but detectable with a median
value of 0.34, 0.39, 0.78, and 1.00 au at 3, 6, 9, 12, and ≥15 months respectively (Fig. 5.6).
In the TG livers, the Afp expression showed a drastic up-regulation in correspondence of tumor
formation at 12 and ≥15 months. As shown in Figure 5.6, at 12 months, Afp mRNA expression is very
variable ranging from 0.27 to 132.7 au (median value 2.21 au) in tumoral tissues and from 0.11 to
201.1 au (median value 0.81) in non-tumoral samples. At ≥15 months, its expression was found to be
strongly up-regulated and highly variable in tumoral tissue ranging from 0.54 to 431.2 au (mean value
20.13 au), in non tumoral tissue values ranged between 0.25 and 16.58 au with a median value of 1.74
au.
Figure 5.6. Expression of Afp mRNA in liver tissue of WT and TG mice. The expression is normalized on
GAPDH and Bact reference genes and is expressed as au compared to one sample WT at 3 months set as 1.00 au. White
box: WT tissue; grey box: TG non tumoral tissue; black box: TG tumoral tissue.
Total n: 456 tissues (WT 3 months [38], 6 months [31], 9 months [43], 12 months [42], ≥15 months [39]; TG 3 months [44],
6 months [43], 9 months [43], 12 months non-tumoral [61], 12 months tumoral [32], ≥15 months non-tumoral [19], ≥15
months tumoral [21]. Student’s t-test with Welch correction *p<0.05, ***p<0.001.

68
5.5 CD90 expression
The CD90 gene expression was evaluated in a total of 283 tissue samples from 67 TG and 55 WT
animals by RT-qPCR. This gene was expressed in all examined tissues. In WT, CD90 expression
median value were 0.63, 0.54, 1.12, 0.66, 0.60 au at 3, 6, 9, 12, and ≥15 months, respectively, with no
significant differences among age points. Meanwhile in TG, its median values were 0.81, 0.54, 1.27,
0.86, and 0.74 at 3, 6, 9, 12, and ≥15 months, respectively, with no significant increase during
aging/liver injury. In each time points, no statistical differences of CD90 expression in TG livers
compared to WT counterparts were observed (Fig. 5.7).
Figure 5.7. Expression of CD90 mRNA in liver tissue of WT and TG mice. The expression is normalized on
GAPDH and Bact reference genes and is expressed as au compared one sample WT at 3 months sett as 1.00 au. White box:
WT tissue; grey box: TG non tumoral tissue; black box: TG tumoral tissue.
Total n: 283 tissues (WT 3 months [33], 6 months [30], 9 months [16], 12 months [17], ≥15 months [30]; TG 3 months [40],
6 months [35], 9 months [16], 12 months non-tumoral [24], 12 months tumoral [10], ≥15 months non-tumoral [13], ≥15
months tumoral [20].

69
Protein analysis of CD90 with Western Blot confirmed that there was no difference in the expression of
the protein occurs during ageing and liver injury in TG tissue. The expression of this protein between
WT and TG hepatic tissue was comparable (Fig. 5.8).
Figure 5.8. CD90 protein expression in total liver tissue. Actin was used as housekeeping protein. ctrl=WT,
TG=transgenic

70
5.6. Epcam expression
The Epcam gene expression was evaluated in a total of 337 tissue samples from 74 TG and 72 WT
animals by RT-qPCR. This gene was expressed in all the examined tissues. In WT livers, Epcam
expression was almost consistent both within the same age groups and among different ages, with
median expressions of 0.41, 0.24, 0.24, 0.51, and 0.78 au at 3, 6, 9, 12, and ≥15 months respectively.
In TG samples, compared to WT, Epcam expression showed a significant up-regulation at 6 and 9
months with a median values of 2.81 and 2.95 au, respectively (p<0.001) and significant difference was
also noticed when they were compared to 3 months TG group (p<0.001). At 12 months both TG
tumoral and non-tumoral were significantly up-regulated compare to WT (p<0.001). In non tumoral
samples expression was more variable and ranged between 0.08 and 20.92 au (mean value 2.12 au),
whether in tumoral samples expression ranged between 0.1 and 9.1 au (mean value 2.53 au). At ≥15
months, the variability in TG non-tumoral samples was even higher (mean value 4.36 au; range: 0.28-
46.27 au) and a significant decrease was observed in tumoral tissue compared to non tumoral (mean
value 1.23 au; p<0.05). (Fig. 5.9)
Figure 5.9. Expression of Epcam mRNA in liver tissue of WT and TG. The expression is normalized on GAPDH
and Bact reference genes and is expressed as au compared to one sample WT at 3 months set as 1.00 au. White box: WT
tissue; grey box: TG non tumoral tissue; black box: TG tumoral tissue.
Total n: 337 tissues (WT 3 months [22], 6 months [24], 9 months [22], 12 months [41], ≥15 months [40]; TG 3 months [20],
6 months [26], 9 months [22], 12 months non-tumoral [48], 12 months tumoral [29], ≥15 months non-tumoral [22], ≥15
months tumoral [21]. Student’s t-test with Welch correction *p<0.05, **p<0.01, ***p<0.001

71
5.7. Sca1 expression
The Sca1 gene expression was evaluated in a total of 385 tissue samples from 93 TG and 81 WT
animals by RT-qPCR. This gene was expressed in all the examined tissues. In WT livers, the expression
was consistent both within and among ages, with median expressions of 0.39, 0.21, 0.14, 0.29 and 0.26
au at 3, 6, 9, 12, and ≥15 months, respectively.
In TG samples, the Sca1 expression showed a slight but significant up-regulation starting from 3
months with a median value of 0.77 au (p<0.01). These up-regulations were continuously observed at
6, 9, 12 and ≥15 months in non tumoral tissue (6, 12 and ≥15months p<0.001, 9 months p<0.01
compared to WT). At 12 months, Sca1 in tumoral samples was up-regulated compared to WT (median
value 0.41 au, p<0.01) and to the non-tumoral counterpart (median value TG non tumoral 0.39). At ≥15
months, the tumoral expression was more variable compared to non-tumoral tissues, ranging from 0.15
to 6.13 au, even though the median value was lower (median value non tumoral 1.00 au, tumoral 0.35
au). Albeit the Sca1 expression was up-regulated in the TG compared to WT groups in each age points,
no statistical differences were observed among TG age groups (Fig. 5.10).
Figure 5.10. Expression of Sca1 mRNA in liver tissue of WT and TG mice. The expression is normalized on
GAPDH and Bact reference genes and is expressed as au compared one sample WT at 3 months set as 1.00 au. White box:
WT tissue; light grey box: TG non tumoral tissue; dark grey box: TG tumoral tissue.

72
Total n: 385 tissues (WT 3 months [34], 6 months [30], 9 months [16], 12 months [39], ≥15 months [42]; TG 3 months [39],
6 months [35], 9 months [18], 12 months non-tumoral [56], 12 months tumoral [33], ≥15 months non-tumoral [22], ≥15
months tumoral [21]. Student’s t-test with Welch correction **p<0.01, ***p<0.001.
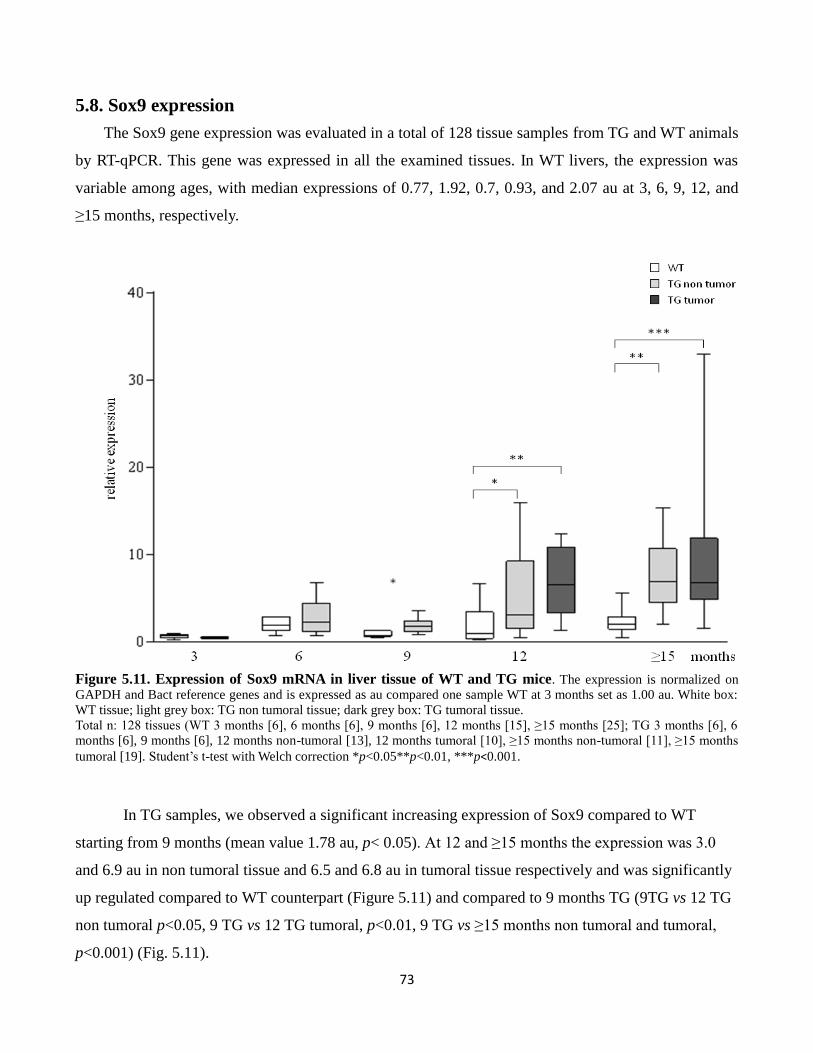
73
5.8. Sox9 expression
The Sox9 gene expression was evaluated in a total of 128 tissue samples from TG and WT animals
by RT-qPCR. This gene was expressed in all the examined tissues. In WT livers, the expression was
variable among ages, with median expressions of 0.77, 1.92, 0.7, 0.93, and 2.07 au at 3, 6, 9, 12, and
≥15 months, respectively.
Figure 5.11. Expression of Sox9 mRNA in liver tissue of WT and TG mice. The expression is normalized on
GAPDH and Bact reference genes and is expressed as au compared one sample WT at 3 months set as 1.00 au. White box:
WT tissue; light grey box: TG non tumoral tissue; dark grey box: TG tumoral tissue.
Total n: 128 tissues (WT 3 months [6], 6 months [6], 9 months [6], 12 months [15], ≥15 months [25]; TG 3 months [6], 6
months [6], 9 months [6], 12 months non-tumoral [13], 12 months tumoral [10], ≥15 months non-tumoral [11], ≥15 months
tumoral [19]. Student’s t-test with Welch correction *p<0.05**p<0.01, ***p<0.001.
In TG samples, we observed a significant increasing expression of Sox9 compared to WT
starting from 9 months (mean value 1.78 au, p< 0.05). At 12 and ≥15 months the expression was 3.0
and 6.9 au in non tumoral tissue and 6.5 and 6.8 au in tumoral tissue respectively and was significantly
up regulated compared to WT counterpart (Figure 5.11) and compared to 9 months TG (9TG vs 12 TG
non tumoral p<0.05, 9 TG vs 12 TG tumoral, p<0.01, 9 TG vs ≥15 months non tumoral and tumoral,
p<0.001) (Fig. 5.11).
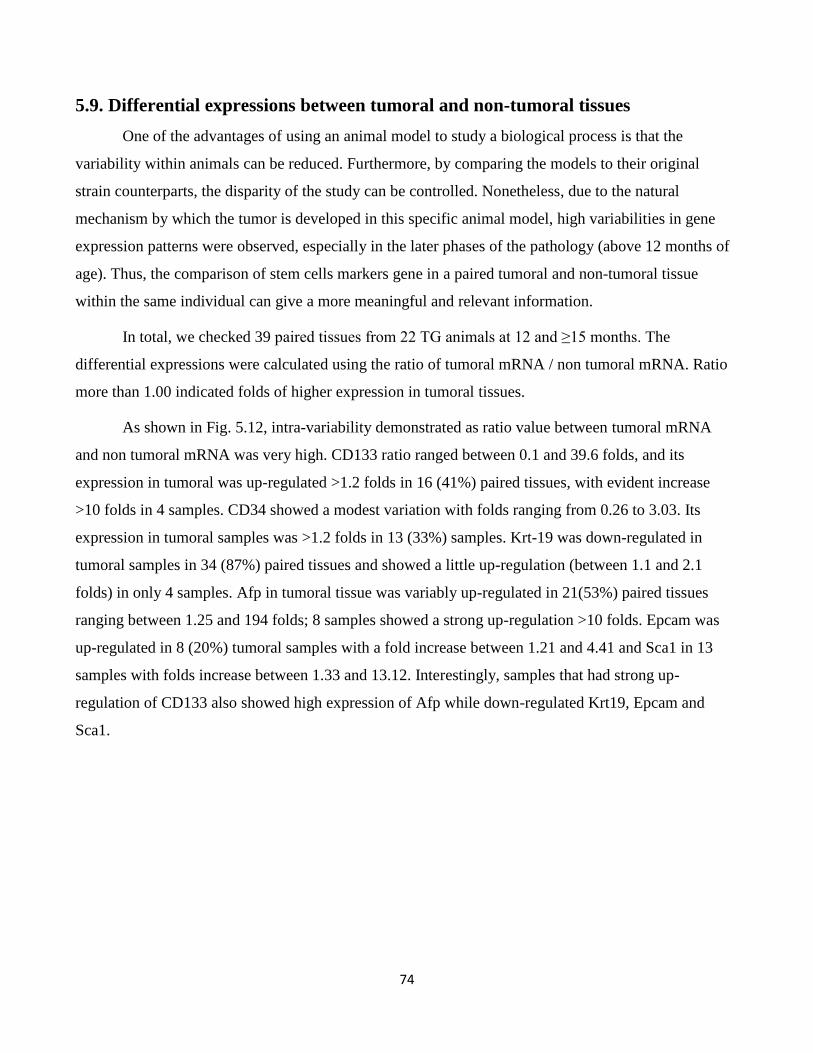
74
5.9. Differential expressions between tumoral and non-tumoral tissues
One of the advantages of using an animal model to study a biological process is that the
variability within animals can be reduced. Furthermore, by comparing the models to their original
strain counterparts, the disparity of the study can be controlled. Nonetheless, due to the natural
mechanism by which the tumor is developed in this specific animal model, high variabilities in gene
expression patterns were observed, especially in the later phases of the pathology (above 12 months of
age). Thus, the comparison of stem cells markers gene in a paired tumoral and non-tumoral tissue
within the same individual can give a more meaningful and relevant information.
In total, we checked 39 paired tissues from 22 TG animals at 12 and ≥15 months. The
differential expressions were calculated using the ratio of tumoral mRNA / non tumoral mRNA. Ratio
more than 1.00 indicated folds of higher expression in tumoral tissues.
As shown in Fig. 5.12, intra-variability demonstrated as ratio value between tumoral mRNA
and non tumoral mRNA was very high. CD133 ratio ranged between 0.1 and 39.6 folds, and its
expression in tumoral was up-regulated >1.2 folds in 16 (41%) paired tissues, with evident increase
>10 folds in 4 samples. CD34 showed a modest variation with folds ranging from 0.26 to 3.03. Its
expression in tumoral samples was >1.2 folds in 13 (33%) samples. Krt-19 was down-regulated in
tumoral samples in 34 (87%) paired tissues and showed a little up-regulation (between 1.1 and 2.1
folds) in only 4 samples. Afp in tumoral tissue was variably up-regulated in 21(53%) paired tissues
ranging between 1.25 and 194 folds; 8 samples showed a strong up-regulation >10 folds. Epcam was
up-regulated in 8 (20%) tumoral samples with a fold increase between 1.21 and 4.41 and Sca1 in 13
samples with folds increase between 1.33 and 13.12. Interestingly, samples that had strong up-
regulation of CD133 also showed high expression of Afp while down-regulated Krt19, Epcam and
Sca1.

75
Figure 5.12. The mRNA expression ratio between tumoral and non tumoral tissues. Ratio between mRNA
expressions was evaluated in 39 paired tissues. Value of ratio >1.00 indicated higher expression in tumoral compared to non
tumoral.

76
5.10. Association between CSCs markers and liver pathology
We evaluated the CSCs markers mRNA expression of 31 TG samples in: HCC tissues (n=5),
dysplastic tissues (n=12) and tissue with early hepatic alterations (n=14). These pathologies were
determined based on the histological diagnosis. Early hepatic alterations were mainly characterized by
nuclear pleomorphism, cellular edema and apoptotic bodies. As shown in Fig. 5.13, similarly to WT, in
early hepatic damage, CD133 and Afp expression is very low, with a mean value of 1.1 and 0.8 au
respectively. Dysplastic tissues showed high variability, but still lower compared to HCC tissues. The
median values of CD133 were 5.4 and 10.5, and for Afp were 4.2 and 71.4 au, for dysplasia and HCC
respectively). As CD133 and Afp, CD34 expression showed an increasing pattern during the
progression of the pathology with the highest median value in HCC samples. On the contrary, Krt19
and Epcam expressions were lower in HCC group compared to both dysplasia and early events (1.5 and
0.5 au for Krt19, and 1.0 and 2.6 for Epcam, in dysplasia and HCC respectively). In particular Epcam
expression in early events was very homogeneous and comparable to WT tissues.
Figure 5.13. Expression of SCs/CSCs markers mRNA in TG liver tissue in different pathologies. The
expression is normalized on GAPDH and Bact reference genes and is expressed as au compared one sample WT at 3
months set as 1.00 au. Total n: 31 TG tissues (HCC [5], dysplasia [12], early events [14]).

77
Interestingly, when we divided the group with dysplasia based on the presence (n=6) or absence
(n=6) of steatosis, we observed a statistically significant low expression of CD133 in the steatotic
group compared to the group with only dysplasia (3.4 and 22.9 au, respectively, p<0.01). On the
contrary, Epcam expression was variable in both dysplastic sub-groups with a higher mean value in the
steatotic group compared to non-steatotic group (4.8 and 1.2 respectively) (Fig. 5.14).
Figure 5.14. Expression of SCs/CSCs markers mRNA in TG liver tissue in different pathologies. The
expression is normalized on GAPDH and Bact reference genes and is expressed as au compared one sample WT at 3
months set as 1.00 au. Total n: 31 TG tissues (HCC [5], dysplasia [6], dysplasia and steatosis [6], early events [14]).

78
5.11 Immunohistochemistry analysis
CD34 immunostaining
The expression and distribution of CD34 protein were evaluated in hepatic tissue sections by
immunohistochemistry staining. At least 3 slides for age/genotype were analyzed; heart tissue was used
as control (Fig. 5.15).
Figure 5.15. Immunostaining of CD34 protein in liver tissue of WT and TG mice. Representative pictures of
WT (A) and TG livers at 3 (B), 6 (C) and 9 (D) months. Heart tissue was used as positive (E) and IgG control (F). Objective
40X.
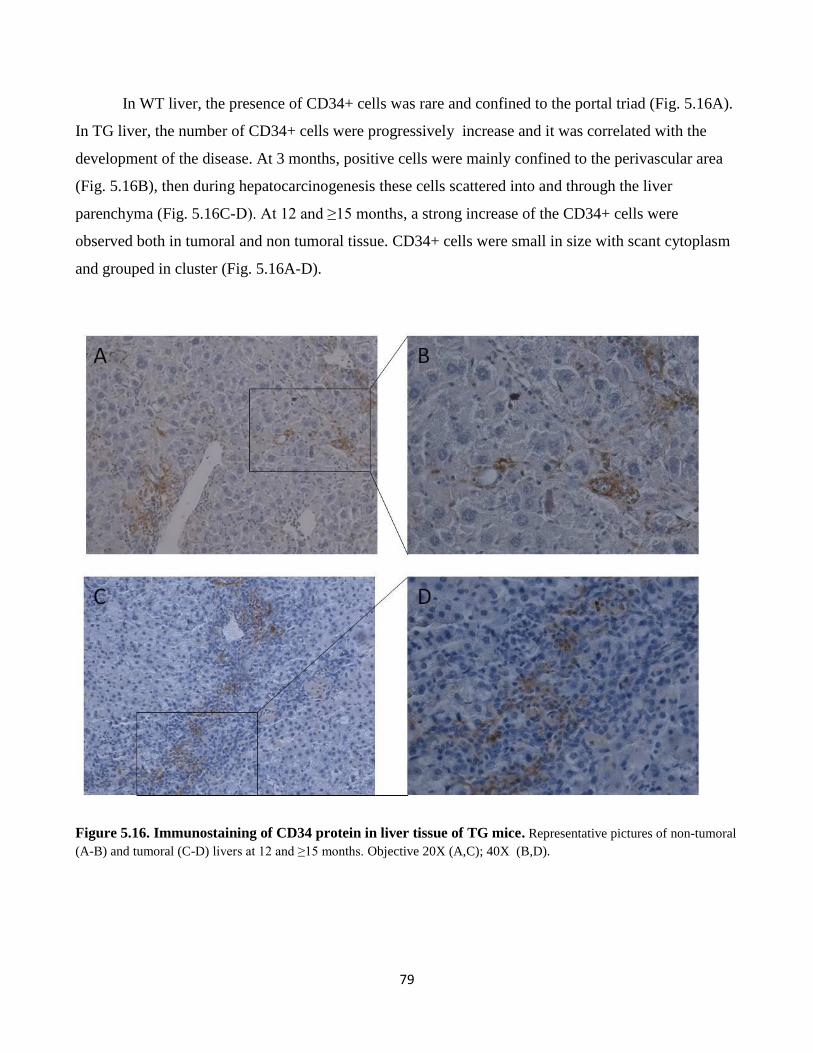
79
In WT liver, the presence of CD34+ cells was rare and confined to the portal triad (Fig. 5.16A).
In TG liver, the number of CD34+ cells were progressively increase and it was correlated with the
development of the disease. At 3 months, positive cells were mainly confined to the perivascular area
(Fig. 5.16B), then during hepatocarcinogenesis these cells scattered into and through the liver
parenchyma (Fig. 5.16C-D). At 12 and ≥15 months, a strong increase of the CD34+ cells were
observed both in tumoral and non tumoral tissue. CD34+ cells were small in size with scant cytoplasm
and grouped in cluster (Fig. 5.16A-D).
Figure 5.16. Immunostaining of CD34 protein in liver tissue of TG mice. Representative pictures of non-tumoral
(A-B) and tumoral (C-D) livers at 12 and ≥15 months. Objective 20X (A,C); 40X (B,D).

80
CD133 immunostaining
The expression and distribution of CD133 protein were evaluated in hepatic tissue sections by
immunohistochemistry staining. One slides for age/genotype were analyzed; kidney tissue was used as
control (Fig. 5.17 A).
In the control kidney tissue, positive small cells were clearly observed in the parenchyma. On
the contrary, in TG liver tissues only a few and very small positive cells could be identified. At 3, 6,
and 9 months no positive cells were observed (Fig. 5.17 B). At 12 months only few small cells were
identified in the slide tissues (Fig. 5.17 C-F). No positive cells were observed in WT samples.
Figure 5.17. Immunostaining of CD133 protein in liver tissue of TG mice. Representative pictures of TG livers
at 3 (B), And 12 (C-F) months. Kidney tissue was used as positive (A) control. Objective: 20X (A-C,E), 40X(D,F).

81
Chapter 6
Results 3
Isolation of and characterization of hepatic
progenitor cells

82
A growing interest in the isolation and characterization of hepatic progenitor cells (HPCs)
results in a large number of different available protocols. Various condition may select sub-populations
of HPCs with different phenotype and properties, reflecting the plasticity of stem/progenitor cells
compartment.
6.1 Hepatic primary cell culture from neonatal mice P2
We preliminarily evaluated the ability of 3 different mediums reported in literatures (Tsuchiya
et al., 2007; Li et al., 2006; Parent et al., 2004) to maintain HPCs from neonatal mice. Primary cells
were obtained from neonatal WT mice 2 days after birth (P2) in which the hepatoblasts represent the
major hepatic population. To confirm HPCs phenotype we evaluated mRNA expression of the SCs
markers together with hepatocytes, cholangiocytes and fibroblast markers. In this thesis, we refered the
evaluated mediums as Medium 1 (by Tsuchiya et al.),, Medium 2 (by Li et al.), and Medium 3 (by
Parent et al.).
Medium 1
One day after plating, different cell types were attached, small and round cells (about 10 µm)
were observed (Fig. 6.1A-B). After 3 days, culture was enriched in cell colonies resembling embryonic
bodies similar to that observed in embryonic stem cell culture with unattached cells (in suspension) and
attached spheroids that failed to grow (Fig. 6.1C-D). After 10 days, they began to form larger colonies
containing epithelial-like small cells in the center with a high nuclear/cytoplasmic ratio (Fig. 6.1 E),
fibroblast-like (< 20µm) and small round cells (Fig. 6.1F).
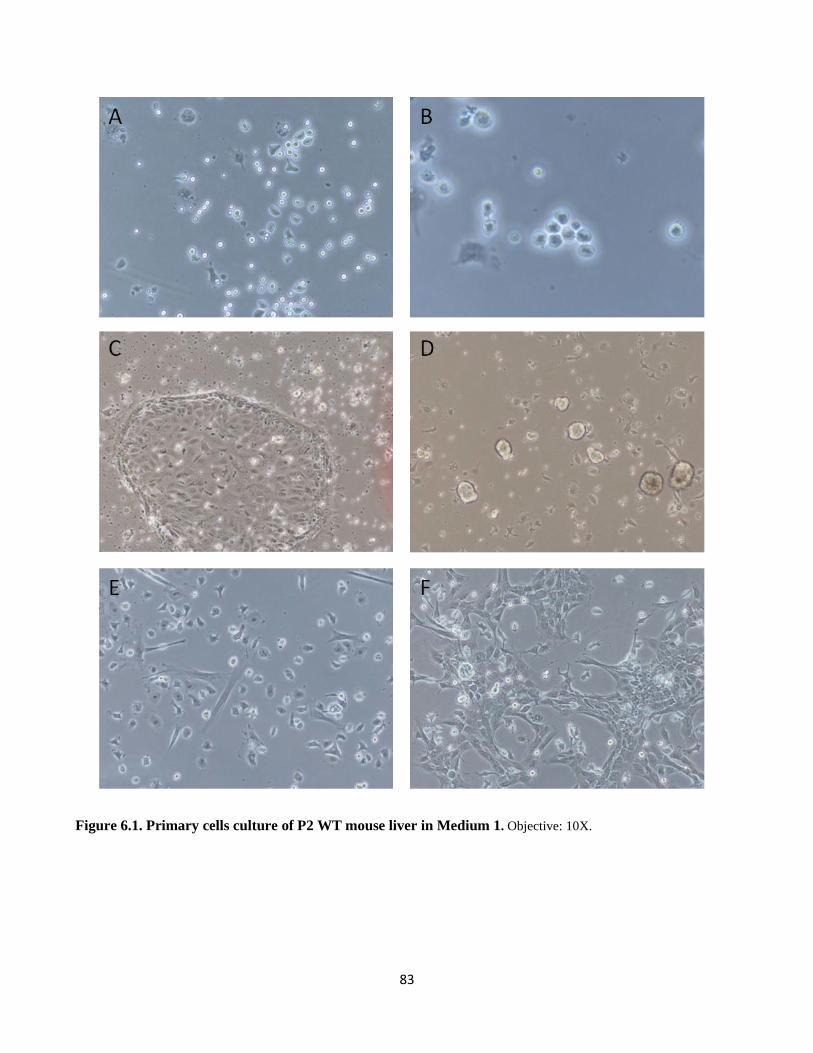
83
Figure 6.1. Primary cells culture of P2 WT mouse liver in Medium 1. Objective: 10X.
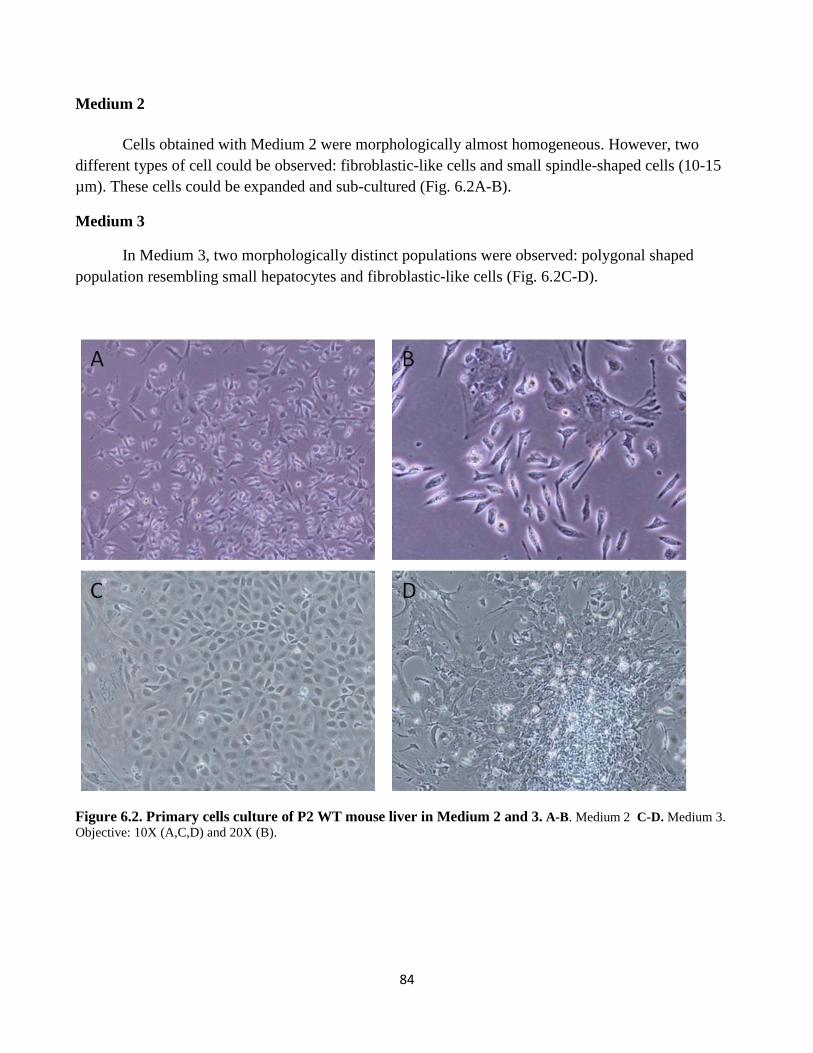
84
Medium 2
Cells obtained with Medium 2 were morphologically almost homogeneous. However, two
different types of cell could be observed: fibroblastic-like cells and small spindle-shaped cells (10-15
µm). These cells could be expanded and sub-cultured (Fig. 6.2A-B).
Medium 3
In Medium 3, two morphologically distinct populations were observed: polygonal shaped
population resembling small hepatocytes and fibroblastic-like cells (Fig. 6.2C-D).
Figure 6.2. Primary cells culture of P2 WT mouse liver in Medium 2 and 3. A-B. Medium 2 C-D. Medium 3.
Objective: 10X (A,C,D) and 20X (B).

85
mRNA expression of hepatic primary cell culture from P2 WT mice: Medium 1, 2, and 3
To confirm the characteristics (genotypes) of the cultured cells we evaluated mRNA expression
of specific markers for HPCs (Afp, CD133, CD34, CD90, and Sca1), hepatocytes (Krt18 and albumin)
and cholangiocytes/HPCs (Krt19 and Krt7). mRNA expression of each target gene was normalized to a
reference gene GAPDH and compared to the expression of its expression in corresponded total liver
tissue, set as 1 au.
As shown in Fig. 6.3, the Afp expression in cell culture was significantly down-regulated
compared to hepatic liver tissue, about 300-folds less for both Medium 1 and Medium 2, and 30-folds
less for medium 3. On the contrary, CD133 was up-regulated in Medium 1 (10.52 au) compared to
tissue and the other mediums. Medium 2 and Medium 3 showed a decrease of CD133 expression
compared to tissue. CD34, CD90, and Sca1 showed similar expression among mediums: the highest
was observed in Medium 1, followed by Medium 2 and Medium 3. With the exception of CD34
expression in Medium 3, all genes were up-regulated compared to total tissue. CD90 expression in
medium 1 and 2 were highly up-regulated about 100-folds higher than that in tissue..
Cholangiocytes/HPCs markers Krt19 and Krt7 expression were up-regulated in all mediums
analyzed. Specifically, they were was strongly up-regulated in Medium 1 and Medium 3 with mean
values of 150 and 330 au for Krt19 and Krt7 for Medium 1 and 72 and 160 au for Medium 3.
Hepatocyte marker Krt18 expression was slightly up-regulated in Medium 1 (2-folds) and
Medium 3 (5-folds), but 5-times down-regulated in medium 2. Alb was still detectable but compared to
total liver tissue its expression was very down-regulated in all mediums (about 250, 5000, and 5-times
less for Medium 1, Medium 2, and Medium 3 respectively).
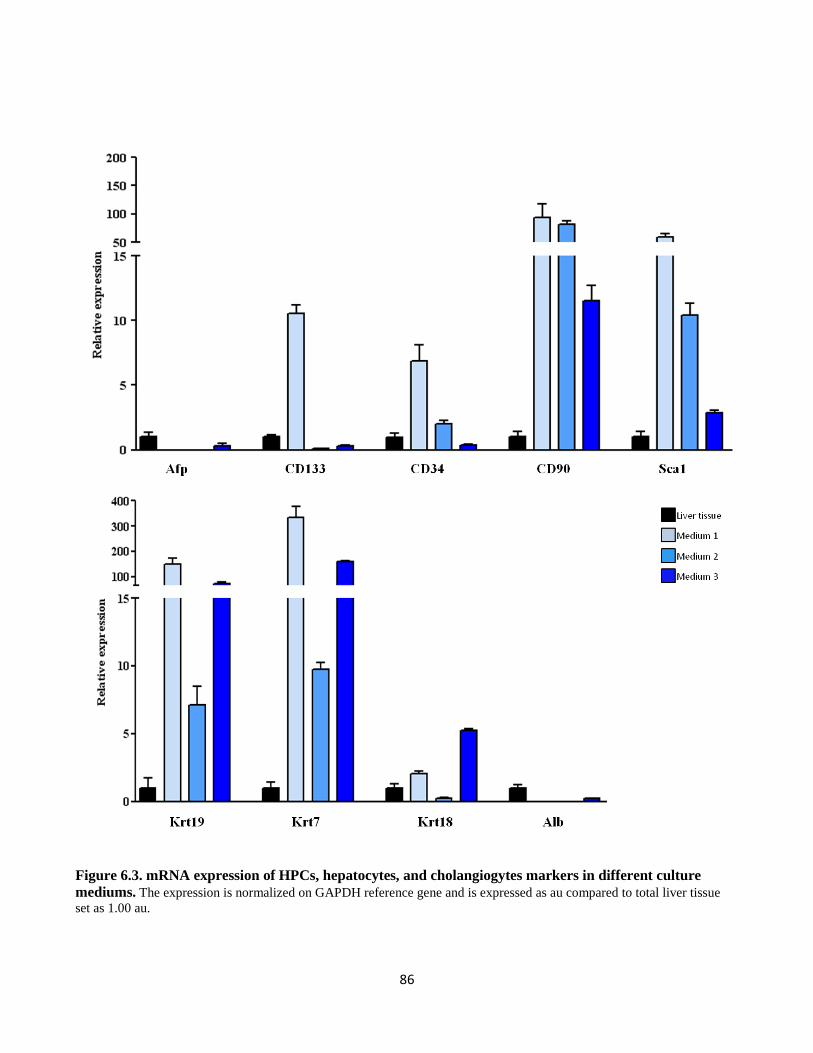
86
Figure 6.3. mRNA expression of HPCs, hepatocytes, and cholangiogytes markers in different culture
mediums. The expression is normalized on GAPDH reference gene and is expressed as au compared to total liver tissue
set as 1.00 au.

87
6.2. Hepatic primary cell culture from adult WT and TG mice
Unlike the primary cells from P2 neonatal mouse livers, cells from both adult WT or TG livers
did not grow in the previous tested mediums (Medium 1, 2, and 3). Therefore, we changed the
condition using others two medium: Medium 4, a medium for hemotopietic stem cells isolation (mouse
Myelocult, Stem Cell Technologies) and Medium 5, proposed by Rountree et al. (Rountree et al.,
2007).
Medium 4
We isolated non parenchymal hepatic cells from 3, 6, 9, and 12 months WT and TG mice.
Morphologically, cells obtained from all WT and TG at 3, 6, 9 and 12 non-tumoral tissues were similar,
composed mainly by two different populations: one with fibroblastic morphology and one of small and
round cells. The smallest cells grew in a cluster forming monolayer of small hexagonal epithelial cells,
and were surrounded by the fibroblastic cells (Fig. 6.4A-L). This small cells population strongly
attached to the culture flask and can be subcultured to mantain their viability. Primary cells from 12
month tumoral hepatic tissue were more heterogeneous, both in the same culture and within different
nodules of origin (Fig. 6.4H-M).

88
Figure 6.4. Hepatic primary cells culture of adult WT and TG mouse in Medium 4. A-D. Non parenchymal cells of WT. E-N. Non parenchymal cells
of TG. Figures show representative pictures from 3 (A, E), 6 (B, F), 9 (C, G), and 12 (D, H) months and from different tumoral nodules from 12 months TG (I-N)
after 6-8 days plating. Objective: 10X.
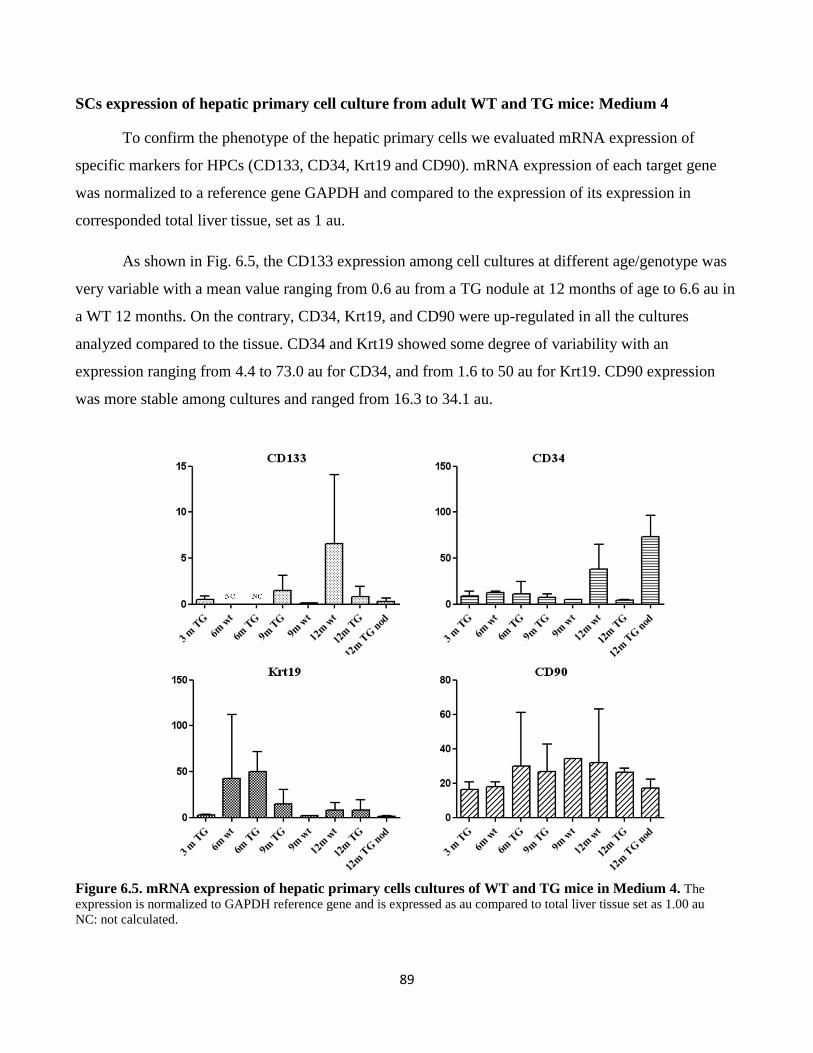
89
SCs expression of hepatic primary cell culture from adult WT and TG mice: Medium 4
To confirm the phenotype of the hepatic primary cells we evaluated mRNA expression of
specific markers for HPCs (CD133, CD34, Krt19 and CD90). mRNA expression of each target gene
was normalized to a reference gene GAPDH and compared to the expression of its expression in
corresponded total liver tissue, set as 1 au.
As shown in Fig. 6.5, the CD133 expression among cell cultures at different age/genotype was
very variable with a mean value ranging from 0.6 au from a TG nodule at 12 months of age to 6.6 au in
a WT 12 months. On the contrary, CD34, Krt19, and CD90 were up-regulated in all the cultures
analyzed compared to the tissue. CD34 and Krt19 showed some degree of variability with an
expression ranging from 4.4 to 73.0 au for CD34, and from 1.6 to 50 au for Krt19. CD90 expression
was more stable among cultures and ranged from 16.3 to 34.1 au.
Figure 6.5. mRNA expression of hepatic primary cells cultures of WT and TG mice in Medium 4. The
expression is normalized to GAPDH reference gene and is expressed as au compared to total liver tissue set as 1.00 au
NC: not calculated.

90
The CD133, CD34 and CD90 protein expressions were confirmed with immunohistochemistry
in primary cells of 12 months old mice. CD133+ and CD34+ cells were mainly small cells grouped in
cluster and surrounded by fibroblast like cells. CD90+ cells showed different morphology and different
staining intensity (Fig. 6.6). These cells were able to form spherical colony when cultured at low
density (10,000 cells/mL) in 3D culture (Fig. 6.7)
Figure 6.6. Immunostaining of CSC markers in hepatic primary cells in Medium 4. Representative image
for A. CD133 B. CD34 C. CD90. Objective 20X.
Figure 6.7. 3D clonogenic potential of hepatic primary
cells in Medium 4. Objective: 10X.
To evaluate this medium in maintaining the stemness during sub-culture, we also analyzed the
expression of specific markers for HPCs (CD133, CD34, Krt19 and CD90) hepatocytes (Krt18 and
albumin), cholangiocytes/HPCs (Krt19 and Krt7), and fibroblast (Fsp1).
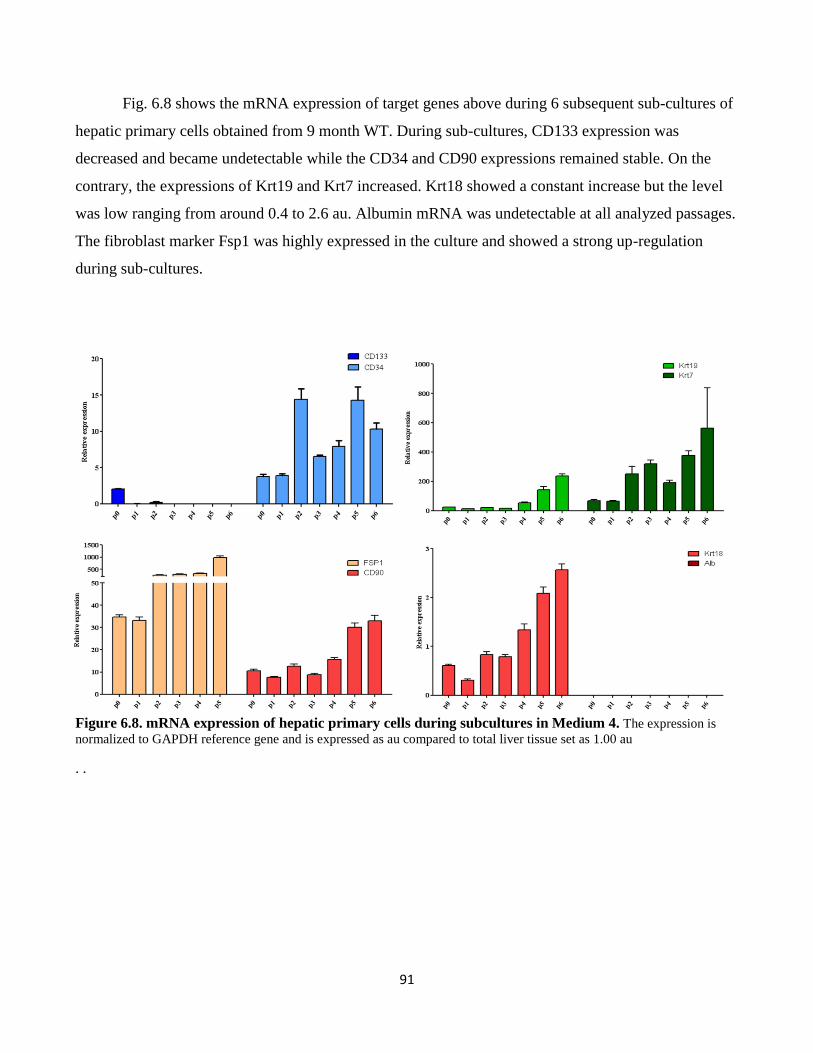
91
Fig. 6.8 shows the mRNA expression of target genes above during 6 subsequent sub-cultures of
hepatic primary cells obtained from 9 month WT. During sub-cultures, CD133 expression was
decreased and became undetectable while the CD34 and CD90 expressions remained stable. On the
contrary, the expressions of Krt19 and Krt7 increased. Krt18 showed a constant increase but the level
was low ranging from around 0.4 to 2.6 au. Albumin mRNA was undetectable at all analyzed passages.
The fibroblast marker Fsp1 was highly expressed in the culture and showed a strong up-regulation
during sub-cultures.
Figure 6.8. mRNA expression of hepatic primary cells during subcultures in Medium 4. The expression is
normalized to GAPDH reference gene and is expressed as au compared to total liver tissue set as 1.00 au
. .

92
Medium 5
We isolated non parenchymal cells from the liver of 15 and 18 months WT and TG mice and
analyzed the mRNA expression after 5 days of plating.
Fig. 6.8 showed the mRNA expression in WT and TG hepatic primary cells compared to the
relative tissue of origin. TG primary cells were prepared from non tumoral tissue and from two large
nodules. The expression of the SCs markers Cd133, Cd34, Cd90, Krt19, Epcam, Sca1, and Sox9 were
up-regulated in all the culture. The hepatocyte marker Krt18 was mostly down-regulated and Albumin
mRNA was undetectable (data not show). Both fibroblast marker Fsp1 and hematopoietic marker
CD45 were up-regulated in the primary culture.
Figure 6.9. mRNA expression of hepatic primary cells cultures of WT and TG mice in Medium 5. The
expression is normalized to GAPDH reference gene and is expressed as au compared to total liver tissue set as 1.00 au
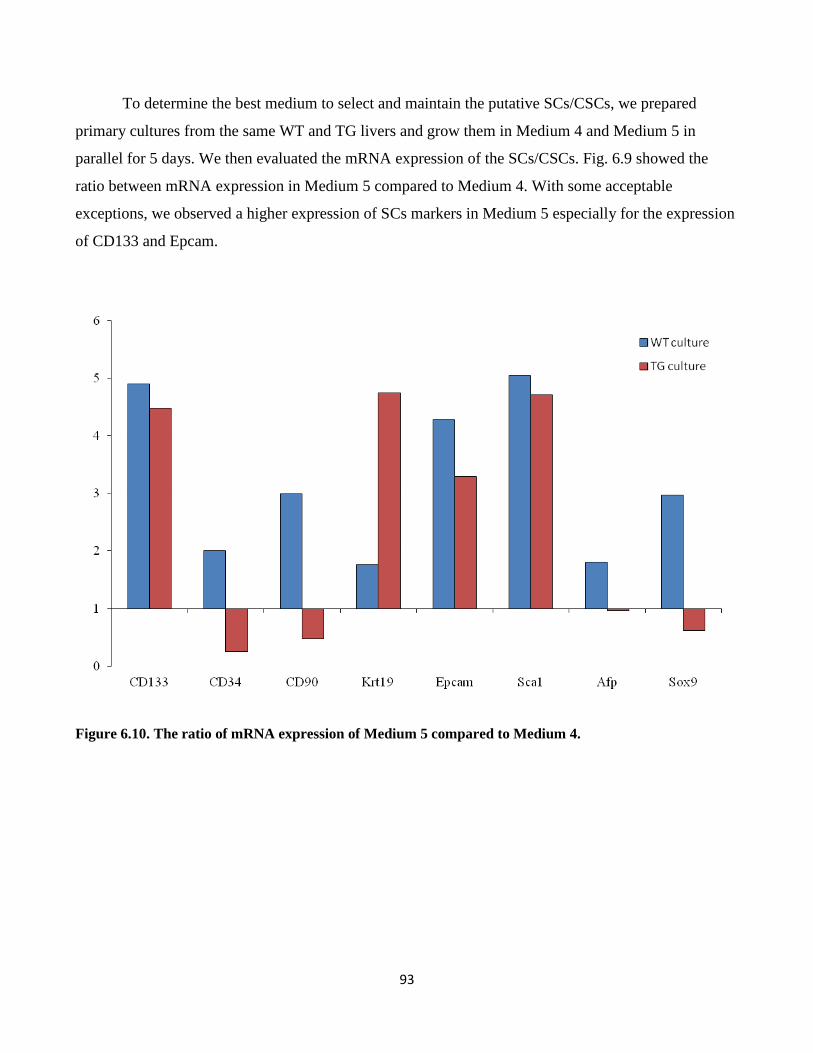
93
To determine the best medium to select and maintain the putative SCs/CSCs, we prepared
primary cultures from the same WT and TG livers and grow them in Medium 4 and Medium 5 in
parallel for 5 days. We then evaluated the mRNA expression of the SCs/CSCs. Fig. 6.9 showed the
ratio between mRNA expression in Medium 5 compared to Medium 4. With some acceptable
exceptions, we observed a higher expression of SCs markers in Medium 5 especially for the expression
of CD133 and Epcam.
Figure 6.10. The ratio of mRNA expression of Medium 5 compared to Medium 4.

94
Chapter 7
Results 4
Development of a new method of
alphafetoprotein detection in mouse serum
with AlphaLISA® technology

95
Among various serum biomarkers had been proposed for HCC detection, the alphafetoprotein
(AFP) is the most widely studied and used in clinical practice (Malaguarnera et al., 2010). It is known
that persistently elevated AFP levels are a risk factor for HCC development and can be used to help
define at-risk populations, even though AFP has been mostly tested in the diagnostic mode rather than
surveillance (Tsukuma et al., 1993; Chen et al., 2003). Albeit not all HCC cells are AFP-producing,
AFP production was associated to less differentiated HCC with stem/progenitor cells features
(Yamashita et al., 2008); thus real time monitoring on the AFP level in serum in vivo will help to
follow tumor development and to observe the response of therapies.
In accordance with rapid development of new tools and methods on molecular and cellular
biology, the study of animal models that mimic disease progression in human is essential. These
models give important insight on the basic study of disease initiation and different pathologies. More
importantly, they are valuable for novel drug development and targeted therapy. However, not like in
human, the choice of reliable and efficient assay to detect specific biomarkers are limited and costly,
including on the detection of mouse AFP in serum to monitor liver disease. In this chapter, we describe
the set up of a new method to detect AFP in mouse serum with the AlphaLISA® Technology (Perkin
Elmer).
7.1. The AlphaLISA® methodology
AlphaLISA® is a bead-based assay technologies used to study biomolecular interactions in a
microplate format developed by Perkin-Elmer. The acronym "Alpha" stands for amplified luminescent
proximity homogeneous assay. Binding of molecules captured on the beads leads to an energy transfer
from one bead to the other, ultimately producing a fluorescent signal. AlphaLISA® assays require two
bead types: donor beads and acceptor beads. Each bead type contains a different proprietary mixture of
chemicals, which are key elements of the AlphaLISA® technology. Donor beads contain a
photosensitizer, phthalocyanine, which converts ambient oxygen to an excited and reactive form of O2,
singlet oxygen, upon illumination at 680 nm. Like other excited molecules, singlet oxygen has a limited
lifetime prior to falling back to ground state. Within its 4 µsec half-life, singlet oxygen can diffuse
approximately 200 nm in solution. If an acceptor bead is within that proximity, energy is transferred
from the singlet oxygen to thioxene derivatives within the acceptor bead, subsequently culminating in
light production at 615 nm. In the absence of an acceptor bead, singlet oxygen falls to ground state and

96
no signal is produced. This proximity-dependent chemical energy transfer is the basis for
AlphaLISA®'s homogeneous nature.
As shown in Fig. 7.1, an biotinylated anti-AFP antibody binds the streptavidin donor bead while
another anti-AFP antibody is conjugated to AlphaLISA® acceptor beads. In the presence of the
analyte, the beads come into close proximity. The excitation of the donor beads provokes the release of
singlet oxygen molecules that triggers a cascade of energy transfer in the acceptor beads, resulting in
light emission.
Figure 7.1. Schematic overview of the AlphaLISA® assay principles. Cartoon was taken from
www.perkinelmer.com.
7.2. Selection and optimization of antibodies pair and assay buffer
AlphaLISA ® assay is a multistep method: first 5 µl of analyte at the proper dilution is
incubated with antibodies mix and incubate for one hour, then acceptor beads are added and incubated
for one hour. Last step is the donor beads incubation followed by reading on an EnSpire multimode
plate reader.
As AFP-specific control, we used a commercially available AFP recombinant protein. The
specificity of both antibodies was evaluated by dot and Western Blot. Antibodies were developed in
different species to avoid cross reaction and to increase specificity. As shown in Fig. 7.2 both selected
antibodies were specific for AFP protein. The first anti-AFP antibody recognized both mouse and
human AFP, while the biotynilated anti-AFP antibody was specific for mouse AFP.

97
Figure 7.2. Dot blot and Western blot of the anti-AFP
antibody (A) and the biotinylated anti-AFP antibody (B).
To set up the optimal concentration of antibodies, the titration of each binding antibody in a
cross titration matrix was performed. Cross titration with serial dilution of each antibody, together with
single antibody and negative control allows the view of all combinations. For this assay, we titrated the
biotinylated antibody from 0.3 to 3 nM and the second pure antibody from 0.1 to 3 nM. Bar graph in
Fig. 7.3 plots all 20 combinations as signal-to-background value (S/B), dividing the “analyte” samples
by the “buffer” sample. The two highest S/B signals were obtained with the combination of 0.3 nM of
pure antibody and 1 nM of biotinylated antibody (4196 S/B intensity) and with f 0.3 nM of rabbit
antibody and 3 nM of biotinylated antibody (4319 S/B intensity). As the two signals were very similar
we selected the fist antibodies combination.
Figure 7.3. Antibodies cross tritation. Tritation matrix for the anti-rabbit and the biotinylated anti-goat antibodies.
For the optimization of the background signal, we used three different buffer solutions:
AlphaLISA immunoassay buffer, AlphaLISA HiBlock buffer, and AlphaLISA NaCl buffer. The mean
background signals obtained were 7136, 23796, and 7476, respectively, leading to the use of
AlphaLISA immunoassay buffer for the sequent experiments. .

98
7.3. Construction of standard curve and sensitivity of the assay
The titration of the AFP protein using the selected antibodies concentration was done to
determine the dynamic range and sensitivity of the assay. The assay dynamic range corresponds to the
concentration window in the standard curve running from the lower detection limit (LDL) to the
maximum concentration up to the hook point. The LDL is the lowest concentration analyte that can be
detected in the assay condition, whether the hook point corresponds to the concentration where the
signal intensity reaches the higher intensity and then decrease even if the analyte concentration is
increasing. This phenomenon is due to the imbalance between the analyte and beads concentration.
When the analyte is too concentrated, donor and acceptor beads do not attach to the same molecule
resulting in an intensity decrease of the signal (Fig. 7.4).
Figure 7.4. The hook effect. The illustration shows how increasing concentrations of analyte can disrupt the interactions
between donor and acceptor beads when the system is saturated (Cartoon was taken from www.perkinelmer.com).
For the analyte titration, we prepared serial dilution of known concentration of recombinant
AFP protein from 3 to 10,000 ng/mL in AlphaLISA immunoassay buffer. We observed that the signal
was linearly increased at the concentration 3 to 1,000 ng/mL, with intensity of 10794 to 40131 S/B,
respectively. At 3,000 ng/mL and after, signal was drastically decreased (Fig. 7.5A). A standard curve
was generated by plotting the AlphaLISA® signal intensity versus the concentration of the analyte,
based on a non-linear regression using the 4-parameter logistic equation (sigmoidal dose-response
curve with variable slope) and a 1/Y2
data weighting. The values after the hook point were removed
from the analysis (Fig. 7.5B). The LDL was calculated by interpolating the average background counts

99
+ 3 * standard deviation value on the standard curve. The dynamic range of this assay was from 980
pg/mL (LDL) to 1,000 ng/mL (upper limit).
Figure 7.5. AFP standard curve. A. AFP concentration vs signal intensity. B. Log AFP concentration vs signal
intensity.
7.4. Correction of serum matrix interference
Serum is a complex mixture of molecules that can interfere with the AFP quantification using
AlphaLISA® technology. To ensure that the AFP quantification is not affected by the inference of the
serum matrix with the quantification, a spike-in assay was performed.
A serum sample from an adult healthy WT mouse, which supposedly has a low amount of AFP
was diluted for 1 (undiluted), 25, 50, and 100-times in AlphaLISA immunoassay buffer, then a spike
concentration of 100 ng of recombinant protein was added, buffer without serum with 100 ng of
recombinant protein was used as spike control. As shown in Fig. 7.6 A, compared to spike control,
undiluted serum showed a strong reduction of the signal intensity indicating high matrix interference.
Its value was similar to negative control. At 25X dilution, signal was higher compared to undiluted
serum but still lower compared to spike control. The highest signal was observed at the 50X dilution
where the intensity was higher compared to control. The difference of the signal might due to the
endogenous AFP protein present in the serum. At the 100X dilution, the signal intensity was slightly
reduced compared both to spike control and 50X dilution sample. Therefore in the following
experiments, we decided to use 50X dilution of the serum.

100
Figure 7.6. Spike-in and linearity experiments using an adult WT mouse serum. (A) Signal intensity of serial
dilution of serum with 100 ng of AFP recombinant protein. (B) Linearity experiment with 50X dilution serum with different
concentration of spike-in AFP recombinant protein.
To confirm that 50X dilution of the serum does not affect the linearity of the assay, we
performed a linearity experiment using different concentration of spikes, ranging from 3 to 300 ng/mL,
and tested them in 50X diluted serum (Fig. 6.7 B). In WT mice, the physiological AFP concentration
ranges between 20-350 ng/mL with some exceptions (>1,000 ng/ml) depending on strains (Pihko and
Ruoslahti, 1973; Olsson et al., 1977; Pollard et al., 1982). Thus, at the 50X dilution we could detect
both endogenous (mouse AFP in serum) and exogenous AFP (spike-in recombinant AFP). As shown in
Fig. 6.7 B, the linearity of the assay was still maintained after serum dilution. Linear curve was
calculated using a linear regression equation and linearity was assessed with correlation coefficient
(R2>0.9994). The final assay setting for AFP detection with the AlphaLISA® technology is resumed in
Table 7.1.
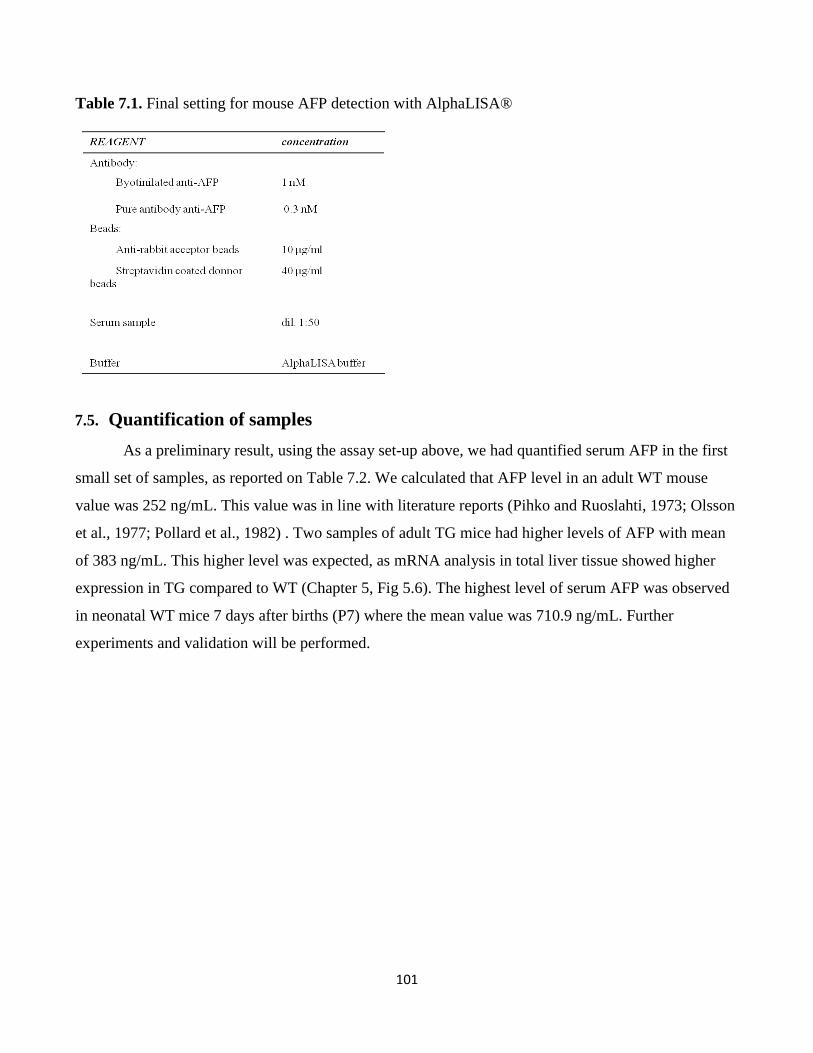
101
Table 7.1. Final setting for mouse AFP detection with AlphaLISA®
7.5. Quantification of samples
As a preliminary result, using the assay set-up above, we had quantified serum AFP in the first
small set of samples, as reported on Table 7.2. We calculated that AFP level in an adult WT mouse
value was 252 ng/mL. This value was in line with literature reports (Pihko and Ruoslahti, 1973; Olsson
et al., 1977; Pollard et al., 1982) . Two samples of adult TG mice had higher levels of AFP with mean
of 383 ng/mL. This higher level was expected, as mRNA analysis in total liver tissue showed higher
expression in TG compared to WT (Chapter 5, Fig 5.6). The highest level of serum AFP was observed
in neonatal WT mice 7 days after births (P7) where the mean value was 710.9 ng/mL. Further
experiments and validation will be performed.

102
Table 7.2. AFP quantification in mouse serum with AlphaLISA® assay

103
Chapter 8
General discussion

104
In the last decades, increasing evidence on the importance and the involvement of adult hepatic
stem/progenitor cells (HPCs) in the liver regenerative process in chronic liver diseases have became
intriguing focus in the study of liver disease. It is widely known that in chronic liver disease (i.e.
caused by viral infection or alcohol), the impairment of hepatocytes replication and their senescence
lead to the activation of the HPCs. These cells are able to rapidly replicate and differentiate into both
hepatocytes and cholangiocytes maintaining the functionality of the affected liver.
In the so-called regenerative medicine, the stem cells (SCs), a undifferentiated cells that can be
induced into many different cell types,is a very important tool for their potential therapeutic
application. Besides the bone-marrow derived stem cells (mesenchymal stem cells MSCs and
hematopoietic stem cells HSCs), the HPCs demonstrated their potential to repopulate diseased liver in
animal models. Although the clinical significance of these research remains to be ascertained in human
trials, there is potential for growth in the use of SCs as a therapeutic option (Burra et al., 2011).
On the other side, due to their self-renewing properties and differentiation capacity, the
presence of SCs can be the key role in carcinogenesis. In continually renewing tissues such as intestinal
mucosa and epidermis, where a steady flux of cells occurs from the SC zone to the terminally
differentiated cells that are imminently to be lost, it is widely accepted that cancer is a SC disease.
These SCs are the only cells that persist in the tissue for a sufficient length of time to acquire the
requisite number of genetic changes for neoplastic development. On the contrary, in the liver the
identity of the cells origin for HCC is more complicated. Both hepatocytes and HPCs can divide
several time and “fixate” DNA mutations into a heritable form (Alison et al., 2009).
Thus in the study of HCC mechanism, the cancer stem cells (CSCs), which are responsible for
sustaining the tumour as well as giving rise to proliferating but progressively differentiating cells, can
derive from both the malignant transformation of HPCs or the dedifferentiation of hepatocytes.
Recently, the group of Thorgeirsson had demonstrated that different steps of hepatic maturation, from
primary HPCs, lineage-committed hepatoblasts, and differentiated adult hepatocytes, can equally give
rise to CSCs. Interestingly, the CSCs originated from different cell type showed differential gene
expression profiles based on the different cellular origin, indicating the contribution of lineage stage–

105
dependent genetic changes to malignant transformation. Furthermore, these cells induced HCC in
specific subtype in accordance with the origin of the CSCs (Holczbauer et al., 2013).
In this study, we employed the C57BL/6J-TG(ALB1HBV)44BRI/J transgenic mouse model
(TG) that develop a progressive liver damage from early inflammation to HCC. In particular, we
focused our analysis on three major tasks: the evaluation of the liver damage during the life span of the
mice from 3 until 18 months of age, the evaluation of the SCs compartment activation in the TG model,
and the isolation of SCs and CSCs from wild type (WT) and TG liver at different stages of the disease.
8.1. Hepatic damage in TG mouse
The model developed by Chisari et al. develops a progressive liver damage due to the high
accumulation of the HBsAg protein within the hepatocytes. The constitutive accumulation of the
protein into the cells induces hepatocytes dead and consequent inflammation and regenerative
phenomena and eventually neoplastic transformation. This strain was generated by microinjection of
the transgene construction obtaining offspring with different expression of the HBsAg. During the
characterization of these lineages, they observed that the liver damage and the incidence of HCC in
each lineage were directly proportional to the intrahepatic concentration of HBsAg. Thus the lineage
with higher production of HBsAg was selected as founder of the C57BL/6J-TG(ALB1HBV)44BRI/J
strain.
We followed the progression of liver damage in our colony with the quantification serum
transaminase alanin aminotransferase (ALT) and aspartate aminotransferase (AST) together with the
histological analysis. High level of serum ALT and AST in TG mice starting from 3 months of age
indicated a constitutive hepatic injury (Chapter 4, Fig. 4.6). The presence of HBsAg at 3 months was
uniform. However, we observed that, in accordance with the literature, staring from six months of age,
HBsAg positivity became irregular and a very low percentage of positive cells (10%) was found in
some animals (Chapter 4, Fig. 4.4). Concordantly, the histological analysis of tissue damage in our
colony showed a delay in respect to the referred literature. In the development of the cytological
alteration: at 3 months no strong sign of inflammation or hepatocytes injury was observed even if
serum transaminase were already high. First signs of hepatocytes alteration as nuclear polymorphism

106
and apoptotic body were observed starting from 6 months, Even though HCC was diagnosed, its
incidence was much lower compared to literature.
8.2. Expression of stem cells markers in TG liver
To study the SCs compartment activation during the progression of the hepatic damage and the
expression of CSCs in the tumoral tissue, we analyzed the expression of surface markers CD34, CD133
(Prom1/Prminin1), CD90 (Thy1), the epithelial molecule Epcam, and Sca1together with Krt19, Afp
and Sox9. As described in the Material and Methods, we collected liver tissue at several stages of the
liver damage: inflammation (3 months), early hepatocytes damage (6 and 9 months), dysplasia and
HCC (12 and ≥15 months) and compared the mRNA and protein expression to normal WT liver tissue
at the same age points.
As expected, the expressions of these genes were almost homogeneous and lower in WT tissue
compared to TG. Similarly to what we observed with the histological analysis and serum transaminase
level, a high variability in the expression of SCs markers was observed during the
hepatocarcinogenesis. This high variability was noticeable especially in the more advanced stages o (12
and ≥15 months). Cd133, Cd34, and Afp expression (Chapter 5, Fig. 5.1, 5.3, and 5.6) clearly and
progressively increased during the progression of the hepatic disease. Krt19 and Epcam expression
(Chapter 5, Fig. 5.5 and 5.9) showed similar pattern from inflammation to dysplasia with a strong
reduction in tumoral samples, especially at older ages. Sca1 and Sox9 (Chapter 5, Fig. 5.10 and 5.11)
showed lower variability in the expression compared to the other genes but still an increasing trend
could be observed. No differences in the expression of CD90 between WT and TG samples and during
hepatocarcinogenesis were observed (Chapter 5, Fig. 5.7).
Based on the pattern of SCs markers expression, we could indicate that: 1. The SCs
compartment activation occurs between early hepatic injury (3 and 6 months); 2. The activation of SCs
lasts during the hepatocarcinogenesis; and 3. Most of the tumors express high level of CSCs markers.
In addition to gene expression analysis, our result of immunostaining of CD34 protein (Chapter
5, Fig. 5.15 and 5.16), confirmed the SCs compartment activation: at 3 months of age the positive cells
were mainly confined to the portal triad in both TG and WT tissue, then during the progression of the

107
disease this cells increased in number and scattered through the parenchyma. The cells were mainly
small in size and grouped in cluster in accordance with the oval cells amplification observed in other
mouse model of liver regeneration and in human. However, we have to put into account that HCC is a
highly vascularized tumor and it was also observed in our TG mice. Since CD34 is a marker several
cell types such as HPCs and endothelial cells of the blood vessels, further studies to confirm these
CD34+ cells as HPCs will be needed.
Unfortunately, CD133 immunostaining analysis was inconclusive. Despite the mRNA and total
protein analysis showed a clear and strong increasing pattern (Fig. 15.1 and 15.2), only a few and not
clearly positive cells were observed in the tissue slides. Our preliminary data of CD133-conjugated
primary cells by flow cytometry analysis also showed its positivity (data not shown). CD133 is a
surface protein expressed in both hepatic SCs and CSCs; previous studies reported the expression of
CD133 positive cells in fetal liver, HCC and in biliary epithelium of intrahepatic large and small bile
ducts of healthy liver (Song et al., 2008; Yoshikawa et al., 2009). A correlation between cytoplasmic
CD133 protein expression and overall survival in HCC (Sasaki et al., 2010) and gastric cancer
(Hashimoto et al., 2014) had been reported. Our inconclusive results on CD133 immunostaining on
paraffinated tissue section might be caused by several factors: 1. The antibody is not suitable for
paraffinated liver tissue, 2. The CD133 signal is weak compared to other protein staining. Further
optimization for CD133 immunostaining will be needed.
CD90 was proposed as markers for both hepatic SCs and CSCs. In liver, CD90 is a
promiscuous molecule, expressed by different cells type. In addition to hepatic SCs/CSCs, fibroblasts
as well as bone marrow derived cells express this marker. In particular, during wound healing and
fibrosis activated myo-fibroblasts residing in portal areas and in scar tissue express high level of these
marker (Dudas et al., 2009). Moreover, it was proposed that fibroblasts expressing CD90 are involved
in the maintenance of the structure of epithelial cells in liver tissue (Jodon de Villeroché and Brouty-
Boye, 2008). It has been demonstrated that CD90 is expressed in a subpopulation of
myofibroblasts/stellate cells present outside the basement membrane surrounding the oval cells (Dezso
et al., 2007) rather than in the SCs per se. In addition, it is becoming evident the role of cancer
associated fibroblast (CAFs) in the modulation of biological activities of HCC (Yang et al., 2011;
Yamashita et al., 2013). In our model, nor advanced fibrosis/cirrhosis and CD90 up-regulation were
observed during SCs compartment activation and in tumor tissue. Thus this model can somehow

108
corroborates the idea that CD90+ cells in the tumor are not derived directly from hepatic SCs even if
they have the same properties.
As in human HCC, high variability of the expression of CSCs markers and their expression in
paired non-tumoral and tumoral samples in this model is observed (Chapter 5, Fig. 5.12), In particular,
CD133 showed the higher up-regulation (until 40-folds) and its expression was associated with high
expression of Afp. Conversely, tumor with high expression of Epcam showed down-regulation or low
up-regulation (less than 4 folds) of CD133 compared to its paired tissue.
As had mentioned in the introduction, due to the high variability among patients and the
difficulty to obtain tissue biopsy of pre-cancerous stages, the observation of the progressive stage of
hepatic damage is very difficult to observe. The TG model we used in this study develops HCC in a
homogeneous genetic and environment background, thus the possibility to evaluate mRNA expression
of CSCs markers at different disease stages will give important hints on the progression of the
pathology. Despite the variability among animals, when we compared the SC/CSCs markers with
different stages of the liver damages (Chapter 5, Fig. 5.13), independently from the age of the animals,
we observed a clear correlation. An increasing expression trend for Cd133, Cd34 and Afp from early
liver damage to dysplasia and HCC was noticed, and in opposite for Krt19. Interestingly, when we
separated the group of dysplasia with and without steatosis, a significant lower expression of CD133
was found in group with steatosis compared to the group without steatosis and HCC.
Another important aspect needs to be considered that it is not uncommon to find an HBV-
related HCC without advanced fibrosis or liver cirrhosis. Since the animal model we used in this study
does not develop these pathologies, it can be a good model to study not-cirrhotic HCC. However, to
take a comprehensive view on what happens during carcinogenesis in its relation with disease etiology,
further studies using different animal models (i.e. HCV TG mouse model, molecule-specific knock-out
and knock-in mouse, etc.), would be beneficial. This information will lead to better understanding how
stem cells activation correlates with risk factors.
8.3 Stem cells isolation from hepatic liver tissue
To understand the difference between the populations of progenitor cells obtained from both TG
and WT mice, we performed primary cells culture from their respective liver tissues. As expected,
109
since the number of progenitor cells is small, the optimization of cells isolation and maintenance
required careful and challenging efforts. For cell cultures, we used a commercially available medium
for hematopoietic cells MyeloCult® (StemCells Tech., Vancouver, Canada), referred as Medium 4,
and growth medium as previously reported (Rountree et al., 2007), referred as Medium 5 and plated the
cells for 5 days or 14 days (data at 14 days not shown). The genotypic and phenotypic characterizations
were carried out using RTqPCR.
As shown in Fig.6.9 and 6.10 of Results (Chapter 6), we observed that compared to Medium 4,
the Medium 5 was better in isolating and enriching cells that were positive for stem cell markers of
interest. Our data using Medium 5 for the selection of CD133+ cells from both of TG and WT mice
was in line with the referred article. The cells phenotype obtained by Rountre et al. was CD133+ and
CD49f+. However, it is important to be noted that we had not performed CD45 depletion in the
populations.
Cells populations with fibroblast-like morphology expressed CSC genes Cd133+, Cd34+,
Epcam+, Cd90+, and Krt19+, with ablation of hepatocytes marker Albumin (Alb). More divergent
expression levels for hematopoietic stem cell markers (Cd45 and Sca1) as well as other hepatic
progenitor cell markers (Sox9 and Afp) were observed. Interestingly, on the comparison of 12 months
and 18 months TG mice, we observed that mRNA expressions of CSC markers tend to be higher in
cells cultured from older TG mice exhibiting later stages of HCC compared to younger TG mice or
either of the WT counterparts.
During primary cell cultures, we observed that timing of the culture is important in the
maintenance of the ‘stemness’ of the cells. The expression of both CD133 and Epcam were higher at 5
days compared to 14 days plating. In contrast, CD34 was higher at 14 days. We hypothesized since
CD133 is the precursor of CD34, a differentiation process might happen. However it must be further
proven. Based on the CD133 high up-regulation data during hepatocarcinogenesis (Chapter 5, Fig, 5.1)
and its role as a well-accepted CSC marker in HCC, we focused on the selection of CD133+ cells as
target molecule. Moreover, we observed that Alb gene was down-regulated starting from 5 days in
culture, indicated the absence of mature hepatic cells. This data is coherent with several reports that
primary hepatocytes are not viable in long term in vitro culture.
To test the capacity of a single cell to clone in an independent-anchorage environment, we
plated the cells in low density in thick gel of matrigel. As expected, a single cell from both WT and
110
TG, had capacity to divide and make a 3D sphere started from a week plating (Chapter 6, Fig. 6.7).
This clonogenic capacity is one of the main techniques to identify stem cells and CSC, as previously
reported (Uchida et al., 2010; Cao et al., 2011).
This first data on the characterization of the putative progenitor cells had provided important
information on these following aspects: 1. The optimal medium for maintenance of primary cells, 2.
The timing of the culture, and 3. The phenotype of the cells obtained. However, it is important to notice
that these primary cells were still a heterogeneous mix population, containing progenitor cells and
fibroblast (high Fsp1 expression), and possible presence of endothelial and immune cells. The next
strategy to validate the progenitor cells is the selection of single cells population expressing specific
CSC marker, such as CD133+ and Epcam. It might lead to a more significant insight into the
characteristics of these cells of interest and to understand the difference between normal and cancerous
progenitor cells.
In human HCC, it has been reported that CD133+ cells activated the preferential Akt/PKB and
Bcl-2 as survival response (Ma et al., 2008b) Furthermore, CD133+ cells had antiapoptotic and
radioresistance properties, and silencing of CD133 enhanced the sensitivity of CSC to chemotherapy
and radiotherapy (Piao et al., 2012; Lan et al., 2013). However, one of the main obstacles in human
CSC studies is that data on the control CD133+ cells from normal tissues is very limited, and usually
researcher examined positive and negative phenotype from HCC cells. The information from this
current study will give important insight about what are the differential pathways involved in the
discrepancy of CD133+ cells (or other CSC phenotypes, such as CD34 and Epcam) obtained from
normal vs. malignant tissue.
We believe that another good or even a better method to isolate specific stem cells and CSC
population from tissue is by a direct positive selection (cells sorting) from single cells suspension after
mechanic- enzymatic dissociation of the tissue using fluorescence-conjugated antibodies. It can be
performed using fluorescence activated cells sorting (FACS) or magnetic sorting. Nevertheless, this
method will face several other difficulties due to the small number of cells of interest, the complication
in combining several antibodies (positive selection and negative selection), the viability of the cells
after sorting, and the natural fluorescence of the tissue. Natural fluorescence is mainly due to the
presence of endogenous flavins, reduced NAD(P)H, lipofuscins, reticulin fibres, collagen and elastin
which highly found in liver tissue (Viegas et al., 2007) thus makes this method is challenging, in
111
particular when a green (i.e. fluorescein isothiocianate - FITC) or red (i.e. phycoerithrin - PE)
fluorochrome antibody is used.
For the following works, we will investigate several oncogenic and developmental pathways
involved in hepatocarcinogenesis such as Wnt/β-catenin, MYC and Transforming Growth Factor α
(TGFα) interactions, and Hedgehog. We had performed a preliminary data of the several molecules
involved in apoptosis and pro-oncogenic process on 5-days primary cells; however the data was not
sufficient to draw any conclusions, might be caused by the heterogeneity of cells population (data not
shown). A global gene array will be also an ideal tool to perceive a comprehensive analysis on the
molecular changes from normal to cancerous stem cells.

112
Chapter 9
Conclusion

113
Based on the data we obtained in this study, we can conclude that there was a clear activation
and progressive amplification of the stem cells (SCs) compartment during hepatocarcinogenesis in a
HBV-transgenic mouse model C57BL/6J-TG(ALB1HBV)44BRI/J. The up-regulations of hepatic SCs
markers such as CD34, CD133, Epcam, and Krt19 in hepatic tissues were observed on different courses
of the natural history of the disease, from chronic hepatitis to hepatocellular carcinoma (HCC).
Furthermore, there was a strong correlation between the expression pattern between SCs and cancer
stem cells (CSCs) markers and different stages of hepatic pathologies.
In details, this study demonstrated that:
1. The activation and amplification of stem cells compartment (CD34, CD133, Epcam, and Krt19)
were started from early hepatic injury
2. The progressive increase of CD133, CD34 and Afp expression was noticed from normal, early
cellular damage, dysplasia, and HCC.
3. The Krt19 was down-regulated in HCC compared to hepatic dysplasia and other pathologies.
In this thesis, we also characterized populations of putative hepatic SCs and CSCs from both
TG and their wild type counterpart WT animals in different growth mediums. The isolated primary
cells showed up-regulation of the SCs markers compared to total tissue with low or no expression of
hepatocytes markers (Alb and Krt18) and they had the clonogenic ability to form 3D clones in matrigel
after 7-10 days plating.
As conclusion, the disease course of this mouse model well-corresponded with the natural
history of hepatocarcinogenesis in human and can represent a good tool to study the involvement of
SCs and CSCs in the progression of the disease. These isolated cells can be potent tools to study the
molecular and cellular mechanisms that switch the fate of normal SCs to CSCs. Furthermore, they can
be used to study the differences of developmental and oncogenic molecular pathways between normal
SCs and CSCs and to develop novel CSCs-targeted therapy

114
Acknowledgments
Fondazione Italiana Fegato
Prof. Claudio Tiribelli
Dr. Caecilia H.C. Sukowati
Dr.Cristina Bellarosa Eleonora Vianello Prof. Lory S. Crocè
Dr. Natalia Rosso Matteo Dal Ben Dr. Flora Masutti
Dr. Silvia Gazzin Veronica Marin Dr. Igino Rigato
Dr. Devis Pascut Sandra Leal Dr. Riccardo patti
Dr. Pablo Giraudi Sabrina Corsucci
Dr. Carlos Coda Zabeta Erika Ghersin
Sabrina Gambaro Barbara Figliolia
Mohammed Qaisiya Susan Irawati Ie
Korri El Khobar
University of Turin
Dr. Laura Conti
Dr. Stefania Lanzardo
Animal Facility, University of Trieste
Dr. Marco Stebel
Dr. Davide Barbetta
Dr. Paola Zarattini
School of Molecular Biomedicine, University of Trieste
Prof. Guidalberto Manfioletti
Prof. Giorgio Stanta
Santa Maria della Misericordia Hospital
Prof. Claudio Avellini
Dr. Daniela Cesselli
Stefania Marzinotto
IRCCS Burlo Garofalo Pediatric Hospital
Alan Raseni

115
Reference List
Abou-Alfa,G.K., Schwartz,L., Ricci,S., Amadori,D., Santoro,A., Figer,A., De,G.J., Douillard,J.Y., Lathia,C., Schwartz,B., Taylor,I., Moscovici,M., and Saltz,L.B. (2006). Phase II study of sorafenib in patients with advanced hepatocellular carcinoma. J Clin. Oncol. 24, 4293-4300.
Ahmed,I. and Lobo,D.N. (2009). Malignant tumours of the liver. Surgery (Oxford) 27, 30-37.
Al-Hajj,M., Wicha,M.S., Benito-Hernandez,A., Morrison,S.J., and Clarke,M.F. (2003). Prospective identification of tumorigenic breast cancer cells. Proc. Natl. Acad Sci. U. S. A 100, 3983-3988.
Alison,M.R., Golding,M., Sarraf,C.E., Edwards,R.J., and Lalani,E.N. (1996). Liver damage in the rat induces hepatocyte stem cells from biliary epithelial cells. Gastroenterology 110, 1182-1190.
Alison,M.R., Islam,S., and Lim,S. (2009). Stem cells in liver regeneration, fibrosis and cancer: the good, the bad and the ugly. J. Pathol. 217, 282-298.
Alison,M.R., Vig,P., Russo,F., Bigger,B.W., Amofah,E., Themis,M., and Forbes,S. (2004). Hepatic stem cells: from inside and outside the liver? Cell Prolif. 37, 1-21.
Anfuso,B., Tiribelli,C., and Sukowati,CH. (2013). Recent insights into hepatic cancer stem cells. hepatology international Supplement ALPD.
Ascha,M.S., Hanouneh,I.A., Lopez,R., Tamimi,T.A., Feldstein,A.F., and Zein,N.N. (2010). The incidence and risk factors of hepatocellular carcinoma in patients with nonalcoholic steatohepatitis. Hepatology 51, 1972-1978.
Avasarala,S., Yang,L., Sun,Y., Leung,A.W., Chan,W.Y., Cheung,W.T., and Lee,S.S. (2006). A temporal study on the histopathological, biochemical and molecular responses of CCl(4)-induced hepatotoxicity in Cyp2e1-null mice. Toxicology 228, 310-322.
Babinet,C., Farza,H., Morello,D., Hadchouel,M., and Pourcel,C. (1985). Specific expression of hepatitis B surface antigen (HBsAg) in transgenic mice. Science 230, 1160-1163.
Baylin,S.B. and Jones,P.A. (2011). A decade of exploring the cancer epigenome - biological and translational implications. Nat Rev. Cancer 11, 726-734.
Belghiti,J. and Fuks,D. (2012). Liver Resection and Transplantation in Hepatocellular Carcinoma. Liver Cancer 1, 71-82.
Bolondi,L., Cillo,U., Colombo,M., Craxi,A., Farinati,F., Giannini,E.G., Golfieri,R., Levrero,M., Pinna,A.D., Piscaglia,F., Raimondo,G., Trevisani,F., Bruno,R., Caraceni,P., Ciancio,A., Coco,B., Fraquelli,M., Rendina,M., Squadrito,G., and Toniutto,P. (2013). Position paper of the Italian Association for the Study of the Liver (AISF): the multidisciplinary clinical approach to hepatocellular carcinoma. Dig. Liver Dis. 45, 712-723.
Bonnet,D. and Dick,J.E. (1997). Human acute myeloid leukemia is organized as a hierarchy that originates from a primitive hematopoietic cell. Nat Med. 3, 730-737.

116
Borzio,M., Fargion,S., Borzio,F., Fracanzani,A.L., Croce,A.M., Stroffolini,T., Oldani,S., Cotichini,R., and Roncalli,M. (2003). Impact of large regenerative, low grade and high grade dysplastic nodules in hepatocellular carcinoma development. J Hepatol. 39, 208-214.
Bosch,F.X., Ribes,J., Diaz,M., and Cleries,R. (2004). Primary liver cancer: worldwide incidence and trends. Gastroenterology 127, S5-S16.
Boulter,L., Govaere,O., Bird,T.G., Radulescu,S., Ramachandran,P., Pellicoro,A., Ridgway,R.A., Seo,S.S., Spee,B., Van,R.N., Sansom,O.J., Iredale,J.P., Lowell,S., Roskams,T., and Forbes,S.J. (2012). Macrophage-derived Wnt opposes Notch signaling to specify hepatic progenitor cell fate in chronic liver disease. Nat Med. 18, 572-579.
Bray,F., Ren,J.S., Masuyer,E., and Ferlay,J. (2013). Global estimates of cancer prevalence for 27 sites in the adult population in 2008. Int. J Cancer 132, 1133-1145.
Bruegel,M., Muenzel,D., Waldt,S., Specht,K., and Rummeny,E.J. (2013). Hepatic angiosarcoma: cross-sectional imaging findings in seven patients with emphasis on dynamic contrast-enhanced and diffusion-weighted MRI. Abdom. Imaging 38, 745-754.
Bruix,J., Boix,L., Sala,M., and Llovet,J.M. (2004). Focus on hepatocellular carcinoma. Cancer Cell 5, 215-219.
Bruix,J. and Sherman,M. (2011). Management of hepatocellular carcinoma: an update. Hepatology 53, 1020-1022.
Bruix,J., Sherman,M., Llovet,J.M., Beaugrand,M., Lencioni,R., Burroughs,A.K., Christensen,E., Pagliaro,L., Colombo,M., and Rodes,J. (2001). Clinical management of hepatocellular carcinoma. Conclusions of the Barcelona-2000 EASL conference. European Association for the Study of the Liver. J Hepatol. 35, 421-430.
Burra,P., Bizzaro,D., Ciccocioppo,R., Marra,F., Piscaglia,A.C., Porretti,L., Gasbarrini,A., and Russo,F.P. (2011). Therapeutic application of stem cells in gastroenterology: an up-date. World J. Gastroenterol. 17, 3870-3880.
Bustin,S.A., Benes,V., Garson,J.A., Hellemans,J., Huggett,J., Kubista,M., Mueller,R., Nolan,T., Pfaffl,M.W., Shipley,G.L., Vandesompele,J., and Wittwer,C.T. (2009). The MIQE guidelines: minimum information for publication of quantitative real-time PCR experiments. Clin. Chem. 55, 611-622.
Callea,F. (1988). Natural history of hepatocellular carcinoma as viewed by the pathologist. Appl. Pathol. 6, 105-116.
Cao,L., Zhou,Y., Zhai,B., Liao,J., Xu,W., Zhang,R., Li,J., Zhang,Y., Chen,L., Qian,H., Wu,M., and Yin,Z. (2011). Sphere-forming cell subpopulations with cancer stem cell properties in human hepatoma cell lines. BMC. Gastroenterol. 11, 71.
Chakraborty,T., Chatterjee,A., Rana,A., Srivastawa,S., Damodaran,S., and Chatterjee,M. (2007). Cell proliferation and hepatocarcinogenesis in rat initiated by diethylnitrosamine and promoted by phenobarbital: potential roles of early DNA damage and liver metallothionein expression. Life Sci. 81, 489-499.
Challen,G.A. and Little,M.H. (2006). A side order of stem cells: the SP phenotype. Stem Cells 24, 3-12.
Chang,M.H., You,S.L., Chen,C.J., Liu,C.J., Lee,C.M., Lin,S.M., Chu,H.C., Wu,T.C., Yang,S.S., Kuo,H.S., and Chen,D.S. (2009). Decreased incidence of hepatocellular carcinoma in hepatitis B vaccinees: a 20-year follow-up study. J Natl. Cancer Inst. 101, 1348-1355.

117
Chen,J.G., Parkin,D.M., Chen,Q.G., Lu,J.H., Shen,Q.J., Zhang,B.C., and Zhu,Y.R. (2003). Screening for liver cancer: results of a randomised controlled trial in Qidong, China. J Med. Screen. 10, 204-209.
Chen,L.P., Zhao,J., Du,Y., Han,Y.F., Su,T., Zhang,H.W., and Cao,G.W. (2012a). Antiviral treatment to prevent chronic hepatitis B or C-related hepatocellular carcinoma. World J Virol. 1, 174-183.
Chen,Y., Yu,D., Zhang,H., He,H., Zhang,C., Zhao,W., and Shao,R.G. (2012b). CD133(+)EpCAM(+) phenotype possesses more characteristics of tumor initiating cells in hepatocellular carcinoma Huh7 cells. Int. J Biol. Sci. 8, 992-1004.
Chiba,T., Kita,K., Zheng,Y.W., Yokosuka,O., Saisho,H., Iwama,A., Nakauchi,H., and Taniguchi,H. (2006). Side population purified from hepatocellular carcinoma cells harbors cancer stem cell-like properties. Hepatology 44, 240-251.
Chisari,F.V., Filippi,P., Buras,J., McLachlan,A., Popper,H., Pinkert,C.A., Palmiter,R.D., and Brinster,R.L. (1987). Structural and pathological effects of synthesis of hepatitis B virus large envelope polypeptide in transgenic mice. Proc. Natl. Acad Sci. U. S. A 84, 6909-6913.
Chisari,F.V., Filippi,P., McLachlan,A., Milich,D.R., Riggs,M., Lee,S., Palmiter,R.D., Pinkert,C.A., and Brinster,R.L. (1986). Expression of hepatitis B virus large envelope polypeptide inhibits hepatitis B surface antigen secretion in transgenic mice. J Virol. 60, 880-887.
Chisari,F.V., Klopchin,K., Moriyama,T., Pasquinelli,C., Dunsford,H.A., Sell,S., Pinkert,C.A., Brinster,R.L., and Palmiter,R.D. (1989). Molecular pathogenesis of hepatocellular carcinoma in hepatitis B virus transgenic mice. Cell 59, 1145-1156.
Christ,B. and Pelz,S. (2013). Implication of hepatic stem cells in functional liver repopulation. Cytometry A 83, 90-102.
Chung,J.S., Park,S., Park,S.H., Park,E.R., Cha,P.H., Kim,B.Y., Chung,Y.M., Woo,S.R., Han,C.J., Kim,S.B., Suh,K.S., Jang,J.J., Lee,K., Choi,D.W., Lee,S., Lee,G.Y., Hahm,K.B., Shin,J.A., Kim,B.S., Noh,K.H., Kim,T.W., Lee,K.H., and Yoo,Y.D. (2012). Overexpression of Romo1 promotes production of reactive oxygen species and invasiveness of hepatic tumor cells. Gastroenterology 143, 1084-1094.
Clarke,M.F., Dick,J.E., Dirks,P.B., Eaves,C.J., Jamieson,C.H., Jones,D.L., Visvader,J., Weissman,I.L., and Wahl,G.M. (2006). Cancer stem cells--perspectives on current status and future directions: AACR Workshop on cancer stem cells. Cancer Res. 66, 9339-9344.
Clouston,A.D., Powell,E.E., Walsh,M.J., Richardson,M.M., Demetris,A.J., and Jonsson,J.R. (2005). Fibrosis correlates with a ductular reaction in hepatitis C: roles of impaired replication, progenitor cells and steatosis. Hepatology 41, 809-818.
Collins,A.T., Berry,P.A., Hyde,C., Stower,M.J., and Maitland,N.J. (2005). Prospective identification of tumorigenic prostate cancer stem cells. Cancer Res. 65, 10946-10951.
Colombo,F., Baldan,F., Mazzucchelli,S., Martin-Padura,I., Marighetti,P., Cattaneo,A., Foglieni,B., Spreafico,M., Guerneri,S., Baccarin,M., Bertolini,F., Rossi,G., Mazzaferro,V., Cadamuro,M., Maggioni,M., Agnelli,L., Rebulla,P., Prati,D., and Porretti,L. (2011). Evidence of distinct tumour-propagating cell populations with different properties in primary human hepatocellular carcinoma. PLoS One 6, e21369.
118
Covolo,L., Gelatti,U., Talamini,R., Garte,S., Trevisi,P., Franceschi,S., Franceschini,M., Barbone,F., Tagger,A., Ribero,M.L., Parrinello,G., Donadon,V., Nardi,G., and Donato,F. (2005). Alcohol dehydrogenase 3, glutathione S-transferase M1 and T1 polymorphisms, alcohol consumption and hepatocellular carcinoma (Italy). Cancer Causes Control 16, 831-838.
Crosby,H.A., Hubscher,S., Fabris,L., Joplin,R., Sell,S., Kelly,D., and Strain,A.J. (1998). Immunolocalization of putative human liver progenitor cells in livers from patients with end-stage primary biliary cirrhosis and sclerosing cholangitis using the monoclonal antibody OV-6. Am. J Pathol. 152, 771-779.
de Lima,V.M., Oliveira,C.P., Alves,V.A., Chammas,M.C., Oliveira,E.P., Stefano,J.T., de Mello,E.S., Cerri,G.G., Carrilho,F.J., and Caldwell,S.H. (2008). A rodent model of NASH with cirrhosis, oval cell proliferation and hepatocellular carcinoma. J Hepatol. 49, 1055-1061.
Dezso,K., Jelnes,P., Laszlo,V., Baghy,K., Bodor,C., Paku,S., Tygstrup,N., Bisgaard,H.C., and Nagy,P. (2007). Thy-1 is expressed in hepatic myofibroblasts and not oval cells in stem cell-mediated liver regeneration. Am. J Pathol. 171, 1529-1537.
Di Tommaso,L., Sangiovanni,A., Borzio,M., Park,Y.N., Farinati,F., and Roncalli,M. (2013). Advanced precancerous lesions in the liver. Best. Pract. Res. Clin. Gastroenterol. 27, 269-284.
Donato,F., Tagger,A., Gelatti,U., Parrinello,G., Boffetta,P., Albertini,A., Decarli,A., Trevisi,P., Ribero,M.L., Martelli,C., Porru,S., and Nardi,G. (2002). Alcohol and hepatocellular carcinoma: the effect of lifetime intake and hepatitis virus infections in men and women. Am. J Epidemiol. 155, 323-331.
Dudas,J., Mansuroglu,T., Batusic,D., and Ramadori,G. (2009). Thy-1 is expressed in myofibroblasts but not found in hepatic stellate cells following liver injury. Histochem. Cell Biol. 131, 115-127.
Dunsford,H.A., Sell,S., and Chisari,F.V. (1990). Hepatocarcinogenesis due to chronic liver cell injury in hepatitis B virus transgenic mice. Cancer Res. 50, 3400-3407.
Durnez,A., Verslype,C., Nevens,F., Fevery,J., Aerts,R., Pirenne,J., Lesaffre,E., Libbrecht,L., Desmet,V., and Roskams,T. (2006). The clinicopathological and prognostic relevance of cytokeratin 7 and 19 expression in hepatocellular carcinoma. A possible progenitor cell origin. Histopathology 49, 138-151.
Edmondsond,H.A. and STEINER,P.E. (1954). Primary carcinoma of the liver: a study of 100 cases among 48,900 necropsies. Cancer 7, 462-503.
El Serag,H.B. and Rudolph,K.L. (2007). Hepatocellular carcinoma: epidemiology and molecular carcinogenesis. Gastroenterology 132, 2557-2576.
Emre,S., Umman,V., and Rodriguez-Davalos,M. (2012). Current concepts in pediatric liver tumors. Pediatr. Transplant. 16, 549-563.
Ercolani,G., Grazi,G.L., and Pinna,A.D. (2010). Liver transplantation for benign hepatic tumors: a systematic review. Dig. Surg. 27, 68-75.
Erdogan,D., Busch,O.R., van Delden,O.M., Bennink,R.J., ten Kate,F.J., Gouma,D.J., and van Gulik,T.M. (2007). Management of liver hemangiomas according to size and symptoms. J Gastroenterol. Hepatol. 22, 1953-1958.
Fattovich,G. (2003). Natural history and prognosis of hepatitis B. Semin. Liver Dis. 23, 47-58.

119
Fausto,N. (2004). Liver regeneration and repair: hepatocytes, progenitor cells, and stem cells. Hepatology 39, 1477-1487.
Fausto,N. and Campbell,J.S. (2003). The role of hepatocytes and oval cells in liver regeneration and repopulation. Mech. Dev. 120, 117-130.
Ferlay,J., Shin,H.R., Bray,F., Forman,D., Mathers,C., and Parkin,D.M. (2010). Estimates of worldwide burden of cancer in 2008: GLOBOCAN 2008. Int. J Cancer 127, 2893-2917.
Friman,S. (2011). Cholangiocarcinoma--current treatment options. Scand. J Surg. 100, 30-34.
Fukaya,R., Ohta,S., Yamaguchi,M., Fujii,H., Kawakami,Y., Kawase,T., and Toda,M. (2010). Isolation of cancer stem-like cells from a side population of a human glioblastoma cell line, SK-MG-1. Cancer Lett. 291, 150-157.
Gallagher,E.P., Wienkers,L.C., Stapleton,P.L., Kunze,K.L., and Eaton,D.L. (1994). Role of human microsomal and human complementary DNA-expressed cytochromes P4501A2 and P4503A4 in the bioactivation of aflatoxin B1. Cancer Res. 54, 101-108.
Gallo,C. and the Cancer of the Liver Italian Program (CLIP) investigators (1998). A new prognostic system for hepatocellular carcinoma: a retrospective study of 435 patients. Hepatology 28, 751-755.
Goodell,M.A., Brose,K., Paradis,G., Conner,A.S., and Mulligan,R.C. (1996). Isolation and functional properties of murine hematopoietic stem cells that are replicating in vivo. J Exp. Med. 183, 1797-1806.
Grosse-Gehling,P., Fargeas,C.A., Dittfeld,C., Garbe,Y., Alison,M.R., Corbeil,D., and Kunz-Schughart,L.A. (2013). CD133 as a biomarker for putative cancer stem cells in solid tumours: limitations, problems and challenges. J Pathol. 229, 355-378.
Hamburger,A.W. and Salmon,S.E. (1977). Primary bioassay of human tumor stem cells. Science 197, 461-463.
Hanahan,D. and Weinberg,R.A. (2011). Hallmarks of cancer: the next generation. Cell 144, 646-674.
Haraguchi,N., Inoue,H., Tanaka,F., Mimori,K., Utsunomiya,T., Sasaki,A., and Mori,M. (2006a). Cancer stem cells in human gastrointestinal cancers. Hum. Cell 19, 24-29.
Haraguchi,N., Ishii,H., Mimori,K., Tanaka,F., Ohkuma,M., Kim,H.M., Akita,H., Takiuchi,D., Hatano,H., Nagano,H., Barnard,G.F., Doki,Y., and Mori,M. (2010). CD13 is a therapeutic target in human liver cancer stem cells. J Clin. Invest 120, 3326-3339.
Haraguchi,N., Utsunomiya,T., Inoue,H., Tanaka,F., Mimori,K., Barnard,G.F., and Mori,M. (2006b). Characterization of a side population of cancer cells from human gastrointestinal system. Stem Cells 24, 506-513.
Hashimoto,E., Yatsuji,S., Tobari,M., Taniai,M., Torii,N., Tokushige,K., and Shiratori,K. (2009). Hepatocellular carcinoma in patients with nonalcoholic steatohepatitis. J Gastroenterol. 44 Suppl 19, 89-95.
Hashimoto,K., Aoyagi,K., Isobe,T., Kouhuji,K., and Shirouzu,K. (2014). Expression of CD133 in the cytoplasm is associated with cancer progression and poor prognosis in gastric cancer. Gastric. Cancer 17, 97-106.

120
Heindryckx,F., Colle,I., and Van,V.H. (2009). Experimental mouse models for hepatocellular carcinoma research. Int. J Exp. Pathol. 90, 367-386.
Hernandez-Gea,V., Toffanin,S., Friedman,S.L., and Llovet,J.M. (2013). Role of the microenvironment in the pathogenesis and treatment of hepatocellular carcinoma. Gastroenterology 144, 512-527.
Higgins ,G. and Anderson,R. (1931). Experimental pathology of the liver:Restoration of the liver of the white rat following partial surgical removal. Archives of patology 12, 186-202.
Ho,M.M., Ng,A.V., Lam,S., and Hung,J.Y. (2007). Side population in human lung cancer cell lines and tumors is enriched with stem-like cancer cells. Cancer Res. 67, 4827-4833.
Holczbauer,A., Factor,V.M., Andersen,J.B., Marquardt,J.U., Kleiner,D.E., Raggi,C., Kitade,M., Seo,D., Akita,H., Durkin,M.E., and Thorgeirsson,S.S. (2013). Modeling pathogenesis of primary liver cancer in lineage-specific mouse cell types. Gastroenterology 145, 221-231.
Hu,C., Li,H., Li,J., Zhu,Z., Yin,S., Hao,X., Yao,M., Zheng,S., and Gu,J. (2008). Analysis of ABCG2 expression and side population identifies intrinsic drug efflux in the HCC cell line MHCC-97L and its modulation by Akt signaling. Carcinogenesis 29, 2289-2297.
Huynh,H., Soo,K.C., Chow,P.K., Panasci,L., and Tran,E. (2006). Xenografts of human hepatocellular carcinoma: a useful model for testing drugs. Clin. Cancer Res. 12, 4306-4314.
Ijzer,J., Schotanus,B.A., Vander,B.S., Roskams,T.A., Kisjes,R., Penning,L.C., Rothuizen,J., and van den Ingh,T.S. (2010). Characterisation of the hepatic progenitor cell compartment in normal liver and in hepatitis: an immunohistochemical comparison between dog and man. Vet. J 184, 308-314.
Imaoka,S., Osada,M., Minamiyama,Y., Yukimura,T., Toyokuni,S., Takemura,S., Hiroi,T., and Funae,Y. (2004). Role of phenobarbital-inducible cytochrome P450s as a source of active oxygen species in DNA-oxidation. Cancer Lett. 203, 117-125.
Ioannou,G.N., Splan,M.F., Weiss,N.S., McDonald,G.B., Beretta,L., and Lee,S.P. (2007). Incidence and predictors of hepatocellular carcinoma in patients with cirrhosis. Clin. Gastroenterol. Hepatol. 5, 938-45, 945.
Jemal,A., Center,M.M., DeSantis,C., and Ward,E.M. (2010). Global patterns of cancer incidence and mortality rates and trends. Cancer Epidemiol. Biomarkers Prev. 19, 1893-1907.
Jia,Q., Zhang,X., Deng,T., and Gao,J. (2013). Positive correlation of Oct4 and ABCG2 to chemotherapeutic resistance in CD90(+)CD133(+) liver cancer stem cells. Cell Reprogram. 15, 143-150.
Jodon de Villeroché,V. and Brouty-Boye,D. (2008). Establishment and characterization of atypical fibroblasts from human adult liver contributing to hepatocyte cord-like arrangement. Cell Biol. Int. 32, 605-614.
Kaatsch,P. (2010). Epidemiology of childhood cancer. Cancer Treat. Rev. 36, 277-285.
Kamohara,Y., Haraguchi,N., Mimori,K., Tanaka,F., Inoue,H., Mori,M., and Kanematsu,T. (2008). The search for cancer stem cells in hepatocellular carcinoma. Surgery 144, 119-124.

121
Katoonizadeh,A., Nevens,F., Verslype,C., Pirenne,J., and Roskams,T. (2006). Liver regeneration in acute severe liver impairment: a clinicopathological correlation study. Liver Int. 26, 1225-1233.
Khan,S.A., Emadossadaty,S., Ladep,N.G., Thomas,H.C., Elliott,P., Taylor-Robinson,S.D., and Toledano,M.B. (2012). Rising trends in cholangiocarcinoma: is the ICD classification system misleading us? J Hepatol. 56, 848-854.
Kim,C.F., Jackson,E.L., Woolfenden,A.E., Lawrence,S., Babar,I., Vogel,S., Crowley,D., Bronson,R.T., and Jacks,T. (2005). Identification of bronchioalveolar stem cells in normal lung and lung cancer. Cell 121, 823-835.
Kim,D.Y. and Han,K.H. (2012). Epidemiology and Surveillance of Hepatocellular Carcinoma. Liver Cancer 1, 2-14.
Kim,H., Oh,B.K., Roncalli,M., Park,C., Yoon,S.M., Yoo,J.E., and Park,Y.N. (2009). Large liver cell change in hepatitis B virus-related liver cirrhosis. Hepatology 50, 752-762.
Kim,Y.S., Rha,S.E., Oh,S.N., Jung,S.E., Shin,Y.R., Choi,B.G., Byun,J.Y., Jung,E.S., and Kim,D.G. (2010). Imaging findings of intrahepatic bile duct adenoma (peribiliary gland hamartoma): a case report and literature review. Korean J Radiol. 11, 560-565.
Kimura,O., Takahashi,T., Ishii,N., Inoue,Y., Ueno,Y., Kogure,T., Fukushima,K., Shiina,M., Yamagiwa,Y., Kondo,Y., Inoue,J., Kakazu,E., Iwasaki,T., Kawagishi,N., Shimosegawa,T., and Sugamura,K. (2010). Characterization of the epithelial cell adhesion molecule (EpCAM)+ cell population in hepatocellular carcinoma cell lines. Cancer Sci. 101, 2145-2155.
Koike,H. and Taniguchi,H. (2012). Characteristics of hepatic stem/progenitor cells in the fetal and adult liver. J Hepatobiliary. Pancreat. Sci. 19, 587-593.
Kolaja,K.L. and Klaunig,J.E. (1997). Vitamin E modulation of hepatic focal lesion growth in mice. Toxicol. Appl. Pharmacol. 143, 380-387.
Kornek,M., Raskopf,E., Tolba,R., Becker,U., Klockner,M., Sauerbruch,T., and Schmitz,V. (2008). Accelerated orthotopic hepatocellular carcinomas growth is linked to increased expression of pro-angiogenic and prometastatic factors in murine liver fibrosis. Liver Int. 28, 509-518.
Kudo,M., Chung,H., and Osaki,Y. (2003). Prognostic staging system for hepatocellular carcinoma (CLIP score): its value and limitations, and a proposal for a new staging system, the Japan Integrated Staging Score (JIS score). J Gastroenterol. 38, 207-215.
Lakhtakia,R., Kumar,V., Reddi,H., Mathur,M., Dattagupta,S., and Panda,S.K. (2003). Hepatocellular carcinoma in a hepatitis B 'x' transgenic mouse model: A sequential pathological evaluation. J Gastroenterol. Hepatol. 18, 80-91.
Lan,X., Wu,Y.Z., Wang,Y., Wu,F.R., Zang,C.B., Tang,C., Cao,S., and Li,S.L. (2013). CD133 silencing inhibits stemness properties and enhances chemoradiosensitivity in CD133-positive liver cancer stem cells. Int. J Mol. Med. 31, 315-324.
Lapidot,T., Sirard,C., Vormoor,J., Murdoch,B., Hoang,T., Caceres-Cortes,J., Minden,M., Paterson,B., Caligiuri,M.A., and Dick,J.E. (1994). A cell initiating human acute myeloid leukaemia after transplantation into SCID mice. Nature 367, 645-648.

122
Lee,J.S., Heo,J., Libbrecht,L., Chu,I.S., Kaposi-Novak,P., Calvisi,D.F., Mikaelyan,A., Roberts,L.R., Demetris,A.J., Sun,Z., Nevens,F., Roskams,T., and Thorgeirsson,S.S. (2006). A novel prognostic subtype of human hepatocellular carcinoma derived from hepatic progenitor cells. Nat Med. 12, 410-416.
Lee,R.G., Tsamandas,A.C., and Demetris,A.J. (1997). Large cell change (liver cell dysplasia) and hepatocellular carcinoma in cirrhosis: matched case-control study, pathological analysis, and pathogenetic hypothesis. Hepatology 26, 1415-1422.
Lee,T.K., Castilho,A., Cheung,V.C., Tang,K.H., Ma,S., and Ng,I.O. (2011). CD24(+) liver tumor-initiating cells drive self-renewal and tumor initiation through STAT3-mediated NANOG regulation. Cell Stem Cell 9, 50-63.
Lee,T.K., Castilho,A., Ma,S., and Ng,I.O. (2009). Liver cancer stem cells: implications for a new therapeutic target. Liver Int. 29, 955-965.
Lei,H.J., Chau,G.Y., Lui,W.Y., Tsay,S.H., King,K.L., Loong,C.C., and Wu,C.W. (2006). Prognostic value and clinical relevance of the 6th Edition 2002 American Joint Committee on Cancer staging system in patients with resectable hepatocellular carcinoma. J Am. Coll. Surg. 203, 426-435.
Lencioni,R. (2012). Chemoembolization in Patients with Hepatocellular Carcinoma. Liver Cancer 1, 41-50.
Lencioni,R. and Crocetti,L. (2012). Local-regional treatment of hepatocellular carcinoma. Radiology 262, 43-58.
Leonardi,G.C., Candido,S., Cervello,M., Nicolosi,D., Raiti,F., Travali,S., Spandidos,D.A., and Libra,M. (2012). The tumor microenvironment in hepatocellular carcinoma (review). Int. J Oncol. 40, 1733-1747.
Li,W.L., Su,J., Yao,Y.C., Tao,X.R., Yan,Y.B., Yu,H.Y., Wang,X.M., Li,J.X., Yang,Y.J., Lau,J.T., and Hu,Y.P. (2006). Isolation and characterization of bipotent liver progenitor cells from adult mouse. Stem Cells 24, 322-332.
Libbrecht,L., Desmet,V., and Roskams,T. (2005). Preneoplastic lesions in human hepatocarcinogenesis. Liver Int. 25, 16-27.
Libbrecht,L., Desmet,V., Van,D.B., and Roskams,T. (2000). The immunohistochemical phenotype of dysplastic foci in human liver: correlation with putative progenitor cells. J Hepatol. 33, 76-84.
Lin,C.W., Lin,C.C., Mo,L.R., Chang,C.Y., Perng,D.S., Hsu,C.C., Lo,G.H., Chen,Y.S., Yen,Y.C., Hu,J.T., Yu,M.L., Lee,P.H., Lin,J.T., and Yang,S.S. (2013). Heavy alcohol consumption increases the incidence of hepatocellular carcinoma in hepatitis B virus-related cirrhosis. J Hepatol. 58, 730-735.
Lin,H., van den Esschert,J., Liu,C., and van Gulik,T.M. (2011). Systematic review of hepatocellular adenoma in China and other regions. J Gastroenterol. Hepatol. 26, 28-35.
Lingala,S., Cui,Y.Y., Chen,X., Ruebner,B.H., Qian,X.F., Zern,M.A., and Wu,J. (2010). Immunohistochemical staining of cancer stem cell markers in hepatocellular carcinoma. Exp. Mol. Pathol. 89, 27-35.
Llovet,J.M., Bru,C., and Bruix,J. (1999). Prognosis of hepatocellular carcinoma: the BCLC staging classification. Semin. Liver Dis. 19, 329-338.
Llovet,J.M., Ricci,S., Mazzaferro,V., Hilgard,P., Gane,E., Blanc,J.F., de Oliveira,A.C., Santoro,A., Raoul,J.L., Forner,A., Schwartz,M., Porta,C., Zeuzem,S., Bolondi,L., Greten,T.F., Galle,P.R., Seitz,J.F., Borbath,I.,

123
Haussinger,D., Giannaris,T., Shan,M., Moscovici,M., Voliotis,D., and Bruix,J. (2008). Sorafenib in advanced hepatocellular carcinoma. N. Engl. J Med. 359, 378-390.
Loeb,L.A. (2001). A mutator phenotype in cancer. Cancer Res. 61, 3230-3239.
Lowes,K.N., Brennan,B.A., Yeoh,G.C., and Olynyk,J.K. (1999). Oval cell numbers in human chronic liver diseases are directly related to disease severity. Am. J Pathol. 154, 537-541.
Ma,S., Chan,K.W., Hu,L., Lee,T.K., Wo,J.Y., Ng,I.O., Zheng,B.J., and Guan,X.Y. (2007). Identification and characterization of tumorigenic liver cancer stem/progenitor cells. Gastroenterology 132, 2542-2556.
Ma,S., Chan,K.W., Lee,T.K., Tang,K.H., Wo,J.Y., Zheng,B.J., and Guan,X.Y. (2008a). Aldehyde dehydrogenase discriminates the CD133 liver cancer stem cell populations. Mol. Cancer Res. 6, 1146-1153.
Ma,S., Lee,T.K., Zheng,B.J., Chan,K.W., and Guan,X.Y. (2008b). CD133+ HCC cancer stem cells confer chemoresistance by preferential expression of the Akt/PKB survival pathway. Oncogene 27, 1749-1758.
Ma,Y.C., Yang,J.Y., and Yan,L.N. (2013). Relevant markers of cancer stem cells indicate a poor prognosis in hepatocellular carcinoma patients: a meta-analysis. Eur. J Gastroenterol. Hepatol. 25, 1007-1016.
Magee,J.A., Piskounova,E., and Morrison,S.J. (2012). Cancer stem cells: impact, heterogeneity, and uncertainty. Cancer Cell 21, 283-296.
Malaguarnera,G., Giordano,M., Paladina,I., Berretta,M., Cappellani,A., and Malaguarnera,M. (2010). Serum markers of hepatocellular carcinoma. Dig. Dis. Sci. 55, 2744-2755.
Mao,S.A., Glorioso,J.M., and Nyberg,S.L. (2014). Liver regeneration. Transl. Res.
Marchio,A., Terris,B., Meddeb,M., Pineau,P., Duverger,A., Tiollais,P., Bernheim,A., and Dejean,A. (2001). Chromosomal abnormalities in liver cell dysplasia detected by comparative genomic hybridisation. Mol. Pathol. 54, 270-274.
Marjanovic,N.D., Weinberg,R.A., and Chaffer,C.L. (2013). Cell plasticity and heterogeneity in cancer. Clin. Chem. 59, 168-179.
Marra,M., Sordelli,I.M., Lombardi,A., Lamberti,M., Tarantino,L., Giudice,A., Stiuso,P., Abbruzzese,A., Sperlongano,R., Accardo,M., Agresti,M., Caraglia,M., and Sperlongano,P. (2011). Molecular targets and oxidative stress biomarkers in hepatocellular carcinoma: an overview. J Transl. Med. 9, 171.
Matsuo,M., Sakurai,H., and Saiki,I. (2003). ZD1839, a selective epidermal growth factor receptor tyrosine kinase inhibitor, shows antimetastatic activity using a hepatocellular carcinoma model. Mol. Cancer Ther. 2, 557-561.
McGivern,D.R. and Lemon,S.M. (2011). Virus-specific mechanisms of carcinogenesis in hepatitis C virus associated liver cancer. Oncogene 30, 1969-1983.
Misra,P. and Reddy,J. (2014). Peroxisome proliferator-activated receptor-a activation and excess energy burning in hepatocarcinogenesis. Biochime 98, 63-74.
Misra,S., Heldin,P., Hascall,V.C., Karamanos,N.K., Skandalis,S.S., Markwald,R.R., and Ghatak,S. (2011). Hyaluronan-CD44 interactions as potential targets for cancer therapy. FEBS J 278, 1429-1443.

124
Mitsutake,N., Iwao,A., Nagai,K., Namba,H., Ohtsuru,A., Saenko,V., and Yamashita,S. (2007). Characterization of side population in thyroid cancer cell lines: cancer stem-like cells are enriched partly but not exclusively. Endocrinology 148, 1797-1803.
Moriya,K., Fujie,H., Shintani,Y., Yotsuyanagi,H., Tsutsumi,T., Ishibashi,K., Matsuura,Y., Kimura,S., Miyamura,T., and Koike,K. (1998). The core protein of hepatitis C virus induces hepatocellular carcinoma in transgenic mice. Nat Med. 4, 1065-1067.
Munaka,M., Kohshi,K., Kawamoto,T., Takasawa,S., Nagata,N., Itoh,H., Oda,S., and Katoh,T. (2003). Genetic polymorphisms of tobacco- and alcohol-related metabolizing enzymes and the risk of hepatocellular carcinoma. J Cancer Res. Clin. Oncol. 129, 355-360.
Nahm,C.B., Ng,K., Lockie,P., Samra,J.S., and Hugh,T.J. (2011). Focal nodular hyperplasia--a review of myths and truths. J Gastrointest. Surg. 15, 2275-2283.
Nakayama,M., Ogasawara,S., Akiba,J., Ueda,K., Koura,K., Todoroki,K., Kinoshita,H., and Yano,H. (2013). SP cell fractions from HCC cell lines increased with tumor dedifferentiation, but lack characteristic features of CSCs. J Gastroenterol. Hepatol.
Newell,P., Villanueva,A., Friedman,S.L., Koike,K., and Llovet,J.M. (2008). Experimental models of hepatocellular carcinoma. J Hepatol. 48, 858-879.
Nordenstedt,H., White,D.L., and El-Serag,H.B. (2010). The changing pattern of epidemiology in hepatocellular carcinoma. Dig. Liver Dis. 42 Suppl 3, S206-S214.
Nowell,P.C. (1976). The clonal evolution of tumor cell populations. Science 194, 23-28.
Okabe,M., Tsukahara,Y., Tanaka,M., Suzuki,K., Saito,S., Kamiya,Y., Tsujimura,T., Nakamura,K., and Miyajima,A. (2009). Potential hepatic stem cells reside in EpCAM+ cells of normal and injured mouse liver. Development 136, 1951-1960.
Okuda,K., Ohtsuki,T., Obata,H., Tomimatsu,M., Okazaki,N., Hasegawa,H., Nakajima,Y., and Ohnishi,K. (1985). Natural history of hepatocellular carcinoma and prognosis in relation to treatment. Study of 850 patients. Cancer 56, 918-928.
Olsson,M., Lindahl,G., and Ruoslahti,E. (1977). Genetic control of alpha-fetoprotein synthesis in the mouse. J Exp. Med. 145, 819-827.
Overturf,K., al-Dhalimy,M., Ou,C.N., Finegold,M., and Grompe,M. (1997). Serial transplantation reveals the stem-cell-like regenerative potential of adult mouse hepatocytes. Am. J Pathol. 151, 1273-1280.
Parent,R., Marion,M.J., Furio,L., Trepo,C., and Petit,M.A. (2004). Origin and characterization of a human bipotent liver progenitor cell line. Gastroenterology 126, 1147-1156.
Park,Y.N. (2011). Update on precursor and early lesions of hepatocellular carcinomas. Arch. Pathol. Lab Med. 135, 704-715.
Park,Y.N. and Roncalli,M. (2006). Large liver cell dysplasia: a controversial entity. J Hepatol. 45, 734-743.

125
Petersen,B.E., Bowen,W.C., Patrene,K.D., Mars,W.M., Sullivan,A.K., Murase,N., Boggs,S.S., Greenberger,J.S., and Goff,J.P. (1999). Bone marrow as a potential source of hepatic oval cells. Science 284, 1168-1170.
Petersen,B.E., Grossbard,B., Hatch,H., Pi,L., Deng,J., and Scott,E.W. (2003). Mouse A6-positive hepatic oval cells also express several hematopoietic stem cell markers. Hepatology 37, 632-640.
Pfaffl,M.W. (2001). A new mathematical model for relative quantification in real-time RT-PCR. Nucleic Acids Res. 29, e45.
Piao,L.S., Hur,W., Kim,T.K., Hong,S.W., Kim,S.W., Choi,J.E., Sung,P.S., Song,M.J., Lee,B.C., Hwang,D., and Yoon,S.K. (2012). CD133+ liver cancer stem cells modulate radioresistance in human hepatocellular carcinoma. Cancer Lett. 315, 129-137.
Pihko,H. and Ruoslahti,E. (1973). High level of alpha-fetoprotein in sera of adult mice. Int. J Cancer 12, 354-360.
Plentz,R.R., Park,Y.N., Lechel,A., Kim,H., Nellessen,F., Langkopf,B.H., Wilkens,L., Destro,A., Fiamengo,B., Manns,M.P., Roncalli,M., and Rudolph,K.L. (2007). Telomere shortening and inactivation of cell cycle checkpoints characterize human hepatocarcinogenesis. Hepatology 45, 968-976.
Pollard,D.R., Woodward,B., and Gupta,K. (1982). Strain and sex differences in serum alpha-fetoprotein levels in Mus musculus. Can. J Genet. Cytol. 24, 343-346.
Polyak,K., Haviv,I., and Campbell,I.G. (2009). Co-evolution of tumor cells and their microenvironment. Trends Genet. 25, 30-38.
Ramakrishna,G., Rastogi,A., Trehanpati,N., Sen,B., Khosla,R., and Sarin,S.K. (2013). From Cirrhosis to Hepatocellular Carcinoma: New Molecular Insights on Inflammation and Cellular Senescence. Liver Cancer 2, 367-383.
Rampone,B., Schiavone,B., Martino,A., Viviano,C., and Confuorto,G. (2009). Current management strategy of hepatocellular carcinoma. World J Gastroenterol. 15, 3210-3216.
Rebouissou,S., Bioulac-Sage,P., and Zucman-Rossi,J. (2008). Molecular pathogenesis of focal nodular hyperplasia and hepatocellular adenoma. J Hepatol. 48, 163-170.
Rebucci,M. and Michiels,C. (2013). Molecular aspects of cancer cell resistance to chemotherapy. Biochem. Pharmacol. 85, 1219-1226.
Reya,T., Morrison,S.J., Clarke,M.F., and Weissman,I.L. (2001). Stem cells, cancer, and cancer stem cells. Nature 414, 105-111.
Reynolds,B.A. and Weiss,S. (1992). Generation of neurons and astrocytes from isolated cells of the adult mammalian central nervous system. Science 255, 1707-1710.
Richardson,M.M., Jonsson,J.R., Powell,E.E., Brunt,E.M., Neuschwander-Tetri,B.A., Bhathal,P.S., Dixon,J.B., Weltman,M.D., Tilg,H., Moschen,A.R., Purdie,D.M., Demetris,A.J., and Clouston,A.D. (2007). Progressive fibrosis in nonalcoholic steatohepatitis: association with altered regeneration and a ductular reaction. Gastroenterology 133, 80-90.

126
Roncalli,M., Terracciano,L., Di,T.L., David,E., and Colombo,M. (2011). Liver precancerous lesions and hepatocellular carcinoma: the histology report. Dig. Liver Dis. 43 Suppl 4, S361-S372.
Roskams,T. (2003). Progenitor cell involvement in cirrhotic human liver diseases: from controversy to consensus. J Hepatol. 39, 431-434.
Roskams,T., De,V.R., Van,E.P., Myazaki,H., Van,D.B., and Desmet,V. (1998). Hepatic OV-6 expression in human liver disease and rat experiments: evidence for hepatic progenitor cells in man. J Hepatol. 29, 455-463.
Roskams,T., Yang,S.Q., Koteish,A., Durnez,A., DeVos,R., Huang,X., Achten,R., Verslype,C., and Diehl,A.M. (2003). Oxidative stress and oval cell accumulation in mice and humans with alcoholic and nonalcoholic fatty liver disease. Am. J Pathol. 163, 1301-1311.
Roskams,T.A., Theise,N.D., Balabaud,C., Bhagat,G., Bhathal,P.S., Bioulac-Sage,P., Brunt,E.M., Crawford,J.M., Crosby,H.A., Desmet,V., Finegold,M.J., Geller,S.A., Gouw,A.S., Hytiroglou,P., Knisely,A.S., Kojiro,M., Lefkowitch,J.H., Nakanuma,Y., Olynyk,J.K., Park,Y.N., Portmann,B., Saxena,R., Scheuer,P.J., Strain,A.J., Thung,S.N., Wanless,I.R., and West,A.B. (2004). Nomenclature of the finer branches of the biliary tree: canals, ductules, and ductular reactions in human livers. Hepatology 39, 1739-1745.
Rountree,C.B., Barsky,L., Ge,S., Zhu,J., Senadheera,S., and Crooks,G.M. (2007). A CD133-expressing murine liver oval cell population with bilineage potential. Stem Cells 25, 2419-2429.
Ruck,P., Xiao,J.C., Pietsch,T., Von,S.D., and Kaiserling,E. (1997). Hepatic stem-like cells in hepatoblastoma: expression of cytokeratin 7, albumin and oval cell associated antigens detected by OV-1 and OV-6. Histopathology 31, 324-329.
Salguero Palacios R., Roderfeld,M., Hemmann,S., Rath,T., Atanasova,S., Tschuschner,A., Gressner,O.A., Weiskirchen,R., Graf,J., and Roeb,E. (2008). Activation of hepatic stellate cells is associated with cytokine expression in thioacetamide-induced hepatic fibrosis in mice. Lab Invest 88, 1192-1203.
Sangiovanni,A., Del,N.E., Fasani,P., De,F.C., Ronchi,G., Romeo,R., Morabito,A., De,F.R., and Colombo,M. (2004). Increased survival of cirrhotic patients with a hepatocellular carcinoma detected during surveillance. Gastroenterology 126, 1005-1014.
Sasaki,A., Kamiyama,T., Yokoo,H., Nakanishi,K., Kubota,K., Haga,H., Matsushita,M., Ozaki,M., Matsuno,Y., and Todo,S. (2010). Cytoplasmic expression of CD133 is an important risk factor for overall survival in hepatocellular carcinoma. Oncol. Rep. 24, 537-546.
Schmelzer,E. and Reid,L.M. (2008). EpCAM expression in normal, non-pathological tissues. Front Biosci. 13, 3096-3100.
Severi,T., van,M.H., Verslype,C., and van Pelt,J.F. (2010). Tumor initiation and progression in hepatocellular carcinoma: risk factors, classification, and therapeutic targets. Acta Pharmacol. Sin. 31, 1409-1420.
Sheweita,S.A., El-Gabar,M.A., and Bastawy,M. (2001). Carbon tetrachloride changes the activity of cytochrome P450 system in the liver of male rats: role of antioxidants. Toxicology 169, 83-92.
Shi,G.M., Xu,Y., Fan,J., Zhou,J., Yang,X.R., Qiu,S.J., Liao,Y., Wu,W.Z., Ji,Y., Ke,A.W., Ding,Z.B., He,Y.Z., Wu,B., Yang,G.H., Qin,W.Z., Zhang,W., Zhu,J., Min,Z.H., and Wu,Z.Q. (2008). Identification of side population cells in
127
human hepatocellular carcinoma cell lines with stepwise metastatic potentials. J Cancer Res. Clin. Oncol. 134, 1155-1163.
Shin,H.R., Oh,J.K., Masuyer,E., Curado,M.P., Bouvard,V., Fang,Y.Y., Wiangnon,S., Sripa,B., and Hong,S.T. (2010). Epidemiology of cholangiocarcinoma: an update focusing on risk factors. Cancer Sci. 101, 579-585.
Siegel,A.B. and Zhu,A.X. (2009). Metabolic syndrome and hepatocellular carcinoma: two growing epidemics with a potential link. Cancer 115, 5651-5661.
Singh,S.K., Clarke,I.D., Terasaki,M., Bonn,V.E., Hawkins,C., Squire,J., and Dirks,P.B. (2003). Identification of a cancer stem cell in human brain tumors. Cancer Res. 63, 5821-5828.
Singh,S.K., Hawkins,C., Clarke,I.D., Squire,J.A., Bayani,J., Hide,T., Henkelman,R.M., Cusimano,M.D., and Dirks,P.B. (2004). Identification of human brain tumour initiating cells. Nature 432, 396-401.
Song,W., Li,H., Tao,K., Li,R., Song,Z., Zhao,Q., Zhang,F., and Dou,K. (2008). Expression and clinical significance of the stem cell marker CD133 in hepatocellular carcinoma. Int. J. Clin. Pract. 62, 1212-1218.
Spector,L.G. and Birch,J. (2012). The epidemiology of hepatoblastoma. Pediatr. Blood Cancer 59, 776-779.
Stahl,S., Ittrich,C., Marx-Stoelting,P., Kohle,C., Altug-Teber,O., Riess,O., Bonin,M., Jobst,J., Kaiser,S., Buchmann,A., and Schwarz,M. (2005). Genotype-phenotype relationships in hepatocellular tumors from mice and man. Hepatology 42, 353-361.
Suetsugu,A., Nagaki,M., Aoki,H., Motohashi,T., Kunisada,T., and Moriwaki,H. (2006). Characterization of CD133+ hepatocellular carcinoma cells as cancer stem/progenitor cells. Biochem. Biophys. Res. Commun. 351, 820-824.
Sukowati,C.H., Anfuso,B., Torre,G., Francalanci,P., Croce,L.S., and Tiribelli,C. (2013). The expression of CD90/Thy-1 in hepatocellular carcinoma: an in vivo and in vitro study. PLoS One 8, e76830.
Sukowati,C.H., Rosso,N., Pascut,D., Anfuso,B., Torre,G., Francalanci,P., Croce,L.S., and Tiribelli,C. (2012). Gene and functional up-regulation of the BCRP/ABCG2 transporter in hepatocellular carcinoma. BMC. Gastroenterol. 12, 160.
Szotek,P.P., Pieretti-Vanmarcke,R., Masiakos,P.T., Dinulescu,D.M., Connolly,D., Foster,R., Dombkowski,D., Preffer,F., Maclaughlin,D.T., and Donahoe,P.K. (2006). Ovarian cancer side population defines cells with stem cell-like characteristics and Mullerian Inhibiting Substance responsiveness. Proc. Natl. Acad Sci. U. S. A 103, 11154-11159.
Takayasu,K., Arii,S., Ikai,I., Omata,M., Okita,K., Ichida,T., Matsuyama,Y., Nakanuma,Y., Kojiro,M., Makuuchi,M., and Yamaoka,Y. (2006). Prospective cohort study of transarterial chemoembolization for unresectable hepatocellular carcinoma in 8510 patients. Gastroenterology 131, 461-469.
Tarsetti,F., Lenzi,R., Salvi,R., Schuler,E., Rijhsinghani,K., Lenzen,R., and Tavoloni,N. (1993). Liver carcinogenesis associated with feeding of ethionine in a choline-free diet: evidence against a role of oval cells in the emergence of hepatocellular carcinoma. Hepatology 18, 596-603.
128
Tsuchiya,A., Heike,T., Baba,S., Fujino,H., Umeda,K., Matsuda,Y., Nomoto,M., Ichida,T., Aoyagi,Y., and Nakahata,T. (2007). Long-term culture of postnatal mouse hepatic stem/progenitor cells and their relative developmental hierarchy. Stem Cells 25, 895-902.
Tsukuma,H., Hiyama,T., Tanaka,S., Nakao,M., Yabuuchi,T., Kitamura,T., Nakanishi,K., Fujimoto,I., Inoue,A., Yamazaki,H., and . (1993). Risk factors for hepatocellular carcinoma among patients with chronic liver disease. N. Engl. J Med. 328, 1797-1801.
Uchida,Y., Tanaka,S., Aihara,A., Adikrisna,R., Yoshitake,K., Matsumura,S., Mitsunori,Y., Murakata,A., Noguchi,N., Irie,T., Kudo,A., Nakamura,N., Lai,P.B., and Arii,S. (2010). Analogy between sphere forming ability and stemness of human hepatoma cells. Oncol. Rep. 24, 1147-1151.
Van Eyken,P., Sciot,R., Paterson,A., Callea,F., Kew,M.C., and Desmet,V.J. (1988). Cytokeratin expression in hepatocellular carcinoma: an immunohistochemical study. Hum. Pathol. 19, 562-568.
Verna,L., Whysner,J., and Williams,G.M. (1996). N-nitrosodiethylamine mechanistic data and risk assessment: bioactivation, DNA-adduct formation, mutagenicity, and tumor initiation. Pharmacol. Ther. 71, 57-81.
Viegas,M.S., Martins,T.C., Seco,F., and do,C.A. (2007). An improved and cost-effective methodology for the reduction of autofluorescence in direct immunofluorescence studies on formalin-fixed paraffin-embedded tissues. Eur. J Histochem. 51, 59-66.
Vivarelli,M., Montalti,R., and Risaliti,A. (2013). Multimodal treatment of hepatocellular carcinoma on cirrhosis: An update. World J Gastroenterol. 19, 7316-7326.
Wang,J.S. and Groopman,J.D. (1999). DNA damage by mycotoxins. Mutat. Res. 424, 167-181.
Wiemann,S.U., Satyanarayana,A., Tsahuridu,M., Tillmann,H.L., Zender,L., Klempnauer,J., Flemming,P., Franco,S., Blasco,M.A., Manns,M.P., and Rudolph,K.L. (2002). Hepatocyte telomere shortening and senescence are general markers of human liver cirrhosis. FASEB J 16, 935-942.
Wood,M.J., Gadd,V.L., Powell,L.W., Ramm,G.A., and Clouston,A.D. (2013). Ductular reaction in hereditary hemochromatosis: The link between hepatocyte senescence and fibrosis progression. Hepatology.
World Health organization (2009). Hepatitis B vaccines. Weekly Epidemiological Record (WER) 84, 405-420.
Wu,H.C. and Santella,R. (2012). The role of aflatoxins in hepatocellular carcinoma. Hepat. Mon. 12, e7238.
Wu,P.C., Fang,J.W., Lau,V.K., Lai,C.L., Lo,C.K., and Lau,J.Y. (1996). Classification of hepatocellular carcinoma according to hepatocellular and biliary differentiation markers. Clinical and biological implications. Am. J Pathol. 149, 1167-1175.
Wulf,G.G., Wang,R.Y., Kuehnle,I., Weidner,D., Marini,F., Brenner,M.K., Andreeff,M., and Goodell,M.A. (2001). A leukemic stem cell with intrinsic drug efflux capacity in acute myeloid leukemia. Blood 98, 1166-1173.
Xiao,J.C., Jin,X.L., Ruck,P., Adam,A., and Kaiserling,E. (2004). Hepatic progenitor cells in human liver cirrhosis: immunohistochemical, electron microscopic and immunofluorencence confocal microscopic findings. World J Gastroenterol. 10, 1208-1211.
129
Yamashita,T., Forgues,M., Wang,W., Kim,J.W., Ye,Q., Jia,H., Budhu,A., Zanetti,K.A., Chen,Y., Qin,L.X., Tang,Z.Y., and Wang,X.W. (2008). EpCAM and alpha-fetoprotein expression defines novel prognostic subtypes of hepatocellular carcinoma. Cancer Res. 68, 1451-1461.
Yamashita,T., Honda,M., Nakamoto,Y., Baba,M., Nio,K., Hara,Y., Zeng,S.S., Hayashi,T., Kondo,M., Takatori,H., Yamashita,T., Mizukoshi,E., Ikeda,H., Zen,Y., Takamura,H., Wang,X.W., and Kaneko,S. (2013). Discrete nature of EpCAM+ and CD90+ cancer stem cells in human hepatocellular carcinoma. Hepatology 57, 1484-1497.
Yamashita,T., Ji,J., Budhu,A., Forgues,M., Yang,W., Wang,H.Y., Jia,H., Ye,Q., Qin,L.X., Wauthier,E., Reid,L.M., Minato,H., Honda,M., Kaneko,S., Tang,Z.Y., and Wang,X.W. (2009). EpCAM-positive hepatocellular carcinoma cells are tumor-initiating cells with stem/progenitor cell features. Gastroenterology 136, 1012-1024.
Yang,J.D., Nakamura,I., and Roberts,L.R. (2011). The tumor microenvironment in hepatocellular carcinoma: current status and therapeutic targets. Semin. Cancer Biol. 21, 35-43.
Yang,X.R., Xu,Y., Shi,G.M., Fan,J., Zhou,J., Ji,Y., Sun,H.C., Qiu,S.J., Yu,B., Gao,Q., He,Y.Z., Qin,W.Z., Chen,R.X., Yang,G.H., Wu,B., Lu,Q., Wu,Z.Q., and Tang,Z.Y. (2008a). Cytokeratin 10 and cytokeratin 19: predictive markers for poor prognosis in hepatocellular carcinoma patients after curative resection. Clin. Cancer Res. 14, 3850-3859.
Yang,Z.F., Ho,D.W., Ng,M.N., Lau,C.K., Yu,W.C., Ngai,P., Chu,P.W., Lam,C.T., Poon,R.T., and Fan,S.T. (2008b). Significance of CD90+ cancer stem cells in human liver cancer. Cancer Cell 13, 153-166.
Yang,Z.F., Ngai,P., Ho,D.W., Yu,W.C., Ng,M.N., Lau,C.K., Li,M.L., Tam,K.H., Lam,C.T., Poon,R.T., and Fan,S.T. (2008c). Identification of local and circulating cancer stem cells in human liver cancer. Hepatology 47, 919-928.
Yin,A.H., Miraglia,S., Zanjani,E.D., Almeida-Porada,G., Ogawa,M., Leary,A.G., Olweus,J., Kearney,J., and Buck,D.W. (1997). AC133, a novel marker for human hematopoietic stem and progenitor cells. Blood 90, 5002-5012.
Yin,S., Li,J., Hu,C., Chen,X., Yao,M., Yan,M., Jiang,G., Ge,C., Xie,H., Wan,D., Yang,S., Zheng,S., and Gu,J. (2007). CD133 positive hepatocellular carcinoma cells possess high capacity for tumorigenicity. Int. J Cancer 120, 1444-1450.
Yin,X., Li,Y.W., Jin,J.J., Zhou,Y., Ren,Z.G., Qiu,S.J., and Zhang,B.H. (2013). The clinical and prognostic implications of pluripotent stem cell gene expression in hepatocellular carcinoma. Oncol. Lett. 5, 1155-1162.
Yoshikawa,S., Zen,Y., Fujii,T., Sato,Y., Ohta,T., Aoyagi,Y., and Nakanuma,Y. (2009). Characterization of CD133+ parenchymal cells in the liver: histology and culture. World J. Gastroenterol. 15, 4896-4906.
Yu,M.W., Lien,J.P., Chiu,Y.H., Santella,R.M., Liaw,Y.F., and Chen,C.J. (1997). Effect of aflatoxin metabolism and DNA adduct formation on hepatocellular carcinoma among chronic hepatitis B carriers in Taiwan. J Hepatol. 27, 320-330.
Zabron,A., Edwards,R.J., and Khan,S.A. (2013). The challenge of cholangiocarcinoma: dissecting the molecular mechanisms of an insidious cancer. Dis. Model. Mech. 6, 281-292.
Zen,Y., Fujii,T., Yoshikawa,S., Takamura,H., Tani,T., Ohta,T., and Nakanuma,Y. (2007). Histological and culture studies with respect to ABCG2 expression support the existence of a cancer cell hierarchy in human hepatocellular carcinoma. Am. J Pathol. 170, 1750-1762.

130
Zheng,Y.W., Zhang,X.W., Zhang,J.L., Hui,Z.Z., Du,W.J., Li,R.M., and Ren,X.B. (2013). Primary Hepatic Angiosarcoma and Potential Treatment Options. J Gastroenterol. Hepatol.
Zhou,H., Rogler,L.E., Teperman,L., Morgan,G., and Rogler,C.E. (2007). Identification of hepatocytic and bile ductular cell lineages and candidate stem cells in bipolar ductular reactions in cirrhotic human liver. Hepatology 45, 716-724.
Zhu,Z., Hao,X., Yan,M., Yao,M., Ge,C., Gu,J., and Li,J. (2010). Cancer stem/progenitor cells are highly enriched in CD133+CD44+ population in hepatocellular carcinoma. Int. J Cancer 126, 2067-2078.
Zucman-Rossi,J. (2004). Genetic alterations in hepatocellular adenomas: recent findings and new challenges. J Hepatol. 40, 1036-1039.


![Bone Marrow Mesenchymal Stem Cells Inhibit ......Bone Marrow Mesenchymal Stem Cells Inhibit ... and TLR4 response to acute otitis through activation of NF-𝜅B [15], we hypothesized](https://img.pdfslide.net/doc/110x75/60a8bcfbd0a1141ee6336b62/bone-marrow-mesenchymal-stem-cells-inhibit-bone-marrow-mesenchymal-stem.jpg)