Embed Size (px)
Citation preview
arX
iv:a
stro
-ph/
9702
127v
1 1
4 Fe
b 19
97A&A manuscript no.
(will be inserted by hand later)
Your thesaurus codes are:
08.01.2, 08.02.1, 08.03.3, 08.06.1, 08.12.1
ASTRONOMYAND
ASTROPHYSICS2.6.2021
Multiwavelength optical observations of chromospherically
active binary systems
I. Simultaneous Hα, Na i D, D, and He i D observations ⋆
D. Montes, M.J. Fernandez-Figueroa, E. De Castro, and J. Sanz-Forcada
Departamento de Astrofısica, Facultad de Fısicas, Universidad Complutense de Madrid, E-28040 Madrid, SpainE-mail: [email protected]
Received ; accepted
Abstract. This is the first paper of a series aimed atstudying the chromosphere of active binary systems usingthe information provided for several optical spectroscopicfeatures. Simultaneous Hα, Na i D1, D2, and He i D3 spec-troscopic observations are reported here for 18 systems.The chromospheric contribution in these lines have beendetermined using the spectral subtraction technique. Verybroad wings have been found in the subtracted Hα profileof some of the more active stars. These profiles are wellmatched using a two-components Gaussian fit (narrow andbroad) and the broad component could be interpreted asarising from microflaring. Prominence-like extended ma-terial have been detected in a near-eclipse Hα observationof the system AR Lac. The excess emission found in theNa i D1 and D2 lines by application of the spectral sub-traction technique and the behaviour of the Hα line in thecorresponding simultaneous observations indicate that thefilling-in of the core of these lines is a chromospheric ac-tivity indicator. For giant stars of the sample the He iD3 line has been detected in absorption in the subtractedspectra. An optical flare has been detected in UX Ari andII Peg through the presence of the He i D3 in emission incoincidence with the enhancement of the Hα emission.
Key words: stars: activity – stars: binaries: close – stars:chromospheres – stars: flare – stars: late-type
Send offprint requests to: D. Montes⋆ Based on observations made with the Isaac Newton tele-scope operated on the island of La Palma by the Royal Green-wich Observatory at the Spanish Observatorio del Roque deLos Muchachos of the Instituto de Astrofısica de Canarias
1. Introduction
The chromospherically active binaries are detached binarysystems with cool components characterized by strongchromospheric, transition region, and coronal activity.The RS CVn systems have at least one cool evolved com-ponent whereas both components of the BY Dra binariesare main sequence stars (Fekel et al. 1986).
In this series of papers we try to study the chromo-sphere of this kind of extremely active stars using theinformation provided by several optical spectroscopic fea-tures that could be used as chromospheric activity indica-tors. The simultaneous observations of different lines, thatare formed at different height in the chromosphere (fromthe region of temperature minimum to the higher chromo-sphere), are of special interest for stellar activity studiessince they provide very useful information about this stel-lar region. Ideally, simultaneous observations should beperformed at all wavelengths in order to develop a coher-ent 3-D atmosphere model. In practice, simultaneous ob-servations of several activity indicators are rare and tendto focus on the same small number of extremely activesystems.
The best way to obtain the active-chromosphere con-tribution to some spectral line in the chromospheri-cally active binaries is to subtract the underlying photo-spheric contribution using the spectral subtraction tech-nique (subtraction of a synthesized stellar spectrum con-structed from artificially rotationally broadened, radial-velocity shifted, and weighted spectra of inactive starschosen to match the spectral types and luminosity classesof both components of the active system under consider-ation)
The emissions in the Ca ii H & K resonance linesare the most widely used optical indicators of chromo-spheric activity, since their source functions are collision-ally controlled and represent an extremely important cool-
2 D. Montes et al.: Simultaneous Hα, Na i D1, D2, and He i D3 observations
ing mechanism. In chromospheric active binaries the sub-traction of the photospheric flux in this spectral regionhas been recently applied using the spectral subtraction(see Montes et al. 1995c, 1996a and references therein).
The Hα line is also an important chromospheric ac-tivity indicator, but it is only in emission above the con-tinuum in very active stars, and in less active star onlya filled-in absorption line is observed. So, to infer chro-mospheric activity level the spectral subtraction is needed(see Montes et al. 1994; 1995a; b; d, and references therein;Lazaro & Arevalo 1996). A similar behaviour is observedin the other Balmer lines (Hall & Ramsey 1992; Monteset al. 1995d).
Recently, the spectral subtraction technique has beenused in other lines as the Ca ii IRT, Mg i b, Na i D1, D2,and He i D3 lines (Gunn & Doyle 1996; Gunn et al. 1996).The Ca ii IRT lines are formed deeper in the atmosphereand are thus sensitive probes of the temperature minimumregion. The Na i D1, D2 lines are collision dominated andare good indicators of changes in the lower chromosphere.The Mg i b triplet lines are formed in the lower chromo-sphere and the region of temperature minimum and theyare good diagnostics of photospheric activity (Basri et al.1989). The He i D3 line has been largely ignored as ac-tivity indicator; however it could be a valuable probe ofstellar activity and the observation of this line in emissionsupports the detection of flare like events (Zirin 1988).
In this first paper we focus our study on the analysis ofthe extensively used Hα chromospheric activity indicatortogether with simultaneous observations of the less stud-ied He i D3 and Na i D1, D2 spectral features in a sam-ple of 18 northern active binary systems selected from ”ACatalog of Chromospherically Active Binary Stars (sec-ond edition)” (Strassmeier et al. 1993, hereafter CABS).By using the spectral subtraction technique, we have de-termined the excess emission in these lines and we havecomputed absolute chromospheric fluxes in Hα. The pri-mary aim of this study is analyse in detail the excess Hαemission and to study the subtracted Hα line profile, espe-cially in some extremely active stars which exhibit broadwings. Moreover, we try to understand the behaviour ofthe He i D3 and Na i D1, D2 lines as chromospheric activ-ity indicators taking into account the advantage that wesimultaneously know the behaviour of the chromosphericexcess Hα emission in these systems. In forthcoming pa-pers we will analyze in detail several optical spectroscopicfeatures using echelle spectroscopy in order to determinethe effects of stellar activity on spectral lines originatingat different heights in the chromosphere. Another of ourgoals is to obtain information about the presence of ex-tended matter (prominence-like structures) in the chro-mospheric active binaries using simultaneous Hα and Hβobservations at near-eclipse orbital phases.
In Sect. 2 we give the details of our observations anddata reduction. In Sect. 3 we describe the individual re-
sults of Hα, Na i D1, D2, and He i D3 line observations ofour sample. Finally in Sect. 4 we discuss our results.
2. Observations and Data Reduction
Observations in the Hα and Na i D1, D2, He i D3 lineregions have been obtained during three nights (1995September 13-15) with the Isaac Newton Telescope (INT)at the Observatorio del Roque de Los Muchachos (LaPalma, Spain) using the Intermediate Dispersion Spec-trograph (IDS) with grating H1800V, camera 500 and a1024 x 1024 pixel TEK3 CCD as detector. The reciprocaldispersion achieved is 0.24 A/pixel which yields a spec-tral resolution of 0.48 A and a useful wavelength rangeof 250 A centered at 6563A (Hα) and 5876A (Hei D3)respectively.
The spectra have been extracted using the standardreduction procedures in the IRAF package (bias subtrac-tion, flat-field division, and optimal extraction of the spec-tra). The wavelength calibration was obtained by takingspectra of a Cu-Ar lamp. Finally, the spectra have beennormalized by a polynomial fit to the observed continuum.
In Table 1 we give the observing log. For each star welist the date, UT, orbital phase (ϕ) and signal to noiseratio (S/N) obtained for each observation in both spectralregions. Where appropriate, we also give the reference ofour previous observation of these systems in the Hα andCa ii H & K lines.
In Table 2 we show the HD number, name and theadopted stellar parameters (from CABS or the referencesgiven in the table) for the 18 chromospherically activebinary systems selected.
We have obtained the chromospheric contribution inHα Na i D1, D2, and He i D3 lines using the spectral sub-traction technique described in detail by Montes et al.(1995a, c).
The synthesized spectra were constructed using artifi-cially rotationally broadened, radial-velocity shifted, andweighted spectra of inactive stars chosen to match thespectral types and luminosity classes of both componentsof the active system under consideration. The referencestars used have been observed in this campaign and previ-ous observational seasons with similar spectral resolution(see the spectral library of Montes et al. 1997).
In some case, the difference spectrum obtained ap-pears noisier than expected from the observation S/N ratio(≈ 300) due to small differences in spectral type betweenactive and reference star, or to non appropriate evaluationof the rotational broadening and/or of the Doppler shift.In addition, in some spectra telluric lines also appear inthe difference spectrum. This noise in the the differencespectrum have been evaluated as the mean standard de-viation (σ) in the regions outside the chromospheric fea-tures. We have obtained values of σ in the range 0.01-0.03 which could be important in low active star but inthe more active stars the errors in the excess Hα EW are
D. Montes et al.: Simultaneous Hα, Na i D1, D2, and He i D3 observations 3
Table 1. Hα and Na i D1, D2, He i D3 Observing log, and previous Hα and Ca ii H & K observations
Name Hα line region Na I D1, D2, He I D3 line region Previous obs.
Date UT ϕ S/N Date UT ϕ S/N Hα Ca II
BD Cet 1995/09/15 00:43 0.569 330 1995/09/15 01:03 0.569 361 - 95c,96a
AY Cet 1995/09/15 02:03 0.797 385 1995/09/15 02:20 0.797 398 - 95c,96a
AR Psc 1995/09/13 01:48 0.373 387 1995/09/13 01:27 0.372 141 94,95a 94,96a” 1995/09/14 01:42 0.443 361 1995/09/14 02:00 0.443 369 - -” 1995/09/15 03:55 0.519 392 1995/09/15 04:23 0.520 399 - -” 1995/09/15 05:34 0.524 305 1995/09/15 05:28 0.523 359 - -
HD 12545 1995/09/15 02:59 0.401 354 1995/09/15 02:25 0.400 361 - 95c,,96a
UX Ari 1995/09/13 02:08 0.419 346 95b 95c,96a” 1995/09/13 05:08 0.438 202 1995/09/13 04:52 0.437 494 - -” 1995/09/14 02:24 0.576 276 1995/09/14 02:09 0.574 293 - -” 1995/09/15 03:09 0.736 352 1995/09/15 03:32 0.739 410 - -
V711 Tau 1995/09/13 05:15 0.922 360 1995/09/13 05:36 0.927 370 94,95a 94,96a” 1995/09/14 04:19 0.261 374 1995/09/14 04:35 0.265 423 - -” 1995/09/14 05:35 0.280 332 1995/09/14 05:50 0.283 386 - -” 1995/09/15 03:50 0.606 342 1995/09/15 03:44 0.605 332 - -” 1995/09/15 06:11 0.641 314 1995/09/15 06:05 0.639 326 - -
V833 Tau 1995/09/13 06:13 0.762 184 1995/09/15 05:47 0.752 325 95b -” 1995/09/14 06:07 0.319 424 1995/09/14 05:55 0.314 417 - -” 1995/09/15 04:56 0.851 394 1995/09/15 05:18 0.859 322 - -
V1149 Ori 1995/09/15 06:17 0.439 311 1995/09/15 06:29 0.439 335 95b 95c,96a
MM Her 1995/09/12 20:56 0.498 274 1995/09/12 21:31 0.501 329 94,95a 94,96a” 1995/09/13 22:06 0.630 332 1995/09/13 20:45 0.623 384 - -” 1995/09/14 20:09 0.745 257 1995/09/14 20:41 0.748 314 - -
V815 Her 1995/09/12 20:43 0.978 360 1995/09/12 20:21 0.970 341 94,95a 94,96a” 1995/09/13 20:15 0.520 375 1995/09/13 20:22 0.523 341 - -” 1995/09/14 21:24 0.099 354 1995/09/14 21:44 0.107 394 - -
BY Dra 1995/09/13 22:58 0.684 387 1995/09/13 23:15 0.686 372 - 94,96a” 1995/09/14 21:56 0.839 398 1995/09/14 21:05 0.838 404 - -
V775 Her 1995/09/14 22:03 0.394 342 1995/09/14 21:53 0.392 373 94,95a 94,96a
V478 Lyr 1995/09/14 22:14 0.953 326 1995/09/14 22:33 0.959 412 - 94,96a
HK Lac 1995/09/12 22:56 0.067 343 1995/09/12 22:42 0.067 357 94,95a 94,96a” 1995/09/13 00:42 0.070 130 1995/09/13 00:25 0.070 193 - -” 1995/09/13 23:44 0.110 346 1995/09/13 23:58 0.110 343 - -” 1995/09/14 01:37 0.113 332 1995/09/14 01:21 0.113 264 - -” 1995/09/14 22:53 0.149 321 1995/09/14 23:09 0.149 339 - -” 1995/09/15 01:26 0.153 329 1995/09/15 01:21 0.153 358 - -
AR Lac 1995/09/12 22:16 0.405 360 1995/09/12 21:57 0.399 421 94,95a 94,96a” 1995/09/13 23:39 0.939 346 1995/09/13 23:23 0.933 415 - -” 1995/09/14 22:49 0.425 339 1995/09/14 22:42 0.423 407 - -
KZ And 1995/09/14 23:29 0.145 336 1995/09/14 23:51 0.150 367 - 94,95c,96a
KT Peg 1995/09/13 00:07 0.693 221 1995/09/13 00:13 0.694 271 - 95c,96a” 1995/09/15 01:19 0.024 313 1995/09/15 01:13 0.023 368 - -
II Peg 1995/09/12 23.02 0.575 300 1995/09/12 23:23 0.577 298 - -” 1995/09/13 00:58 0.587 138 1995/09/13 01:18 0.589 240 - -” 1995/09/14 00:57 0.735 265 1995/09/14 01:14 0.737 324 - -” 1995/09/14 03:07 0.749 315 1995/09/14 02:51 0.747 328 - -” 1995/09/14 05:00 0.760 266 1995/09/14 05:16 0.762 263 - -” 1995/09/14 23:22 0.874 318 1995/09/14 23:15 0.873 324 - -” 1995/09/15 01:56 0.890 332 1995/09/15 01:49 0.889 352 - -” 1995/09/15 04:38 0.907 298 1995/09/15 04:31 0.906 311 - -
94: Fernandez-Figueroa et al. (1994), 95a: Montes et al. (1995a), 95b: Montes et al. (1995b), 95c: Montes et al. (1995c), 96a: Montes et al. (1996a),
small. We have considered as a clear detection of excessemission or absorption in Hα, Na i D1, D2, and He i D3
only when these features in the difference spectrum arelarger than 3 σ.
Table 3 gives the Hα line parameters, measured in theobserved and subtracted spectra of the sample. Column(2) of this Table gives the orbital phase (ϕ) for each spec-trum, and in column (3), H and C mean emission belong-
ing to hot and cool component respectively, and T meansthat at these phases the spectral features cannot be de-blended. Column (4) gives the contributions for the hotand cool component to the total continuum (SH and SC).Column (5) describes the observed Hα profile, i.e. if theline is in absorption (A) in emission (E) or totally filledby emission (F). Columns (6), (7), (8) give the follow-ing parameters measured in the observed spectrum: the
4 D. Montes et al.: Simultaneous Hα, Na i D1, D2, and He i D3 observations
Table 2. Stellar parameters
HD Name Tsp SB R d V-R Porb Prot Vsini
(R⊙) (pc) (days) (days) (km s−1)
1833 BD Cet K1III 1 ≥10 71 0.81 35.1 34.46 157672 AY Cet WD/G5III 1 0.012/15 66.7 0.69 56.824 77.22 4
8357 AR Psc G7V/K1IV1 2 /≥1.5 17 0.741 14.302261 12.245 6.5/3.51
12545 XX Tri K0III 1 ≥8 310 [0.62] 23.9824 24.3 1721242 UX Ari G5V/K0IV 2 0.93/≥4.7 50 0.70/0.54 6.43791 ≈Porb 6/3722468 V711 Tau G5IV/K1IV 2 1.3/3.9 36 0.62/0.75 2.83774 2.841 13/38283750 V833 Tau dK5e 1 ≥0.22 16.7 0.69 1.7878 1.797 6.337824 V1149 Ori K1III 1 ≥11 [164] 0.90 53.58 54.1 11341475 MM Her G2/K0IV 2 1.58/2.83 190 [/0.64] 7.960322 7.936 10/18166181 V815 Her G5V/[M1-2V] 1 0.93:/ 31 0.54 1.8098368 1.8 27/234677 BY Dra K4V/K7.5V 2 1.2-1.4/ 15.6 1.10 5.975112 3.827 8.0/7.4175742 V775 Her K0V/[K5-M2V] 1 0.85/ 24 0.80 2.879395 2.898 15/178450 V478 Lyr G8V/[dK-dM] 1 ≥0.9 26 0.65 2.130514 2.185 21/209813 HK Lac F1V/K0III 1 - 150 0.75 24.4284 24.4284 /15210334 AR Lac G2IV/K0IV 2 1.8/3.1 47 0.77 1.98322195 1.98322195 46/81218738 KZ And dK2/dK2 2 ≥0.74/ [≈23] [0.74/0.74] 3.032867 3.03 12.3/11.6222317 KT Peg G5V/K6V 2 0.93/0.72 25 [0.54/ ] 6.20199 6.092 8/5224085 II Peg K2-3V-IV 1 2.2 29.4 0.89 6.724183 6.718 21
1 Parameters from Fekel (1996)
full width at half maximum (Wobs); the residual inten-sity, Rc; and the Hα core flux, F(1.7A), measured as theresidual area below the central 1.7 A passband. The lastfour Columns give he following parameters measured inthe subtracted spectrum: the full width at half maximum(Wsub), the peak emission intensity (I), the excess Hαemission equivalent width (EW( Hα)), and absolute fluxesat the stellar surface logFS(Hα) obtained with the cali-bration of Pasquini & Pallavicini (1991) as a function of(V - R), very similar values of FS(Hα) are obtained usingthe more recently calibration of Hall (1996) as a functionof (V - R) and (B - V). For a more detailed description ofthe parameters given in this table see our previous studyof the excess Hα emission in active binaries (Montes et al.1995a).
In Table 4 we list the parameters (I, FWHM, EW) ofthe broad and narrow components used in the two Gaus-sian components fit to the Hα subtracted emission pro-file, which we have performed in the stars that presentbroad wings. See the comments for each individual star inSect. 3 and the interpretation of these components givenin Sect. 4.
3. Individual results
In the following we describe the Hα, Na i D1, D2, andHe i D3 spectra of the stars of this sample. The line pro-files of each chromospherically active binary system aredisplayed in Fig. 1 to 19 The name of the star, the or-bital phase, and the expected positions of the features forthe hot (H) and cool (C) components are given in eachfigure. For each system we plot the observed spectrum(solid-line), the synthesized spectrum (dashed-line), thesubtracted spectrum, additively offset for better display
(dotted line) and the Gaussian fit to the subtracted spec-trum (dotted-dashed line).
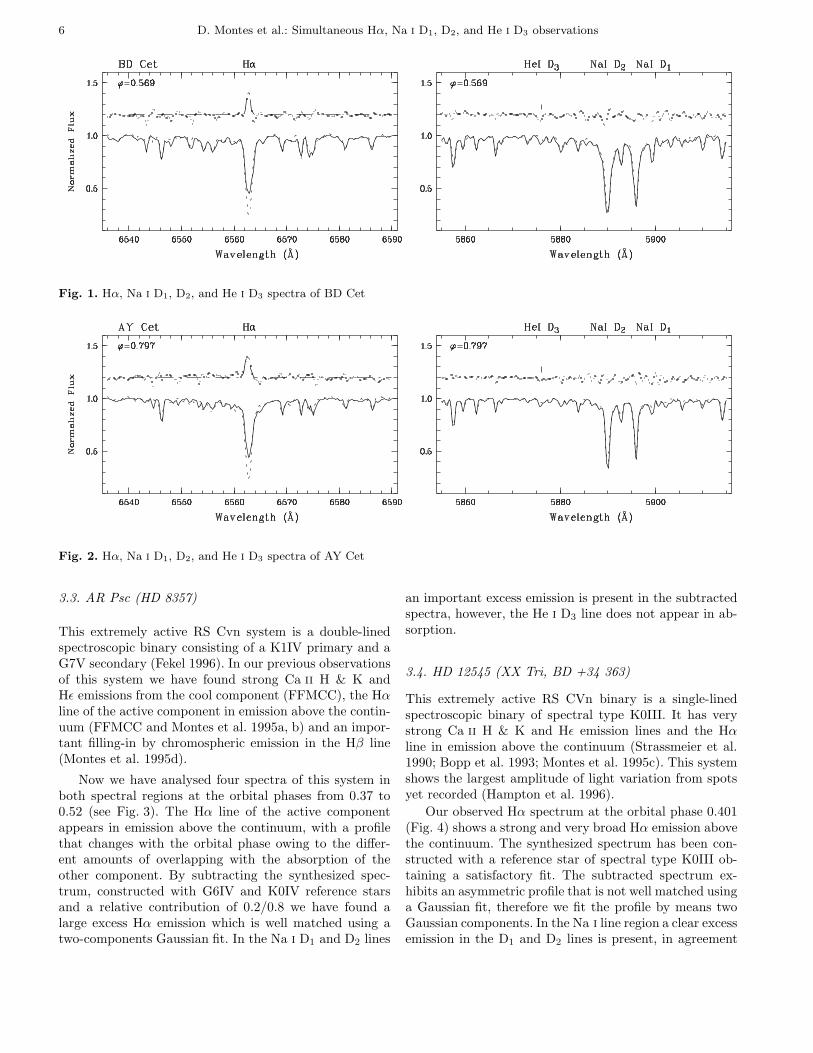
3.1. BD Cet (HD 1833)
Single-lined spectroscopic binary classified as K1III + Fby Bidelman & MacConnell (1973). It presents strongCa ii H & K emission lines centered at the absorptionline (Montes et al. 1995c) and the Hα line as moderateabsorption (Fekel et al. 1986).
We have obtained one spectrum of this system at theorbital phase 0.569 (see Fig. 1). The Hα subtracted spec-trum shows a weak excess emission. In the Na i line regionno detectable filling-in of the D1 and D2 lines is present.A clear absorption in the He i D3 line appears in the sub-tracted spectrum. In both spectral regions the spectrumis matched using a K2III as reference star.
3.2. AY Cet (39 Cet, HD 7672, HR 373)
AY Cet is a single-lined binary composed of a spottedG5III primary and a white dwarf secondary. It presentsstrong Ca ii H & K emission lines (Montes et al. 1995c)and a filled in absorption Hα line (Fekel et al. 1986; Strass-meier et al. 1990).
We present here one observation of this system at theorbital phase 0.797 (see Fig. 2). In the Hα line region wehave used a G8III reference star to perform the spectralsubtraction and the subtracted spectrum obtained showsa weak excess emission. No detectable filling-in of the Na i
D1 and D2 lines has been found, however, a weak absorp-tion in the He i D3 line appears in the subtracted spec-trum.
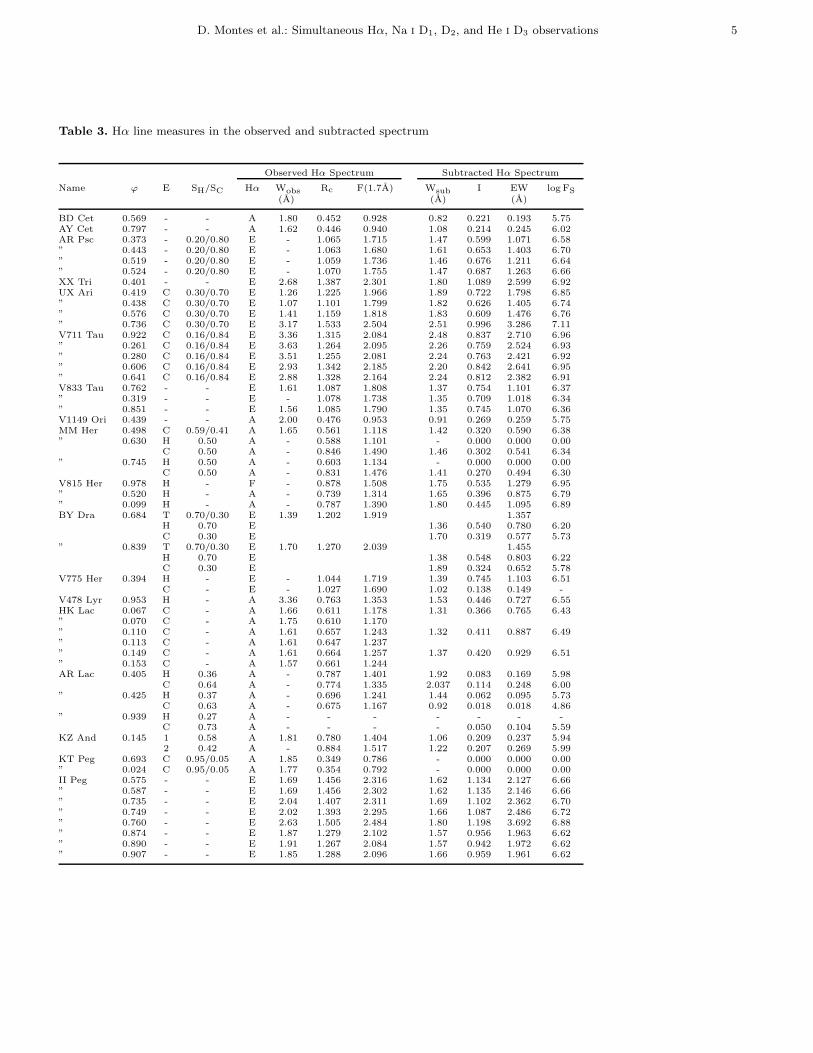
D. Montes et al.: Simultaneous Hα, Na i D1, D2, and He i D3 observations 5
Table 3. Hα line measures in the observed and subtracted spectrum
Observed Hα Spectrum Subtracted Hα Spectrum
Name ϕ E SH/SC Hα Wobs Rc F(1.7A) Wsub I EW log FS
(A) (A) (A)
BD Cet 0.569 - - A 1.80 0.452 0.928 0.82 0.221 0.193 5.75AY Cet 0.797 - - A 1.62 0.446 0.940 1.08 0.214 0.245 6.02AR Psc 0.373 - 0.20/0.80 E - 1.065 1.715 1.47 0.599 1.071 6.58” 0.443 - 0.20/0.80 E - 1.063 1.680 1.61 0.653 1.403 6.70” 0.519 - 0.20/0.80 E - 1.059 1.736 1.46 0.676 1.211 6.64” 0.524 - 0.20/0.80 E - 1.070 1.755 1.47 0.687 1.263 6.66XX Tri 0.401 - - E 2.68 1.387 2.301 1.80 1.089 2.599 6.92UX Ari 0.419 C 0.30/0.70 E 1.26 1.225 1.966 1.89 0.722 1.798 6.85” 0.438 C 0.30/0.70 E 1.07 1.101 1.799 1.82 0.626 1.405 6.74” 0.576 C 0.30/0.70 E 1.41 1.159 1.818 1.83 0.609 1.476 6.76” 0.736 C 0.30/0.70 E 3.17 1.533 2.504 2.51 0.996 3.286 7.11V711 Tau 0.922 C 0.16/0.84 E 3.36 1.315 2.084 2.48 0.837 2.710 6.96” 0.261 C 0.16/0.84 E 3.63 1.264 2.095 2.26 0.759 2.524 6.93” 0.280 C 0.16/0.84 E 3.51 1.255 2.081 2.24 0.763 2.421 6.92” 0.606 C 0.16/0.84 E 2.93 1.342 2.185 2.20 0.842 2.641 6.95” 0.641 C 0.16/0.84 E 2.88 1.328 2.164 2.24 0.812 2.382 6.91V833 Tau 0.762 - - E 1.61 1.087 1.808 1.37 0.754 1.101 6.37” 0.319 - - E - 1.078 1.738 1.35 0.709 1.018 6.34” 0.851 - - E 1.56 1.085 1.790 1.35 0.745 1.070 6.36V1149 Ori 0.439 - - A 2.00 0.476 0.953 0.91 0.269 0.259 5.75MM Her 0.498 C 0.59/0.41 A 1.65 0.561 1.118 1.42 0.320 0.590 6.38” 0.630 H 0.50 A - 0.588 1.101 - 0.000 0.000 0.00
C 0.50 A - 0.846 1.490 1.46 0.302 0.541 6.34” 0.745 H 0.50 A - 0.603 1.134 - 0.000 0.000 0.00
C 0.50 A - 0.831 1.476 1.41 0.270 0.494 6.30V815 Her 0.978 H - F - 0.878 1.508 1.75 0.535 1.279 6.95” 0.520 H - A - 0.739 1.314 1.65 0.396 0.875 6.79” 0.099 H - A - 0.787 1.390 1.80 0.445 1.095 6.89BY Dra 0.684 T 0.70/0.30 E 1.39 1.202 1.919 1.357
H 0.70 E 1.36 0.540 0.780 6.20C 0.30 E 1.70 0.319 0.577 5.73
” 0.839 T 0.70/0.30 E 1.70 1.270 2.039 1.455H 0.70 E 1.38 0.548 0.803 6.22C 0.30 E 1.89 0.324 0.652 5.78
V775 Her 0.394 H - E - 1.044 1.719 1.39 0.745 1.103 6.51C - E - 1.027 1.690 1.02 0.138 0.149 -
V478 Lyr 0.953 H - A 3.36 0.763 1.353 1.53 0.446 0.727 6.55HK Lac 0.067 C - A 1.66 0.611 1.178 1.31 0.366 0.765 6.43” 0.070 C - A 1.75 0.610 1.170” 0.110 C - A 1.61 0.657 1.243 1.32 0.411 0.887 6.49” 0.113 C - A 1.61 0.647 1.237” 0.149 C - A 1.61 0.664 1.257 1.37 0.420 0.929 6.51” 0.153 C - A 1.57 0.661 1.244AR Lac 0.405 H 0.36 A - 0.787 1.401 1.92 0.083 0.169 5.98
C 0.64 A - 0.774 1.335 2.037 0.114 0.248 6.00” 0.425 H 0.37 A - 0.696 1.241 1.44 0.062 0.095 5.73
C 0.63 A - 0.675 1.167 0.92 0.018 0.018 4.86” 0.939 H 0.27 A - - - - - - -
C 0.73 A - - - - 0.050 0.104 5.59KZ And 0.145 1 0.58 A 1.81 0.780 1.404 1.06 0.209 0.237 5.94
2 0.42 A - 0.884 1.517 1.22 0.207 0.269 5.99KT Peg 0.693 C 0.95/0.05 A 1.85 0.349 0.786 - 0.000 0.000 0.00” 0.024 C 0.95/0.05 A 1.77 0.354 0.792 - 0.000 0.000 0.00II Peg 0.575 - - E 1.69 1.456 2.316 1.62 1.134 2.127 6.66” 0.587 - - E 1.69 1.456 2.302 1.62 1.135 2.146 6.66” 0.735 - - E 2.04 1.407 2.311 1.69 1.102 2.362 6.70” 0.749 - - E 2.02 1.393 2.295 1.66 1.087 2.486 6.72” 0.760 - - E 2.63 1.505 2.484 1.80 1.198 3.692 6.88” 0.874 - - E 1.87 1.279 2.102 1.57 0.956 1.963 6.62” 0.890 - - E 1.91 1.267 2.084 1.57 0.942 1.972 6.62” 0.907 - - E 1.85 1.288 2.096 1.66 0.959 1.961 6.62
6 D. Montes et al.: Simultaneous Hα, Na i D1, D2, and He i D3 observations
Fig. 1. Hα, Na i D1, D2, and He i D3 spectra of BD Cet
Fig. 2. Hα, Na i D1, D2, and He i D3 spectra of AY Cet
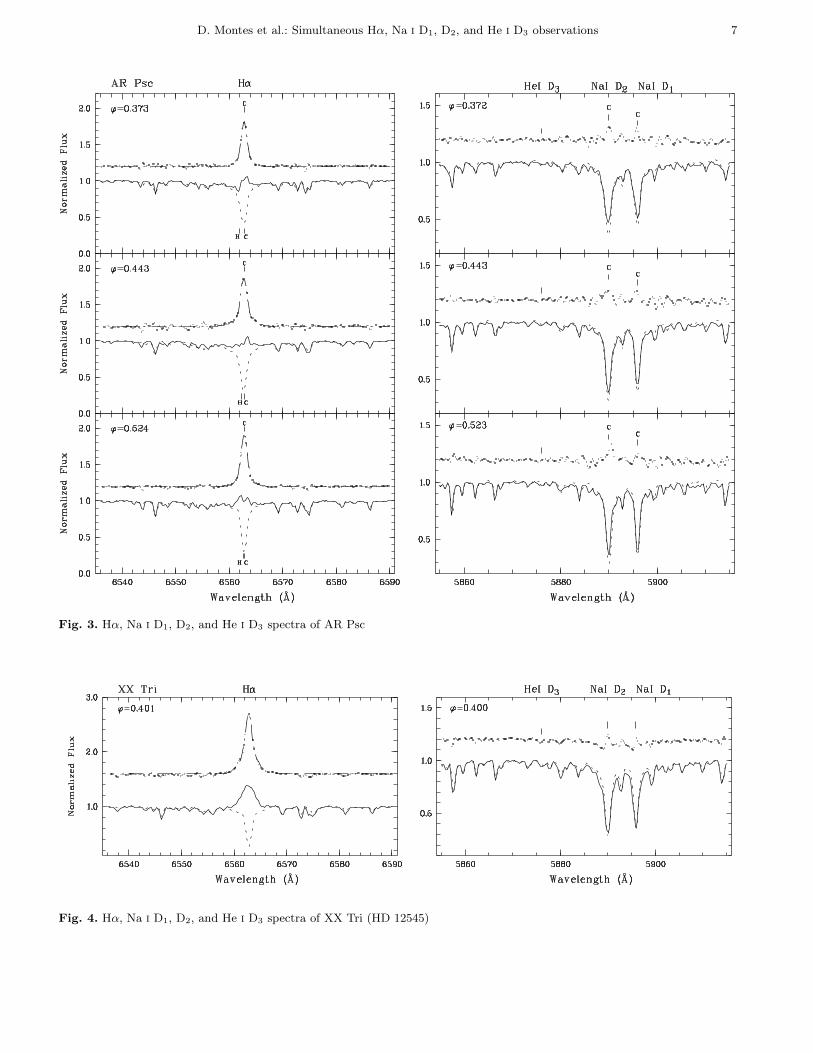
3.3. AR Psc (HD 8357)
This extremely active RS Cvn system is a double-linedspectroscopic binary consisting of a K1IV primary and aG7V secondary (Fekel 1996). In our previous observationsof this system we have found strong Ca ii H & K andHǫ emissions from the cool component (FFMCC), the Hαline of the active component in emission above the contin-uum (FFMCC and Montes et al. 1995a, b) and an impor-tant filling-in by chromospheric emission in the Hβ line(Montes et al. 1995d).
Now we have analysed four spectra of this system inboth spectral regions at the orbital phases from 0.37 to0.52 (see Fig. 3). The Hα line of the active componentappears in emission above the continuum, with a profilethat changes with the orbital phase owing to the differ-ent amounts of overlapping with the absorption of theother component. By subtracting the synthesized spec-trum, constructed with G6IV and K0IV reference starsand a relative contribution of 0.2/0.8 we have found alarge excess Hα emission which is well matched using atwo-components Gaussian fit. In the Na i D1 and D2 lines
an important excess emission is present in the subtractedspectra, however, the He i D3 line does not appear in ab-sorption.
3.4. HD 12545 (XX Tri, BD +34 363)
This extremely active RS CVn binary is a single-linedspectroscopic binary of spectral type K0III. It has verystrong Ca ii H & K and Hǫ emission lines and the Hαline in emission above the continuum (Strassmeier et al.1990; Bopp et al. 1993; Montes et al. 1995c). This systemshows the largest amplitude of light variation from spotsyet recorded (Hampton et al. 1996).
Our observed Hα spectrum at the orbital phase 0.401(Fig. 4) shows a strong and very broad Hα emission abovethe continuum. The synthesized spectrum has been con-structed with a reference star of spectral type K0III ob-taining a satisfactory fit. The subtracted spectrum ex-hibits an asymmetric profile that is not well matched usinga Gaussian fit, therefore we fit the profile by means twoGaussian components. In the Na i line region a clear excessemission in the D1 and D2 lines is present, in agreement
D. Montes et al.: Simultaneous Hα, Na i D1, D2, and He i D3 observations 7
Fig. 3. Hα, Na i D1, D2, and He i D3 spectra of AR Psc
Fig. 4. Hα, Na i D1, D2, and He i D3 spectra of XX Tri (HD 12545)
8 D. Montes et al.: Simultaneous Hα, Na i D1, D2, and He i D3 observations
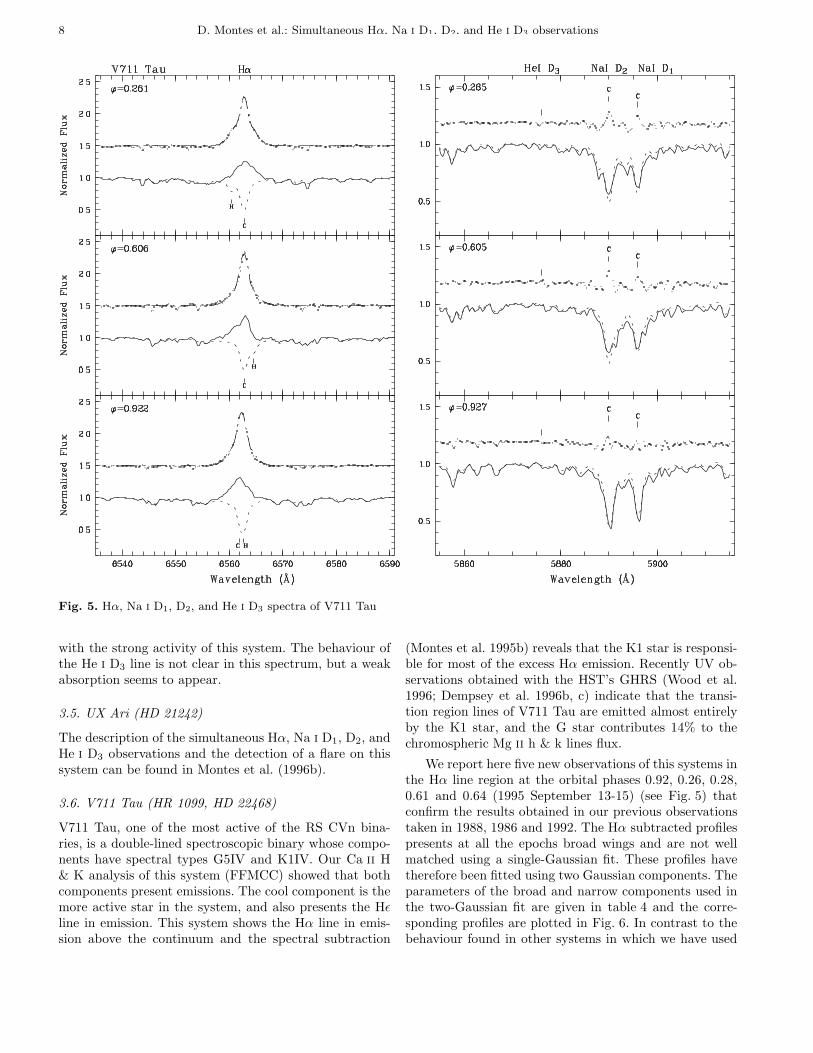
Fig. 5. Hα, Na i D1, D2, and He i D3 spectra of V711 Tau
with the strong activity of this system. The behaviour ofthe He i D3 line is not clear in this spectrum, but a weakabsorption seems to appear.
3.5. UX Ari (HD 21242)
The description of the simultaneous Hα, Na i D1, D2, andHe i D3 observations and the detection of a flare on thissystem can be found in Montes et al. (1996b).
3.6. V711 Tau (HR 1099, HD 22468)
V711 Tau, one of the most active of the RS CVn bina-ries, is a double-lined spectroscopic binary whose compo-nents have spectral types G5IV and K1IV. Our Ca ii H& K analysis of this system (FFMCC) showed that bothcomponents present emissions. The cool component is themore active star in the system, and also presents the Hǫline in emission. This system shows the Hα line in emis-sion above the continuum and the spectral subtraction
(Montes et al. 1995b) reveals that the K1 star is responsi-ble for most of the excess Hα emission. Recently UV ob-servations obtained with the HST’s GHRS (Wood et al.1996; Dempsey et al. 1996b, c) indicate that the transi-tion region lines of V711 Tau are emitted almost entirelyby the K1 star, and the G star contributes 14% to thechromospheric Mg ii h & k lines flux.
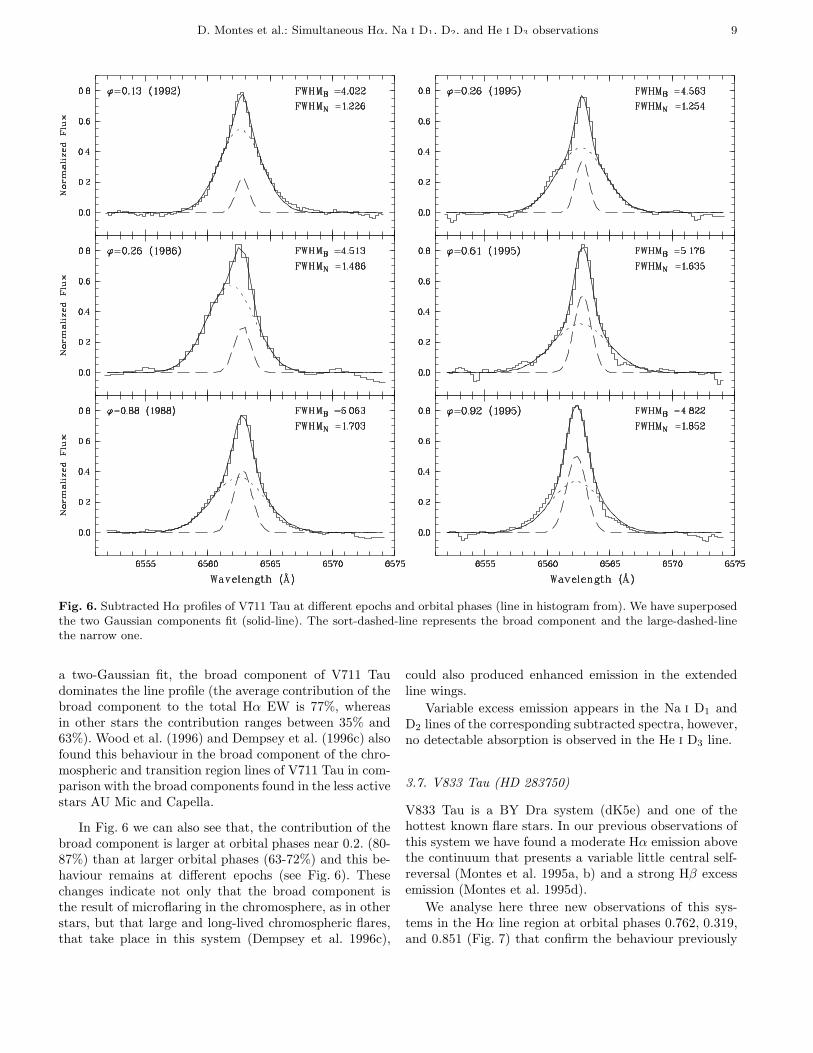
We report here five new observations of this systems inthe Hα line region at the orbital phases 0.92, 0.26, 0.28,0.61 and 0.64 (1995 September 13-15) (see Fig. 5) thatconfirm the results obtained in our previous observationstaken in 1988, 1986 and 1992. The Hα subtracted profilespresents at all the epochs broad wings and are not wellmatched using a single-Gaussian fit. These profiles havetherefore been fitted using two Gaussian components. Theparameters of the broad and narrow components used inthe two-Gaussian fit are given in table 4 and the corre-sponding profiles are plotted in Fig. 6. In contrast to thebehaviour found in other systems in which we have used
D. Montes et al.: Simultaneous Hα, Na i D1, D2, and He i D3 observations 9
Fig. 6. Subtracted Hα profiles of V711 Tau at different epochs and orbital phases (line in histogram from). We have superposedthe two Gaussian components fit (solid-line). The sort-dashed-line represents the broad component and the large-dashed-linethe narrow one.
a two-Gaussian fit, the broad component of V711 Taudominates the line profile (the average contribution of thebroad component to the total Hα EW is 77%, whereasin other stars the contribution ranges between 35% and63%). Wood et al. (1996) and Dempsey et al. (1996c) alsofound this behaviour in the broad component of the chro-mospheric and transition region lines of V711 Tau in com-parison with the broad components found in the less activestars AU Mic and Capella.
In Fig. 6 we can also see that, the contribution of thebroad component is larger at orbital phases near 0.2. (80-87%) than at larger orbital phases (63-72%) and this be-haviour remains at different epochs (see Fig. 6). Thesechanges indicate not only that the broad component isthe result of microflaring in the chromosphere, as in otherstars, but that large and long-lived chromospheric flares,that take place in this system (Dempsey et al. 1996c),
could also produced enhanced emission in the extendedline wings.
Variable excess emission appears in the Na i D1 andD2 lines of the corresponding subtracted spectra, however,no detectable absorption is observed in the He i D3 line.
3.7. V833 Tau (HD 283750)
V833 Tau is a BY Dra system (dK5e) and one of thehottest known flare stars. In our previous observations ofthis system we have found a moderate Hα emission abovethe continuum that presents a variable little central self-reversal (Montes et al. 1995a, b) and a strong Hβ excessemission (Montes et al. 1995d).
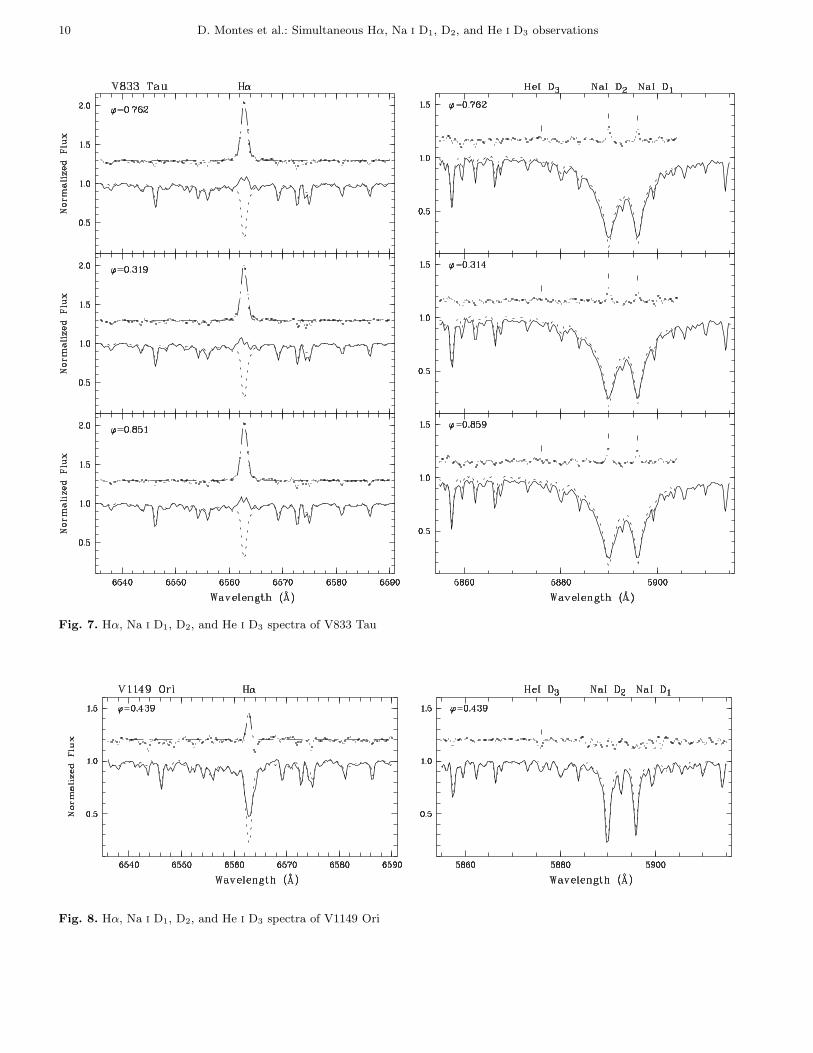
We analyse here three new observations of this sys-tems in the Hα line region at orbital phases 0.762, 0.319,and 0.851 (Fig. 7) that confirm the behaviour previously
10 D. Montes et al.: Simultaneous Hα, Na i D1, D2, and He i D3 observations
Fig. 7. Hα, Na i D1, D2, and He i D3 spectra of V833 Tau
Fig. 8. Hα, Na i D1, D2, and He i D3 spectra of V1149 Ori
D. Montes et al.: Simultaneous Hα, Na i D1, D2, and He i D3 observations 11
Fig. 9. Hα, Na i D1, D2, and He i D3 spectra of MM Her
12 D. Montes et al.: Simultaneous Hα, Na i D1, D2, and He i D3 observations
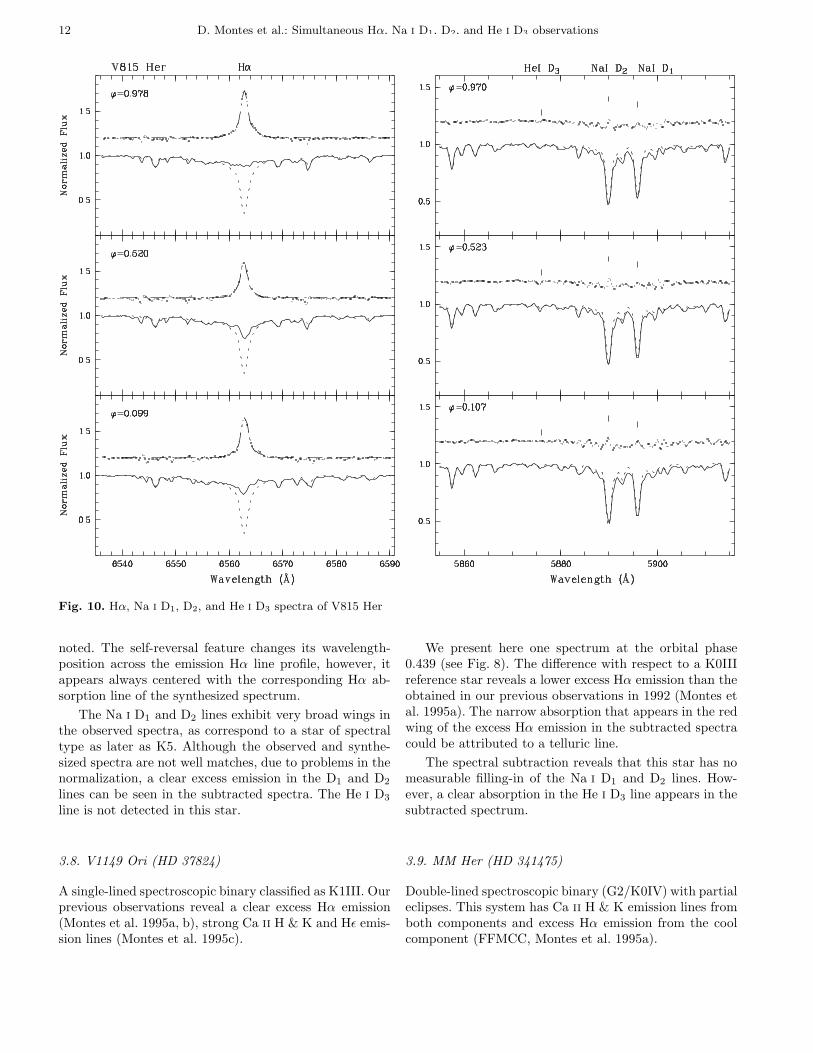
Fig. 10. Hα, Na i D1, D2, and He i D3 spectra of V815 Her
noted. The self-reversal feature changes its wavelength-position across the emission Hα line profile, however, itappears always centered with the corresponding Hα ab-sorption line of the synthesized spectrum.
The Na i D1 and D2 lines exhibit very broad wings inthe observed spectra, as correspond to a star of spectraltype as later as K5. Although the observed and synthe-sized spectra are not well matches, due to problems in thenormalization, a clear excess emission in the D1 and D2
lines can be seen in the subtracted spectra. The He i D3
line is not detected in this star.
3.8. V1149 Ori (HD 37824)
A single-lined spectroscopic binary classified as K1III. Ourprevious observations reveal a clear excess Hα emission(Montes et al. 1995a, b), strong Ca ii H & K and Hǫ emis-sion lines (Montes et al. 1995c).
We present here one spectrum at the orbital phase0.439 (see Fig. 8). The difference with respect to a K0IIIreference star reveals a lower excess Hα emission than theobtained in our previous observations in 1992 (Montes etal. 1995a). The narrow absorption that appears in the redwing of the excess Hα emission in the subtracted spectracould be attributed to a telluric line.
The spectral subtraction reveals that this star has nomeasurable filling-in of the Na i D1 and D2 lines. How-ever, a clear absorption in the He i D3 line appears in thesubtracted spectrum.
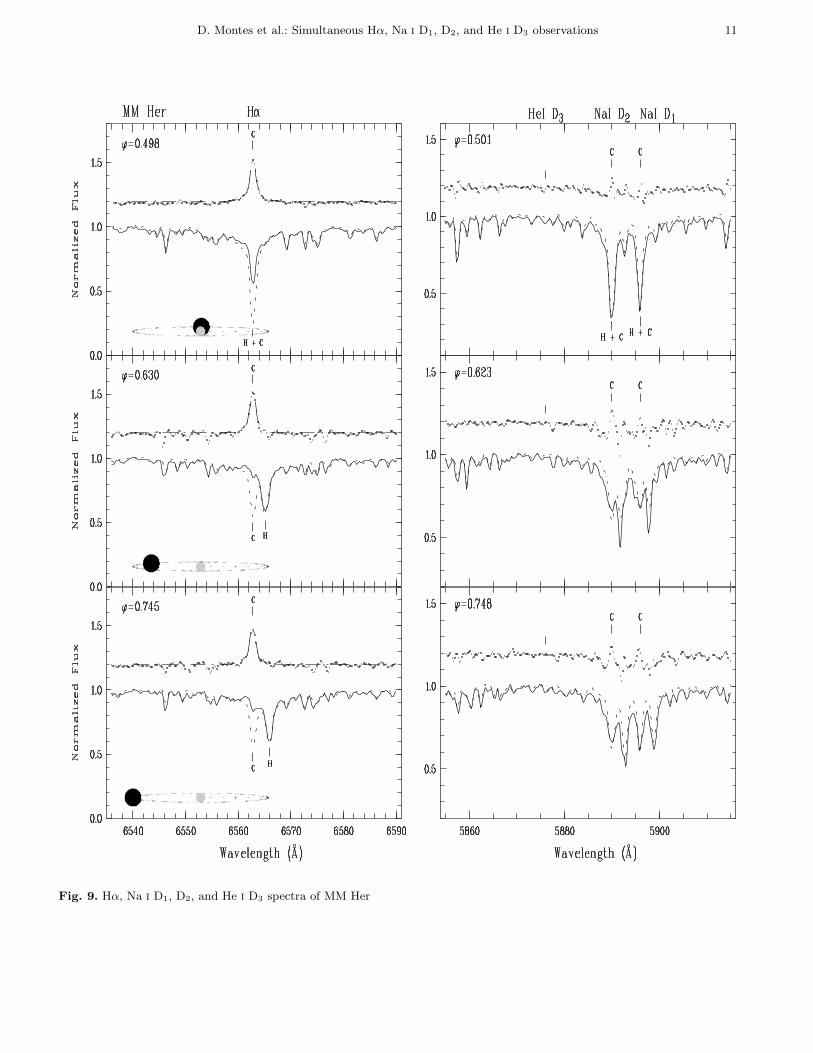
3.9. MM Her (HD 341475)
Double-lined spectroscopic binary (G2/K0IV) with partialeclipses. This system has Ca ii H & K emission lines fromboth components and excess Hα emission from the coolcomponent (FFMCC, Montes et al. 1995a).
D. Montes et al.: Simultaneous Hα, Na i D1, D2, and He i D3 observations 13
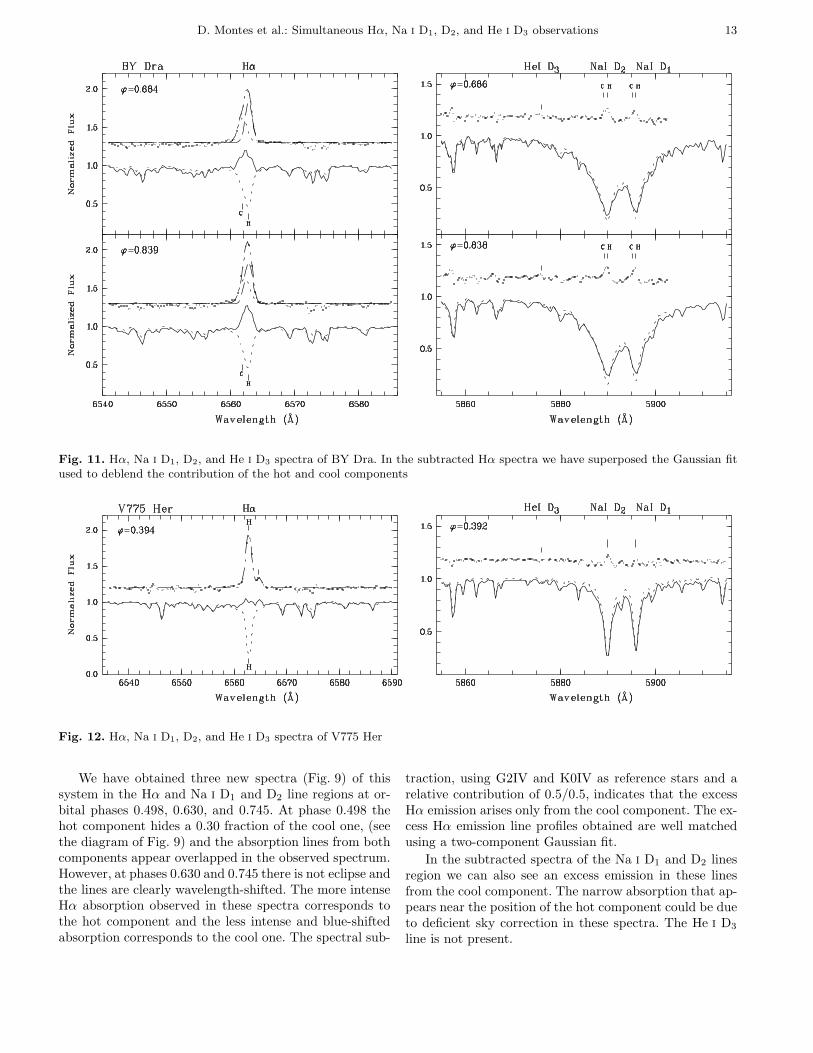
Fig. 11. Hα, Na i D1, D2, and He i D3 spectra of BY Dra. In the subtracted Hα spectra we have superposed the Gaussian fitused to deblend the contribution of the hot and cool components
Fig. 12. Hα, Na i D1, D2, and He i D3 spectra of V775 Her
We have obtained three new spectra (Fig. 9) of thissystem in the Hα and Na i D1 and D2 line regions at or-bital phases 0.498, 0.630, and 0.745. At phase 0.498 thehot component hides a 0.30 fraction of the cool one, (seethe diagram of Fig. 9) and the absorption lines from bothcomponents appear overlapped in the observed spectrum.However, at phases 0.630 and 0.745 there is not eclipse andthe lines are clearly wavelength-shifted. The more intenseHα absorption observed in these spectra corresponds tothe hot component and the less intense and blue-shiftedabsorption corresponds to the cool one. The spectral sub-
traction, using G2IV and K0IV as reference stars and arelative contribution of 0.5/0.5, indicates that the excessHα emission arises only from the cool component. The ex-cess Hα emission line profiles obtained are well matchedusing a two-component Gaussian fit.
In the subtracted spectra of the Na i D1 and D2 linesregion we can also see an excess emission in these linesfrom the cool component. The narrow absorption that ap-pears near the position of the hot component could be dueto deficient sky correction in these spectra. The He i D3
line is not present.
14 D. Montes et al.: Simultaneous Hα, Na i D1, D2, and He i D3 observations
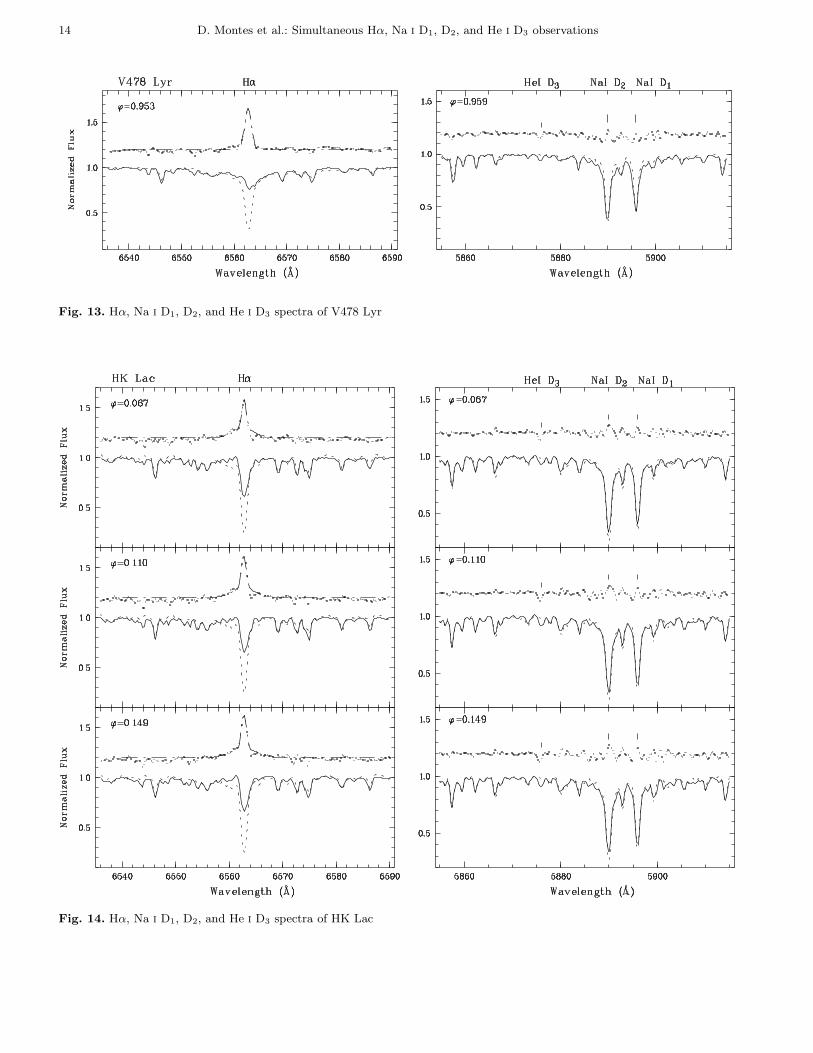
Fig. 13. Hα, Na i D1, D2, and He i D3 spectra of V478 Lyr
Fig. 14. Hα, Na i D1, D2, and He i D3 spectra of HK Lac
D. Montes et al.: Simultaneous Hα, Na i D1, D2, and He i D3 observations 15
3.10. V815 Her (HD 166181)
Single-lined spectroscopic binary. Our previous Ca ii H &K and Hα observations (FFMCC, Montes et al. 1995a)indicate that the hot star is the active component. Multi-wavelength observations of this system have been recentlyreported by Dempsey et al. (1996a).
We have taken three spectra of this system at orbitalphases 0.978, 0.520, 0.099 (see Fig. 10). In the Hα line re-gion the spectra show a filling-in absorption line with no-ticeable night to night changes. The excess Hα emissionobtained with the spectral subtraction of a G5 V refer-ence star is larger at the orbital phases near to 0.0. Thesubtracted Hα profile presents broad wings and is wellmatched using a fit with two Gaussian components (nar-row and broad). The narrow component is more importantwhen the excess Hα emission is larger (see table 4).
A small filling-in is observed in the Na i D1 and D2
lines at the three orbital phases, and only at phase 0.523absorption in detected in the He i D3 line.
3.11. BY Dra (HD 234677)
The prototype of the BY Dra stars. Our previous Ca ii H& K observations of this system (FFMCC) clearly showthat both components are active with the hot componenthaving the stronger Ca ii emission. The two componentsalso show Hǫ in emission.
We present in this paper simultaneous Hα and Na i
D1 and D2 observations of this system at orbital phases0.684 and 0.839 (see Fig. 11). These spectra show strongHα emission above the continuum and the Na i D1 andD2 lines with very broad wings corresponding to thelater spectral type of the components of this system(K4V/K7.5V).
By applying the spectral subtraction technique wehave obtained an asymmetric excess Hα emission line pro-file which has contributions from both components. A two-Gaussian fit has been used to deblend the contribution ofthe hot and cool components to the line profile. This fit re-veals that the hot component have the stronger excess Hαemission EW in agreement with the behaviour observedby us in the Ca ii H & K lines.
The subtracted spectra in the Na i D1 and D2 lineregion reveal that the excess emission in these lines alsoarises from both components. The He i D3 line is not de-tected in these spectra.
3.12. V775 Her (HD 175742)
Single-lined spectroscopic binary (K0V/[K5-M2V]) withstrong Ca ii H & K emission lines from the hot compo-nent (FFMCC). The Hα feature may change from a weakabsorption feature to emission above the continuum ontimes scales of hours (Xuefu and Huisong 1984).
In our Hα spectrum at the orbital phase 0.394 (Fig. 12)we can see the Hα line of the hot component totally filled-
in by emission and a small emission bump red-shifted inrelation to the absorption lines. By subtracting the synthe-sized spectrum, constructed with a K0IV reference star,we have obtained a strong excess Hα emission coming fromthe hot component and a small excess emission, red-shifted1.9 A with respect to the emission of the hot component.This small excess perhaps could be attributed to the coolerstar of the system, whose assumed spectral type is K5-M2V and whose contribution to the observed spectra isnegligible.
In the Na i lines region the spectral subtraction pointsout a filling-in of the D1 and D2 lines and not detectableabsorption in the He i D3 line.
3.13. V478 Lyr (HD 178450)
This BY Dra system is a single-lined spectroscopic binarywith strong Ca ii H & K emissions from the hot compo-nent (FFMCC) and a filled-in Hα absorption line (Fekel1988).
The Hα spectrum of this system exhibits a strongfilling-in absorption line (see Fig. 13). By subtracting thesynthesized spectrum constructed with a G8V star wehave obtained strong excess Hα emission, a small excessemission in the Na i D1 and D2 lines and a clear absorp-tion in the He i D3 line.
3.14. HK Lac (HD 209813)
HK Lac is a single-lined spectroscopic binary (F1V/K0III)with very strong Ca ii H & K emissions, the Hǫ line inemission and an important excess Hα emission (FFMCC;Montes el at. 1995a).
This system shows a very variable Hα profile (fromfilled-in absorption to moderate emission) and flares (seeCatalano & Frasca 1994). However, in our six Hα spec-tra taken in three consecutive nights, with orbital phasesfrom 0.067 to 0.153, we always observe filled-in absorptionline with small night to night variations in the excess Hαemission from the cool component. In Fig. 14 a spectrumof each night is showed.
The observed spectra are well matched using a K0III asreference star. The subtracted spectra show an importantexcess emission in the Na i D1 and D2 lines and a clearabsorption in the He i D3 line.
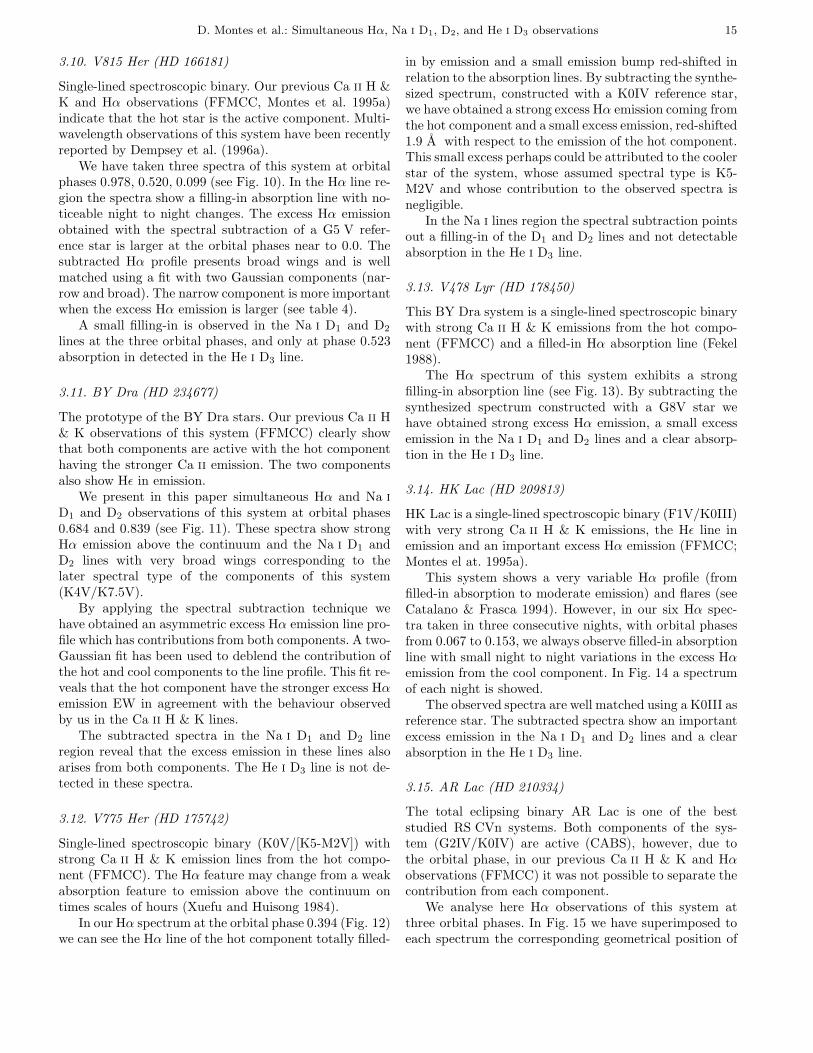
3.15. AR Lac (HD 210334)
The total eclipsing binary AR Lac is one of the beststudied RS CVn systems. Both components of the sys-tem (G2IV/K0IV) are active (CABS), however, due tothe orbital phase, in our previous Ca ii H & K and Hαobservations (FFMCC) it was not possible to separate thecontribution from each component.
We analyse here Hα observations of this system atthree orbital phases. In Fig. 15 we have superimposed toeach spectrum the corresponding geometrical position of
16 D. Montes et al.: Simultaneous Hα, Na i D1, D2, and He i D3 observations
Fig. 15. Hα, Na i D1, D2, and He i D3 spectra of AR Lac
D. Montes et al.: Simultaneous Hα, Na i D1, D2, and He i D3 observations 17
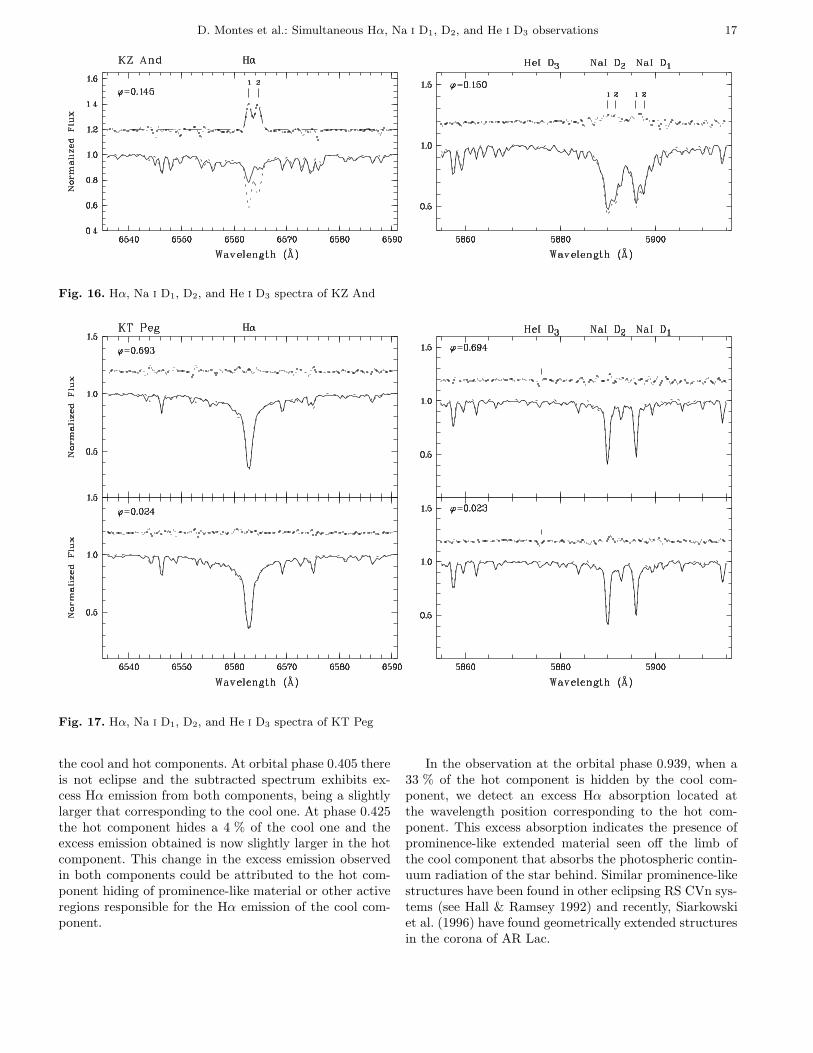
Fig. 16. Hα, Na i D1, D2, and He i D3 spectra of KZ And
Fig. 17. Hα, Na i D1, D2, and He i D3 spectra of KT Peg
the cool and hot components. At orbital phase 0.405 thereis not eclipse and the subtracted spectrum exhibits ex-cess Hα emission from both components, being a slightlylarger that corresponding to the cool one. At phase 0.425the hot component hides a 4 % of the cool one and theexcess emission obtained is now slightly larger in the hotcomponent. This change in the excess emission observedin both components could be attributed to the hot com-ponent hiding of prominence-like material or other activeregions responsible for the Hα emission of the cool com-ponent.
In the observation at the orbital phase 0.939, when a33 % of the hot component is hidden by the cool com-ponent, we detect an excess Hα absorption located atthe wavelength position corresponding to the hot com-ponent. This excess absorption indicates the presence ofprominence-like extended material seen off the limb ofthe cool component that absorbs the photospheric contin-uum radiation of the star behind. Similar prominence-likestructures have been found in other eclipsing RS CVn sys-tems (see Hall & Ramsey 1992) and recently, Siarkowskiet al. (1996) have found geometrically extended structuresin the corona of AR Lac.
18 D. Montes et al.: Simultaneous Hα, Na i D1, D2, and He i D3 observations
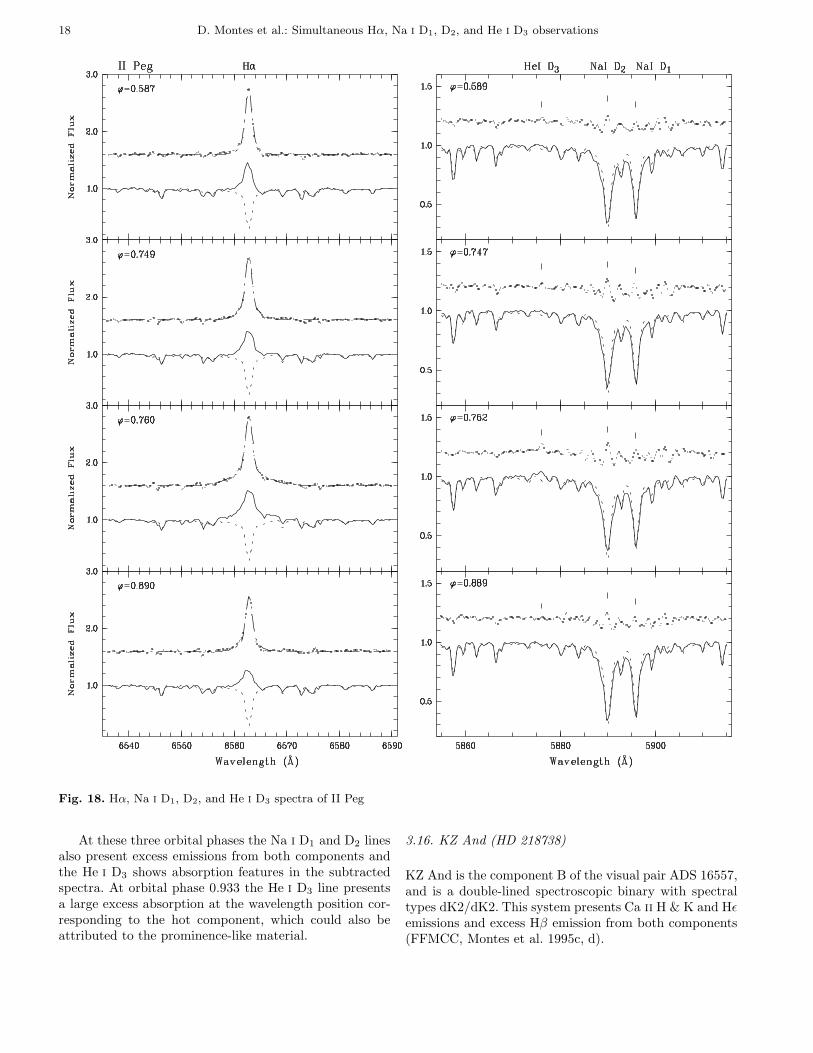
Fig. 18. Hα, Na i D1, D2, and He i D3 spectra of II Peg
At these three orbital phases the Na i D1 and D2 linesalso present excess emissions from both components andthe He i D3 shows absorption features in the subtractedspectra. At orbital phase 0.933 the He i D3 line presentsa large excess absorption at the wavelength position cor-responding to the hot component, which could also beattributed to the prominence-like material.
3.16. KZ And (HD 218738)
KZ And is the component B of the visual pair ADS 16557,and is a double-lined spectroscopic binary with spectraltypes dK2/dK2. This system presents Ca ii H & K and Hǫemissions and excess Hβ emission from both components(FFMCC, Montes et al. 1995c, d).
D. Montes et al.: Simultaneous Hα, Na i D1, D2, and He i D3 observations 19
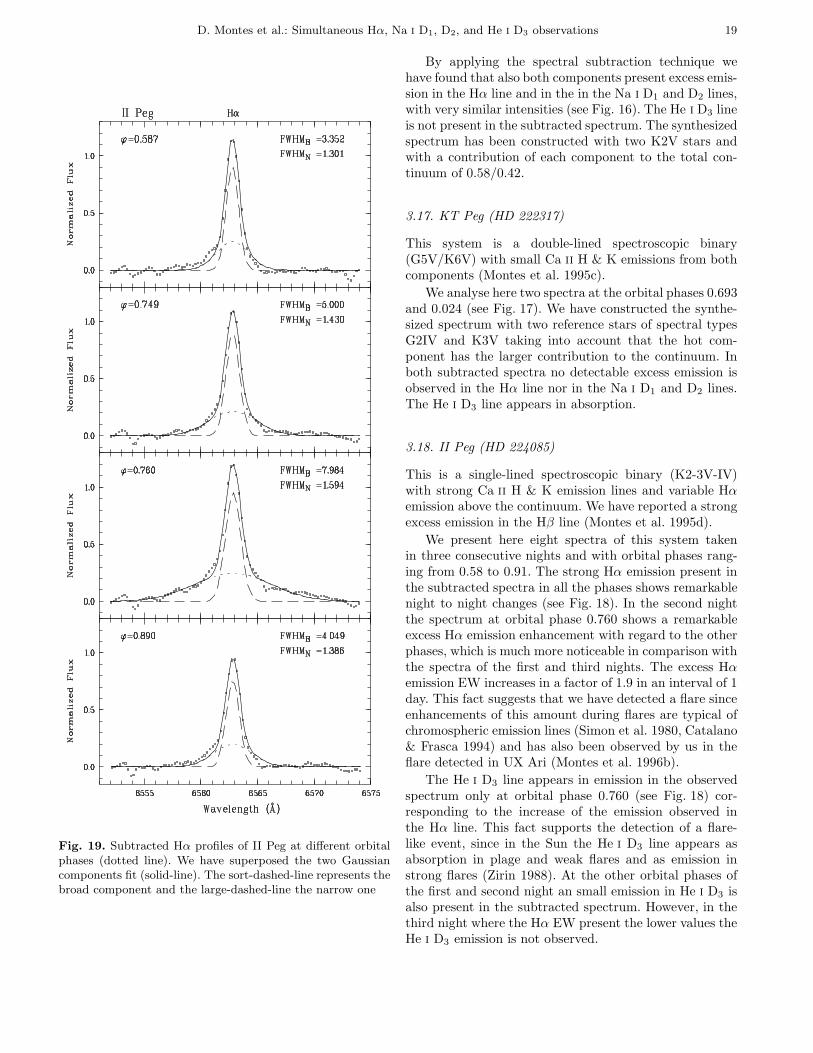
Fig. 19. Subtracted Hα profiles of II Peg at different orbitalphases (dotted line). We have superposed the two Gaussiancomponents fit (solid-line). The sort-dashed-line represents thebroad component and the large-dashed-line the narrow one
By applying the spectral subtraction technique wehave found that also both components present excess emis-sion in the Hα line and in the in the Na i D1 and D2 lines,with very similar intensities (see Fig. 16). The He i D3 lineis not present in the subtracted spectrum. The synthesizedspectrum has been constructed with two K2V stars andwith a contribution of each component to the total con-tinuum of 0.58/0.42.
3.17. KT Peg (HD 222317)
This system is a double-lined spectroscopic binary(G5V/K6V) with small Ca ii H & K emissions from bothcomponents (Montes et al. 1995c).
We analyse here two spectra at the orbital phases 0.693and 0.024 (see Fig. 17). We have constructed the synthe-sized spectrum with two reference stars of spectral typesG2IV and K3V taking into account that the hot com-ponent has the larger contribution to the continuum. Inboth subtracted spectra no detectable excess emission isobserved in the Hα line nor in the Na i D1 and D2 lines.The He i D3 line appears in absorption.
3.18. II Peg (HD 224085)
This is a single-lined spectroscopic binary (K2-3V-IV)with strong Ca ii H & K emission lines and variable Hαemission above the continuum. We have reported a strongexcess emission in the Hβ line (Montes et al. 1995d).
We present here eight spectra of this system takenin three consecutive nights and with orbital phases rang-ing from 0.58 to 0.91. The strong Hα emission present inthe subtracted spectra in all the phases shows remarkablenight to night changes (see Fig. 18). In the second nightthe spectrum at orbital phase 0.760 shows a remarkableexcess Hα emission enhancement with regard to the otherphases, which is much more noticeable in comparison withthe spectra of the first and third nights. The excess Hαemission EW increases in a factor of 1.9 in an interval of 1day. This fact suggests that we have detected a flare sinceenhancements of this amount during flares are typical ofchromospheric emission lines (Simon et al. 1980, Catalano& Frasca 1994) and has also been observed by us in theflare detected in UX Ari (Montes et al. 1996b).
The He i D3 line appears in emission in the observedspectrum only at orbital phase 0.760 (see Fig. 18) cor-responding to the increase of the emission observed inthe Hα line. This fact supports the detection of a flare-like event, since in the Sun the He i D3 line appears asabsorption in plage and weak flares and as emission instrong flares (Zirin 1988). At the other orbital phases ofthe first and second night an small emission in He i D3 isalso present in the subtracted spectrum. However, in thethird night where the Hα EW present the lower values theHe i D3 emission is not observed.
20 D. Montes et al.: Simultaneous Hα, Na i D1, D2, and He i D3 observations
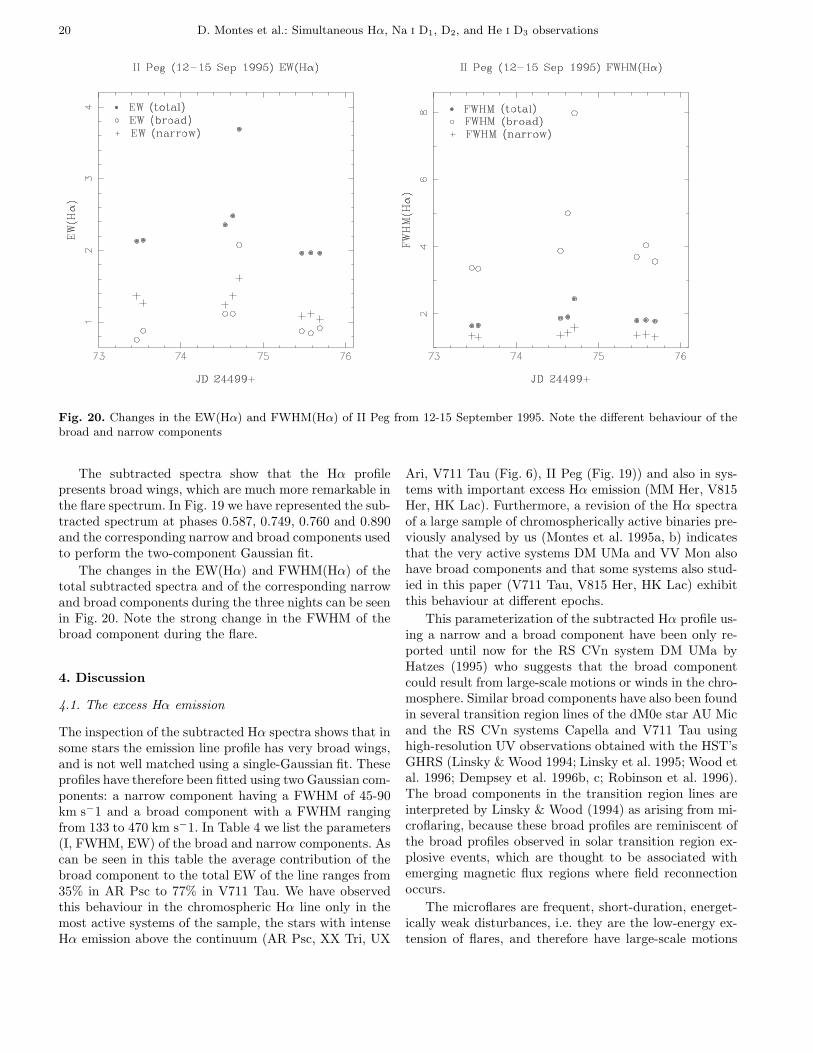
Fig. 20. Changes in the EW(Hα) and FWHM(Hα) of II Peg from 12-15 September 1995. Note the different behaviour of thebroad and narrow components
The subtracted spectra show that the Hα profilepresents broad wings, which are much more remarkable inthe flare spectrum. In Fig. 19 we have represented the sub-tracted spectrum at phases 0.587, 0.749, 0.760 and 0.890and the corresponding narrow and broad components usedto perform the two-component Gaussian fit.
The changes in the EW(Hα) and FWHM(Hα) of thetotal subtracted spectra and of the corresponding narrowand broad components during the three nights can be seenin Fig. 20. Note the strong change in the FWHM of thebroad component during the flare.
4. Discussion
4.1. The excess Hα emission
The inspection of the subtracted Hα spectra shows that insome stars the emission line profile has very broad wings,and is not well matched using a single-Gaussian fit. Theseprofiles have therefore been fitted using two Gaussian com-ponents: a narrow component having a FWHM of 45-90km s−1 and a broad component with a FWHM rangingfrom 133 to 470 km s−1. In Table 4 we list the parameters(I, FWHM, EW) of the broad and narrow components. Ascan be seen in this table the average contribution of thebroad component to the total EW of the line ranges from35% in AR Psc to 77% in V711 Tau. We have observedthis behaviour in the chromospheric Hα line only in themost active systems of the sample, the stars with intenseHα emission above the continuum (AR Psc, XX Tri, UX
Ari, V711 Tau (Fig. 6), II Peg (Fig. 19)) and also in sys-tems with important excess Hα emission (MM Her, V815Her, HK Lac). Furthermore, a revision of the Hα spectraof a large sample of chromospherically active binaries pre-viously analysed by us (Montes et al. 1995a, b) indicatesthat the very active systems DM UMa and VV Mon alsohave broad components and that some systems also stud-ied in this paper (V711 Tau, V815 Her, HK Lac) exhibitthis behaviour at different epochs.
This parameterization of the subtracted Hα profile us-ing a narrow and a broad component have been only re-ported until now for the RS CVn system DM UMa byHatzes (1995) who suggests that the broad componentcould result from large-scale motions or winds in the chro-mosphere. Similar broad components have also been foundin several transition region lines of the dM0e star AU Micand the RS CVn systems Capella and V711 Tau usinghigh-resolution UV observations obtained with the HST’sGHRS (Linsky & Wood 1994; Linsky et al. 1995; Wood etal. 1996; Dempsey et al. 1996b, c; Robinson et al. 1996).The broad components in the transition region lines areinterpreted by Linsky & Wood (1994) as arising from mi-croflaring, because these broad profiles are reminiscent ofthe broad profiles observed in solar transition region ex-plosive events, which are thought to be associated withemerging magnetic flux regions where field reconnectionoccurs.
The microflares are frequent, short-duration, energet-ically weak disturbances, i.e. they are the low-energy ex-tension of flares, and therefore have large-scale motions
D. Montes et al.: Simultaneous Hα, Na i D1, D2, and He i D3 observations 21
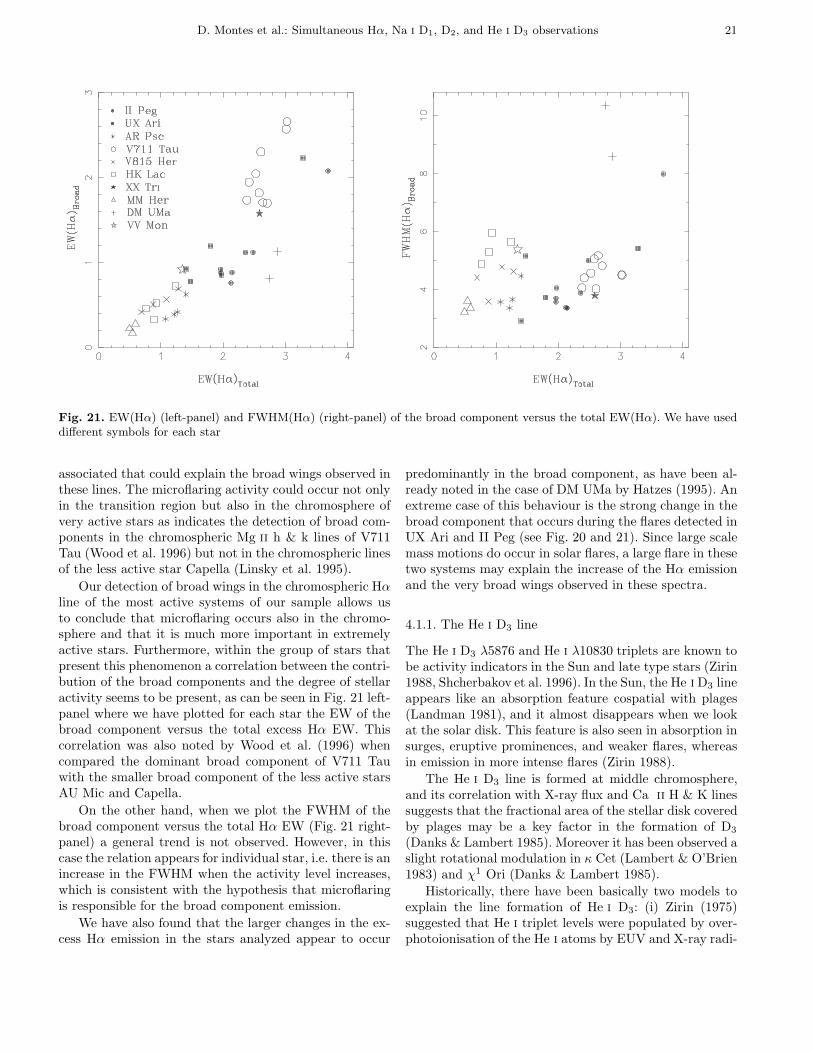
Fig. 21. EW(Hα) (left-panel) and FWHM(Hα) (right-panel) of the broad component versus the total EW(Hα). We have useddifferent symbols for each star
associated that could explain the broad wings observed inthese lines. The microflaring activity could occur not onlyin the transition region but also in the chromosphere ofvery active stars as indicates the detection of broad com-ponents in the chromospheric Mg ii h & k lines of V711Tau (Wood et al. 1996) but not in the chromospheric linesof the less active star Capella (Linsky et al. 1995).
Our detection of broad wings in the chromospheric Hαline of the most active systems of our sample allows usto conclude that microflaring occurs also in the chromo-sphere and that it is much more important in extremelyactive stars. Furthermore, within the group of stars thatpresent this phenomenon a correlation between the contri-bution of the broad components and the degree of stellaractivity seems to be present, as can be seen in Fig. 21 left-panel where we have plotted for each star the EW of thebroad component versus the total excess Hα EW. Thiscorrelation was also noted by Wood et al. (1996) whencompared the dominant broad component of V711 Tauwith the smaller broad component of the less active starsAU Mic and Capella.
On the other hand, when we plot the FWHM of thebroad component versus the total Hα EW (Fig. 21 right-panel) a general trend is not observed. However, in thiscase the relation appears for individual star, i.e. there is anincrease in the FWHM when the activity level increases,which is consistent with the hypothesis that microflaringis responsible for the broad component emission.
We have also found that the larger changes in the ex-cess Hα emission in the stars analyzed appear to occur
predominantly in the broad component, as have been al-ready noted in the case of DM UMa by Hatzes (1995). Anextreme case of this behaviour is the strong change in thebroad component that occurs during the flares detected inUX Ari and II Peg (see Fig. 20 and 21). Since large scalemass motions do occur in solar flares, a large flare in thesetwo systems may explain the increase of the Hα emissionand the very broad wings observed in these spectra.
4.1.1. The He i D3 line
The He i D3 λ5876 and He i λ10830 triplets are known tobe activity indicators in the Sun and late type stars (Zirin1988, Shcherbakov et al. 1996). In the Sun, the He iD3 lineappears like an absorption feature cospatial with plages(Landman 1981), and it almost disappears when we lookat the solar disk. This feature is also seen in absorption insurges, eruptive prominences, and weaker flares, whereasin emission in more intense flares (Zirin 1988).
The He i D3 line is formed at middle chromosphere,and its correlation with X-ray flux and Ca ii H & K linessuggests that the fractional area of the stellar disk coveredby plages may be a key factor in the formation of D3
(Danks & Lambert 1985). Moreover it has been observed aslight rotational modulation in κ Cet (Lambert & O’Brien1983) and χ1 Ori (Danks & Lambert 1985).
Historically, there have been basically two models toexplain the line formation of He i D3: (i) Zirin (1975)suggested that He i triplet levels were populated by over-photoionisation of the He i atoms by EUV and X-ray radi-
22 D. Montes et al.: Simultaneous Hα, Na i D1, D2, and He i D3 observations
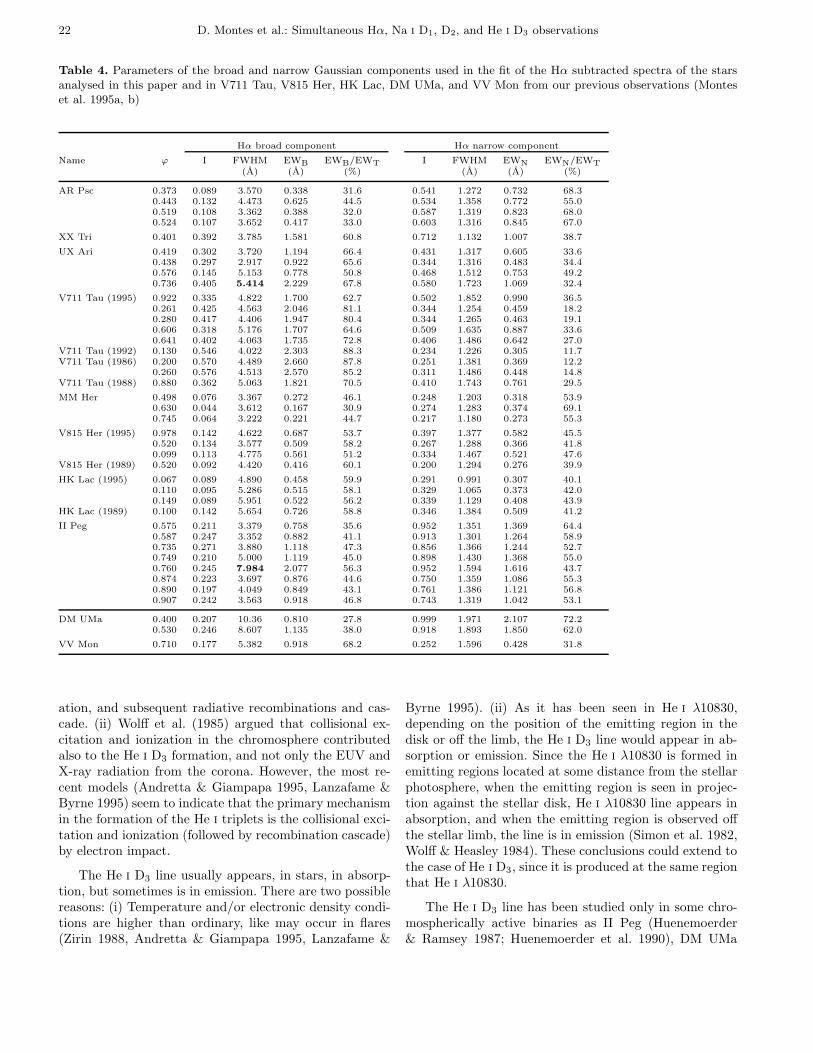
Table 4. Parameters of the broad and narrow Gaussian components used in the fit of the Hα subtracted spectra of the starsanalysed in this paper and in V711 Tau, V815 Her, HK Lac, DM UMa, and VV Mon from our previous observations (Monteset al. 1995a, b)
Hα broad component Hα narrow component
Name ϕ I FWHM EWB EWB/EWT I FWHM EWN EWN/EWT
(A) (A) (%) (A) (A) (%)
AR Psc 0.373 0.089 3.570 0.338 31.6 0.541 1.272 0.732 68.30.443 0.132 4.473 0.625 44.5 0.534 1.358 0.772 55.00.519 0.108 3.362 0.388 32.0 0.587 1.319 0.823 68.00.524 0.107 3.652 0.417 33.0 0.603 1.316 0.845 67.0
XX Tri 0.401 0.392 3.785 1.581 60.8 0.712 1.132 1.007 38.7
UX Ari 0.419 0.302 3.720 1.194 66.4 0.431 1.317 0.605 33.60.438 0.297 2.917 0.922 65.6 0.344 1.316 0.483 34.40.576 0.145 5.153 0.778 50.8 0.468 1.512 0.753 49.20.736 0.405 5.414 2.229 67.8 0.580 1.723 1.069 32.4
V711 Tau (1995) 0.922 0.335 4.822 1.700 62.7 0.502 1.852 0.990 36.50.261 0.425 4.563 2.046 81.1 0.344 1.254 0.459 18.20.280 0.417 4.406 1.947 80.4 0.344 1.265 0.463 19.10.606 0.318 5.176 1.707 64.6 0.509 1.635 0.887 33.60.641 0.402 4.063 1.735 72.8 0.406 1.486 0.642 27.0
V711 Tau (1992) 0.130 0.546 4.022 2.303 88.3 0.234 1.226 0.305 11.7V711 Tau (1986) 0.200 0.570 4.489 2.660 87.8 0.251 1.381 0.369 12.2
0.260 0.576 4.513 2.570 85.2 0.311 1.486 0.448 14.8V711 Tau (1988) 0.880 0.362 5.063 1.821 70.5 0.410 1.743 0.761 29.5
MM Her 0.498 0.076 3.367 0.272 46.1 0.248 1.203 0.318 53.90.630 0.044 3.612 0.167 30.9 0.274 1.283 0.374 69.10.745 0.064 3.222 0.221 44.7 0.217 1.180 0.273 55.3
V815 Her (1995) 0.978 0.142 4.622 0.687 53.7 0.397 1.377 0.582 45.50.520 0.134 3.577 0.509 58.2 0.267 1.288 0.366 41.80.099 0.113 4.775 0.561 51.2 0.334 1.467 0.521 47.6
V815 Her (1989) 0.520 0.092 4.420 0.416 60.1 0.200 1.294 0.276 39.9
HK Lac (1995) 0.067 0.089 4.890 0.458 59.9 0.291 0.991 0.307 40.10.110 0.095 5.286 0.515 58.1 0.329 1.065 0.373 42.00.149 0.089 5.951 0.522 56.2 0.339 1.129 0.408 43.9
HK Lac (1989) 0.100 0.142 5.654 0.726 58.8 0.346 1.384 0.509 41.2
II Peg 0.575 0.211 3.379 0.758 35.6 0.952 1.351 1.369 64.40.587 0.247 3.352 0.882 41.1 0.913 1.301 1.264 58.90.735 0.271 3.880 1.118 47.3 0.856 1.366 1.244 52.70.749 0.210 5.000 1.119 45.0 0.898 1.430 1.368 55.00.760 0.245 7.984 2.077 56.3 0.952 1.594 1.616 43.70.874 0.223 3.697 0.876 44.6 0.750 1.359 1.086 55.30.890 0.197 4.049 0.849 43.1 0.761 1.386 1.121 56.80.907 0.242 3.563 0.918 46.8 0.743 1.319 1.042 53.1
DM UMa 0.400 0.207 10.36 0.810 27.8 0.999 1.971 2.107 72.20.530 0.246 8.607 1.135 38.0 0.918 1.893 1.850 62.0
VV Mon 0.710 0.177 5.382 0.918 68.2 0.252 1.596 0.428 31.8
ation, and subsequent radiative recombinations and cas-cade. (ii) Wolff et al. (1985) argued that collisional ex-citation and ionization in the chromosphere contributedalso to the He i D3 formation, and not only the EUV andX-ray radiation from the corona. However, the most re-cent models (Andretta & Giampapa 1995, Lanzafame &Byrne 1995) seem to indicate that the primary mechanismin the formation of the He i triplets is the collisional exci-tation and ionization (followed by recombination cascade)by electron impact.
The He i D3 line usually appears, in stars, in absorp-tion, but sometimes is in emission. There are two possiblereasons: (i) Temperature and/or electronic density condi-tions are higher than ordinary, like may occur in flares(Zirin 1988, Andretta & Giampapa 1995, Lanzafame &
Byrne 1995). (ii) As it has been seen in He i λ10830,depending on the position of the emitting region in thedisk or off the limb, the He i D3 line would appear in ab-sorption or emission. Since the He i λ10830 is formed inemitting regions located at some distance from the stellarphotosphere, when the emitting region is seen in projec-tion against the stellar disk, He i λ10830 line appears inabsorption, and when the emitting region is observed offthe stellar limb, the line is in emission (Simon et al. 1982,Wolff & Heasley 1984). These conclusions could extend tothe case of He i D3, since it is produced at the same regionthat He i λ10830.
The He i D3 line has been studied only in some chro-mospherically active binaries as II Peg (Huenemoerder& Ramsey 1987; Huenemoerder et al. 1990), DM UMa
D. Montes et al.: Simultaneous Hα, Na i D1, D2, and He i D3 observations 23
(Hatzes 1995), ER Vul (Gunn & Doyle 1996) and GKHya (Gunn et al. 1996). The observation of emission inthe He i D3 line supports the detection of flare like eventsas in the case of II Peg (Huenemoerder & Ramsey 1987)and the weak-lined T Tauri star V410 Tau (Welty & Ram-sey 1996).
In our spectra the He i D3 line has been found in emis-sion only during the flares of UX Ari and II Peg. We wishto emphasize that the detection of He i D3 in emissionin the RS CVn systems seems to occur at orbital phasesnear to the quadrature. In our observations we have de-tected He i D3 in emission at orbital phase 0.74 in UXAri (Montes et al. 1996b) and at 0.76 in II Peg. This linehas been also observed in emission at orbital phases 0.22,0.26, 0.77 in II Peg by Huenemoerder & Ramsey (1987)and Huenemoerder et al. (1990). Probably we are observ-ing a flare off the limb, i.e. when the plage regions are nearthe limb (the active regions are preferably in the oppositefaces of the stars), which is the most favourable situationto see an off the limb flare. But we cannot distinguishwhether the emission is only due to the existence of theflare, or it is favoured by the relative position on the star.
The application of the spectral subtraction to our sam-ple reveals that the He i D3 line appears as an absorptionfeature more frequently in giants than in dwarfs. Threeout of five giants observed show clear absorptions (BDCet, V1149 Ori and HK Lac) and two of them exhibit apossible absorption (AY Cet and XX Tri), while amongIV and V luminosity class stars there are only two plainabsorptions. Various authors seem to point out a more fre-quent presence of He i λ10830 and λ5876 triplets in giantsand supergiants than in dwarfs (Simon et al. 1982, Zirin1982, Wolff & Heasley 1984).
Zirin (1982) observed He i λ10830 usually in absorp-tion, but sometimes it appears in emission, especiallyin giant and supergiants, with a P Cygni form, and heattributes it to a mass-ejection phenomenon (see alsoO’Brien & Lambert 1986). Simon et al. (1982) saw thatnone of the single red giants, in their sample, having strongλ10830 absorption or emission has prominent transitionregion emission lines or soft X-ray emission, and they pro-posed a scattering process-like responsible for the λ10830line formation. Smith (1983) attributed a larger intensityin λ10830 line for giants and supergiants to the most ef-ficient ionization by EUV and X-ray radiation in atmo-spheres of coronally active giants. Other authors say thatλ10830 line is sometimes produced by the propagation ofacoustic shock waves, or that He i λ10830 transition rep-resents a wind diagnostic. Some of the above proposedmechanisms could also be applied to the He i D3 line.
4.1.2. The Na i D1 and D2 lines
The Na i D1 and D2 lines are collisionally-controlled in theatmospheres of late-type stars and are formed in the lowerchromosphere. So, the detection of filled - in absorption
in the D1 and D2 lines may provide information aboutchromospheric emission. (see the recent models of theselines for M dwarfs stars by Andretta et al. 1997).
In the Sun, Barrado et al. (1995) and Barrado (1996)have found changes in the EW of Na i lines in spectrataken at different regions over the solar surface, and arelation with the filled-in absorption Hα that might indi-cate that there is a non-radiative effect in the formationof these lines.
In other stars the D1 and D2 lines have been observedin emission or as a filled-in in very active red dwarf flarestars (Pettersen et al. 1984; Pettersen 1989). However, nosystematic study of these lines has been performed in starswith different levels of activity, and in chromosphericallyactive binaries only the negative and uncertain detectionof filled-in in the few active binaries ER Vul and GK Hya,respectively, has been reported in the recent studies ofGunn & Doyle (1996) and Gunn et al. (1996).
The application of the spectral subtraction techniquein these lines is more difficult that in the Hα line, becausetheir wings are very sensitive to the effective tempera-ture, mainly in latter spectral types. Therefore, small dif-ferences in spectral type, not appreciated in the Hα line,produce significant changes of the subtracted spectra inthe wings of the Na i lines. Moreover, in this spectral re-gion there is a large number of telluric lines, and in thespectra of some stars interstellar Na i could be present.However, the distances of the majority of the stars is lowerthan 50 pc and the effect of the interstellar Na i is negli-gible.
In spite of this problems, some conclusions can bedrawn. In the chromospherically active binaries analysedhere, the spectral subtraction reveals that the core of theNa i D1 and D2 lines are filled-in by chromospheric emis-sion in the more active star of the sample (the star withHα emission above the continuum, and with larger excessHα emission EW). The stars with only a small or withoutexcess Hα emission as BD Cet, AY Cet, V1149 Ori andKT Peg do not exhibit excess emission in the Na i lines.Moreover, the excess D1 and D2 emissions obtained arelarger in the systems with larger excess Hα emission, andalso increase in the flares observed in UX Ari and II Peg.In short, we can conclude that the filled-in of the core ofthe Na i D1 and D2 lines could be used as a chromosphericactivity indicator.
5. Conclusions
In this paper we have analysed, using the spectral subtrac-tion technique, simultaneous Hα, Na i D1, D2, and He iD3
spectroscopic observations of 18 chromospherically activebinary systems.
We have found excess Hα in all the systems, exceptKT Peg which have also small emission in the Ca ii H & Klines. The subtracted Hα profile of the more active stars ofthe sample (Hα in emission above the continuum) has very
24 D. Montes et al.: Simultaneous Hα, Na i D1, D2, and He i D3 observations
broad wings, and is well matched using a two-componentsGaussian fit (narrow and broad). The broad componentis primarily responsible for the observed variations of theprofile, and its contribution to the total EW increases withthe degree of activity. So, we have interpreted this broadcomponent emission as arising from microflaring activitythat take place in the chromosphere of this very activestars.
The Hα observation of the eclipsing binary system ARLac at orbital phase 0.939, when a 0.33 fraction of the hotcomponent is hidden by the cool component, allowed us todetect the presence of prominence-like extended materialseen off the limb of the cool component through the de-tection of excess Hα absorption located at the wavelengthposition corresponding to the hot component. A small ex-cess absorption in the He i D3 line is also present at thisorbital phase.
We reported the detection of an optical flare in thesystems UX Ari and II Peg through the presence of theHe i D3 in emission in coincidence with the enhancementof the Hα emission.
We have found the He i D3 in emission only in the twoabove mentioned flares, and as an absorption feature inthe subtracted spectra of a large number of giant stars ofthe sample.
The application of the spectral subtraction techniquereveals that the core of the Na i D1 and D2 lines are alsofilled-in by chromospheric emission in the more active starof the sample. The stars with only a small excess Hα emis-sion do not exhibit excess emission in the Na i lines.
Acknowledgements. This work has been supported by the Uni-versidad Complutense de Madrid and the Spanish DireccionGeneral de Investigacion Cientıfica y Tecnica (DGICYT) undergrant PB94-0263. We would like to thank the referee S. Cata-lano for suggesting several improvements and clarifications.
References
Andretta V., Giampapa M.S., 1995, ApJ 439, 405Andretta V., Doyle J.G., Byrne P.B., 1997, A&A (in press)Basri G., Wilcots E., Stout N., 1989, PASP 101, 528Barrado D., De Castro E., Garcıa Lopez R.J., Sanchez Almeida
J., Montesinos B. 1995, in: Stellar Surface Structure, IAUSymp 176, Poster Proceedings, Strassmeier K. (ed), p. 123
Barrado D., 1996, Th. Doctoral, Universidad Complutense deMadrid
Bidelman W.P., McConnell D.J., 1973, AJ 78, 687Bopp B.W., Fekel F., Aufdenberg J.P. Dempsey R., Dadonas
V., 1993, AJ 106, 2502Catalano S., Frasca A., 1994, 287, 575Danks A.C., Lambert D.L., 1985, A&A 148, 293Dempsey R.C., Neff J., O’Neal D., Olah K., 1996a, AJ 111,
1356Dempsey R.C., Neff J., Linsky J.L., Brown A., 1996b, IAU
Symp. 176, K.G. Strassmeier & J.L. Linsky (eds.), StellarSurface Structure, p. 411
Dempsey R.C., Neff J., Thorpe M.J., et al., 1996c, ApJ 470,1172
Fekel F.C., Moffett T.J., Henry G.W. 1986, ApJS 60, 551Fekel F.C. 1988, AJ 95, 215Fekel F.C., 1996, AJ 112, 269Fernandez-Figueroa M.J., Montes D., De Castro E., Cornide
M., 1994, ApJS 90, 433 (FFMCC)Gunn A.G., Doyle J.G., 1996, A&A (in press)Gunn A.G., Doyle J.G., Houdebine E.R., 1996, A&A (in press)Hall J.C., Ramsey L.W., 1992, AJ 104, 1942Hall J.C. 1996, PASP 108, 313Hampton M., Henry G.W., Eaton J.A., Nolthenius R.A., Hall
D.S., 1996, PASP 108, 68Hatzes A.P., 1995, AJ 109, 350Huenemoerder D.P., Ramsey L.W. 1987, ApJ 319, 392Huenemoerder D.P., Ramsey L.W., Buzasi D.L., 1990, Cool
star stellar systems and the Sun, Sixth Cambridge Work-shop., G. Wallerstein ed.), ASP Conference Series 9, p 236
Lambert D.L., O’Brien G.T., 1983, A&A 128, 110Landman D.A., 1981, ApJ 244, 345Lanzafame A.C., Byrne P.B., 1995, A&A 303, 155Lazaro C., Arevalo M.J., 1996, AJ (in press)Linsky J.L., Wood B.E., 1994, ApJ 430, 342Linsky J.L., Wood B.E., Judge P., Brown A., Andrulis C.,
Ayres T.R., 1995 ApJ 442, 381Montes D., De Castro E., Cornide M., Fernandez-Figueroa
M.J., 1994, in: Cool Stars, Stellar Systems, and the Sun,Eighth Cambridge Workshop, J.P. Caillault (ed.), ASPConference Series 64, 444
Montes D., Fernandez-Figueroa M.J., De Castro E., CornideM., 1995a, A&A 294, 165
Montes D., Fernandez-Figueroa M.J., De Castro E., CornideM., 1995b, A&AS 109, 135
Montes D., De Castro E., Fernandez-Figueroa M.J., CornideM. 1995c, A&AS 114, 287
Montes D., Fernandez-Figueroa M.J., De Castro E., CornideM. 1995d, Stellar Surface Structure, IAU Symp 176, PosterProceedings, Strassmeier K. (ed), p. 167
Montes D., Fernandez-Figueroa M.J., Cornide M., De CastroE., 1996a, A&A 312, 221
Montes D., Sanz-Forcada J., Fernandez-Figueroa M.J., LorenteR., 1996b, A&A 310, L29
Montes D., Martın E.L., Fernandez-Figueroa M.J., Cornide M.,De Castro E. 1997, A&AS (in press)
O’Brien G.T., Lambert D.L., 1986, ApJS 62, 899Pasquini L., Pallavicini R. 1991, A&A 251, 199Pettersen B.R., Evans D.S., Coleman L.A., 1984, ApJ 282, 214Pettersen B.R., 1989, A&A 209, 279Robinson R.D., Airapetian V.S., Maran S.P., Carpenter K.G.,
1996, ApJ 469, 872Shcherbakov A.G., Shcherbakova Z.A., Tuominen I., Jetsu L.,
1996, A&A 309, 655Simon T., Linsky J.L., Schiffer F.H., 1980, ApJ 239, 911Simon T., Linsky J.L., Stencel R.E., 1982, ApJ 257, 225Siarkowski M., Pres P., Drake S.A., White N.E., Singh K.P.,
1996, ApJ 473, 470Smith M.A., 1983, AJ 88, 1031Strassmeier K.G., Fekel F.C., Bopp B.W., Dempsey R.C.,
Henry G.W., 1990, ApJS 72, 191Strassmeier K.G., Hall D.S., Fekel F.C., Scheck M., 1993,
A&AS 100, 173 (CABS)Welty A.D., Ramsey L.W. 1996, AJ (in press)Wolff S.C., Heasley J.N., 1984, PASP 96, 231
D. Montes et al.: Simultaneous Hα, Na i D1, D2, and He i D3 observations 25
Wolff S.C., Heasley J.N., Varsik J., 1985, PASP 97, 707Wood B.E., Harper G.M., Linsky J.L., Dempsey R.C., 1996,
ApJ 458, 761Xuefu L., Huisong T. 1984, Inf. Bull. Var. Stars No. 2606Zirin H., 1975, ApJ 199, L163Zirin H., 1982, ApJ 260, 655Zirin H., 1988, in Astrophysics of the Sun, (Cambridge Uni-
versity Press)
This article was processed by the author using Springer-VerlagLaTEX A&A style file L-AA version 3.


![1 11 2 3 4 arXiv:2004.03065v1 [astro-ph.SR] 7 Apr …arXiv:2004.03065v1 [astro-ph.SR] 7 Apr 2020 Observations of Binary Stars with the Differential Speckle Survey Instrument. IX](https://img.pdfslide.net/doc/110x75/5f6fda3814c4ec1e4a017f9e/1-11-2-3-4-arxiv200403065v1-astro-phsr-7-apr-arxiv200403065v1-astro-phsr.jpg)

![arXiv:1601.00574v1 [cs.LG] 4 Jan 2016 · Shotgun Binary Flag, whether the team starts the play in the shotgun formation Pass Binary Flag, whether the quarterback passes the ball Side](https://img.pdfslide.net/doc/110x75/5f28390b8c11ad0c3b6b3959/arxiv160100574v1-cslg-4-jan-2016-shotgun-binary-flag-whether-the-team-starts.jpg)
![Cs´ak arXiv:1505.06487v1 [astro-ph.SR] 24 May 2015 · 2016. 8. 3. · arXiv:1505.06487v1 [astro-ph.SR] 24 May 2015 A new sdO+dM binary with extreme eclipses and reflection effect](https://img.pdfslide.net/doc/110x75/60d8a140e7cf8212cd560618/csak-arxiv150506487v1-astro-phsr-24-may-2015-2016-8-3-arxiv150506487v1.jpg)


![arXiv:2002.11650v2 [cs.LG] 27 Feb 2020 · arXiv:2002.11650v2 [cs.LG] 27 Feb 2020 Corrupted Multidimensional Binary Search: Learning in the Presence of Irrational Agents Akshay Krishnamurthy∗](https://img.pdfslide.net/doc/110x75/5fcbfc4083d3dc2d90746846/arxiv200211650v2-cslg-27-feb-2020-arxiv200211650v2-cslg-27-feb-2020-corrupted.jpg)
![1 Binary linear codes with few weights from two-to-one functions · 2020. 6. 23. · arXiv:2006.12395v1 [cs.IT] 22 Jun 2020 1 Binary linear codes with few weights from two-to-one](https://img.pdfslide.net/doc/110x75/609e3cd22612b15233708354/1-binary-linear-codes-with-few-weights-from-two-to-one-functions-2020-6-23.jpg)


![arXiv:1211.2301v2 [math.CO] 4 Apr 2013 · arXiv:1211.2301v2 [math.CO] 4 Apr 2013 THE EXTENDED PERMUTOHEDRON ON A TRANSITIVE BINARY RELATION LUIGI SANTOCANALE AND FRIEDRICH WEHRUNG](https://img.pdfslide.net/doc/110x75/5f7400ddc1ccc715ea5da52f/arxiv12112301v2-mathco-4-apr-2013-arxiv12112301v2-mathco-4-apr-2013-the.jpg)