Embed Size (px)
Citation preview
This content has been downloaded from IOPscience Please scroll down to see the full text
Download details
IP Address 195176110254
This content was downloaded on 16062015 at 1625
Please note that terms and conditions apply
Active influence in dynamical models of structural balance in social networks
View the table of contents for this issue or go to the journal homepage for more
2013 EPL 103 18001
(httpiopscienceioporg0295-5075103118001)
Home Search Collections Journals About Contact us My IOPscience
July 2013
EPL 103 (2013) 18001 wwwepljournalorg
doi 1012090295-507510318001
Active influence in dynamical models of structural balancein social networks
Tyler H Summers1 and Iman Shames
2
1 Automatic Control Laboratory ETH Zurich - Zurich Switzerland2 Department of Electrical and Electronic Engineering University of Melbourne - Melbourne Australia
received 8 April 2013 accepted in final form 17 June 2013published online 9 July 2013
PACS 8965-s ndash Social and economic systemsPACS 0545-a ndash Nonlinear dynamics and chaosPACS 0250Le ndash Decision theory and game theory
Abstract ndash We consider a nonlinear dynamical system on a signed graph which can be interpretedas a mathematical model of social networks in which the links can have both positive and negativeconnotations In accordance with a concept from social psychology called structural balance thenegative links play a key role in both the structure and dynamics of the network Recent researchhas shown that in a nonlinear dynamical system modeling the time evolution of ldquofriendlinesslevelsrdquo in the network two opposing factions emerge from almost any initial condition Here westudy active external influence in this dynamical model and show that any agent in the networkcan achieve any desired structurally balanced state from any initial condition by perturbing itsown local friendliness levels Based on this result we also introduce a new network centralitymeasure for signed networks The results are illustrated in an international-relations networkusing United Nations voting record data from 1946 to 2008 to estimate friendliness levels amongstvarious countries
Copyright ccopy EPLA 2013
Introduction ndash There has been a broad effort in manyfields of science and engineering to understand (and even-tually optimize and control) large networks consisting ofmany interacting subsystems One of the key goals of thiseffort is to describe and quantify how graph properties ofthe interconnection structure interrelate with properties ofdynamical processes on the network However there hasbeen relatively little work on structure and dynamics onsigned graphs in which interconnections in the networkscan have either a positive or a negative association Signedgraphs arise in models for a variety of systems includingsocial networks data classification and clustering geneticregulatory networks and non-ferromagnetic Ising modelsIn this paper we study a nonlinear dynamical system on asigned graph which arises from a mathematical model ofsocial networks in which the links can have both positiveand negative connotations
In mathematical models for social-network analysislinks in the network often have positive connotationssuch as friendship collaboration information sharing etcHowever negative interactions in social networks such asantagonism distrust or disagreement also play a key rolein both structure and dynamics of social networks and are
receiving increased attention in the literature [1ndash3] Theyare particularly interesting in light of new online networksthat provide real-world dynamical data for social networkswith both positive and negative relationships For ex-ample users on the product review website Epinions candisplay both trust and distrust of other users on the tech-nology news website Slashdot users can designate otherusers as either friend or foe and on Wikipedia users canvote for or against another person becoming an adminis-trator The structure of such networks has been studiedin [23]
The concept of structural balance is an old idea in so-ciology tracing back to social psychology research in the1940s by Heider [4] The theory begins with notions of ten-sion and balance in three-agent networks Imagine that aperson has two good friends who hate each other Thereis a tension in this situation that is resolved when eitherthe person takes one side and ends the friendship withthe other or when the feuding friends reconcile their dif-ferences Similarly there is a tension amongst three peo-ple unfriendly with one another that is resolved when twoof them form an alliance against the other The theorywas generalized to networks of n agents in the 1950s by
18001-p1
Tyler H Summers and Iman Shames
Cartwright and Harary [5] who model the network as acomplete signed graph in which the n vertices representagents and a complete signed edge set represents relation-ships amongst all agents in the network with positive andnegative signs associated with friendly and hostile rela-tionships respectively They showed that n-agent struc-turally balanced networks are precisely those that can bepartitioned into two factions such that within each fac-tion all relationships are friendly and between factions allrelationships are hostile The theory has found variousapplications eg in models of international relations [6]but has remained static focusing mostly on networkstructure
Dynamic models for structural balance are quite recentand provide a new and interesting perspective [7ndash10] Ifa network is in an initial state that is not structurallybalanced how might the state of the network evolve to-ward a structurally balanced state and what will the even-tual balanced state be Discrete dynamical models inwhich a relationship is either positive or negative havebeen proposed in [7] and [11] In these models the sys-tem evolves by flipping the sign on certain edges to in-crease the number structurally balanced triangles in thenetwork However these models suffer from the existenceof so-called ldquojammed statesrdquo in which the system becomesstuck in a structurally unbalanced local minimum Morerecently Kulakowski et al [9] and Marvel et al [10] haveproposed and analyzed a continuous dynamical model inwhich a real-valued ldquofriendliness levelrdquo is associated witheach relationship (positive values indicate friendliness andnegative values indicate hostility) In this model Marvelet al [10] show that for generic initial conditions the sys-tem converges to a structurally balanced state in finitetime Further a closed-form expression for the balancedstate is derived in terms of the initial state
In this paper we study active external influence in adynamic model of structural balance In particular wesuppose that a single agent can influence the state of thenetwork by perturbing its own friendliness levels in aninternational-relations context this might be the result ofcertain foreign policy actions We show that it is possi-ble for any single agent to achieve any desired structurallybalanced state given any initial state We also present amethod to compute and optimize the influence that is re-quired to achieve the desired state The magnitude of therequired input defines a new dynamic network centralitymeasure for signed graphs in the context of structural bal-ance assigning a relative ldquoinfluencerdquo value to each agentin the network in terms of its ability to achieve a desiredstructurally balanced state with a low-magnitude pertur-bation An agent who can achieve a desired state with aperturbation of smaller magnitude is more influential thanagents who require larger perturbations We illustrate theresults to structural balance in an international-relationsnetwork using data from United Nations General Assem-bly voting records dating from 1946 to 2008 to estimatefriendliness levels amongst various countries Our results
provide an interesting lens through which one can viewthe data
The paper is organized as follows The second sectionreviews the model and basic results from [10] and [9] Thethird section presents our main results In the fourth sec-tion we illustrate our results to an international-relationscase study Finally concluding remarks and a future re-search outlook are provided in the fifth section
A continuous dynamical model for structuralbalance ndash In this section we review the continuous dy-namic model for structural balance proposed in [9] and [10]and a basic result from [10] Let xij denote the ldquofriend-liness levelrdquo between agents i and j We allow xii to benon-zero which can be interpreted as a ldquoself-confidencerdquoor ldquowillingness to compromiserdquo of node i (large positivevalue means high self-confidence or low willingness to com-promise large negative value means low self-confidence orhigh willingness to compromise) We assume that rela-tionships are symmetric ie xij = xji and collect thefriendliness levels in the network into a symmetric matrixX isin Rntimesn For any given X isin Rntimesn we associate a com-plete1 signed graph in which the edge signs correspond tothe signs of each element xij of X A signed graph iscalled structurally balanced if all triangles are balancedWe say that the network is in a structurally balanced stateif the corresponding complete signed graph is structurallybalanced
The dynamic model proposed in [9] and analyzed in [10]is given by the matrix differential equation
X(t) = X2(t) X(0) = X0 (1)
or equivalently element-wise by
xij(t) =sum
k
xik(t)xkj(t) (2)
Each term in (2) moves the associated triangle ijk towarda balanced configuration and for a given pair ij the sum-mation aggregates the effects across all relationships of iand j in the network This can be interpreted as a gossipprocess in which the friendliness level in a relationship ischanged based on opinions of mutual friends
One of the main results from [10] which is relevant forour study is the following
Theorem 1 (ref [10]) Suppose X0 is a random initialmatrix with entries sampled independently from an abso-lutely continuous distribution with bounded support Letλ1 ge middot middot middot ge λn and w1 wn be respectively the eigen-values and associated eigenvectors of X0 Then with prob-ability converging to 1 in the number of agents n we have
ndash λ1 gt 0
1In this paper we assume that each agent has (or develops) anopinion about every other agent which means that X is assumedto have no non-zero entries The theory of structural balance canbe extended to non-complete graphs see eg [1] We will considerthis in future work
18001-p2
Structural balance in social networks
0 002 004 006 008 01 012 014 016 018minus10
minus8
minus6
minus4
minus2
0
2
4
6
8
10
time
frie
ndsh
ip le
vels
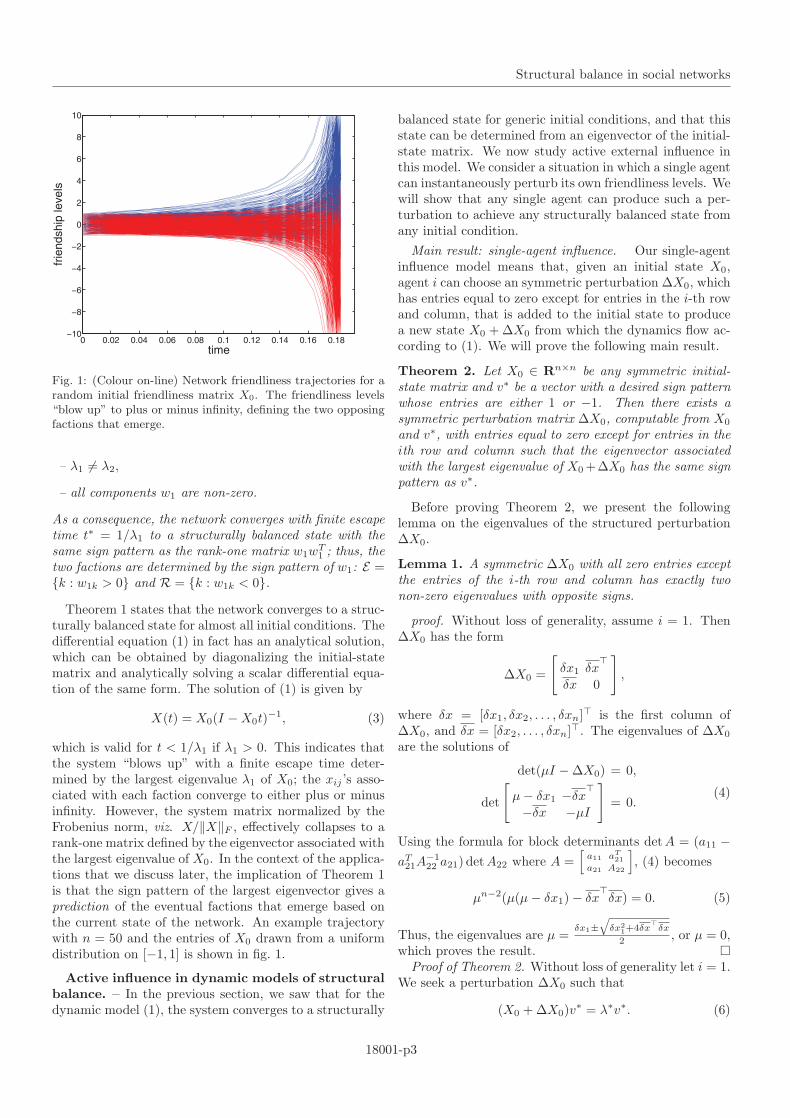
Fig 1 (Colour on-line) Network friendliness trajectories for arandom initial friendliness matrix X0 The friendliness levelsldquoblow uprdquo to plus or minus infinity defining the two opposingfactions that emerge
ndash λ1 = λ2
ndash all components w1 are non-zero
As a consequence the network converges with finite escapetime tlowast = 1λ1 to a structurally balanced state with thesame sign pattern as the rank-one matrix w1w
T1 thus the
two factions are determined by the sign pattern of w1 E =k w1k gt 0 and R = k w1k lt 0
Theorem 1 states that the network converges to a struc-turally balanced state for almost all initial conditions Thedifferential equation (1) in fact has an analytical solutionwhich can be obtained by diagonalizing the initial-statematrix and analytically solving a scalar differential equa-tion of the same form The solution of (1) is given by
X(t) = X0(I minus X0t)minus1 (3)
which is valid for t lt 1λ1 if λ1 gt 0 This indicates thatthe system ldquoblows uprdquo with a finite escape time deter-mined by the largest eigenvalue λ1 of X0 the xij rsquos asso-ciated with each faction converge to either plus or minusinfinity However the system matrix normalized by theFrobenius norm viz XXF effectively collapses to arank-one matrix defined by the eigenvector associated withthe largest eigenvalue of X0 In the context of the applica-tions that we discuss later the implication of Theorem 1is that the sign pattern of the largest eigenvector gives aprediction of the eventual factions that emerge based onthe current state of the network An example trajectorywith n = 50 and the entries of X0 drawn from a uniformdistribution on [minus1 1] is shown in fig 1
Active influence in dynamic models of structuralbalance ndash In the previous section we saw that for thedynamic model (1) the system converges to a structurally
balanced state for generic initial conditions and that thisstate can be determined from an eigenvector of the initial-state matrix We now study active external influence inthis model We consider a situation in which a single agentcan instantaneously perturb its own friendliness levels Wewill show that any single agent can produce such a per-turbation to achieve any structurally balanced state fromany initial condition
Main result single-agent influence Our single-agentinfluence model means that given an initial state X0agent i can choose an symmetric perturbation ΔX0 whichhas entries equal to zero except for entries in the i-th rowand column that is added to the initial state to producea new state X0 + ΔX0 from which the dynamics flow ac-cording to (1) We will prove the following main result
Theorem 2 Let X0 isin Rntimesn be any symmetric initial-state matrix and vlowast be a vector with a desired sign patternwhose entries are either 1 or minus1 Then there exists asymmetric perturbation matrix ΔX0 computable from X0
and vlowast with entries equal to zero except for entries in theith row and column such that the eigenvector associatedwith the largest eigenvalue of X0 +ΔX0 has the same signpattern as vlowast
Before proving Theorem 2 we present the followinglemma on the eigenvalues of the structured perturbationΔX0
Lemma 1 A symmetric ΔX0 with all zero entries exceptthe entries of the i-th row and column has exactly twonon-zero eigenvalues with opposite signs
proof Without loss of generality assume i = 1 ThenΔX0 has the form
ΔX0 =
[δx1 δx
δx 0
]
where δx = [δx1 δx2 δxn] is the first column ofΔX0 and δx = [δx2 δxn] The eigenvalues of ΔX0
are the solutions of
det(μI minus ΔX0) = 0
det
[μ minus δx1 minusδx
minusδx minusμI
]= 0
(4)
Using the formula for block determinants detA = (a11 minusaT21A
minus122 a21) det A22 where A =
[a11 aT
21a21 A22
] (4) becomes
μnminus2(μ(μ minus δx1) minus δx
δx) = 0 (5)
Thus the eigenvalues are μ =δx1plusmn
q
δx21+4δx
δx
2 or μ = 0which proves the result
Proof of Theorem 2 Without loss of generality let i = 1We seek a perturbation ΔX0 such that
(X0 + ΔX0)vlowast = λlowastvlowast (6)
18001-p3
Tyler H Summers and Iman Shames
For a given X0 vlowast and λlowast this is a system of linearequations in ΔX0 which has the solution
δxlowast0 = V minus1(λlowastI minus X0)vlowast (7)
where
V minus1 =1vlowast1
⎡⎢⎢⎢⎣
1 minus vlowast2
vlowast1
minus vlowastn
vlowast1
1
1
⎤⎥⎥⎥⎦ (8)
It remains to be shown that λlowast and vlowast correspond to thelargest eigenvalue and eigenvector pair of X0 +ΔX0 Thiscan be done by taking λlowast ge λ1(X0) and using a basicspectral properties (called Weyl inequalities [12]) of thesum of two symmetric matrices In particular we have
λi(X + ΔX0) le λ1(X0) + λi(ΔX0) i = 1 n (9)
Taking i = 2 and noting that λ2(ΔX0) = 0 from Lemma 1we have λ2(X + ΔX0) le λ1(X0) and thus λlowast = λ1(X +ΔX0) ge λ1(X0) which proves the result
Optimizing the influence Equations (7) and (8) inthe proof of Theorem 2 give an explicit expression for theperturbation required to yield an eigenvector with a spec-ified sign pattern vlowast in terms of the initial-state matrixΔX0 and the largest eigenvalue of the perturbed matrixλlowast In real networks there is a cost associated perturbingthe state of the network and so we are interested in find-ing perturbations with small magnitude In particular wewould like to solve the following optimization problem
minimizeλlowastvlowast
δx0 = V minus1(λlowastI minus X0)vlowastsubject to λlowast ge λ1(X0)
(10)
where the entries of vlowast can be freely chosen up to thespecified sign pattern
Unfortunately this problem is not convex however wecan obtain an approximate solution as follows First notethat for fixed vlowast the objective is minimized when λlowast =λ1(X0) since the objective is monotone increasing in λlowastNext we can obtain an upper bound for the solution andchoose vlowast to minimize the upper bound Let αi = vlowast
i
vlowast1
α = [α2 αn]T L = λlowastI minus X0 L1 be the first columnof L and L be the principal submatrix of L obtained byremoving the first row and column of L Without lossof generality let vlowast
1 be positive An upper bound for theobjective is
δx0 = V minus1(λlowastI minus X0)vlowast =∥∥∥∥L1 +
[minusαT Lα
Lα
] ∥∥∥∥le L1 +
∥∥∥∥[minusαT Lα
Lα
] ∥∥∥∥ (11)
The upper bound in (11) is minimized when α = 0and this in turn is obtained asymptotically as vlowast
1 be-comes much larger than vlowast
i for i = 2 n Thus takingλlowast = λ1(X0) vlowast
1 = 1 (without loss of generality) and vlowasti
small but with the prescribed sign yields a feasible pertur-bation with small norm
A network centrality measure for signed graphs Net-work centrality measures are real-valued functions thatassign a relative ldquoimportancerdquo to each vertex within thegraph Examples include degree betweenness closenessand eigenvector centrality among others The meaning ofcentrality or importance and the relevance of various met-rics depend highly on the modeling context For examplePageRank a variant of eigenvector centrality turns outto be a much better indicator of importance than vertexdegree in the context of networks of web pages one of thekey factors leading to Googlersquos domination of web search
In the context of signed graphs and structural balancethe magnitude of the input required to achieve a desiredstructurally balanced state as described in the previoussection defines a class of network centrality measures Inparticular this input magnitude gives an importance orinfluence value for each agent that measures how easilyan agent can perturb the network into the desired struc-turally balanced state For a given desired state this mag-nitude can be used to rank the influence of all agents inthe network by computing the value for each agent andsorting the result the smallest magnitude corresponds tothe most influential agent The required input magnitudeand the ranking depend of course on the desired stateWe thus define the Structural Balance Influence Index forsigned graphs parameterized by the desired structurallybalanced state as follows
Definition 1 (Structural Balance Influence Index) Givena signed graph with n vertices and an associated symmet-ric friendliness matrix X isin Rntimesn let Xi be a permutationof X with row and column i moved to the first row andcolumn Let vlowast isin minus1 1n be a sign pattern vector thatdefines a desired structurally balanced state The Struc-tural Balance Influence Index of agent i given vlowast is thenorm of the input from agent i required to achieve vlowast
SBIIvlowast(i) = V minus1(λ1(Xi)I minus Xi)vlowast (12)
where V minus1 is given by (8) and vlowastT = vlowastT bull [1 ε ε]T with ε small and positive and bull denoting the Hadamard(element-wise) product
To the best of our knowledge this is the first such cen-trality measure defined in this context It would be inter-esting to study the distribution of this measure in randomand real-world networks
Illustrative example ndash In this section we interpretour results in an international-relations network We useUN General Assembly voting records and gross domesticproduct (GDP) history of 45 countries from 1946 to 2008to estimate friendliness and economic-importance levelsamongst the countries The UN voting records are ob-tained from [13] As a metric of friendliness levels we usean affinity index that has appeared in the international-relations literature which is computed for each year basedon how often nations vote together in the general assem-bly see [14] for details Finally we multiply the affinity
18001-p4
Structural balance in social networks
Fig 2 (Colour on-line) Predicted factions by year
index associated with each pair of countries with the cor-responding gross domestic products (GDPs) of the twocountries in order to capture the relative economic impor-tance of each relationship
We emphasize that the dynamic model (1) is not in-tended to be a detailed model for international relations(only UN voting record similarities and GDPs are ac-counted for) rather the example is used only to illustrateand interpret our results Given a current estimate of thefriendliness levels in the network Theorem 1 can be usedto predict eventual factions that will emerge by calculat-ing the eigenvector associated with the largest eigenvalueof the friendliness matrix Figure 2 shows the factions pre-dicted by the model over time The faction containing theUnited States is blue and the opposing faction is red
An interesting question in this context is how couldvarious countries in the network adjust their friendlinessbilaterally so that the model predicts global harmony (ieall countries converge to a single faction) Also whichcountries require the smallest perturbation to their bilat-eral relationships to achieve this These question can beanswered in our framework by fixing the desired struc-turally balanced state vlowast to have entries with the same signand computing the Structural Balance Influence Index foreach country Figure 3 shows how the Structural BalanceInfluence Index for each country evolves over time We seethat the United States is the most influential agent in thenetwork according to this model due to the relative size
Fig 3 (Colour on-line) Magnitude of influence required toachieve global harmony (all agents converge to a single faction)over time The combination of large GDP and position in thenetwork makes the United States the most influential agentusing this model We also see a global increase in the abilityto achieve global harmony over the last 8 years
of its GDP and to its position in the network From 1946to 1990 the USSRRussia required the largest change inits bilateral relationships to achieve global harmony andcould be viewed as the economic leader of the faction op-posing the United States In 1990 this role was takenover by China It is also interesting to note that there
18001-p5
Tyler H Summers and Iman Shames
has been a global increase in the ability of any countryto achieve global harmony over the last eight years of thedata reflecting increasing disagreement in United Nationsvoting
Conclusions ndash We have considered active influence ina dynamic model of structural balance in social networkswith both positive and negative links We showed that anysingle agent can locally perturb the state of the network toachieve any desired structurally balanced state from anyinitial state We also showed how to optimize the requiredinfluence the magnitude of the required influence defines anetwork centrality measure in the context of signed graphsand structural balance The results were illustrated andinterpreted in an international-relations network based onUnited Nations voting data from 1946 to 2008 The modeland our results give an interesting lens through which onecan view the voting data
There are a variety of potential extensions for futureresearch One could consider extending the results tographs that are not complete or to directed graphs inwhich friendship levels are not necessarily mutual Onecould also consider models that allow the emergence ofmore than two factions these types of models are stud-ied in [8] Another interesting direction would be to con-sider multiple agents having active influence resulting in agame theoretic formulation In an international-relationscontext the analysis of a game between two superpowerswould be particularly interesting Finally one could ex-plore interpretations of the results here in signed graphsarising in other contexts such as data clustering or geneticregulatory networks
REFERENCES
[1] Easley D and Kleinberg J Networks Crowds andMarkets (Cambridge University Press) 2010
[2] Leskovec J Huttenlocher D and Kleinberg JPredicting positive and negative links in online social net-works in Proceedings of the 19th International Conferenceon World Wide Web (ACM) 2010 pp 641ndash650
[3] Leskovec J Huttenlocher D and Kleinberg JSigned networks in social media in Proceedings of the 28thInternational Conference on Human Factors in Comput-ing Systems (ACM) 2010 pp 1361ndash1370
[4] Heider F J Psychol 21 (1946) 107[5] Cartwright D and Harary F Psychol Rev 63
(1956) 277[6] Axelrod R M and Bennett D S A Landscape The-
ory of Aggregation (Cambridge University Press) 1991[7] Antal T Krapivsky P L and Redner S Phys Rev
E 72 (2005) 036121[8] Krawczyk M J Comput Phys Commun 181 (2010)
1702[9] Kulakowski K Gawronski P and Gronek P Int
J Mod Phys C 16 (2005) 707[10] Marvel S A Kleinberg J Kleinberg R D and
Strogatz S H Proc Natl Acad Sci USA 108(2011) 1771
[11] Marvel S A Strogatz S H and Kleinberg J MPhys Rev Lett 103 (2009) 198701
[12] Weyl H Math Ann 71 (1912) 441[13] Strezhnev Anton and Voeten Erik 2013-02 United
Nations General Assembly Voting Data httphdl
handlenet1902112379 UNF5NpHV5DXWPNWMWOrLGTj
QYA== Erik Voeten [Distributor] V5 [Version][14] Gartzke E and Jo D J The Affinity of Nations Index
1946ndash2002 (Columbia University New York NY) 2006
18001-p6
July 2013
EPL 103 (2013) 18001 wwwepljournalorg
doi 1012090295-507510318001
Active influence in dynamical models of structural balancein social networks
Tyler H Summers1 and Iman Shames
2
1 Automatic Control Laboratory ETH Zurich - Zurich Switzerland2 Department of Electrical and Electronic Engineering University of Melbourne - Melbourne Australia
received 8 April 2013 accepted in final form 17 June 2013published online 9 July 2013
PACS 8965-s ndash Social and economic systemsPACS 0545-a ndash Nonlinear dynamics and chaosPACS 0250Le ndash Decision theory and game theory
Abstract ndash We consider a nonlinear dynamical system on a signed graph which can be interpretedas a mathematical model of social networks in which the links can have both positive and negativeconnotations In accordance with a concept from social psychology called structural balance thenegative links play a key role in both the structure and dynamics of the network Recent researchhas shown that in a nonlinear dynamical system modeling the time evolution of ldquofriendlinesslevelsrdquo in the network two opposing factions emerge from almost any initial condition Here westudy active external influence in this dynamical model and show that any agent in the networkcan achieve any desired structurally balanced state from any initial condition by perturbing itsown local friendliness levels Based on this result we also introduce a new network centralitymeasure for signed networks The results are illustrated in an international-relations networkusing United Nations voting record data from 1946 to 2008 to estimate friendliness levels amongstvarious countries
Copyright ccopy EPLA 2013
Introduction ndash There has been a broad effort in manyfields of science and engineering to understand (and even-tually optimize and control) large networks consisting ofmany interacting subsystems One of the key goals of thiseffort is to describe and quantify how graph properties ofthe interconnection structure interrelate with properties ofdynamical processes on the network However there hasbeen relatively little work on structure and dynamics onsigned graphs in which interconnections in the networkscan have either a positive or a negative association Signedgraphs arise in models for a variety of systems includingsocial networks data classification and clustering geneticregulatory networks and non-ferromagnetic Ising modelsIn this paper we study a nonlinear dynamical system on asigned graph which arises from a mathematical model ofsocial networks in which the links can have both positiveand negative connotations
In mathematical models for social-network analysislinks in the network often have positive connotationssuch as friendship collaboration information sharing etcHowever negative interactions in social networks such asantagonism distrust or disagreement also play a key rolein both structure and dynamics of social networks and are
receiving increased attention in the literature [1ndash3] Theyare particularly interesting in light of new online networksthat provide real-world dynamical data for social networkswith both positive and negative relationships For ex-ample users on the product review website Epinions candisplay both trust and distrust of other users on the tech-nology news website Slashdot users can designate otherusers as either friend or foe and on Wikipedia users canvote for or against another person becoming an adminis-trator The structure of such networks has been studiedin [23]
The concept of structural balance is an old idea in so-ciology tracing back to social psychology research in the1940s by Heider [4] The theory begins with notions of ten-sion and balance in three-agent networks Imagine that aperson has two good friends who hate each other Thereis a tension in this situation that is resolved when eitherthe person takes one side and ends the friendship withthe other or when the feuding friends reconcile their dif-ferences Similarly there is a tension amongst three peo-ple unfriendly with one another that is resolved when twoof them form an alliance against the other The theorywas generalized to networks of n agents in the 1950s by
18001-p1
Tyler H Summers and Iman Shames
Cartwright and Harary [5] who model the network as acomplete signed graph in which the n vertices representagents and a complete signed edge set represents relation-ships amongst all agents in the network with positive andnegative signs associated with friendly and hostile rela-tionships respectively They showed that n-agent struc-turally balanced networks are precisely those that can bepartitioned into two factions such that within each fac-tion all relationships are friendly and between factions allrelationships are hostile The theory has found variousapplications eg in models of international relations [6]but has remained static focusing mostly on networkstructure
Dynamic models for structural balance are quite recentand provide a new and interesting perspective [7ndash10] Ifa network is in an initial state that is not structurallybalanced how might the state of the network evolve to-ward a structurally balanced state and what will the even-tual balanced state be Discrete dynamical models inwhich a relationship is either positive or negative havebeen proposed in [7] and [11] In these models the sys-tem evolves by flipping the sign on certain edges to in-crease the number structurally balanced triangles in thenetwork However these models suffer from the existenceof so-called ldquojammed statesrdquo in which the system becomesstuck in a structurally unbalanced local minimum Morerecently Kulakowski et al [9] and Marvel et al [10] haveproposed and analyzed a continuous dynamical model inwhich a real-valued ldquofriendliness levelrdquo is associated witheach relationship (positive values indicate friendliness andnegative values indicate hostility) In this model Marvelet al [10] show that for generic initial conditions the sys-tem converges to a structurally balanced state in finitetime Further a closed-form expression for the balancedstate is derived in terms of the initial state
In this paper we study active external influence in adynamic model of structural balance In particular wesuppose that a single agent can influence the state of thenetwork by perturbing its own friendliness levels in aninternational-relations context this might be the result ofcertain foreign policy actions We show that it is possi-ble for any single agent to achieve any desired structurallybalanced state given any initial state We also present amethod to compute and optimize the influence that is re-quired to achieve the desired state The magnitude of therequired input defines a new dynamic network centralitymeasure for signed graphs in the context of structural bal-ance assigning a relative ldquoinfluencerdquo value to each agentin the network in terms of its ability to achieve a desiredstructurally balanced state with a low-magnitude pertur-bation An agent who can achieve a desired state with aperturbation of smaller magnitude is more influential thanagents who require larger perturbations We illustrate theresults to structural balance in an international-relationsnetwork using data from United Nations General Assem-bly voting records dating from 1946 to 2008 to estimatefriendliness levels amongst various countries Our results
provide an interesting lens through which one can viewthe data
The paper is organized as follows The second sectionreviews the model and basic results from [10] and [9] Thethird section presents our main results In the fourth sec-tion we illustrate our results to an international-relationscase study Finally concluding remarks and a future re-search outlook are provided in the fifth section
A continuous dynamical model for structuralbalance ndash In this section we review the continuous dy-namic model for structural balance proposed in [9] and [10]and a basic result from [10] Let xij denote the ldquofriend-liness levelrdquo between agents i and j We allow xii to benon-zero which can be interpreted as a ldquoself-confidencerdquoor ldquowillingness to compromiserdquo of node i (large positivevalue means high self-confidence or low willingness to com-promise large negative value means low self-confidence orhigh willingness to compromise) We assume that rela-tionships are symmetric ie xij = xji and collect thefriendliness levels in the network into a symmetric matrixX isin Rntimesn For any given X isin Rntimesn we associate a com-plete1 signed graph in which the edge signs correspond tothe signs of each element xij of X A signed graph iscalled structurally balanced if all triangles are balancedWe say that the network is in a structurally balanced stateif the corresponding complete signed graph is structurallybalanced
The dynamic model proposed in [9] and analyzed in [10]is given by the matrix differential equation
X(t) = X2(t) X(0) = X0 (1)
or equivalently element-wise by
xij(t) =sum
k
xik(t)xkj(t) (2)
Each term in (2) moves the associated triangle ijk towarda balanced configuration and for a given pair ij the sum-mation aggregates the effects across all relationships of iand j in the network This can be interpreted as a gossipprocess in which the friendliness level in a relationship ischanged based on opinions of mutual friends
One of the main results from [10] which is relevant forour study is the following
Theorem 1 (ref [10]) Suppose X0 is a random initialmatrix with entries sampled independently from an abso-lutely continuous distribution with bounded support Letλ1 ge middot middot middot ge λn and w1 wn be respectively the eigen-values and associated eigenvectors of X0 Then with prob-ability converging to 1 in the number of agents n we have
ndash λ1 gt 0
1In this paper we assume that each agent has (or develops) anopinion about every other agent which means that X is assumedto have no non-zero entries The theory of structural balance canbe extended to non-complete graphs see eg [1] We will considerthis in future work
18001-p2
Structural balance in social networks
0 002 004 006 008 01 012 014 016 018minus10
minus8
minus6
minus4
minus2
0
2
4
6
8
10
time
frie
ndsh
ip le
vels
Fig 1 (Colour on-line) Network friendliness trajectories for arandom initial friendliness matrix X0 The friendliness levelsldquoblow uprdquo to plus or minus infinity defining the two opposingfactions that emerge
ndash λ1 = λ2
ndash all components w1 are non-zero
As a consequence the network converges with finite escapetime tlowast = 1λ1 to a structurally balanced state with thesame sign pattern as the rank-one matrix w1w
T1 thus the
two factions are determined by the sign pattern of w1 E =k w1k gt 0 and R = k w1k lt 0
Theorem 1 states that the network converges to a struc-turally balanced state for almost all initial conditions Thedifferential equation (1) in fact has an analytical solutionwhich can be obtained by diagonalizing the initial-statematrix and analytically solving a scalar differential equa-tion of the same form The solution of (1) is given by
X(t) = X0(I minus X0t)minus1 (3)
which is valid for t lt 1λ1 if λ1 gt 0 This indicates thatthe system ldquoblows uprdquo with a finite escape time deter-mined by the largest eigenvalue λ1 of X0 the xij rsquos asso-ciated with each faction converge to either plus or minusinfinity However the system matrix normalized by theFrobenius norm viz XXF effectively collapses to arank-one matrix defined by the eigenvector associated withthe largest eigenvalue of X0 In the context of the applica-tions that we discuss later the implication of Theorem 1is that the sign pattern of the largest eigenvector gives aprediction of the eventual factions that emerge based onthe current state of the network An example trajectorywith n = 50 and the entries of X0 drawn from a uniformdistribution on [minus1 1] is shown in fig 1
Active influence in dynamic models of structuralbalance ndash In the previous section we saw that for thedynamic model (1) the system converges to a structurally
balanced state for generic initial conditions and that thisstate can be determined from an eigenvector of the initial-state matrix We now study active external influence inthis model We consider a situation in which a single agentcan instantaneously perturb its own friendliness levels Wewill show that any single agent can produce such a per-turbation to achieve any structurally balanced state fromany initial condition
Main result single-agent influence Our single-agentinfluence model means that given an initial state X0agent i can choose an symmetric perturbation ΔX0 whichhas entries equal to zero except for entries in the i-th rowand column that is added to the initial state to producea new state X0 + ΔX0 from which the dynamics flow ac-cording to (1) We will prove the following main result
Theorem 2 Let X0 isin Rntimesn be any symmetric initial-state matrix and vlowast be a vector with a desired sign patternwhose entries are either 1 or minus1 Then there exists asymmetric perturbation matrix ΔX0 computable from X0
and vlowast with entries equal to zero except for entries in theith row and column such that the eigenvector associatedwith the largest eigenvalue of X0 +ΔX0 has the same signpattern as vlowast
Before proving Theorem 2 we present the followinglemma on the eigenvalues of the structured perturbationΔX0
Lemma 1 A symmetric ΔX0 with all zero entries exceptthe entries of the i-th row and column has exactly twonon-zero eigenvalues with opposite signs
proof Without loss of generality assume i = 1 ThenΔX0 has the form
ΔX0 =
[δx1 δx
δx 0
]
where δx = [δx1 δx2 δxn] is the first column ofΔX0 and δx = [δx2 δxn] The eigenvalues of ΔX0
are the solutions of
det(μI minus ΔX0) = 0
det
[μ minus δx1 minusδx
minusδx minusμI
]= 0
(4)
Using the formula for block determinants detA = (a11 minusaT21A
minus122 a21) det A22 where A =
[a11 aT
21a21 A22
] (4) becomes
μnminus2(μ(μ minus δx1) minus δx
δx) = 0 (5)
Thus the eigenvalues are μ =δx1plusmn
q
δx21+4δx
δx
2 or μ = 0which proves the result
Proof of Theorem 2 Without loss of generality let i = 1We seek a perturbation ΔX0 such that
(X0 + ΔX0)vlowast = λlowastvlowast (6)
18001-p3
Tyler H Summers and Iman Shames
For a given X0 vlowast and λlowast this is a system of linearequations in ΔX0 which has the solution
δxlowast0 = V minus1(λlowastI minus X0)vlowast (7)
where
V minus1 =1vlowast1
⎡⎢⎢⎢⎣
1 minus vlowast2
vlowast1
minus vlowastn
vlowast1
1
1
⎤⎥⎥⎥⎦ (8)
It remains to be shown that λlowast and vlowast correspond to thelargest eigenvalue and eigenvector pair of X0 +ΔX0 Thiscan be done by taking λlowast ge λ1(X0) and using a basicspectral properties (called Weyl inequalities [12]) of thesum of two symmetric matrices In particular we have
λi(X + ΔX0) le λ1(X0) + λi(ΔX0) i = 1 n (9)
Taking i = 2 and noting that λ2(ΔX0) = 0 from Lemma 1we have λ2(X + ΔX0) le λ1(X0) and thus λlowast = λ1(X +ΔX0) ge λ1(X0) which proves the result
Optimizing the influence Equations (7) and (8) inthe proof of Theorem 2 give an explicit expression for theperturbation required to yield an eigenvector with a spec-ified sign pattern vlowast in terms of the initial-state matrixΔX0 and the largest eigenvalue of the perturbed matrixλlowast In real networks there is a cost associated perturbingthe state of the network and so we are interested in find-ing perturbations with small magnitude In particular wewould like to solve the following optimization problem
minimizeλlowastvlowast
δx0 = V minus1(λlowastI minus X0)vlowastsubject to λlowast ge λ1(X0)
(10)
where the entries of vlowast can be freely chosen up to thespecified sign pattern
Unfortunately this problem is not convex however wecan obtain an approximate solution as follows First notethat for fixed vlowast the objective is minimized when λlowast =λ1(X0) since the objective is monotone increasing in λlowastNext we can obtain an upper bound for the solution andchoose vlowast to minimize the upper bound Let αi = vlowast
i
vlowast1
α = [α2 αn]T L = λlowastI minus X0 L1 be the first columnof L and L be the principal submatrix of L obtained byremoving the first row and column of L Without lossof generality let vlowast
1 be positive An upper bound for theobjective is
δx0 = V minus1(λlowastI minus X0)vlowast =∥∥∥∥L1 +
[minusαT Lα
Lα
] ∥∥∥∥le L1 +
∥∥∥∥[minusαT Lα
Lα
] ∥∥∥∥ (11)
The upper bound in (11) is minimized when α = 0and this in turn is obtained asymptotically as vlowast
1 be-comes much larger than vlowast
i for i = 2 n Thus takingλlowast = λ1(X0) vlowast
1 = 1 (without loss of generality) and vlowasti
small but with the prescribed sign yields a feasible pertur-bation with small norm
A network centrality measure for signed graphs Net-work centrality measures are real-valued functions thatassign a relative ldquoimportancerdquo to each vertex within thegraph Examples include degree betweenness closenessand eigenvector centrality among others The meaning ofcentrality or importance and the relevance of various met-rics depend highly on the modeling context For examplePageRank a variant of eigenvector centrality turns outto be a much better indicator of importance than vertexdegree in the context of networks of web pages one of thekey factors leading to Googlersquos domination of web search
In the context of signed graphs and structural balancethe magnitude of the input required to achieve a desiredstructurally balanced state as described in the previoussection defines a class of network centrality measures Inparticular this input magnitude gives an importance orinfluence value for each agent that measures how easilyan agent can perturb the network into the desired struc-turally balanced state For a given desired state this mag-nitude can be used to rank the influence of all agents inthe network by computing the value for each agent andsorting the result the smallest magnitude corresponds tothe most influential agent The required input magnitudeand the ranking depend of course on the desired stateWe thus define the Structural Balance Influence Index forsigned graphs parameterized by the desired structurallybalanced state as follows
Definition 1 (Structural Balance Influence Index) Givena signed graph with n vertices and an associated symmet-ric friendliness matrix X isin Rntimesn let Xi be a permutationof X with row and column i moved to the first row andcolumn Let vlowast isin minus1 1n be a sign pattern vector thatdefines a desired structurally balanced state The Struc-tural Balance Influence Index of agent i given vlowast is thenorm of the input from agent i required to achieve vlowast
SBIIvlowast(i) = V minus1(λ1(Xi)I minus Xi)vlowast (12)
where V minus1 is given by (8) and vlowastT = vlowastT bull [1 ε ε]T with ε small and positive and bull denoting the Hadamard(element-wise) product
To the best of our knowledge this is the first such cen-trality measure defined in this context It would be inter-esting to study the distribution of this measure in randomand real-world networks
Illustrative example ndash In this section we interpretour results in an international-relations network We useUN General Assembly voting records and gross domesticproduct (GDP) history of 45 countries from 1946 to 2008to estimate friendliness and economic-importance levelsamongst the countries The UN voting records are ob-tained from [13] As a metric of friendliness levels we usean affinity index that has appeared in the international-relations literature which is computed for each year basedon how often nations vote together in the general assem-bly see [14] for details Finally we multiply the affinity
18001-p4
Structural balance in social networks
Fig 2 (Colour on-line) Predicted factions by year
index associated with each pair of countries with the cor-responding gross domestic products (GDPs) of the twocountries in order to capture the relative economic impor-tance of each relationship
We emphasize that the dynamic model (1) is not in-tended to be a detailed model for international relations(only UN voting record similarities and GDPs are ac-counted for) rather the example is used only to illustrateand interpret our results Given a current estimate of thefriendliness levels in the network Theorem 1 can be usedto predict eventual factions that will emerge by calculat-ing the eigenvector associated with the largest eigenvalueof the friendliness matrix Figure 2 shows the factions pre-dicted by the model over time The faction containing theUnited States is blue and the opposing faction is red
An interesting question in this context is how couldvarious countries in the network adjust their friendlinessbilaterally so that the model predicts global harmony (ieall countries converge to a single faction) Also whichcountries require the smallest perturbation to their bilat-eral relationships to achieve this These question can beanswered in our framework by fixing the desired struc-turally balanced state vlowast to have entries with the same signand computing the Structural Balance Influence Index foreach country Figure 3 shows how the Structural BalanceInfluence Index for each country evolves over time We seethat the United States is the most influential agent in thenetwork according to this model due to the relative size
Fig 3 (Colour on-line) Magnitude of influence required toachieve global harmony (all agents converge to a single faction)over time The combination of large GDP and position in thenetwork makes the United States the most influential agentusing this model We also see a global increase in the abilityto achieve global harmony over the last 8 years
of its GDP and to its position in the network From 1946to 1990 the USSRRussia required the largest change inits bilateral relationships to achieve global harmony andcould be viewed as the economic leader of the faction op-posing the United States In 1990 this role was takenover by China It is also interesting to note that there
18001-p5
Tyler H Summers and Iman Shames
has been a global increase in the ability of any countryto achieve global harmony over the last eight years of thedata reflecting increasing disagreement in United Nationsvoting
Conclusions ndash We have considered active influence ina dynamic model of structural balance in social networkswith both positive and negative links We showed that anysingle agent can locally perturb the state of the network toachieve any desired structurally balanced state from anyinitial state We also showed how to optimize the requiredinfluence the magnitude of the required influence defines anetwork centrality measure in the context of signed graphsand structural balance The results were illustrated andinterpreted in an international-relations network based onUnited Nations voting data from 1946 to 2008 The modeland our results give an interesting lens through which onecan view the voting data
There are a variety of potential extensions for futureresearch One could consider extending the results tographs that are not complete or to directed graphs inwhich friendship levels are not necessarily mutual Onecould also consider models that allow the emergence ofmore than two factions these types of models are stud-ied in [8] Another interesting direction would be to con-sider multiple agents having active influence resulting in agame theoretic formulation In an international-relationscontext the analysis of a game between two superpowerswould be particularly interesting Finally one could ex-plore interpretations of the results here in signed graphsarising in other contexts such as data clustering or geneticregulatory networks
REFERENCES
[1] Easley D and Kleinberg J Networks Crowds andMarkets (Cambridge University Press) 2010
[2] Leskovec J Huttenlocher D and Kleinberg JPredicting positive and negative links in online social net-works in Proceedings of the 19th International Conferenceon World Wide Web (ACM) 2010 pp 641ndash650
[3] Leskovec J Huttenlocher D and Kleinberg JSigned networks in social media in Proceedings of the 28thInternational Conference on Human Factors in Comput-ing Systems (ACM) 2010 pp 1361ndash1370
[4] Heider F J Psychol 21 (1946) 107[5] Cartwright D and Harary F Psychol Rev 63
(1956) 277[6] Axelrod R M and Bennett D S A Landscape The-
ory of Aggregation (Cambridge University Press) 1991[7] Antal T Krapivsky P L and Redner S Phys Rev
E 72 (2005) 036121[8] Krawczyk M J Comput Phys Commun 181 (2010)
1702[9] Kulakowski K Gawronski P and Gronek P Int
J Mod Phys C 16 (2005) 707[10] Marvel S A Kleinberg J Kleinberg R D and
Strogatz S H Proc Natl Acad Sci USA 108(2011) 1771
[11] Marvel S A Strogatz S H and Kleinberg J MPhys Rev Lett 103 (2009) 198701
[12] Weyl H Math Ann 71 (1912) 441[13] Strezhnev Anton and Voeten Erik 2013-02 United
Nations General Assembly Voting Data httphdl
handlenet1902112379 UNF5NpHV5DXWPNWMWOrLGTj
QYA== Erik Voeten [Distributor] V5 [Version][14] Gartzke E and Jo D J The Affinity of Nations Index
1946ndash2002 (Columbia University New York NY) 2006
18001-p6
Tyler H Summers and Iman Shames
Cartwright and Harary [5] who model the network as acomplete signed graph in which the n vertices representagents and a complete signed edge set represents relation-ships amongst all agents in the network with positive andnegative signs associated with friendly and hostile rela-tionships respectively They showed that n-agent struc-turally balanced networks are precisely those that can bepartitioned into two factions such that within each fac-tion all relationships are friendly and between factions allrelationships are hostile The theory has found variousapplications eg in models of international relations [6]but has remained static focusing mostly on networkstructure
Dynamic models for structural balance are quite recentand provide a new and interesting perspective [7ndash10] Ifa network is in an initial state that is not structurallybalanced how might the state of the network evolve to-ward a structurally balanced state and what will the even-tual balanced state be Discrete dynamical models inwhich a relationship is either positive or negative havebeen proposed in [7] and [11] In these models the sys-tem evolves by flipping the sign on certain edges to in-crease the number structurally balanced triangles in thenetwork However these models suffer from the existenceof so-called ldquojammed statesrdquo in which the system becomesstuck in a structurally unbalanced local minimum Morerecently Kulakowski et al [9] and Marvel et al [10] haveproposed and analyzed a continuous dynamical model inwhich a real-valued ldquofriendliness levelrdquo is associated witheach relationship (positive values indicate friendliness andnegative values indicate hostility) In this model Marvelet al [10] show that for generic initial conditions the sys-tem converges to a structurally balanced state in finitetime Further a closed-form expression for the balancedstate is derived in terms of the initial state
In this paper we study active external influence in adynamic model of structural balance In particular wesuppose that a single agent can influence the state of thenetwork by perturbing its own friendliness levels in aninternational-relations context this might be the result ofcertain foreign policy actions We show that it is possi-ble for any single agent to achieve any desired structurallybalanced state given any initial state We also present amethod to compute and optimize the influence that is re-quired to achieve the desired state The magnitude of therequired input defines a new dynamic network centralitymeasure for signed graphs in the context of structural bal-ance assigning a relative ldquoinfluencerdquo value to each agentin the network in terms of its ability to achieve a desiredstructurally balanced state with a low-magnitude pertur-bation An agent who can achieve a desired state with aperturbation of smaller magnitude is more influential thanagents who require larger perturbations We illustrate theresults to structural balance in an international-relationsnetwork using data from United Nations General Assem-bly voting records dating from 1946 to 2008 to estimatefriendliness levels amongst various countries Our results
provide an interesting lens through which one can viewthe data
The paper is organized as follows The second sectionreviews the model and basic results from [10] and [9] Thethird section presents our main results In the fourth sec-tion we illustrate our results to an international-relationscase study Finally concluding remarks and a future re-search outlook are provided in the fifth section
A continuous dynamical model for structuralbalance ndash In this section we review the continuous dy-namic model for structural balance proposed in [9] and [10]and a basic result from [10] Let xij denote the ldquofriend-liness levelrdquo between agents i and j We allow xii to benon-zero which can be interpreted as a ldquoself-confidencerdquoor ldquowillingness to compromiserdquo of node i (large positivevalue means high self-confidence or low willingness to com-promise large negative value means low self-confidence orhigh willingness to compromise) We assume that rela-tionships are symmetric ie xij = xji and collect thefriendliness levels in the network into a symmetric matrixX isin Rntimesn For any given X isin Rntimesn we associate a com-plete1 signed graph in which the edge signs correspond tothe signs of each element xij of X A signed graph iscalled structurally balanced if all triangles are balancedWe say that the network is in a structurally balanced stateif the corresponding complete signed graph is structurallybalanced
The dynamic model proposed in [9] and analyzed in [10]is given by the matrix differential equation
X(t) = X2(t) X(0) = X0 (1)
or equivalently element-wise by
xij(t) =sum
k
xik(t)xkj(t) (2)
Each term in (2) moves the associated triangle ijk towarda balanced configuration and for a given pair ij the sum-mation aggregates the effects across all relationships of iand j in the network This can be interpreted as a gossipprocess in which the friendliness level in a relationship ischanged based on opinions of mutual friends
One of the main results from [10] which is relevant forour study is the following
Theorem 1 (ref [10]) Suppose X0 is a random initialmatrix with entries sampled independently from an abso-lutely continuous distribution with bounded support Letλ1 ge middot middot middot ge λn and w1 wn be respectively the eigen-values and associated eigenvectors of X0 Then with prob-ability converging to 1 in the number of agents n we have
ndash λ1 gt 0
1In this paper we assume that each agent has (or develops) anopinion about every other agent which means that X is assumedto have no non-zero entries The theory of structural balance canbe extended to non-complete graphs see eg [1] We will considerthis in future work
18001-p2
Structural balance in social networks
0 002 004 006 008 01 012 014 016 018minus10
minus8
minus6
minus4
minus2
0
2
4
6
8
10
time
frie
ndsh
ip le
vels
Fig 1 (Colour on-line) Network friendliness trajectories for arandom initial friendliness matrix X0 The friendliness levelsldquoblow uprdquo to plus or minus infinity defining the two opposingfactions that emerge
ndash λ1 = λ2
ndash all components w1 are non-zero
As a consequence the network converges with finite escapetime tlowast = 1λ1 to a structurally balanced state with thesame sign pattern as the rank-one matrix w1w
T1 thus the
two factions are determined by the sign pattern of w1 E =k w1k gt 0 and R = k w1k lt 0
Theorem 1 states that the network converges to a struc-turally balanced state for almost all initial conditions Thedifferential equation (1) in fact has an analytical solutionwhich can be obtained by diagonalizing the initial-statematrix and analytically solving a scalar differential equa-tion of the same form The solution of (1) is given by
X(t) = X0(I minus X0t)minus1 (3)
which is valid for t lt 1λ1 if λ1 gt 0 This indicates thatthe system ldquoblows uprdquo with a finite escape time deter-mined by the largest eigenvalue λ1 of X0 the xij rsquos asso-ciated with each faction converge to either plus or minusinfinity However the system matrix normalized by theFrobenius norm viz XXF effectively collapses to arank-one matrix defined by the eigenvector associated withthe largest eigenvalue of X0 In the context of the applica-tions that we discuss later the implication of Theorem 1is that the sign pattern of the largest eigenvector gives aprediction of the eventual factions that emerge based onthe current state of the network An example trajectorywith n = 50 and the entries of X0 drawn from a uniformdistribution on [minus1 1] is shown in fig 1
Active influence in dynamic models of structuralbalance ndash In the previous section we saw that for thedynamic model (1) the system converges to a structurally
balanced state for generic initial conditions and that thisstate can be determined from an eigenvector of the initial-state matrix We now study active external influence inthis model We consider a situation in which a single agentcan instantaneously perturb its own friendliness levels Wewill show that any single agent can produce such a per-turbation to achieve any structurally balanced state fromany initial condition
Main result single-agent influence Our single-agentinfluence model means that given an initial state X0agent i can choose an symmetric perturbation ΔX0 whichhas entries equal to zero except for entries in the i-th rowand column that is added to the initial state to producea new state X0 + ΔX0 from which the dynamics flow ac-cording to (1) We will prove the following main result
Theorem 2 Let X0 isin Rntimesn be any symmetric initial-state matrix and vlowast be a vector with a desired sign patternwhose entries are either 1 or minus1 Then there exists asymmetric perturbation matrix ΔX0 computable from X0
and vlowast with entries equal to zero except for entries in theith row and column such that the eigenvector associatedwith the largest eigenvalue of X0 +ΔX0 has the same signpattern as vlowast
Before proving Theorem 2 we present the followinglemma on the eigenvalues of the structured perturbationΔX0
Lemma 1 A symmetric ΔX0 with all zero entries exceptthe entries of the i-th row and column has exactly twonon-zero eigenvalues with opposite signs
proof Without loss of generality assume i = 1 ThenΔX0 has the form
ΔX0 =
[δx1 δx
δx 0
]
where δx = [δx1 δx2 δxn] is the first column ofΔX0 and δx = [δx2 δxn] The eigenvalues of ΔX0
are the solutions of
det(μI minus ΔX0) = 0
det
[μ minus δx1 minusδx
minusδx minusμI
]= 0
(4)
Using the formula for block determinants detA = (a11 minusaT21A
minus122 a21) det A22 where A =
[a11 aT
21a21 A22
] (4) becomes
μnminus2(μ(μ minus δx1) minus δx
δx) = 0 (5)
Thus the eigenvalues are μ =δx1plusmn
q
δx21+4δx
δx
2 or μ = 0which proves the result
Proof of Theorem 2 Without loss of generality let i = 1We seek a perturbation ΔX0 such that
(X0 + ΔX0)vlowast = λlowastvlowast (6)
18001-p3
Tyler H Summers and Iman Shames
For a given X0 vlowast and λlowast this is a system of linearequations in ΔX0 which has the solution
δxlowast0 = V minus1(λlowastI minus X0)vlowast (7)
where
V minus1 =1vlowast1
⎡⎢⎢⎢⎣
1 minus vlowast2
vlowast1
minus vlowastn
vlowast1
1
1
⎤⎥⎥⎥⎦ (8)
It remains to be shown that λlowast and vlowast correspond to thelargest eigenvalue and eigenvector pair of X0 +ΔX0 Thiscan be done by taking λlowast ge λ1(X0) and using a basicspectral properties (called Weyl inequalities [12]) of thesum of two symmetric matrices In particular we have
λi(X + ΔX0) le λ1(X0) + λi(ΔX0) i = 1 n (9)
Taking i = 2 and noting that λ2(ΔX0) = 0 from Lemma 1we have λ2(X + ΔX0) le λ1(X0) and thus λlowast = λ1(X +ΔX0) ge λ1(X0) which proves the result
Optimizing the influence Equations (7) and (8) inthe proof of Theorem 2 give an explicit expression for theperturbation required to yield an eigenvector with a spec-ified sign pattern vlowast in terms of the initial-state matrixΔX0 and the largest eigenvalue of the perturbed matrixλlowast In real networks there is a cost associated perturbingthe state of the network and so we are interested in find-ing perturbations with small magnitude In particular wewould like to solve the following optimization problem
minimizeλlowastvlowast
δx0 = V minus1(λlowastI minus X0)vlowastsubject to λlowast ge λ1(X0)
(10)
where the entries of vlowast can be freely chosen up to thespecified sign pattern
Unfortunately this problem is not convex however wecan obtain an approximate solution as follows First notethat for fixed vlowast the objective is minimized when λlowast =λ1(X0) since the objective is monotone increasing in λlowastNext we can obtain an upper bound for the solution andchoose vlowast to minimize the upper bound Let αi = vlowast
i
vlowast1
α = [α2 αn]T L = λlowastI minus X0 L1 be the first columnof L and L be the principal submatrix of L obtained byremoving the first row and column of L Without lossof generality let vlowast
1 be positive An upper bound for theobjective is
δx0 = V minus1(λlowastI minus X0)vlowast =∥∥∥∥L1 +
[minusαT Lα
Lα
] ∥∥∥∥le L1 +
∥∥∥∥[minusαT Lα
Lα
] ∥∥∥∥ (11)
The upper bound in (11) is minimized when α = 0and this in turn is obtained asymptotically as vlowast
1 be-comes much larger than vlowast
i for i = 2 n Thus takingλlowast = λ1(X0) vlowast
1 = 1 (without loss of generality) and vlowasti
small but with the prescribed sign yields a feasible pertur-bation with small norm
A network centrality measure for signed graphs Net-work centrality measures are real-valued functions thatassign a relative ldquoimportancerdquo to each vertex within thegraph Examples include degree betweenness closenessand eigenvector centrality among others The meaning ofcentrality or importance and the relevance of various met-rics depend highly on the modeling context For examplePageRank a variant of eigenvector centrality turns outto be a much better indicator of importance than vertexdegree in the context of networks of web pages one of thekey factors leading to Googlersquos domination of web search
In the context of signed graphs and structural balancethe magnitude of the input required to achieve a desiredstructurally balanced state as described in the previoussection defines a class of network centrality measures Inparticular this input magnitude gives an importance orinfluence value for each agent that measures how easilyan agent can perturb the network into the desired struc-turally balanced state For a given desired state this mag-nitude can be used to rank the influence of all agents inthe network by computing the value for each agent andsorting the result the smallest magnitude corresponds tothe most influential agent The required input magnitudeand the ranking depend of course on the desired stateWe thus define the Structural Balance Influence Index forsigned graphs parameterized by the desired structurallybalanced state as follows
Definition 1 (Structural Balance Influence Index) Givena signed graph with n vertices and an associated symmet-ric friendliness matrix X isin Rntimesn let Xi be a permutationof X with row and column i moved to the first row andcolumn Let vlowast isin minus1 1n be a sign pattern vector thatdefines a desired structurally balanced state The Struc-tural Balance Influence Index of agent i given vlowast is thenorm of the input from agent i required to achieve vlowast
SBIIvlowast(i) = V minus1(λ1(Xi)I minus Xi)vlowast (12)
where V minus1 is given by (8) and vlowastT = vlowastT bull [1 ε ε]T with ε small and positive and bull denoting the Hadamard(element-wise) product
To the best of our knowledge this is the first such cen-trality measure defined in this context It would be inter-esting to study the distribution of this measure in randomand real-world networks
Illustrative example ndash In this section we interpretour results in an international-relations network We useUN General Assembly voting records and gross domesticproduct (GDP) history of 45 countries from 1946 to 2008to estimate friendliness and economic-importance levelsamongst the countries The UN voting records are ob-tained from [13] As a metric of friendliness levels we usean affinity index that has appeared in the international-relations literature which is computed for each year basedon how often nations vote together in the general assem-bly see [14] for details Finally we multiply the affinity
18001-p4
Structural balance in social networks
Fig 2 (Colour on-line) Predicted factions by year
index associated with each pair of countries with the cor-responding gross domestic products (GDPs) of the twocountries in order to capture the relative economic impor-tance of each relationship
We emphasize that the dynamic model (1) is not in-tended to be a detailed model for international relations(only UN voting record similarities and GDPs are ac-counted for) rather the example is used only to illustrateand interpret our results Given a current estimate of thefriendliness levels in the network Theorem 1 can be usedto predict eventual factions that will emerge by calculat-ing the eigenvector associated with the largest eigenvalueof the friendliness matrix Figure 2 shows the factions pre-dicted by the model over time The faction containing theUnited States is blue and the opposing faction is red
An interesting question in this context is how couldvarious countries in the network adjust their friendlinessbilaterally so that the model predicts global harmony (ieall countries converge to a single faction) Also whichcountries require the smallest perturbation to their bilat-eral relationships to achieve this These question can beanswered in our framework by fixing the desired struc-turally balanced state vlowast to have entries with the same signand computing the Structural Balance Influence Index foreach country Figure 3 shows how the Structural BalanceInfluence Index for each country evolves over time We seethat the United States is the most influential agent in thenetwork according to this model due to the relative size
Fig 3 (Colour on-line) Magnitude of influence required toachieve global harmony (all agents converge to a single faction)over time The combination of large GDP and position in thenetwork makes the United States the most influential agentusing this model We also see a global increase in the abilityto achieve global harmony over the last 8 years
of its GDP and to its position in the network From 1946to 1990 the USSRRussia required the largest change inits bilateral relationships to achieve global harmony andcould be viewed as the economic leader of the faction op-posing the United States In 1990 this role was takenover by China It is also interesting to note that there
18001-p5
Tyler H Summers and Iman Shames
has been a global increase in the ability of any countryto achieve global harmony over the last eight years of thedata reflecting increasing disagreement in United Nationsvoting
Conclusions ndash We have considered active influence ina dynamic model of structural balance in social networkswith both positive and negative links We showed that anysingle agent can locally perturb the state of the network toachieve any desired structurally balanced state from anyinitial state We also showed how to optimize the requiredinfluence the magnitude of the required influence defines anetwork centrality measure in the context of signed graphsand structural balance The results were illustrated andinterpreted in an international-relations network based onUnited Nations voting data from 1946 to 2008 The modeland our results give an interesting lens through which onecan view the voting data
There are a variety of potential extensions for futureresearch One could consider extending the results tographs that are not complete or to directed graphs inwhich friendship levels are not necessarily mutual Onecould also consider models that allow the emergence ofmore than two factions these types of models are stud-ied in [8] Another interesting direction would be to con-sider multiple agents having active influence resulting in agame theoretic formulation In an international-relationscontext the analysis of a game between two superpowerswould be particularly interesting Finally one could ex-plore interpretations of the results here in signed graphsarising in other contexts such as data clustering or geneticregulatory networks
REFERENCES
[1] Easley D and Kleinberg J Networks Crowds andMarkets (Cambridge University Press) 2010
[2] Leskovec J Huttenlocher D and Kleinberg JPredicting positive and negative links in online social net-works in Proceedings of the 19th International Conferenceon World Wide Web (ACM) 2010 pp 641ndash650
[3] Leskovec J Huttenlocher D and Kleinberg JSigned networks in social media in Proceedings of the 28thInternational Conference on Human Factors in Comput-ing Systems (ACM) 2010 pp 1361ndash1370
[4] Heider F J Psychol 21 (1946) 107[5] Cartwright D and Harary F Psychol Rev 63
(1956) 277[6] Axelrod R M and Bennett D S A Landscape The-
ory of Aggregation (Cambridge University Press) 1991[7] Antal T Krapivsky P L and Redner S Phys Rev
E 72 (2005) 036121[8] Krawczyk M J Comput Phys Commun 181 (2010)
1702[9] Kulakowski K Gawronski P and Gronek P Int
J Mod Phys C 16 (2005) 707[10] Marvel S A Kleinberg J Kleinberg R D and
Strogatz S H Proc Natl Acad Sci USA 108(2011) 1771
[11] Marvel S A Strogatz S H and Kleinberg J MPhys Rev Lett 103 (2009) 198701
[12] Weyl H Math Ann 71 (1912) 441[13] Strezhnev Anton and Voeten Erik 2013-02 United
Nations General Assembly Voting Data httphdl
handlenet1902112379 UNF5NpHV5DXWPNWMWOrLGTj
QYA== Erik Voeten [Distributor] V5 [Version][14] Gartzke E and Jo D J The Affinity of Nations Index
1946ndash2002 (Columbia University New York NY) 2006
18001-p6
Structural balance in social networks
0 002 004 006 008 01 012 014 016 018minus10
minus8
minus6
minus4
minus2
0
2
4
6
8
10
time
frie
ndsh
ip le
vels
Fig 1 (Colour on-line) Network friendliness trajectories for arandom initial friendliness matrix X0 The friendliness levelsldquoblow uprdquo to plus or minus infinity defining the two opposingfactions that emerge
ndash λ1 = λ2
ndash all components w1 are non-zero
As a consequence the network converges with finite escapetime tlowast = 1λ1 to a structurally balanced state with thesame sign pattern as the rank-one matrix w1w
T1 thus the
two factions are determined by the sign pattern of w1 E =k w1k gt 0 and R = k w1k lt 0
Theorem 1 states that the network converges to a struc-turally balanced state for almost all initial conditions Thedifferential equation (1) in fact has an analytical solutionwhich can be obtained by diagonalizing the initial-statematrix and analytically solving a scalar differential equa-tion of the same form The solution of (1) is given by
X(t) = X0(I minus X0t)minus1 (3)
which is valid for t lt 1λ1 if λ1 gt 0 This indicates thatthe system ldquoblows uprdquo with a finite escape time deter-mined by the largest eigenvalue λ1 of X0 the xij rsquos asso-ciated with each faction converge to either plus or minusinfinity However the system matrix normalized by theFrobenius norm viz XXF effectively collapses to arank-one matrix defined by the eigenvector associated withthe largest eigenvalue of X0 In the context of the applica-tions that we discuss later the implication of Theorem 1is that the sign pattern of the largest eigenvector gives aprediction of the eventual factions that emerge based onthe current state of the network An example trajectorywith n = 50 and the entries of X0 drawn from a uniformdistribution on [minus1 1] is shown in fig 1
Active influence in dynamic models of structuralbalance ndash In the previous section we saw that for thedynamic model (1) the system converges to a structurally
balanced state for generic initial conditions and that thisstate can be determined from an eigenvector of the initial-state matrix We now study active external influence inthis model We consider a situation in which a single agentcan instantaneously perturb its own friendliness levels Wewill show that any single agent can produce such a per-turbation to achieve any structurally balanced state fromany initial condition
Main result single-agent influence Our single-agentinfluence model means that given an initial state X0agent i can choose an symmetric perturbation ΔX0 whichhas entries equal to zero except for entries in the i-th rowand column that is added to the initial state to producea new state X0 + ΔX0 from which the dynamics flow ac-cording to (1) We will prove the following main result
Theorem 2 Let X0 isin Rntimesn be any symmetric initial-state matrix and vlowast be a vector with a desired sign patternwhose entries are either 1 or minus1 Then there exists asymmetric perturbation matrix ΔX0 computable from X0
and vlowast with entries equal to zero except for entries in theith row and column such that the eigenvector associatedwith the largest eigenvalue of X0 +ΔX0 has the same signpattern as vlowast
Before proving Theorem 2 we present the followinglemma on the eigenvalues of the structured perturbationΔX0
Lemma 1 A symmetric ΔX0 with all zero entries exceptthe entries of the i-th row and column has exactly twonon-zero eigenvalues with opposite signs
proof Without loss of generality assume i = 1 ThenΔX0 has the form
ΔX0 =
[δx1 δx
δx 0
]
where δx = [δx1 δx2 δxn] is the first column ofΔX0 and δx = [δx2 δxn] The eigenvalues of ΔX0
are the solutions of
det(μI minus ΔX0) = 0
det
[μ minus δx1 minusδx
minusδx minusμI
]= 0
(4)
Using the formula for block determinants detA = (a11 minusaT21A
minus122 a21) det A22 where A =
[a11 aT
21a21 A22
] (4) becomes
μnminus2(μ(μ minus δx1) minus δx
δx) = 0 (5)
Thus the eigenvalues are μ =δx1plusmn
q
δx21+4δx
δx
2 or μ = 0which proves the result
Proof of Theorem 2 Without loss of generality let i = 1We seek a perturbation ΔX0 such that
(X0 + ΔX0)vlowast = λlowastvlowast (6)
18001-p3
Tyler H Summers and Iman Shames
For a given X0 vlowast and λlowast this is a system of linearequations in ΔX0 which has the solution
δxlowast0 = V minus1(λlowastI minus X0)vlowast (7)
where
V minus1 =1vlowast1
⎡⎢⎢⎢⎣
1 minus vlowast2
vlowast1
minus vlowastn
vlowast1
1
1
⎤⎥⎥⎥⎦ (8)
It remains to be shown that λlowast and vlowast correspond to thelargest eigenvalue and eigenvector pair of X0 +ΔX0 Thiscan be done by taking λlowast ge λ1(X0) and using a basicspectral properties (called Weyl inequalities [12]) of thesum of two symmetric matrices In particular we have
λi(X + ΔX0) le λ1(X0) + λi(ΔX0) i = 1 n (9)
Taking i = 2 and noting that λ2(ΔX0) = 0 from Lemma 1we have λ2(X + ΔX0) le λ1(X0) and thus λlowast = λ1(X +ΔX0) ge λ1(X0) which proves the result
Optimizing the influence Equations (7) and (8) inthe proof of Theorem 2 give an explicit expression for theperturbation required to yield an eigenvector with a spec-ified sign pattern vlowast in terms of the initial-state matrixΔX0 and the largest eigenvalue of the perturbed matrixλlowast In real networks there is a cost associated perturbingthe state of the network and so we are interested in find-ing perturbations with small magnitude In particular wewould like to solve the following optimization problem
minimizeλlowastvlowast
δx0 = V minus1(λlowastI minus X0)vlowastsubject to λlowast ge λ1(X0)
(10)
where the entries of vlowast can be freely chosen up to thespecified sign pattern
Unfortunately this problem is not convex however wecan obtain an approximate solution as follows First notethat for fixed vlowast the objective is minimized when λlowast =λ1(X0) since the objective is monotone increasing in λlowastNext we can obtain an upper bound for the solution andchoose vlowast to minimize the upper bound Let αi = vlowast
i
vlowast1
α = [α2 αn]T L = λlowastI minus X0 L1 be the first columnof L and L be the principal submatrix of L obtained byremoving the first row and column of L Without lossof generality let vlowast
1 be positive An upper bound for theobjective is
δx0 = V minus1(λlowastI minus X0)vlowast =∥∥∥∥L1 +
[minusαT Lα
Lα
] ∥∥∥∥le L1 +
∥∥∥∥[minusαT Lα
Lα
] ∥∥∥∥ (11)
The upper bound in (11) is minimized when α = 0and this in turn is obtained asymptotically as vlowast
1 be-comes much larger than vlowast
i for i = 2 n Thus takingλlowast = λ1(X0) vlowast
1 = 1 (without loss of generality) and vlowasti
small but with the prescribed sign yields a feasible pertur-bation with small norm
A network centrality measure for signed graphs Net-work centrality measures are real-valued functions thatassign a relative ldquoimportancerdquo to each vertex within thegraph Examples include degree betweenness closenessand eigenvector centrality among others The meaning ofcentrality or importance and the relevance of various met-rics depend highly on the modeling context For examplePageRank a variant of eigenvector centrality turns outto be a much better indicator of importance than vertexdegree in the context of networks of web pages one of thekey factors leading to Googlersquos domination of web search
In the context of signed graphs and structural balancethe magnitude of the input required to achieve a desiredstructurally balanced state as described in the previoussection defines a class of network centrality measures Inparticular this input magnitude gives an importance orinfluence value for each agent that measures how easilyan agent can perturb the network into the desired struc-turally balanced state For a given desired state this mag-nitude can be used to rank the influence of all agents inthe network by computing the value for each agent andsorting the result the smallest magnitude corresponds tothe most influential agent The required input magnitudeand the ranking depend of course on the desired stateWe thus define the Structural Balance Influence Index forsigned graphs parameterized by the desired structurallybalanced state as follows
Definition 1 (Structural Balance Influence Index) Givena signed graph with n vertices and an associated symmet-ric friendliness matrix X isin Rntimesn let Xi be a permutationof X with row and column i moved to the first row andcolumn Let vlowast isin minus1 1n be a sign pattern vector thatdefines a desired structurally balanced state The Struc-tural Balance Influence Index of agent i given vlowast is thenorm of the input from agent i required to achieve vlowast
SBIIvlowast(i) = V minus1(λ1(Xi)I minus Xi)vlowast (12)
where V minus1 is given by (8) and vlowastT = vlowastT bull [1 ε ε]T with ε small and positive and bull denoting the Hadamard(element-wise) product
To the best of our knowledge this is the first such cen-trality measure defined in this context It would be inter-esting to study the distribution of this measure in randomand real-world networks
Illustrative example ndash In this section we interpretour results in an international-relations network We useUN General Assembly voting records and gross domesticproduct (GDP) history of 45 countries from 1946 to 2008to estimate friendliness and economic-importance levelsamongst the countries The UN voting records are ob-tained from [13] As a metric of friendliness levels we usean affinity index that has appeared in the international-relations literature which is computed for each year basedon how often nations vote together in the general assem-bly see [14] for details Finally we multiply the affinity
18001-p4
Structural balance in social networks
Fig 2 (Colour on-line) Predicted factions by year
index associated with each pair of countries with the cor-responding gross domestic products (GDPs) of the twocountries in order to capture the relative economic impor-tance of each relationship
We emphasize that the dynamic model (1) is not in-tended to be a detailed model for international relations(only UN voting record similarities and GDPs are ac-counted for) rather the example is used only to illustrateand interpret our results Given a current estimate of thefriendliness levels in the network Theorem 1 can be usedto predict eventual factions that will emerge by calculat-ing the eigenvector associated with the largest eigenvalueof the friendliness matrix Figure 2 shows the factions pre-dicted by the model over time The faction containing theUnited States is blue and the opposing faction is red
An interesting question in this context is how couldvarious countries in the network adjust their friendlinessbilaterally so that the model predicts global harmony (ieall countries converge to a single faction) Also whichcountries require the smallest perturbation to their bilat-eral relationships to achieve this These question can beanswered in our framework by fixing the desired struc-turally balanced state vlowast to have entries with the same signand computing the Structural Balance Influence Index foreach country Figure 3 shows how the Structural BalanceInfluence Index for each country evolves over time We seethat the United States is the most influential agent in thenetwork according to this model due to the relative size
Fig 3 (Colour on-line) Magnitude of influence required toachieve global harmony (all agents converge to a single faction)over time The combination of large GDP and position in thenetwork makes the United States the most influential agentusing this model We also see a global increase in the abilityto achieve global harmony over the last 8 years
of its GDP and to its position in the network From 1946to 1990 the USSRRussia required the largest change inits bilateral relationships to achieve global harmony andcould be viewed as the economic leader of the faction op-posing the United States In 1990 this role was takenover by China It is also interesting to note that there
18001-p5
Tyler H Summers and Iman Shames
has been a global increase in the ability of any countryto achieve global harmony over the last eight years of thedata reflecting increasing disagreement in United Nationsvoting
Conclusions ndash We have considered active influence ina dynamic model of structural balance in social networkswith both positive and negative links We showed that anysingle agent can locally perturb the state of the network toachieve any desired structurally balanced state from anyinitial state We also showed how to optimize the requiredinfluence the magnitude of the required influence defines anetwork centrality measure in the context of signed graphsand structural balance The results were illustrated andinterpreted in an international-relations network based onUnited Nations voting data from 1946 to 2008 The modeland our results give an interesting lens through which onecan view the voting data
There are a variety of potential extensions for futureresearch One could consider extending the results tographs that are not complete or to directed graphs inwhich friendship levels are not necessarily mutual Onecould also consider models that allow the emergence ofmore than two factions these types of models are stud-ied in [8] Another interesting direction would be to con-sider multiple agents having active influence resulting in agame theoretic formulation In an international-relationscontext the analysis of a game between two superpowerswould be particularly interesting Finally one could ex-plore interpretations of the results here in signed graphsarising in other contexts such as data clustering or geneticregulatory networks
REFERENCES
[1] Easley D and Kleinberg J Networks Crowds andMarkets (Cambridge University Press) 2010
[2] Leskovec J Huttenlocher D and Kleinberg JPredicting positive and negative links in online social net-works in Proceedings of the 19th International Conferenceon World Wide Web (ACM) 2010 pp 641ndash650
[3] Leskovec J Huttenlocher D and Kleinberg JSigned networks in social media in Proceedings of the 28thInternational Conference on Human Factors in Comput-ing Systems (ACM) 2010 pp 1361ndash1370
[4] Heider F J Psychol 21 (1946) 107[5] Cartwright D and Harary F Psychol Rev 63
(1956) 277[6] Axelrod R M and Bennett D S A Landscape The-
ory of Aggregation (Cambridge University Press) 1991[7] Antal T Krapivsky P L and Redner S Phys Rev
E 72 (2005) 036121[8] Krawczyk M J Comput Phys Commun 181 (2010)
1702[9] Kulakowski K Gawronski P and Gronek P Int
J Mod Phys C 16 (2005) 707[10] Marvel S A Kleinberg J Kleinberg R D and
Strogatz S H Proc Natl Acad Sci USA 108(2011) 1771
[11] Marvel S A Strogatz S H and Kleinberg J MPhys Rev Lett 103 (2009) 198701
[12] Weyl H Math Ann 71 (1912) 441[13] Strezhnev Anton and Voeten Erik 2013-02 United
Nations General Assembly Voting Data httphdl
handlenet1902112379 UNF5NpHV5DXWPNWMWOrLGTj
QYA== Erik Voeten [Distributor] V5 [Version][14] Gartzke E and Jo D J The Affinity of Nations Index
1946ndash2002 (Columbia University New York NY) 2006
18001-p6

Tyler H Summers and Iman Shames
For a given X0 vlowast and λlowast this is a system of linearequations in ΔX0 which has the solution
δxlowast0 = V minus1(λlowastI minus X0)vlowast (7)
where
V minus1 =1vlowast1
⎡⎢⎢⎢⎣
1 minus vlowast2
vlowast1
minus vlowastn
vlowast1
1
1
⎤⎥⎥⎥⎦ (8)
It remains to be shown that λlowast and vlowast correspond to thelargest eigenvalue and eigenvector pair of X0 +ΔX0 Thiscan be done by taking λlowast ge λ1(X0) and using a basicspectral properties (called Weyl inequalities [12]) of thesum of two symmetric matrices In particular we have
λi(X + ΔX0) le λ1(X0) + λi(ΔX0) i = 1 n (9)
Taking i = 2 and noting that λ2(ΔX0) = 0 from Lemma 1we have λ2(X + ΔX0) le λ1(X0) and thus λlowast = λ1(X +ΔX0) ge λ1(X0) which proves the result
Optimizing the influence Equations (7) and (8) inthe proof of Theorem 2 give an explicit expression for theperturbation required to yield an eigenvector with a spec-ified sign pattern vlowast in terms of the initial-state matrixΔX0 and the largest eigenvalue of the perturbed matrixλlowast In real networks there is a cost associated perturbingthe state of the network and so we are interested in find-ing perturbations with small magnitude In particular wewould like to solve the following optimization problem
minimizeλlowastvlowast
δx0 = V minus1(λlowastI minus X0)vlowastsubject to λlowast ge λ1(X0)
(10)
where the entries of vlowast can be freely chosen up to thespecified sign pattern
Unfortunately this problem is not convex however wecan obtain an approximate solution as follows First notethat for fixed vlowast the objective is minimized when λlowast =λ1(X0) since the objective is monotone increasing in λlowastNext we can obtain an upper bound for the solution andchoose vlowast to minimize the upper bound Let αi = vlowast
i
vlowast1
α = [α2 αn]T L = λlowastI minus X0 L1 be the first columnof L and L be the principal submatrix of L obtained byremoving the first row and column of L Without lossof generality let vlowast
1 be positive An upper bound for theobjective is
δx0 = V minus1(λlowastI minus X0)vlowast =∥∥∥∥L1 +
[minusαT Lα
Lα
] ∥∥∥∥le L1 +
∥∥∥∥[minusαT Lα
Lα
] ∥∥∥∥ (11)
The upper bound in (11) is minimized when α = 0and this in turn is obtained asymptotically as vlowast
1 be-comes much larger than vlowast
i for i = 2 n Thus takingλlowast = λ1(X0) vlowast
1 = 1 (without loss of generality) and vlowasti
small but with the prescribed sign yields a feasible pertur-bation with small norm
A network centrality measure for signed graphs Net-work centrality measures are real-valued functions thatassign a relative ldquoimportancerdquo to each vertex within thegraph Examples include degree betweenness closenessand eigenvector centrality among others The meaning ofcentrality or importance and the relevance of various met-rics depend highly on the modeling context For examplePageRank a variant of eigenvector centrality turns outto be a much better indicator of importance than vertexdegree in the context of networks of web pages one of thekey factors leading to Googlersquos domination of web search
In the context of signed graphs and structural balancethe magnitude of the input required to achieve a desiredstructurally balanced state as described in the previoussection defines a class of network centrality measures Inparticular this input magnitude gives an importance orinfluence value for each agent that measures how easilyan agent can perturb the network into the desired struc-turally balanced state For a given desired state this mag-nitude can be used to rank the influence of all agents inthe network by computing the value for each agent andsorting the result the smallest magnitude corresponds tothe most influential agent The required input magnitudeand the ranking depend of course on the desired stateWe thus define the Structural Balance Influence Index forsigned graphs parameterized by the desired structurallybalanced state as follows
Definition 1 (Structural Balance Influence Index) Givena signed graph with n vertices and an associated symmet-ric friendliness matrix X isin Rntimesn let Xi be a permutationof X with row and column i moved to the first row andcolumn Let vlowast isin minus1 1n be a sign pattern vector thatdefines a desired structurally balanced state The Struc-tural Balance Influence Index of agent i given vlowast is thenorm of the input from agent i required to achieve vlowast
SBIIvlowast(i) = V minus1(λ1(Xi)I minus Xi)vlowast (12)
where V minus1 is given by (8) and vlowastT = vlowastT bull [1 ε ε]T with ε small and positive and bull denoting the Hadamard(element-wise) product
To the best of our knowledge this is the first such cen-trality measure defined in this context It would be inter-esting to study the distribution of this measure in randomand real-world networks
Illustrative example ndash In this section we interpretour results in an international-relations network We useUN General Assembly voting records and gross domesticproduct (GDP) history of 45 countries from 1946 to 2008to estimate friendliness and economic-importance levelsamongst the countries The UN voting records are ob-tained from [13] As a metric of friendliness levels we usean affinity index that has appeared in the international-relations literature which is computed for each year basedon how often nations vote together in the general assem-bly see [14] for details Finally we multiply the affinity
18001-p4
Structural balance in social networks
Fig 2 (Colour on-line) Predicted factions by year
index associated with each pair of countries with the cor-responding gross domestic products (GDPs) of the twocountries in order to capture the relative economic impor-tance of each relationship
We emphasize that the dynamic model (1) is not in-tended to be a detailed model for international relations(only UN voting record similarities and GDPs are ac-counted for) rather the example is used only to illustrateand interpret our results Given a current estimate of thefriendliness levels in the network Theorem 1 can be usedto predict eventual factions that will emerge by calculat-ing the eigenvector associated with the largest eigenvalueof the friendliness matrix Figure 2 shows the factions pre-dicted by the model over time The faction containing theUnited States is blue and the opposing faction is red
An interesting question in this context is how couldvarious countries in the network adjust their friendlinessbilaterally so that the model predicts global harmony (ieall countries converge to a single faction) Also whichcountries require the smallest perturbation to their bilat-eral relationships to achieve this These question can beanswered in our framework by fixing the desired struc-turally balanced state vlowast to have entries with the same signand computing the Structural Balance Influence Index foreach country Figure 3 shows how the Structural BalanceInfluence Index for each country evolves over time We seethat the United States is the most influential agent in thenetwork according to this model due to the relative size
Fig 3 (Colour on-line) Magnitude of influence required toachieve global harmony (all agents converge to a single faction)over time The combination of large GDP and position in thenetwork makes the United States the most influential agentusing this model We also see a global increase in the abilityto achieve global harmony over the last 8 years
of its GDP and to its position in the network From 1946to 1990 the USSRRussia required the largest change inits bilateral relationships to achieve global harmony andcould be viewed as the economic leader of the faction op-posing the United States In 1990 this role was takenover by China It is also interesting to note that there
18001-p5
Tyler H Summers and Iman Shames
has been a global increase in the ability of any countryto achieve global harmony over the last eight years of thedata reflecting increasing disagreement in United Nationsvoting
Conclusions ndash We have considered active influence ina dynamic model of structural balance in social networkswith both positive and negative links We showed that anysingle agent can locally perturb the state of the network toachieve any desired structurally balanced state from anyinitial state We also showed how to optimize the requiredinfluence the magnitude of the required influence defines anetwork centrality measure in the context of signed graphsand structural balance The results were illustrated andinterpreted in an international-relations network based onUnited Nations voting data from 1946 to 2008 The modeland our results give an interesting lens through which onecan view the voting data
There are a variety of potential extensions for futureresearch One could consider extending the results tographs that are not complete or to directed graphs inwhich friendship levels are not necessarily mutual Onecould also consider models that allow the emergence ofmore than two factions these types of models are stud-ied in [8] Another interesting direction would be to con-sider multiple agents having active influence resulting in agame theoretic formulation In an international-relationscontext the analysis of a game between two superpowerswould be particularly interesting Finally one could ex-plore interpretations of the results here in signed graphsarising in other contexts such as data clustering or geneticregulatory networks
REFERENCES
[1] Easley D and Kleinberg J Networks Crowds andMarkets (Cambridge University Press) 2010
[2] Leskovec J Huttenlocher D and Kleinberg JPredicting positive and negative links in online social net-works in Proceedings of the 19th International Conferenceon World Wide Web (ACM) 2010 pp 641ndash650
[3] Leskovec J Huttenlocher D and Kleinberg JSigned networks in social media in Proceedings of the 28thInternational Conference on Human Factors in Comput-ing Systems (ACM) 2010 pp 1361ndash1370
[4] Heider F J Psychol 21 (1946) 107[5] Cartwright D and Harary F Psychol Rev 63
(1956) 277[6] Axelrod R M and Bennett D S A Landscape The-
ory of Aggregation (Cambridge University Press) 1991[7] Antal T Krapivsky P L and Redner S Phys Rev
E 72 (2005) 036121[8] Krawczyk M J Comput Phys Commun 181 (2010)
1702[9] Kulakowski K Gawronski P and Gronek P Int
J Mod Phys C 16 (2005) 707[10] Marvel S A Kleinberg J Kleinberg R D and
Strogatz S H Proc Natl Acad Sci USA 108(2011) 1771
[11] Marvel S A Strogatz S H and Kleinberg J MPhys Rev Lett 103 (2009) 198701
[12] Weyl H Math Ann 71 (1912) 441[13] Strezhnev Anton and Voeten Erik 2013-02 United
Nations General Assembly Voting Data httphdl
handlenet1902112379 UNF5NpHV5DXWPNWMWOrLGTj
QYA== Erik Voeten [Distributor] V5 [Version][14] Gartzke E and Jo D J The Affinity of Nations Index
1946ndash2002 (Columbia University New York NY) 2006
18001-p6
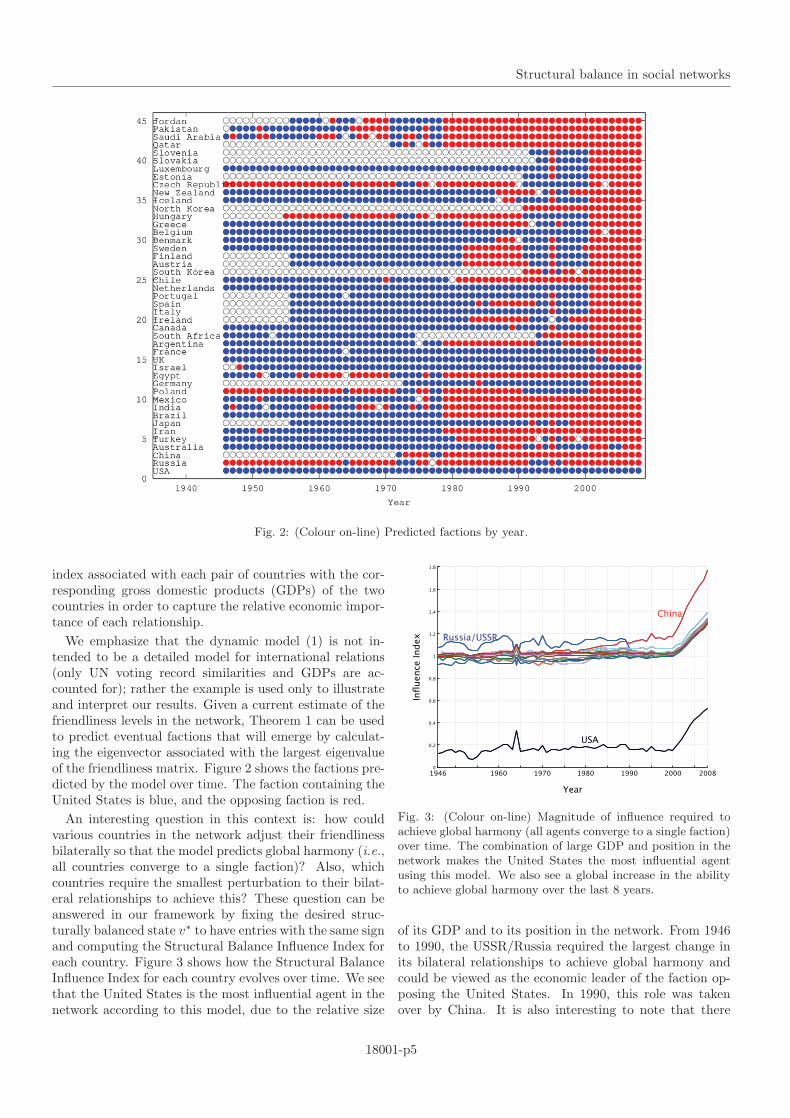
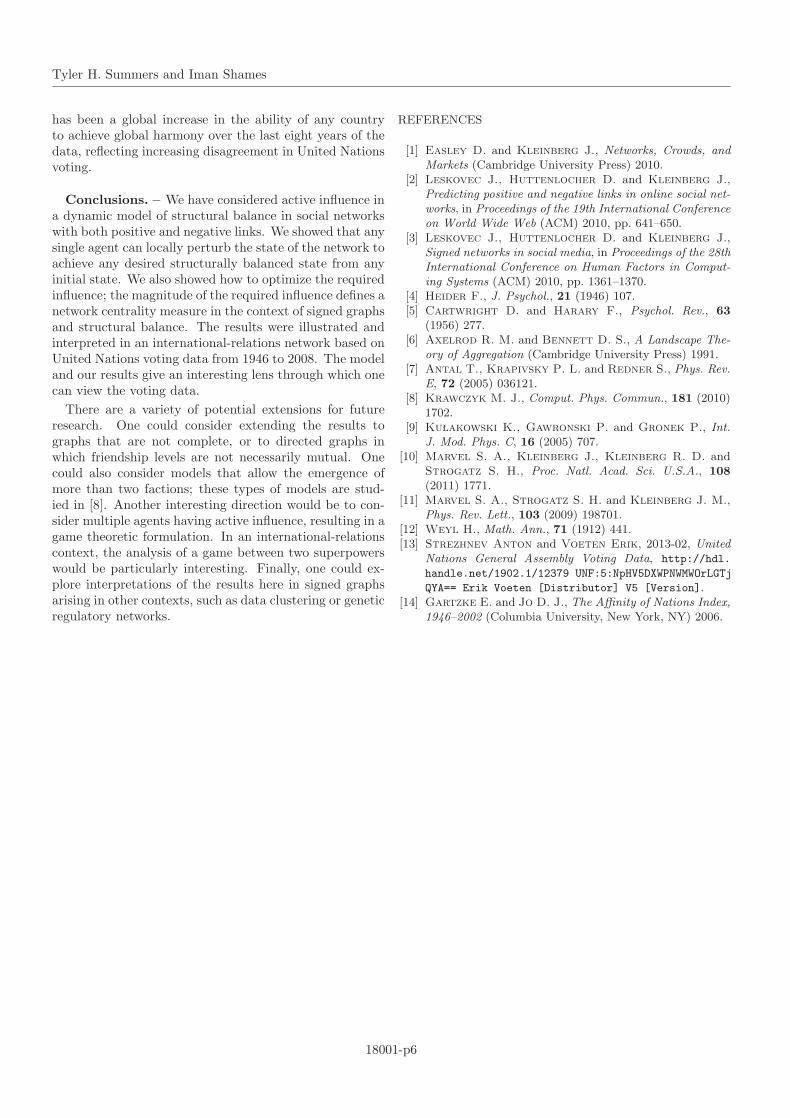