Embed Size (px)
Citation preview
sportengland.org
Published October 2020
Active Lives Adult SurveyMay 2019/20 Report
This report presents data from the Active Lives Adult Survey for the period mid-May 2019 to mid-May 2020. Data is presented for adults aged 16+ in England.
This report should be read in conjunction with our special Coronavirus (Covid-19) Report, which can be accessed here
Contents
Key information
This release: 22 October 2020
Next release: 29 April 2021
Release dates
For more information on the data presented in this report, please visit the Active Lives section of our website.
Find out more
Levels of activity
Types of activity
Outcomes
Local level data
Definitions
Notes
Welcome
Loneliness
2
04
13
15
21
22
23
03
19
WelcomeCovering the period from mid-May 2019 to mid-May 2020, thisreport provides an update on the sporting and physical activitybehaviours of adults in England.
The period covered includes the seven-weeks from the 23 Marchto mid-May when England was in full lockdown in response to thecoronavirus (Covid-19) pandemic. This caused unprecedenteddisruption to our lives and had an unprecedented impact on ourengagement in sport and physical activity.
In this report, we reveal that despite continued growth in the firstpart of the year, and many adults adapting how they got active,the disruption in the final two months wiped out those gains andresulted in a flat set of results for the year overall.
Such is the level of change caused by coronavirus, we’ve takenthe decision to publish two reports.
This main report will cover the 12 months with reference to thechanges in lockdown. This should be read in conjunction with thestandalone Coronavirus Report which specifically covers whatpeople were doing during the eight weeks from mid-March tomid-May.
Lisa O’Keefe Insight Director
3
Levels of activity
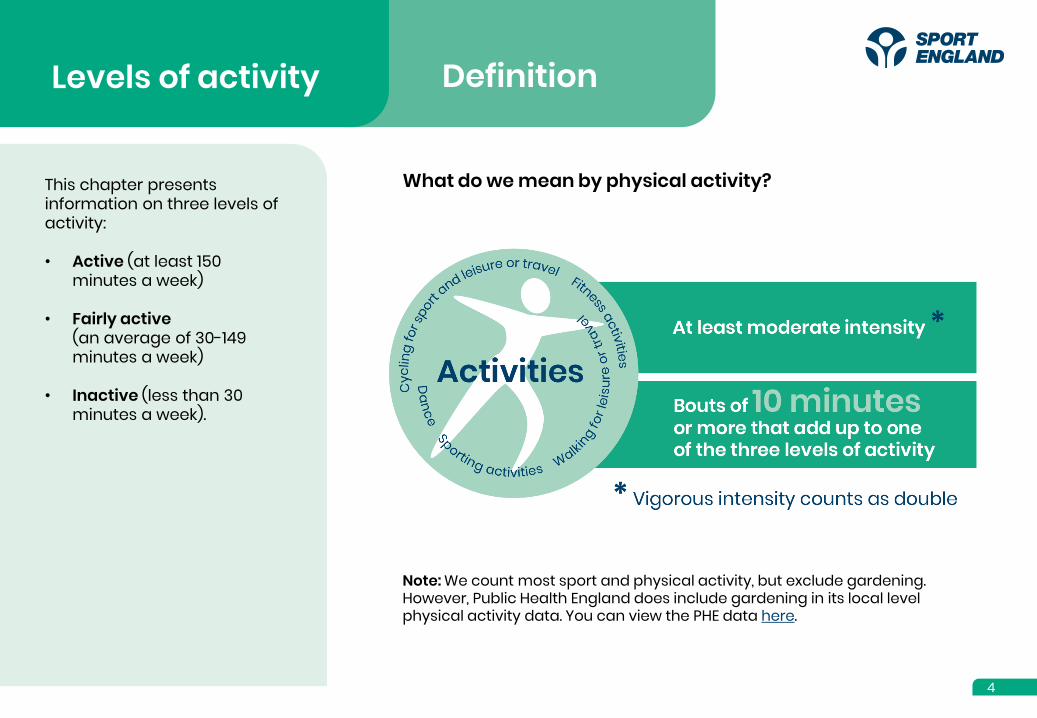
This chapter presents information on three levels of activity:
• Active (at least 150 minutes a week)
• Fairly active(an average of 30-149 minutes a week)
• Inactive (less than 30 minutes a week).
What do we mean by physical activity?
Note: We count most sport and physical activity, but exclude gardening. However, Public Health England does include gardening in its local level physical activity data. You can view the PHE data here.
Definition
4
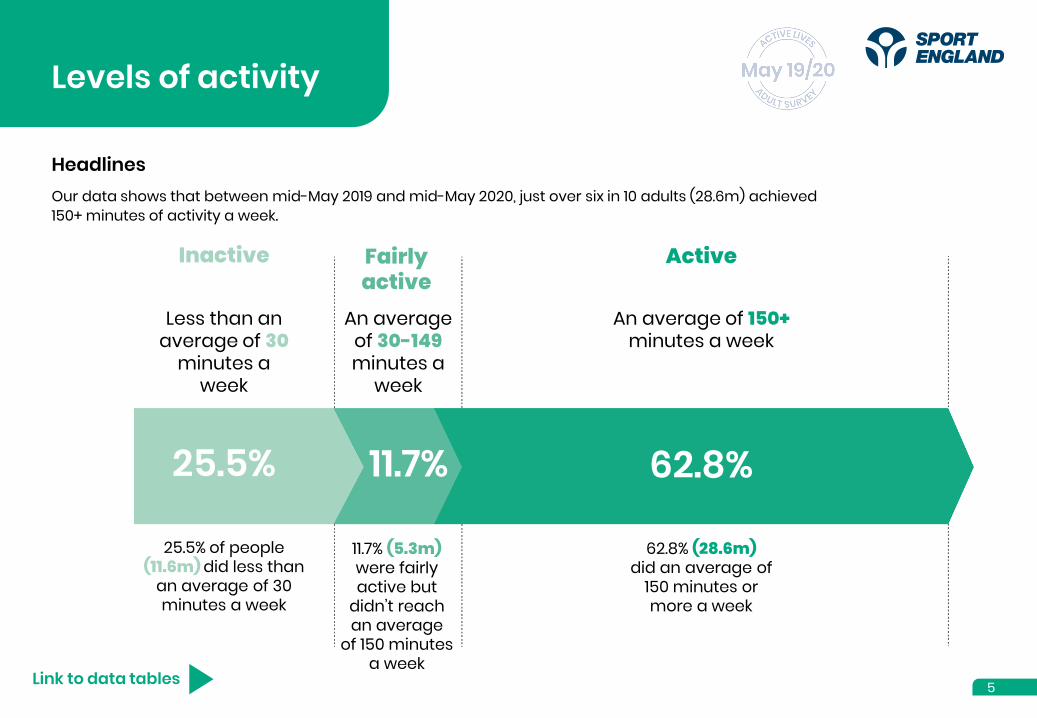
HeadlinesOur data shows that between mid-May 2019 and mid-May 2020, just over six in 10 adults (28.6m) achieved 150+ minutes of activity a week.
Link to data tables
Levels of activity
11.7% 62.8%25.5%
25.5% of people(11.6m) did less than
an average of 30minutes a week
11.7% (5.3m) were fairly active but
didn’t reachan average
of 150 minutesa week
62.8% (28.6m)did an average of
150 minutes ormore a week
Less than an average of 30
minutes a week
An average of 30-149minutes a
week
An average of 150+ minutes a week
ActiveInactive Fairly active
5
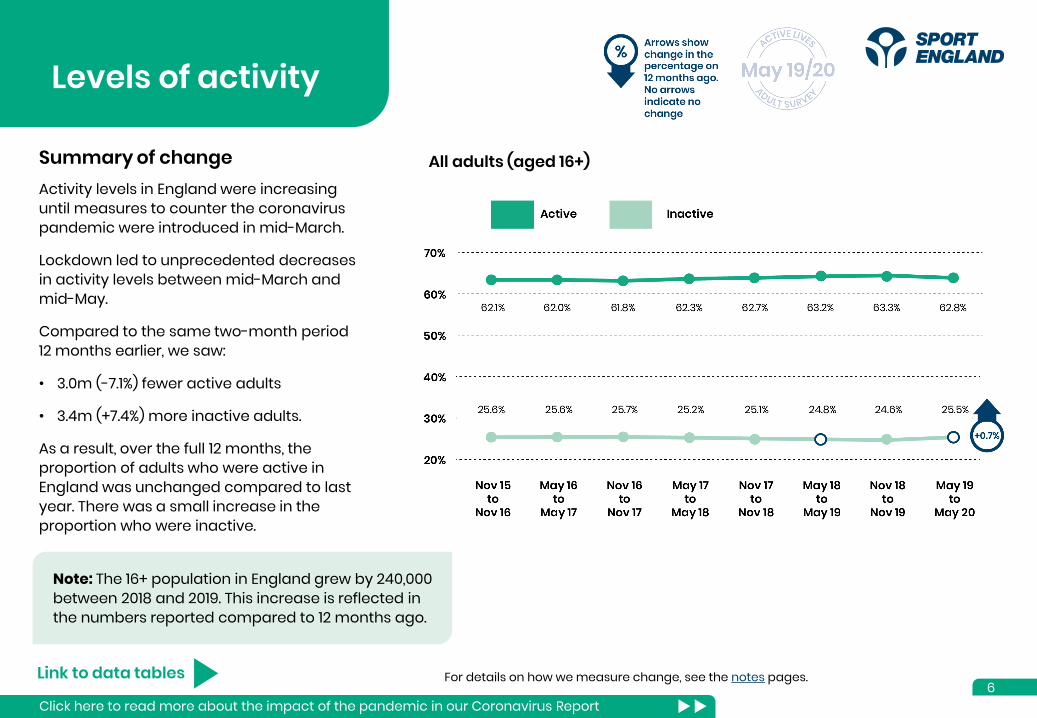
Summary of changeActivity levels in England were increasing until measures to counter the coronavirus pandemic were introduced in mid-March.
Lockdown led to unprecedented decreases in activity levels between mid-March and mid-May.
Compared to the same two-month period 12 months earlier, we saw:
• 3.0m (-7.1%) fewer active adults
• 3.4m (+7.4%) more inactive adults.
As a result, over the full 12 months, the proportion of adults who were active in England was unchanged compared to last year. There was a small increase in the proportion who were inactive.
Link to data tables For details on how we measure change, see the notes pages.
Levels of activity
All adults (aged 16+)
6
Note: The 16+ population in England grew by 240,000 between 2018 and 2019. This increase is reflected in the numbers reported compared to 12 months ago.
Click here to read more about the impact of the pandemic in our Coronavirus Report
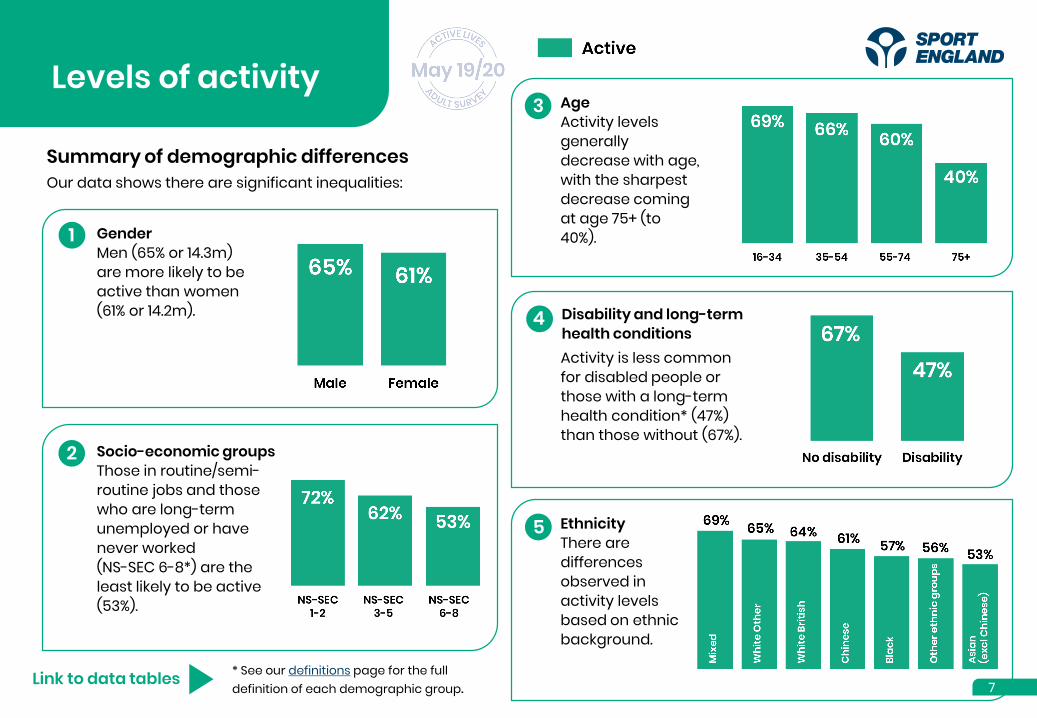
Our data shows there are significant inequalities:Summary of demographic differences
* See our definitions page for the full definition of each demographic group.
GenderMen (65% or 14.3m) are more likely to be active than women (61% or 14.2m).
1
Disability and long-termhealth conditions
Link to data tables
3
4
5
Socio-economic groupsThose in routine/semi-routine jobs and those who are long-term unemployed or have never worked(NS-SEC 6-8*) are the least likely to be active (53%).
AgeActivity levels generally decrease with age, with the sharpest decrease coming at age 75+ (to 40%).
Activity is less common for disabled people or those with a long-term health condition* (47%) than those without (67%).
EthnicityThere are differences observed in activity levels based on ethnic background.
Levels of activity
7
2
Gender
Link to data tables
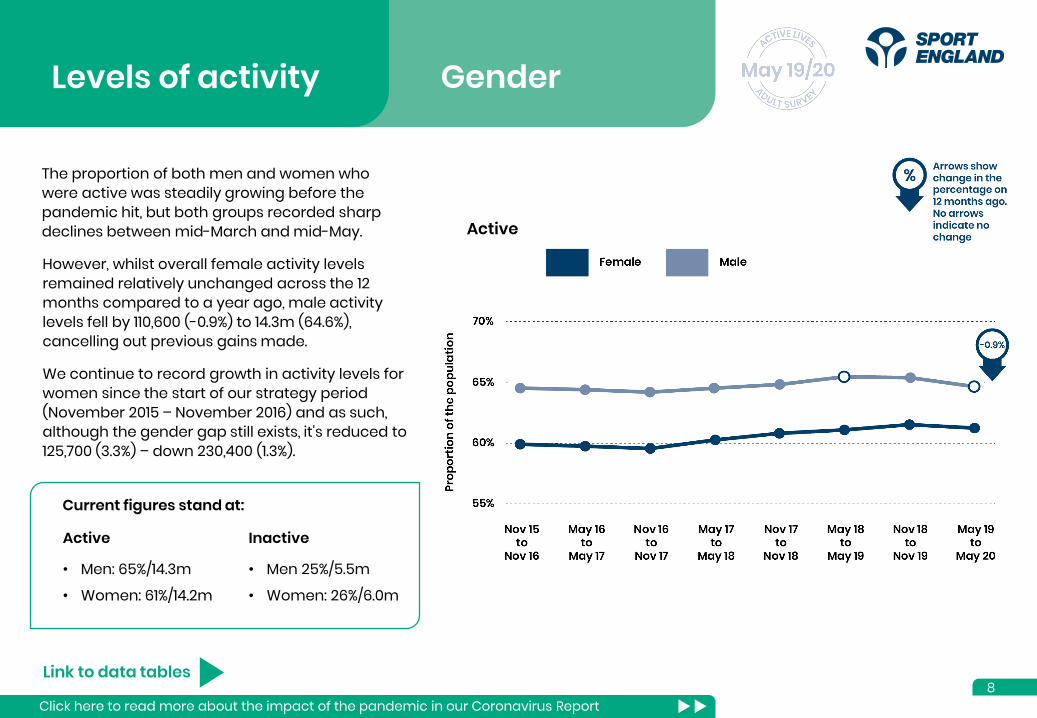
However, whilst overall female activity levels remained relatively unchanged across the 12 months compared to a year ago, male activity levels fell by 110,600 (-0.9%) to 14.3m (64.6%), cancelling out previous gains made.
We continue to record growth in activity levels for women since the start of our strategy period (November 2015 – November 2016) and as such, although the gender gap still exists, it's reduced to 125,700 (3.3%) – down 230,400 (1.3%).
Current figures stand at:
Active
• Men: 65%/14.3m
• Women: 61%/14.2m
Inactive
• Men 25%/5.5m
• Women: 26%/6.0m
Levels of activity
Active
8
The proportion of both men and women who were active was steadily growing before the pandemic hit, but both groups recorded sharp declines between mid-March and mid-May.
Click here to read more about the impact of the pandemic in our Coronavirus Report
Socio-economic groups
Link to data tables
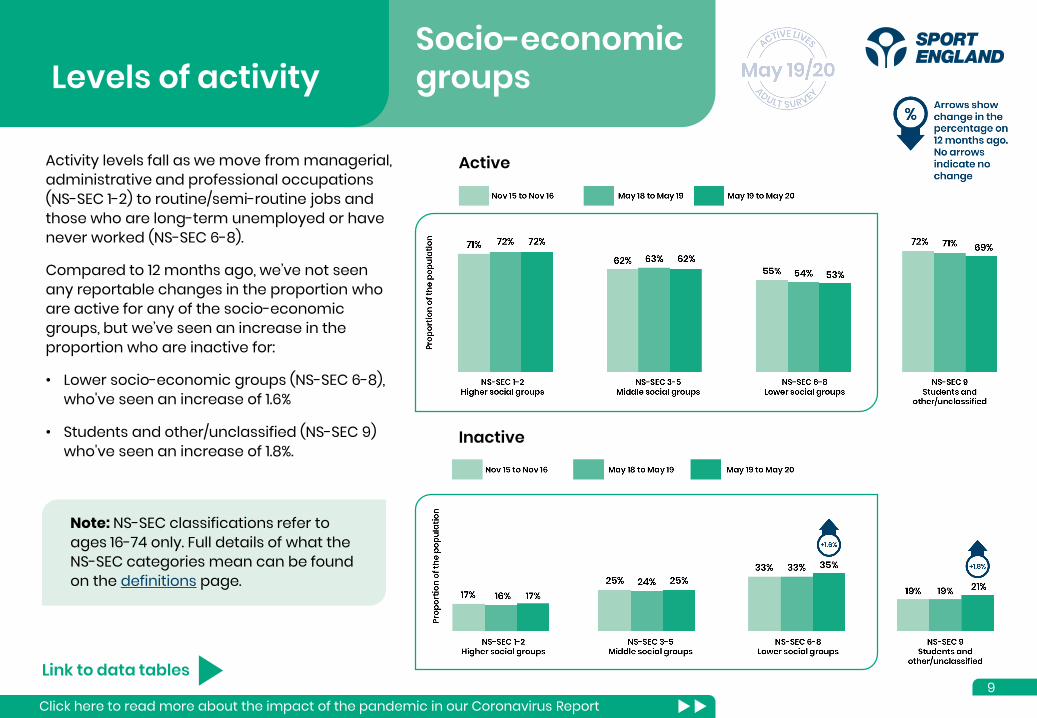
Activity levels fall as we move from managerial, administrative and professional occupations (NS-SEC 1-2) to routine/semi-routine jobs and those who are long-term unemployed or have never worked (NS-SEC 6-8).
Compared to 12 months ago, we’ve not seen any reportable changes in the proportion who are active for any of the socio-economicgroups, but we’ve seen an increase in the proportion who are inactive for:
• Lower socio-economic groups (NS-SEC 6-8), who've seen an increase of 1.6%
• Students and other/unclassified (NS-SEC 9) who've seen an increase of 1.8%.
Note: NS-SEC classifications refer to ages 16-74 only. Full details of what the NS-SEC categories mean can be found on the definitions page.
Levels of activity
9
Active
Inactive
Click here to read more about the impact of the pandemic in our Coronavirus Report
Age
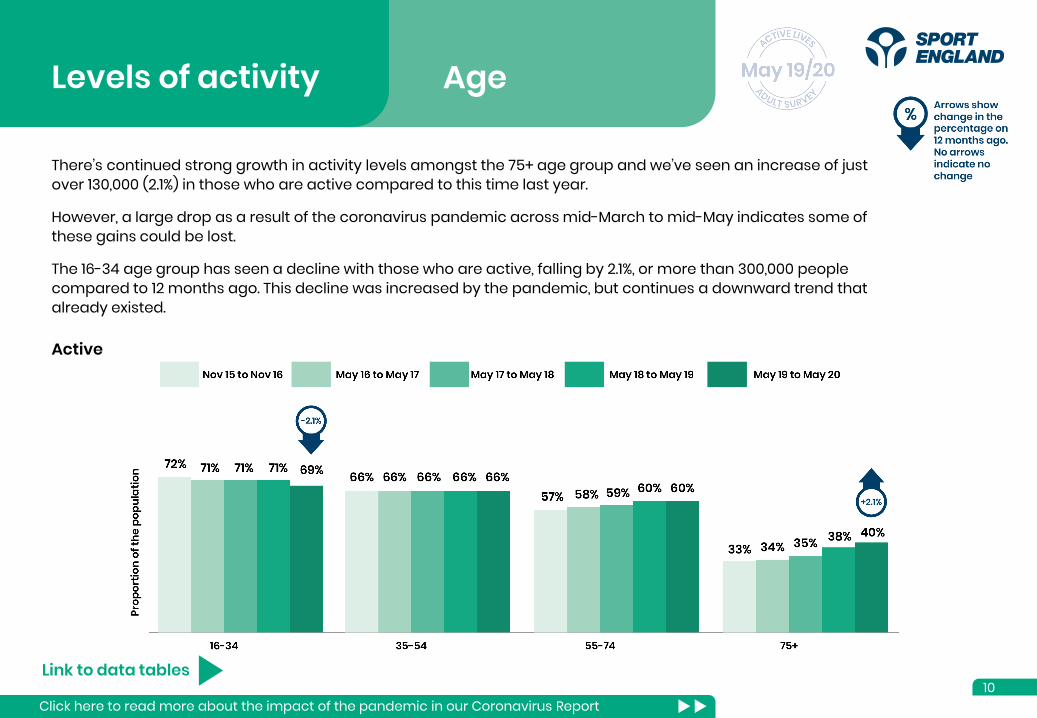
There’s continued strong growth in activity levels amongst the 75+ age group and we’ve seen an increase of just over 130,000 (2.1%) in those who are active compared to this time last year.
However, a large drop as a result of the coronavirus pandemic across mid-March to mid-May indicates some of these gains could be lost.
The 16-34 age group has seen a decline with those who are active, falling by 2.1%, or more than 300,000 people compared to 12 months ago. This decline was increased by the pandemic, but continues a downward trend that already existed.
Levels of activity
10
Active
Link to data tables
Click here to read more about the impact of the pandemic in our Coronavirus Report
Disability and long-term health conditions
Link to data tables
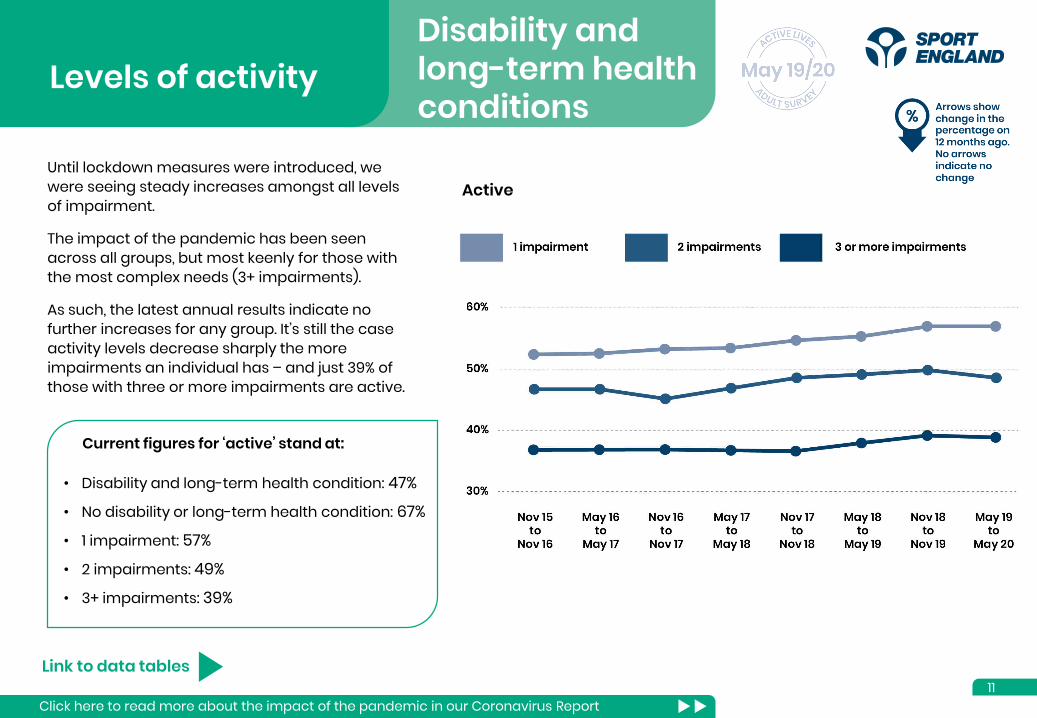
Until lockdown measures were introduced, we were seeing steady increases amongst all levels of impairment.
The impact of the pandemic has been seen across all groups, but most keenly for those with the most complex needs (3+ impairments).
As such, the latest annual results indicate no further increases for any group. It’s still the case activity levels decrease sharply the more impairments an individual has – and just 39% of those with three or more impairments are active.
Levels of activity
Active
11
Current figures for ‘active’ stand at:
• Disability and long-term health condition: 47%
• No disability or long-term health condition: 67%
• 1 impairment: 57%
• 2 impairments: 49%
• 3+ impairments: 39%
Click here to read more about the impact of the pandemic in our Coronavirus Report
Ethnicity
Link to data tables
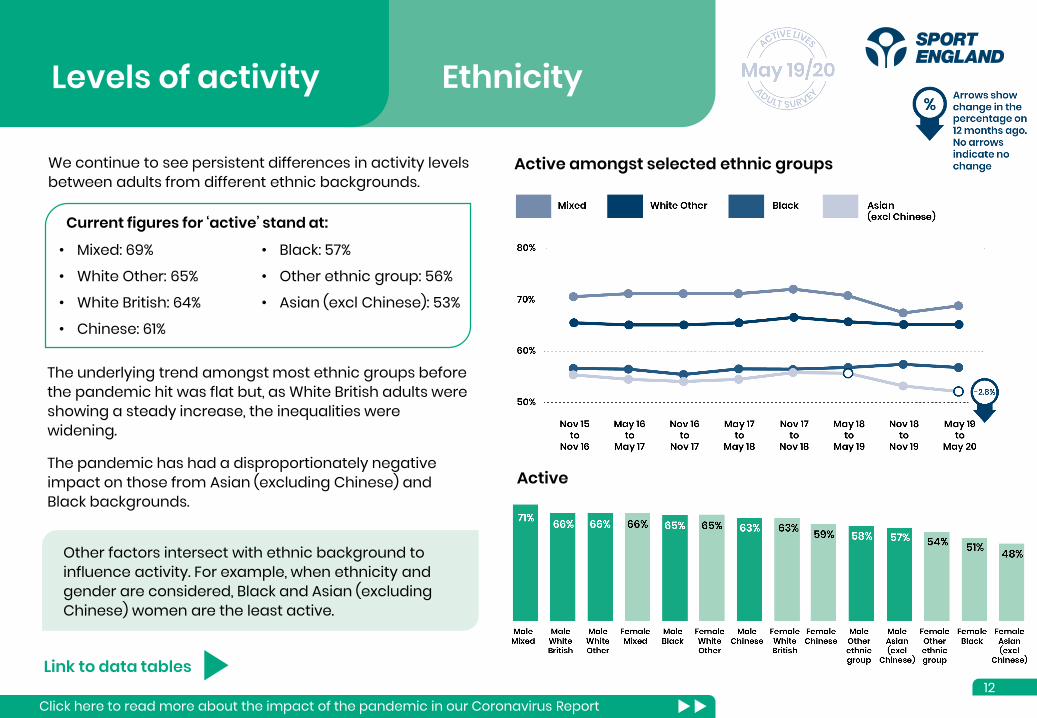
We continue to see persistent differences in activity levels between adults from different ethnic backgrounds.
Levels of activity
Active amongst selected ethnic groups
12
Active
Current figures for ‘active’ stand at:
• Mixed: 69%
• White Other: 65%
• White British: 64%
• Chinese: 61%
• Black: 57%
• Other ethnic group: 56%
• Asian (excl Chinese): 53%
The underlying trend amongst most ethnic groups before the pandemic hit was flat but, as White British adults were showing a steady increase, the inequalities were widening.
The pandemic has had a disproportionately negative impact on those from Asian (excluding Chinese) and Black backgrounds.
Other factors intersect with ethnic background to influence activity. For example, when ethnicity and gender are considered, Black and Asian (excluding Chinese) women are the least active.
Click here to read more about the impact of the pandemic in our Coronavirus Report
Types of activity Definition
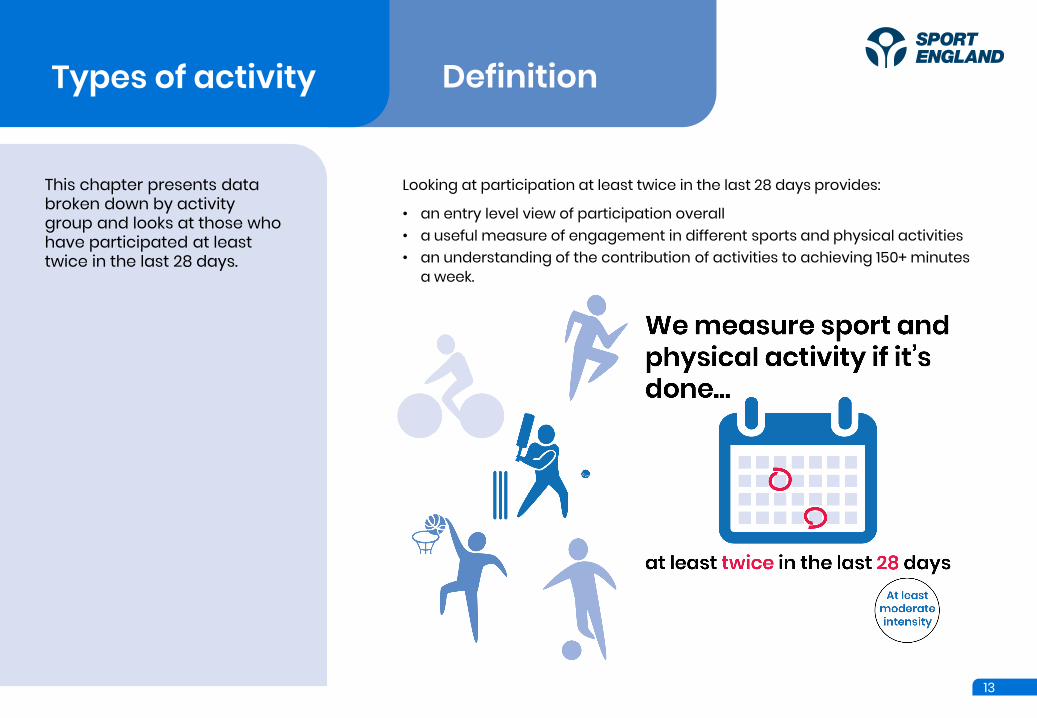
This chapter presents data broken down by activity group and looks at those who have participated at least twice in the last 28 days.
Looking at participation at least twice in the last 28 days provides:
• an entry level view of participation overall• a useful measure of engagement in different sports and physical activities• an understanding of the contribution of activities to achieving 150+ minutes
a week.
13
Types of activity Activity groups
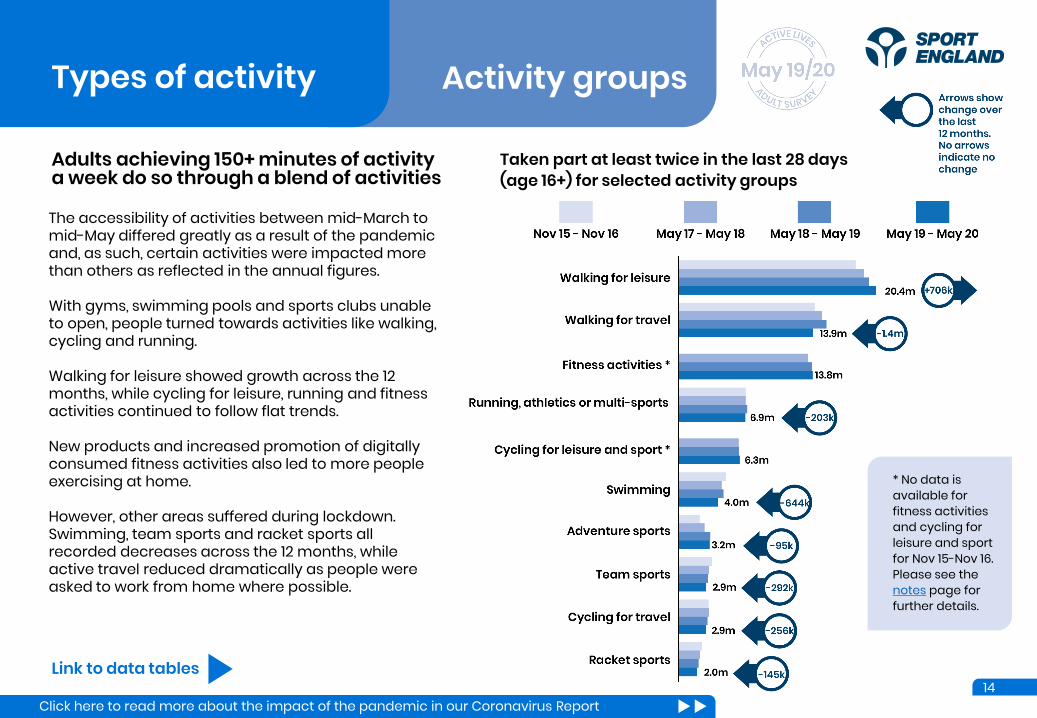
Adults achieving 150+ minutes of activity a week do so through a blend of activities
Link to data tables
The accessibility of activities between mid-March to mid-May differed greatly as a result of the pandemic and, as such, certain activities were impacted more than others as reflected in the annual figures.
With gyms, swimming pools and sports clubs unable to open, people turned towards activities like walking, cycling and running.
Walking for leisure showed growth across the 12 months, while cycling for leisure, running and fitness activities continued to follow flat trends.
New products and increased promotion of digitally consumed fitness activities also led to more people exercising at home.
However, other areas suffered during lockdown. Swimming, team sports and racket sports all recorded decreases across the 12 months, while active travel reduced dramatically as people were asked to work from home where possible.
14
Taken part at least twice in the last 28 days (age 16+) for selected activity groups
* No data is available for fitness activities and cycling for leisure and sport for Nov 15-Nov 16. Please see the notes page for further details.
Click here to read more about the impact of the pandemic in our Coronavirus Report
Mental wellbeing and individual & community development
Definition
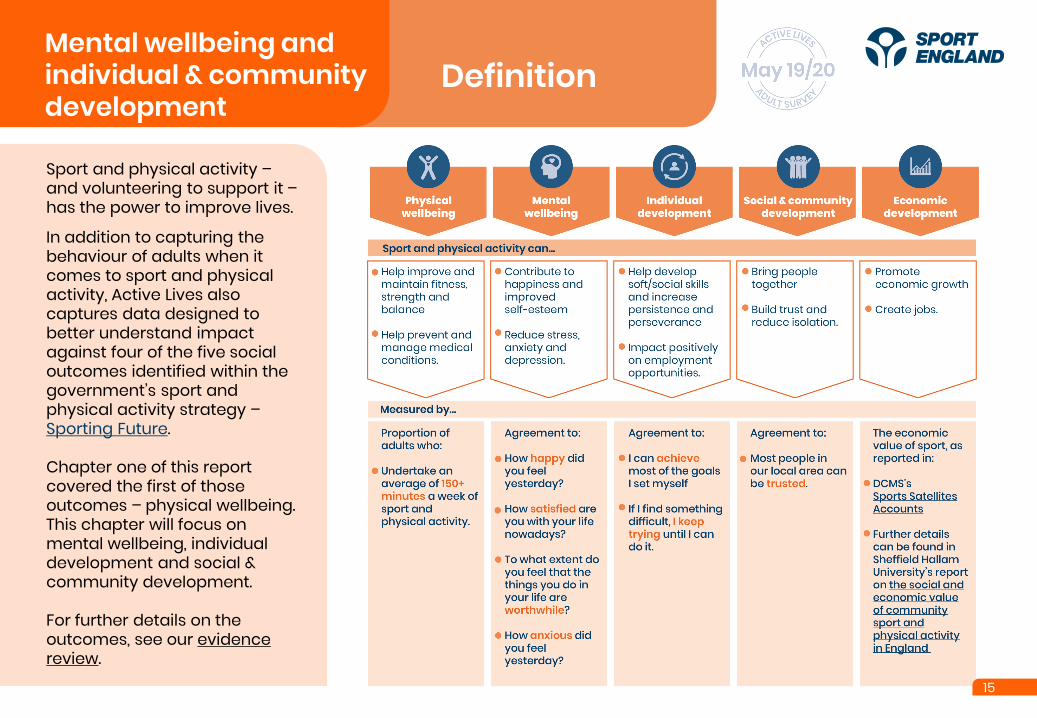
Sport and physical activity –and volunteering to support it –has the power to improve lives.
In addition to capturing the behaviour of adults when it comes to sport and physical activity, Active Lives also captures data designed to better understand impact against four of the five social outcomes identified within the government’s sport and physical activity strategy –Sporting Future.
Chapter one of this report covered the first of those outcomes – physical wellbeing. This chapter will focus on mental wellbeing, individual development and social & community development.
For further details on the outcomes, see our evidence review.
15
Mental wellbeing and individual & community development
Mental wellbeing
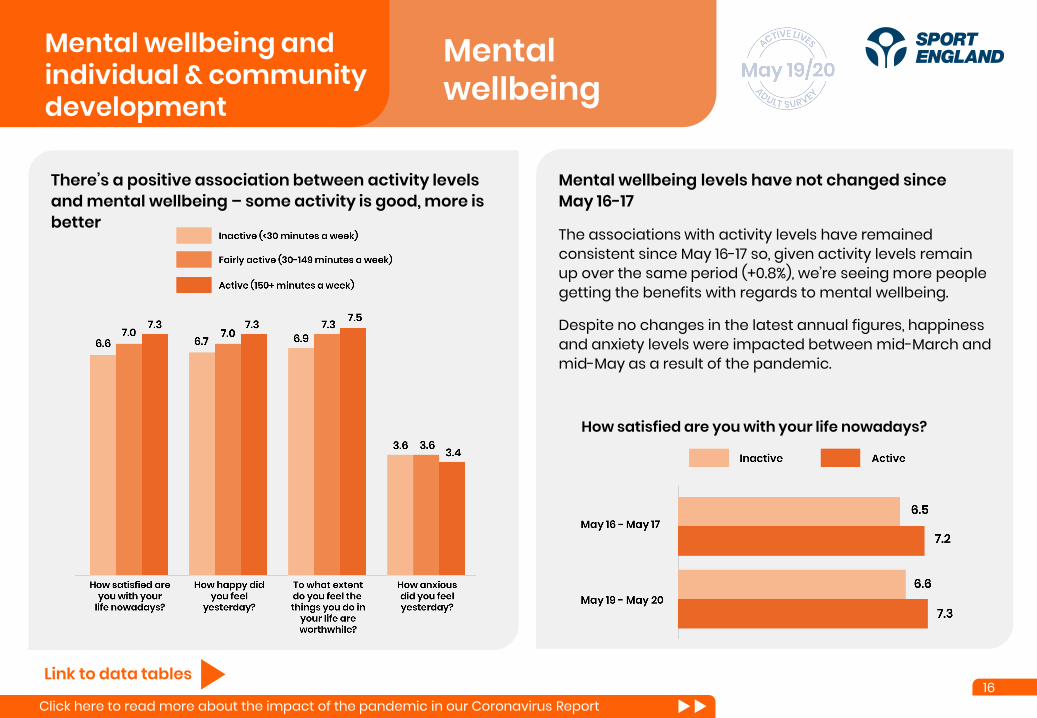
There’s a positive association between activity levels and mental wellbeing – some activity is good, more is better
Mental wellbeing levels have not changed sinceMay 16-17
The associations with activity levels have remained consistent since May 16-17 so, given activity levels remain up over the same period (+0.8%), we’re seeing more people getting the benefits with regards to mental wellbeing.
Despite no changes in the latest annual figures, happiness and anxiety levels were impacted between mid-March and mid-May as a result of the pandemic.
16Link to data tables
How satisfied are you with your life nowadays?
Click here to read more about the impact of the pandemic in our Coronavirus Report
Mental wellbeing and individual & community development
Individual development
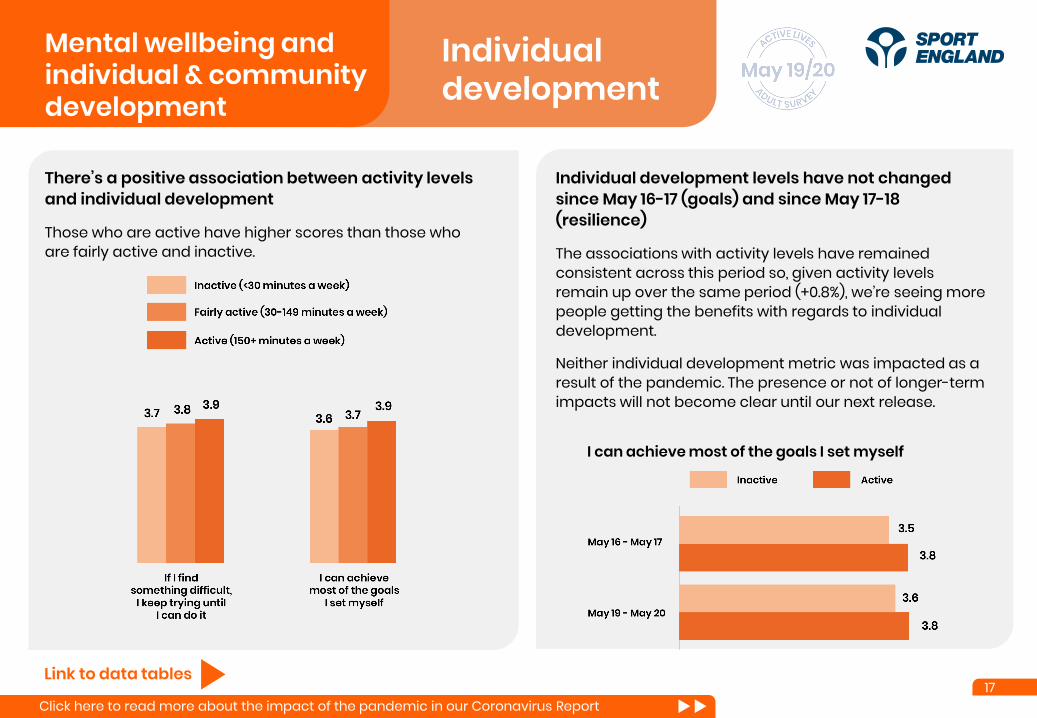
There’s a positive association between activity levels and individual development
Those who are active have higher scores than those who are fairly active and inactive.
17Link to data tables
Individual development levels have not changed since May 16-17 (goals) and since May 17-18 (resilience)
The associations with activity levels have remained consistent across this period so, given activity levels remain up over the same period (+0.8%), we’re seeing more people getting the benefits with regards to individual development.
Neither individual development metric was impacted as a result of the pandemic. The presence or not of longer-term impacts will not become clear until our next release.
I can achieve most of the goals I set myself
Click here to read more about the impact of the pandemic in our Coronavirus Report
Mental wellbeing and individual & community development
Social and community development
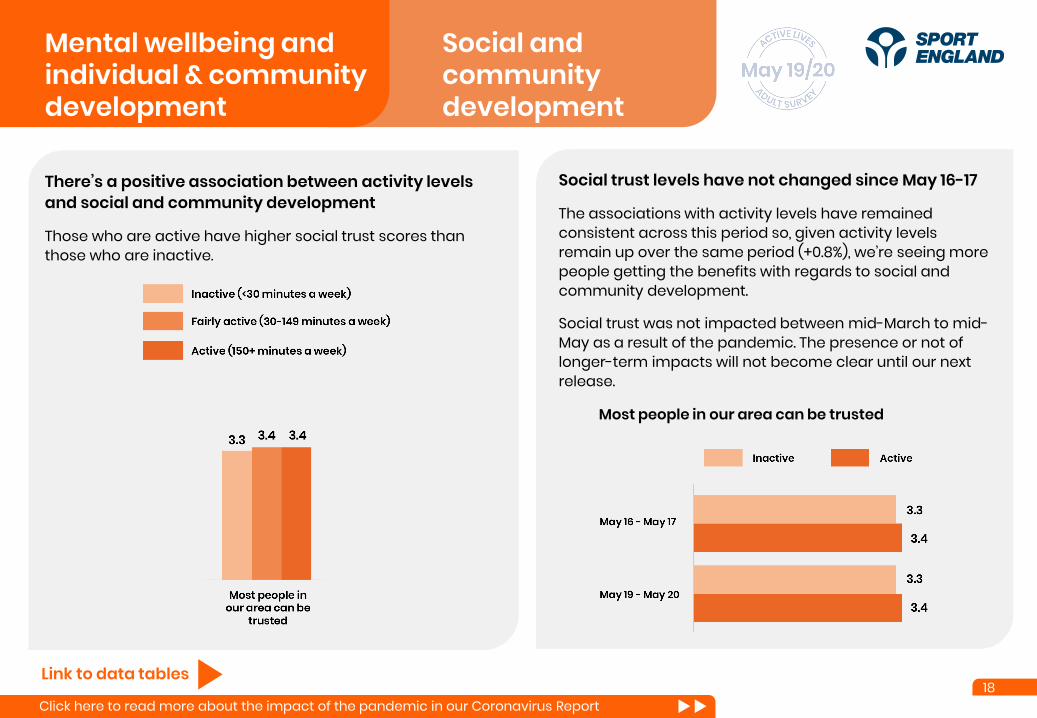
There’s a positive association between activity levels and social and community development
Those who are active have higher social trust scores than those who are inactive.
18Link to data tables
Social trust levels have not changed since May 16-17
The associations with activity levels have remained consistent across this period so, given activity levels remain up over the same period (+0.8%), we’re seeing more people getting the benefits with regards to social and community development.
Social trust was not impacted between mid-March to mid-May as a result of the pandemic. The presence or not of longer-term impacts will not become clear until our next release.
Most people in our area can be trusted
Click here to read more about the impact of the pandemic in our Coronavirus Report
Definition
Tackling loneliness is a key government objective.
In October 2018, the Department for Digital, Culture, Media and Sport published ‘A Connected Society’, its first strategy for tackling loneliness in England.
This chapter sets out the role sport and physical activity –and volunteering to support it – has in this.
Loneliness
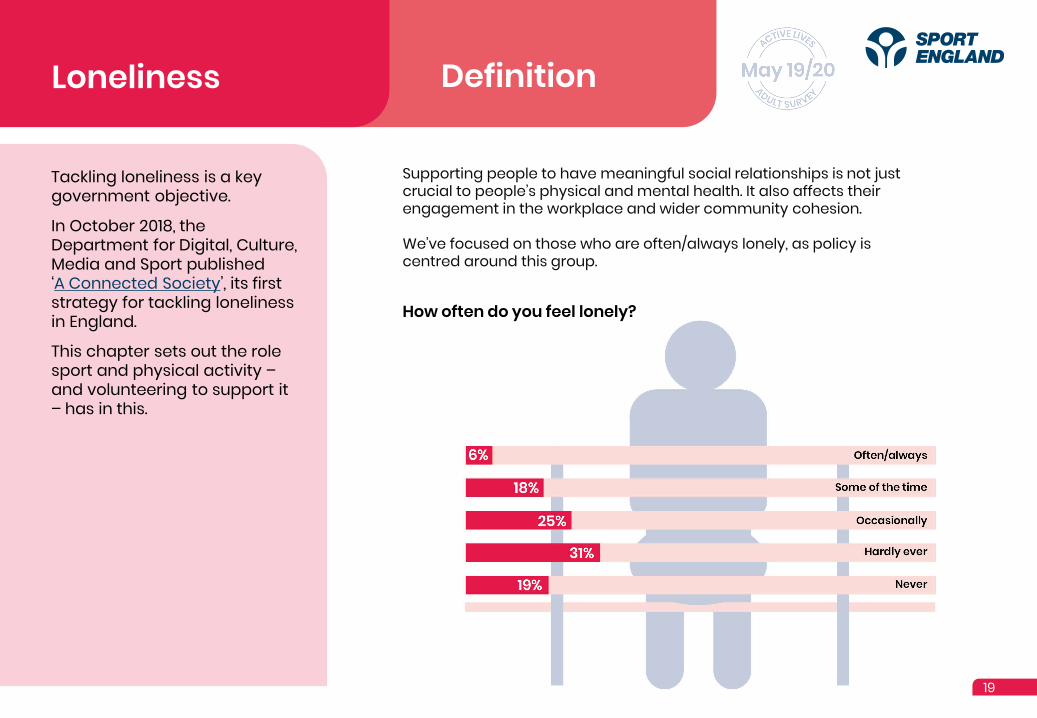
Supporting people to have meaningful social relationships is not just crucial to people’s physical and mental health. It also affects their engagement in the workplace and wider community cohesion.
We’ve focused on those who are often/always lonely, as policy is centred around this group.
19
How often do you feel lonely?
Loneliness
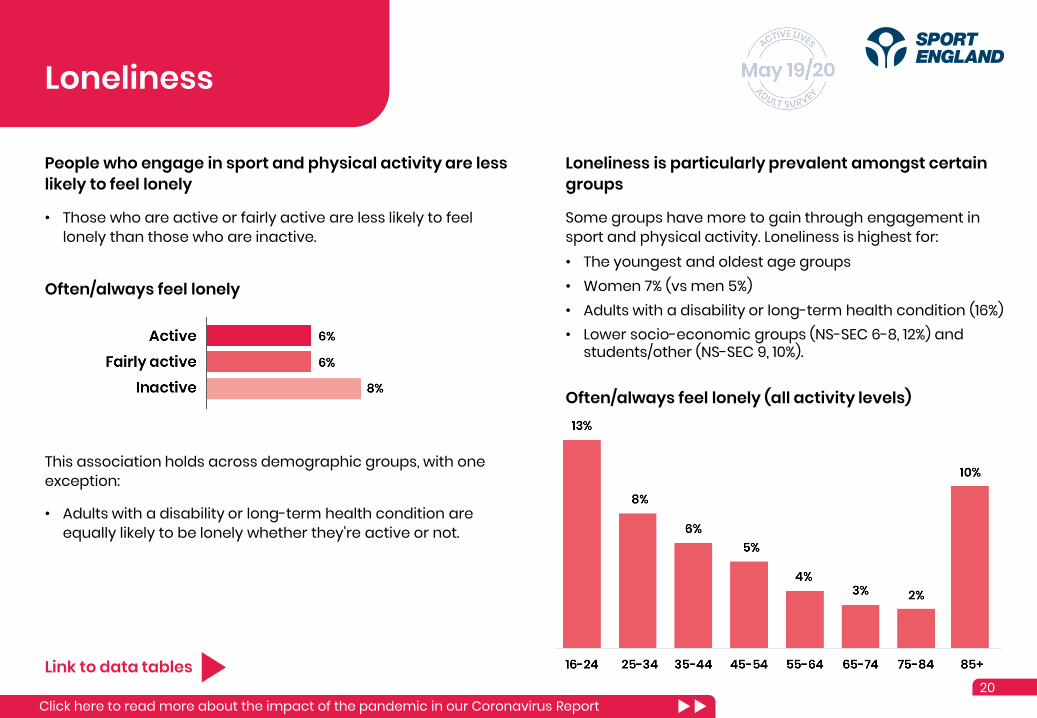
People who engage in sport and physical activity are less likely to feel lonely
• Those who are active or fairly active are less likely to feel lonely than those who are inactive.
Loneliness is particularly prevalent amongst certain groups
Some groups have more to gain through engagement in sport and physical activity. Loneliness is highest for:• The youngest and oldest age groups• Women 7% (vs men 5%)• Adults with a disability or long-term health condition (16%)• Lower socio-economic groups (NS-SEC 6-8, 12%) and
students/other (NS-SEC 9, 10%).
20
Often/always feel lonely (all activity levels)
Link to data tables
This association holds across demographic groups, with one exception:
• Adults with a disability or long-term health condition are equally likely to be lonely whether they're active or not.
Often/always feel lonely
Click here to read more about the impact of the pandemic in our Coronavirus Report
Local level data
Link to data tables
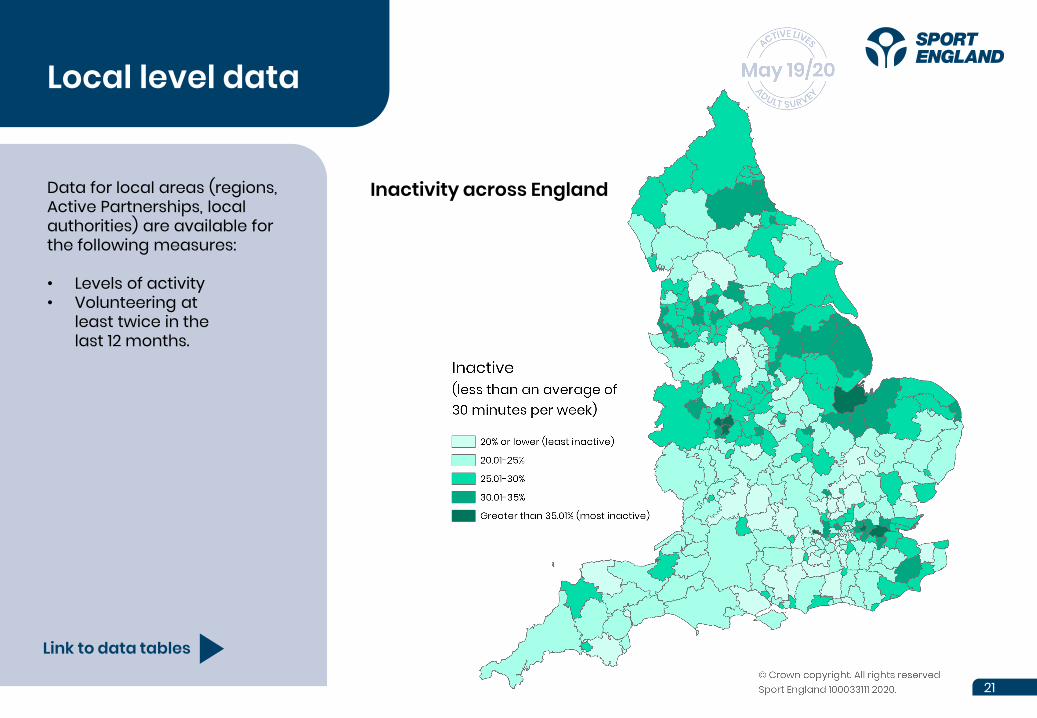
Data for local areas (regions, Active Partnerships, local authorities) are available for the following measures:
• Levels of activity• Volunteering at
least twice in thelast 12 months.
21
Inactivity across England
Definitions
Link to more information on measures and demographics
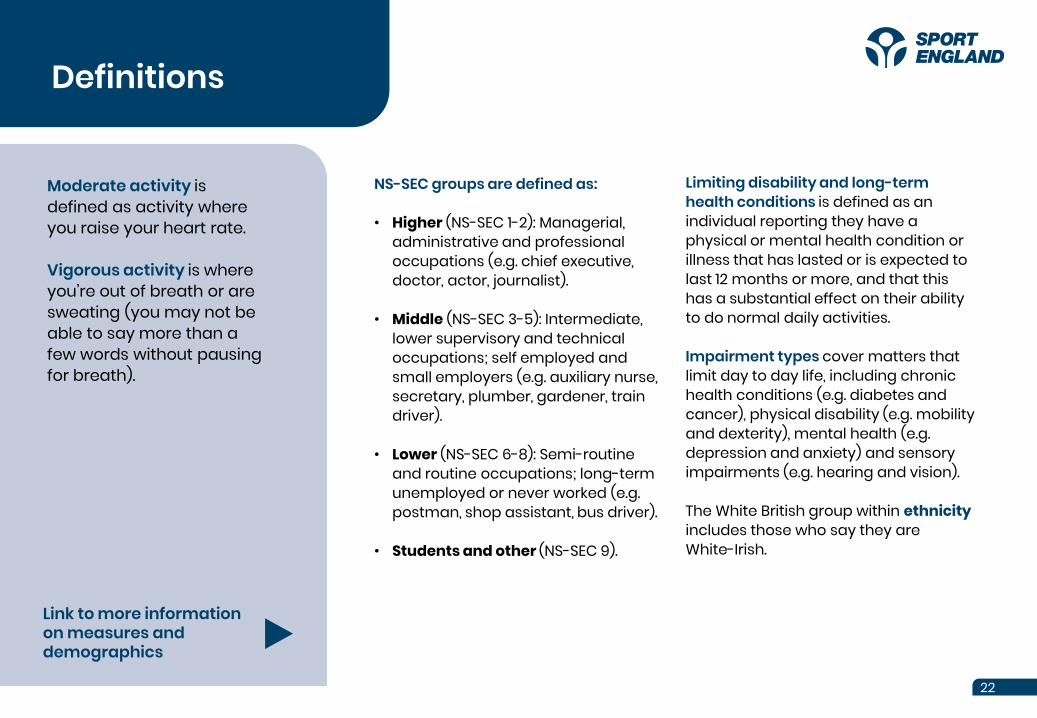
Moderate activity is defined as activity where you raise your heart rate.
Vigorous activity is where you’re out of breath or are sweating (you may not be able to say more than a few words without pausing for breath).
NS-SEC groups are defined as:
• Higher (NS-SEC 1-2): Managerial, administrative and professional occupations (e.g. chief executive, doctor, actor, journalist).
• Middle (NS-SEC 3-5): Intermediate, lower supervisory and technical occupations; self employed and small employers (e.g. auxiliary nurse, secretary, plumber, gardener, train driver).
• Lower (NS-SEC 6-8): Semi-routine and routine occupations; long-term unemployed or never worked (e.g. postman, shop assistant, bus driver).
• Students and other (NS-SEC 9).
Limiting disability and long-term health conditions is defined as an individual reporting they have a physical or mental health condition or illness that has lasted or is expected to last 12 months or more, and that this has a substantial effect on their ability to do normal daily activities.
Impairment types cover matters that limit day to day life, including chronic health conditions (e.g. diabetes and cancer), physical disability (e.g. mobility and dexterity), mental health (e.g. depression and anxiety) and sensory impairments (e.g. hearing and vision).
The White British group within ethnicityincludes those who say they are White-Irish.
22
Notes
Link to more information on measures and demographics
The Active Lives Adult Survey is a push-to-web survey.
Carried out by Ipsos MORI, it involves postal mailouts inviting participants to complete the survey online.
The survey can be completed on mobile or desktop devices. A paper questionnaire is also sent out to maximise response rates. More information on the survey can be found here.
Sample and weightingThe achieved sample was 190,401 (16+).
Data have been weighted to Office for National Statistics (ONS) population measures for geography and key demographics.
Confidence intervals can be found in the linked tables. These indicate that if repeated samples were taken and confidence intervals computed for each sample, 95% of the intervals would contain the true value. Only significant differences are reported within the commentary. Where results are reported as being the same for two groups, any differences fall within the margin of error.
Significance tests can be found in the linked tables. The tests indicate that if repeated samples were taken, 95% of the time we would get similar findings, i.e. we can be confident that the differences seen in our sampled respondents are reflective of the population. When sample sizes are smaller, confidence intervals are larger, meaning differences between estimates need to be greater to be considered statistically significant.
Population totals are estimated values and have been calculated using ONS mid-2015, mid-2016, mid-2017, mid-2018 and mid-2019 estimates. Confidence intervals also apply to these. More detail can be found here.
23
Notes
Link to more information on measures and demographics
Sport spectatingWhilst not covered in this report, data tables showing the number of people attending live sports events form part of this release.
VolunteeringThe volunteering questions were updated in year five to provide more detailed data on the frequency, duration and longevity of volunteers. As such, we're unable to report a combined 12 month figure at this release. The final data collected by the old questions (May-Nov 19) is presented in the data tables linked to this report.
Data considerationsHow we measure changeActive Lives figures are based on the response of 190,401 adults, which we then scale up to provide an England-wide picture. That means there will naturally be small fluctuations when we compare the figures we have now with 12 months ago.
In accordance with Government Statistical Service good practice guidance, we highlight changes within the report where we're confident that there are genuine differences. If the data is showing only small differences which are within the margin of error, they’re noted as “no change”.
Where we comment on change this refers to a percentage point (absolute) change.
Suppressed dataDuring the first six months of surveying, a number of respondents were double counting a gym session and the individual activities that they did within the gym. We resolved this problem by rewording the question from May 2016. Due to exercise bike being counted within cycling for leisure and sport, this means we cannot report November 15/16 data for either fitness activities or cycling for leisure and sport.
Link to data tables
24