Embed Size (px)
Citation preview

Active Quant: Applied Investment Research in Emerging Markets
John B. Guerard, Jr.
Director of Quantitative Research
McKinley Capital Management, LLC
3301 C Street
Suite 500
Anchorage, AK 99503
(907) 563-4488
September 2018
Presented at the FactSet Investment Symposium, Orlando, FL, October 19-21, 2018.

Active Quant: Applied Investment Research in Emerging Markets
Abstract
Active quantitative models for stock selection use analysts’ expectations, momentum, and
fundamental data. We find support for simple and regression-based composite modeling using these
sources of data for global and emerging markets stocks during the period 2003–2016. We also find
evidence for the use of Axioma multi-factor models for portfolio construction and risk control. We
create portfolios for January 2003–December 2016. We report four conclusions: (1) analysts’ forecast
information was rewarded by the global market between January 2003 and December 2016; (2)
analysts’ forecasts can be combined with reported fundamental data, such as earnings, book value,
cash flow and sales, and also with price momentum, in a stock selection model for identifying
mispriced securities; (3) emerging markets efficient frontiers dominate non-US and global efficient
frontiers; and (4) the portfolio returns of the multi-factor risk-controlled emerging markets portfolios
are consistent with real-time emerging markets excess returns.
1. Introduction
Emerging Markets have offered superior risk-adjusted returns relative to developed markets for the
better part of 30 years. Academicians and practitioners documented the superior returns and returns
relative to risk of emerging markets [Harvey (1995), Mobius (1996), MSCI Barra (2008)]. In fact, ten
years ago, Guerard (2007) made an IFE presentation, “Emerging Markets- How far can they go” in
which we made the case for a better risk-return tradeoff in EM stocks than in Russell 300 and MSCI
All Country World stocks for 1991-2006. One need not forecast EM markets; simply invest. A rational
investor should consider an emerging markets investment or several reasons. First, will emerging
markets continue to offer higher returns relative to risk than developed markets? Second, an investor
could prefer emerging markets investment because the markets have generated higher excess returns
than developed markets. Both cases could, and are, correct. Emerging markets, on country basis, have

produced higher Sharpe ratios than developed markets and higher portfolio excess returns have been
earned on emerging markets portfolios than developed market portfolios [McKinley Capital
Management (2007)]. Moreover, Brown (2017) reports in this issue that emerging markets produce
higher Information Ratios on Medium-Term Momentum, Growth, and Value risk factor returns than
U.S., Japan, Europe or Worldwide markets. We will show in this analysis that Active Returns
(portfolio returns less the benchmark returns) and Specific Returns (stock selection) are higher in
emerging markets stocks than in global and non-US stocks. Clearly a rational investor, based on higher
country returns, higher excess returns, and higher specific returns in emerging market stocks would not
underweight emerging market stocks in a global portfolio.
Expected returns on assets are a key input in the mean-variance portfolio selection process.
One can estimate models of expected returns by using earnings expectations data, price momentum
variables, and reported financial data. In this analysis, we construct and estimate a global stock
selection model by using these data for the period from January 2003 to December 2016. Earnings
expectations information has been being rewarded in global stocks for the past fifteen years or so, and
we expect it to continue to be the primary variable driving global stocks. Despite the recent volatility
of the momentum factor, momentum is still associated statistically with security returns, and can be
used with other factors to rank stocks for purchase. A composite model of earnings expectations
information, value, and momentum factors is estimated for global stocks to identify potentially
mispriced stocks. Analysts’ forecast and momentum variables are dominant in the regression-based
composite model of expected returns. We test both a ten-factor and two-factor model of expected
returns in emerging markets. We create portfolios for the period January 2003 – December 2016, and

simulate portfolio returns which we compare with a set of global stock benchmark returns. Our
simulated emerging markets portfolios are consistent with our real-time emerging markets portfolios.
We begin with a review of the literature on stock selection models. We use both fundamental and
statistical multi-factor risk models to create efficient portfolios. We discuss the relevance of the “alpha
alignment factor” and show its potential. We report real-world portfolio performance. Finally, we
present our summary and conclusions.
2. A literature review of expected returns modeling and stock selection models
There are many different approaches to security valuation and the creation of expected returns.
Most active quantitative managers seek to create a composite model to pick stocks that integrate value,
(using fundamental data, earnings, book value cash flow, and sales), price momentum, and analysts’
expectational data. In a recent article in the 25th anniversary issue of this journal, Guerard (2017)
discussed how Daiwa Securities (DPOS) and McKinley Capital built, tested, and measured the post-
publication performance of models, using only data available to the investor at a given point in time.
The DPOS models were highly statistically significant 25 years, post-publication. The forecasted
earnings acceleration model, CTEF, was highly statistically significant more than 20 years, post-
publication. The Guerard (2017) models passed the Markowitz and Xu (1994) Data Mining
Corrections tests in 1993, 2014, and 2017.
Graham and Dodd (1934) recommended that U.S. stocks be purchased on the basis of the (low)
price-to-earnings (P/E) ratio. Mobius (1996) noted the applicability of the low P/E strategy to
emerging markets. They suggested that no stock should be purchased if its price-to-earnings ratio
exceeded 1.5 times the P/E multiple of the market. Graham and Dodd established the P/E criteria, and
it was then discussed by Williams (1938), who wrote the monograph that influenced Harry

Markowitz’s thinking on portfolio construction. Basu (1977) reported evidence supporting the low P/E
model. Fama and French (1992) developed a double-sorting algorithm of portfolio construction that
supported the book-to-price (P/B) in U.S. stocks. Der Hart, Slagter, and van Dijk (2003) reported the
efficiency of the book-to-price (P/B) in emerging markets. The recent literature on financial anomalies
has been summarized in Levy (1999), Fama and French (2008), Haugen and Baker (2010), and Levy
(2012).
Bloch et al. (1993) built fundamental-based stock selection models for Japanese and United
States stocks. The investable stock universe was the first section, non-financial Tokyo Stock
Exchange common stocks from January 1975 to December 1990 in Japan, and the 1,000 largest
market-capitalized common stocks from November 1975 to December 1990 in the United States.
They found that a series of Markowitz (1952, 1959, and 1976) mean-variance efficient portfolios using
the higher EP values in Japan underperformed the universe benchmark, whereas BP, CP, and SP
(sales-to-price, or sales yield) variables outperformed the universe benchmark. For the United States,
the optimized portfolios using the BP, CP, SP, and EP variables outperformed the U.S. S&P 500,
providing support for the Graham and Dodd concept of using the relative rankings of value-focused
fundamental ratios to select stocks.1 Guerard, Xu, and Gultekin (2012) and Guerard, Rachev, and Shao
1 One finds the Price/Earnings, Price/Book and Price/Sales ratios listed among the accounting anomalies by Levy (1999, p. 434). Levy
also discusses the dividend yield as a (positive) stock anomaly. Malkiel (1996) cites evidence in support of buying low P/E, low P/B, and
high D/P (dividend yield) stocks for a good performance, provided that the low P/E stocks have modest growth prospects (pp. 204-210).
Malkiel speaks of a “double bonus”; that is, if growth occurs, earnings increase and the price-to-earnings multiple may increase, driving
the price up even further. Of course, should growth fail to occur, both earnings and the P/E multiple may fall.
In a thorough assessment of value versus growth in the United States, Lakonishok et al. (1994) examined the intersection of the Compustat and
CRSP databases for annual portfolios for NYSE and AMEX common stocks, April 1963 to April 1990. Their value measures were three current value
ratios: EP, BP and CP. Their growth measure was the five-year average annual growth of sales (GS). They performed three types of tests: a univariate ranking into annual decile portfolios for each of the four variables, bivariate rankings on CP (value) and GS (growth, glamour), and finally a multivariate
regression adaptation of the Fama and MacBeth (1973) time series pooling of cross-sectional regressions. The univariate regression coefficient for GS
was significantly negative. The EP, BP, and CP coefficients were all significantly positive. When Lakonishok et al. performed a multivariate regression using all four variables, they found significantly positive coefficients for BP and EP (but not CP), and significantly negative coefficients for GS.
Lakonishok et al. (1994) concluded that buying out-of-favor value stocks outperformed growth (glamour) stocks during the period April 1968 to April
1990, that future growth was difficult to predict from past growth alone, that the actual future growth of the glamour stocks was much lower than past growth, relative to the growth of value stocks, and that the value strategies were not significantly riskier than growth (or ‘glamour’) strategies ex post.

(2013) added the Guerard et al. (1997) composite earnings forecasting variable CTEF and the Fama
and French (1992) price momentum variables to the equation, to create a ten-factor stock selection
model for the United States stocks and global stocks, which they referred to as the USER (U.S.) and
GLER (global) expected returns models, respectively.
TRt + 1 = a0 + a1EPt + a2 BP t + a3CPt + a4SPt + a5REPt + a6RBPt + a7RCPt
+ a8RSPt + a9CTEFt + a10PMt + et , (1)
where: EP = [earnings per share]/[price per share] = earnings-price ratio;
BP = [book value per share]/[price per share] = book-price ratio;
CP = [cash flow per share]/[price per share] = cash flow-price ratio;
SP = [net sales per share]/[price per share] = sales-price ratio;
REP = [current EP ratio]/[average EP ratio over the past five years];
RBP = [current BP ratio]/[average BP ratio over the past five years];
RCP = [current CP ratio]/[average CP ratio over the past five years];
RSP = [current SP ratio]/[average SP ratio over the past five years];
CTEF = consensus earnings-per-share I/B/E/S forecast, revisions and
breadth;
PM = price momentum; and
e = randomly distributed error term.
Given concerns about both outlier distortion and multi-collinearity, Bloch et al. (1993) tested
the relative explanatory and predictive merits of alternative regression estimation procedures: OLS,
robust regression using the Beaton and Tukey (1974) bi-square criterion to mitigate the impact of

outliers, latent roots to address the issue of multicollinearity (see Gunst, Webster, & Mason, 1976), and
weighted latent roots, denoted WLRR, a combination of robust and latent roots. Bloch et al. (1993)
used the estimated regression coefficients to construct a rolling horizon return forecast. The predicted
returns and predictions of risk parameters were used as inputs for a mean-variance optimizer (see
Markowitz, 1987) to create mean-variance efficient portfolios in financial markets in both Japan and
the United States. Guerard (2016) reported the continued effectiveness of the Beaton-Tukey bi-square
and that the Tukey Optimal Influence Function, discussed in Maronna, Martin., and Yohai (2006),
produced higher specific returns (stock selection) than the bi-square criteria.
3. Efficient frontier portfolio construction
The Markowitz mean-variance (MV) portfolio construction and management can be
summarized as:
minimize 𝑤𝑇𝐶𝑤 − 𝜆𝜇𝑇𝑤, (2)
where µ is the expected return vector, C is the variance-covariance matrix, w is the portfolio weights,
and λ is the risk-return tradeoff parameter. The estimation of C is usually done by a multifactor model,
in which the individual stock return Rj of security j at time t, dropping the subscript t for time, may be
written like this:
𝑅𝑗 = ∑ 𝛽𝑗𝑘𝑓�̃�𝐾𝑘=1 + 𝑒�̃�. (3)
The nonfactor, or asset-specific, return on security j, 𝑒�̃�, is the residual risk of the security after
removing the estimated impacts of the K factors. The term fk is the rate of return on factor k. The
factor model simplifies the C as the sum of the systematic risk covariance and diagonal specific
variances,

𝐶 = 𝛽𝐶𝑓,𝑓𝛽′ + Σ. (4)
Accordingly, the portfolio risk is decomposed into the systematic risk and specific risk
𝜎𝑝2 = 𝑤′𝛽𝐶𝑓,𝑓𝛽′𝑤 + 𝑤′Σ𝑤
= 𝜎βP2 + 𝜎SP
2 . (5)
Multi-factor risk models evolved in the works of Rosenberg (1974), Ross (1976), Rosenberg and
Marathe (1979) and Ross and Roll (1980), and Dhrymes, Friend, Gultekin and Gultekin (1984). 2
If the investor is more concerned about tracking a particular benchmark, the mean-variance
optimization in Eq. (3) can be reformulated as an
minimize (𝑤 − 𝑤𝑏)𝑇𝐶(𝑤 − 𝑤𝑏) − 𝜆𝜇𝑇(𝑤 − 𝑤𝑏), (6)
where wb is the weight vector of the benchmark. One can also add equal active weighing constraints
(EAW):
|𝑤𝑗 − 𝑤(b)𝑗| ≤ 𝑥, for all 𝑗. (7)
The MV with constraints in Eq. (7) will be referred to as EAWTaR. The total tracking error can be
decomposed into the systematic tracking error and the specific tracking error:
𝜎𝑝𝑇𝐸2 = (𝑤 − 𝑤𝑏)′𝛽𝐶𝑓,𝑓𝛽′(𝑤 − 𝑤𝑏) + (𝑤 − 𝑤𝑏)′Σ(𝑤 − 𝑤𝑏)
= 𝜎βPTE2 + 𝜎SPTE
2 . (8)
2 The reader is referred to Rudd and Clasing (1982), Grinold and Kahn (1999), and Conner, Goldberg, and Korajczyk
(2010) for complete textbook treatments of multi-factor risk models.

An increase in targeted tracking error serves to produce portfolios with higher geometric means (GM),
Sharpe ratios (ShR), and information ratios (IRs). 3
4.The Data and Initial Empirical Results
The initial data used in this analysis is the Morgan Stanley Capital International (MSCI) Index
constituents’ data for the All Country World (GL) Index, the MSCI Non-US (XUS) Index, and the
MSCI Emerging Markets (EM) Index for the 2003 – 2016 time period. We test two sets of expected
returns, CTEF and GLER, for the three index constituent universes. We selected these variables
because they are the most relevant, and predictive, variables in the U.S. and global growth universes.
We create mean-variance tracking error at risk simulations with a 4 percent upper security weight
(denoted MVTaR). The simulation conditions include a 35 basis point threshold weight, 8 percent
monthly turnover, ITG transactions costs data, and an unconstrained the number of stocks, versus the
respective benchmarks universe for the January 2003 – December 2016 period. The Axioma
Worldwide statistical risk model is used. The MVTaR portfolio simulation results for CTEF and
GLER for the XUS, GL, and EM universes for targeted tracking errors of four, six, and eight percent
are reported in Table 1. In the three universes, CTEF and GLER models produce highly statistically
significant active returns, which increase as targeted tracking errors rise. In all three universes, CTEF
produces statistically significant active, specific momentum, and value returns. CTEF produces the
highest active and specific returns in the EM universe. If one seeks to maximize the geometric mean in
3 We discuss both MVTaR and EAWTaR portfolios because Guerard, Markowitz, Xu, and Chettiappan (2014) reported
highly statistically significant Active and Specific Returns with both optimization techniques. McKinley Capital
Management choses most often to implement an EAWTaR with two percent bounds, an EAW2TaR, portfolio. The MVTaR
portfolio methodology is developed in Guerard, Rachev, and Shao (2013).

portfolios, one would employ a CTEF variable in EM markets with an eight percent targeted tracking
error. In the three universes, the GLER model produces the highest active and specific returns in the
EM universe with an eight percent targeted tracking error. In global and emerging markets portfolios,
the model GLER outperforms CTEF variable. CTEF is superior for active returns and specific returns
in the non-US universe.
Table 1: Forecasted Earnings Acceleration and Stock Selection Modeling in Global, Non-US, and EM Universes
MSCI Index Constituents-only
Axioma Statistical Risk Model and Optimizer
Mean-Variance Analysis
Model: Global CTEF GLER TE
Period: 2003-01-31 to 2016-12-30 (Monthly) Benchmark: ACWG
Portfolio
Return Return T-Stat Return T-Stat Return T-Stat Return T-Stat
GLOBAL_CTEF-TE4 12.44% 3.89% 2.28 1.36% 1.28 1.18% 6.47 1.66% 4.22
GLOBAL_CTEF-TE6 15.87% 7.32% 3.32 3.89% 2.89 1.65% 7.07 1.84% 4.15
GLOBAL_CTEF-TE8 16.31% 7.77% 3.13 4.13% 2.92 1.63% 6.54 1.85% 3.93
GLOBAL_GLER-TE4 13.28% 4.73% 2.95 1.54% 1.42 0.66% 3.86 2.53% 4.49
GLOBAL_GLER-TE6 16.03% 7.49% 3.61 3.26% 2.44 0.94% 3.88 2.76% 4.62
GLOBAL_GLER-TE8 16.87% 8.32% 3.45 4.27% 2.98 0.92% 3.59 2.73% 4.68
Model: XUS CTEF GLER TE
Period: 2003-01-31 to 2016-12-30 (Monthly) Benchmark: ACWXUSG
Portfolio
Return Return T-Stat Return T-Stat Return T-Stat Return T-Stat
XUS_CTEF_TE4 14.11% 6.17% 3.59 3.55% 3.10 1.27% 6.64 1.69% 4.35
XUS_CTEF_TE6 16.27% 8.32% 3.89 3.87% 2.85 1.61% 6.67 1.79% 4.32
XUS_CTEF_TE8 18.05% 10.10% 4.28 4.78% 3.15 1.73% 6.45 1.85% 4.37
XUS_GLER_TE4 13.78% 5.83% 3.67 1.93% 1.81 0.84% 4.22 2.37% 4.44
XUS_GLER_TE6 15.11% 7.17% 3.52 3.10% 2.27 0.84% 3.76 2.58% 4.40
XUS_GLER_TE8 16.22% 8.28% 3.82 4.36% 2.94 0.78% 3.36 2.66% 4.58
Model: EM CTEF GLER TE
Period: 2003-01-31 to 2016-12-30 (Monthly) Benchmark: EMG
Portfolio
Return Return T-Stat Return T-Stat Return T-Stat Return T-Stat
EM_CTEF_TE4 16.15% 5.43% 3.37 4.08% 3.27 0.95% 6.17 1.43% 4.21
EM_CTEF_TE6 17.34% 6.62% 3.00 3.76% 2.27 1.31% 5.90 1.79% 4.32
EM_CTEF_TE8 19.76% 9.04% 3.67 5.17% 2.97 1.68% 5.99 2.01% 4.48
EM_GLER_TE4 17.72% 7.00% 4.90 4.69% 3.97 0.04% 0.32 1.88% 4.05
EM_GLER_TE6 19.81% 9.09% 4.59 6.21% 3.91 0.11% 0.56 2.22% 3.97
EM_GLER_TE8 20.92% 10.20% 4.43 6.55% 3.81 0.19% 0.80 2.39% 4.06
Momentum Value
Active Specific Momentum Value
Active Specific Momentum Value
Active Specific
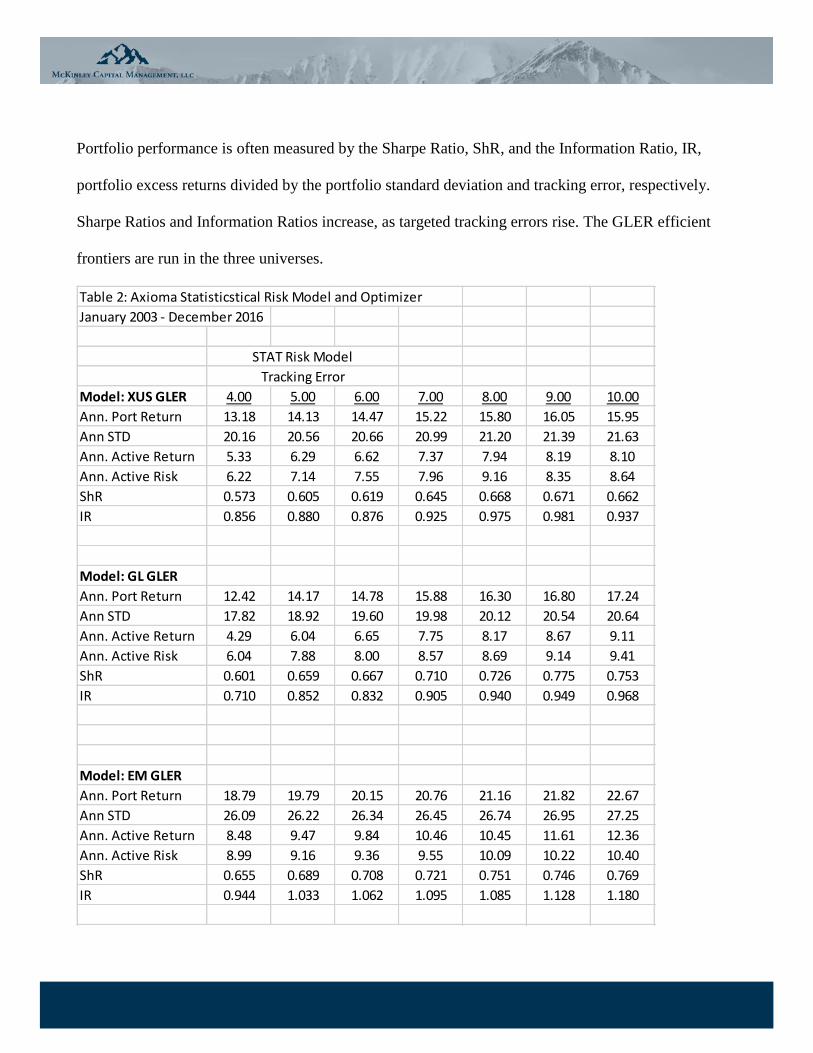
Portfolio performance is often measured by the Sharpe Ratio, ShR, and the Information Ratio, IR,
portfolio excess returns divided by the portfolio standard deviation and tracking error, respectively.
Sharpe Ratios and Information Ratios increase, as targeted tracking errors rise. The GLER efficient
frontiers are run in the three universes.
Table 2: Axioma Statisticstical Risk Model and Optimizer
January 2003 - December 2016
STAT Risk Model
Tracking Error
Model: XUS GLER 4.00 5.00 6.00 7.00 8.00 9.00 10.00
Ann. Port Return 13.18 14.13 14.47 15.22 15.80 16.05 15.95
Ann STD 20.16 20.56 20.66 20.99 21.20 21.39 21.63
Ann. Active Return 5.33 6.29 6.62 7.37 7.94 8.19 8.10
Ann. Active Risk 6.22 7.14 7.55 7.96 9.16 8.35 8.64
ShR 0.573 0.605 0.619 0.645 0.668 0.671 0.662
IR 0.856 0.880 0.876 0.925 0.975 0.981 0.937
Model: GL GLER
Ann. Port Return 12.42 14.17 14.78 15.88 16.30 16.80 17.24
Ann STD 17.82 18.92 19.60 19.98 20.12 20.54 20.64
Ann. Active Return 4.29 6.04 6.65 7.75 8.17 8.67 9.11
Ann. Active Risk 6.04 7.88 8.00 8.57 8.69 9.14 9.41
ShR 0.601 0.659 0.667 0.710 0.726 0.775 0.753
IR 0.710 0.852 0.832 0.905 0.940 0.949 0.968
Model: EM GLER
Ann. Port Return 18.79 19.79 20.15 20.76 21.16 21.82 22.67
Ann STD 26.09 26.22 26.34 26.45 26.74 26.95 27.25
Ann. Active Return 8.48 9.47 9.84 10.46 10.45 11.61 12.36
Ann. Active Risk 8.99 9.16 9.36 9.55 10.09 10.22 10.40
ShR 0.655 0.689 0.708 0.721 0.751 0.746 0.769
IR 0.944 1.033 1.062 1.095 1.085 1.128 1.180

The increase in Sharpe and Information Ratios rise faster in EM than GL and XUS universes,
particularly as targeted tracking errors exceed 6 percent, see Table 2 and Figures 1 and 2.
5. The alpha alignment factor
Recently, Lee and Stefek (2008) and Saxena and Stubbs (2012) discussed the deviation of ex-
post performances from ex-ante targets, and used their analysis to suggest enhancements to mean-
variance optimization inputs. Saxena and Stubbs (2012, 2015) analyzed the complex interactions
0.00
2.00
4.00
6.00
8.00
10.00
12.00
14.00
0.00 2.00 4.00 6.00 8.00 10.00 12.00
Ret
urn
Realized Tracking Error
Return v.s. Realized Tracking Error
GLER XUS
GLER GL
GLER EM
0.00
2.00
4.00
6.00
8.00
10.00
12.00
14.00
0.00 2.00 4.00 6.00 8.00 10.00 12.00
Ret
urn
Targeted Tracking Error
Return v.s. Targeted Tracking Error
GLER XUS
GLER GL
GLER EM

between the factors used for forecasting expected returns, risks and constraints which they denoted as a
factor alignment problem (FAP). The optimized portfolio underestimates the unknown systematic risk
of the portion of the expected returns that is not aligned with the risk model. Consequently, it
overloads the portion of the expected return that is uncorrelated with the risk factors. The empirical
results in a test-bed of real-life active portfolios based on client data show clearly that the above-
mentioned unknown systematic risk is a significant portion of the overall systematic risk, and should
be addressed accordingly. Saxena and Stubs (2012) proposed that the risk variance-covariance matrix
C be augmented with additional auxiliary factors in order to complete the risk model. The augmented
risk model has the form of
𝐶𝑛𝑒𝑤 = 𝐶 + 𝜎𝛼2𝛼 ∙ 𝛼′ + 𝜎𝛾
2𝛾 ∙ 𝛾′ , (9)
where 𝛼 is the alpha alignment factor (AAF), 𝜎𝛼 is the estimated systematic risk of 𝛼, 𝛾 is the
auxiliary factor for constrains, and 𝜎𝛾 is the estimated systematic risk of 𝛾. The alpha alignment factor
𝛼 is the unitized portion of the uncorrelated expected-return model, i.e., the orthogonal component,
with risk model factors.
Saxena and Stubbs (2012 and 2015) applied their AAF methodology to the USER model,
running a monthly backtest based on the above strategy over the time period 2001–2009 for various
tracking error values of 𝜎 chosen from {4%, 5%… 8%}. Saxena and Stubbs (2012) analyzed the time
series of misalignment coefficients of alpha, implied alpha and the optimal portfolio, and found that
almost 40−60% of the alpha is not aligned with the risk factors. The alignment characteristics of the
implied alpha are much better than those of the alpha. Among other things, this implies that the
constraints of the above strategy, especially the long-only constraints, play a proactive role in
containing the misalignment issue. In addition, not only do the orthogonal components of both the
alpha and the implied alpha have systematic risk, but the magnitude of the systematic risk is

comparable to that of the systematic risk associated with a median risk factor in US2AxiomMH.
Saxena and Stubbs (2012) showed the predicted and realized active risks for various risk target
levels, and noted the significant downward bias in risk prediction when the AAF methodology is not
employed.4 The realized risk-return frontier demonstrates that not only does using the AAF
methodology improve the accuracy of risk prediction, it also moves the ex-post frontier upwards,
thereby giving ex-post performance improvements. In other words, the AAF approach recognizes the
possibility of missing systematic risk factors and makes amends to the greatest extent that is possible
without a complete recalibration of the risk model that accounts for the latent systematic risk in alpha
factors explicitly. In the process of doing so, AAF approach not only improves the accuracy of risk
prediction, but also makes up for the lack of efficiency in the optimal portfolios.
Let us introduce a two-factor model for stock selection that equally-weights CTEF and PM.
These factors are used in the proprietary McKinley Capital Management stock selection model. We
reported results for a similar equally-weighted two-factor model in Guerard, Chettiappan, and Xu
(2010) for only the non-US stock universe. In the EM universe, the Axioma fundamental risk
model produces higher Sharpe Ratios and Information Ratios, than the Axioma statistical risk
model, although both risk models create portfolios with very high Sharpe and Information Ratios.
The application of AAF (20% and 40%) pushes out the efficient frontiers in emerging markets, see
Table 3. Active returns, Sharpe Ratios, and Information Ratios rise with targeted tracking errors.
4 Saxena and Stubbs (2012 and 2015) reported bias statistics, a statistical metric that is used to measure the accuracy of risk prediction;
if the ex-ante risk prediction is unbiased, then the bias statistic should be close to 1.0 . Saxena and Stubbs reported bias statistics
obtained without the aid of the AAF methodology are significantly above the 95% confidence interval, which shows that the downward
bias in the risk prediction of optimized portfolios is statistically significant. The AAF methodology recognizes the possibility of
inadequate systematic risk estimation, and guides the optimizer to avoid taking excessive unintended bets.
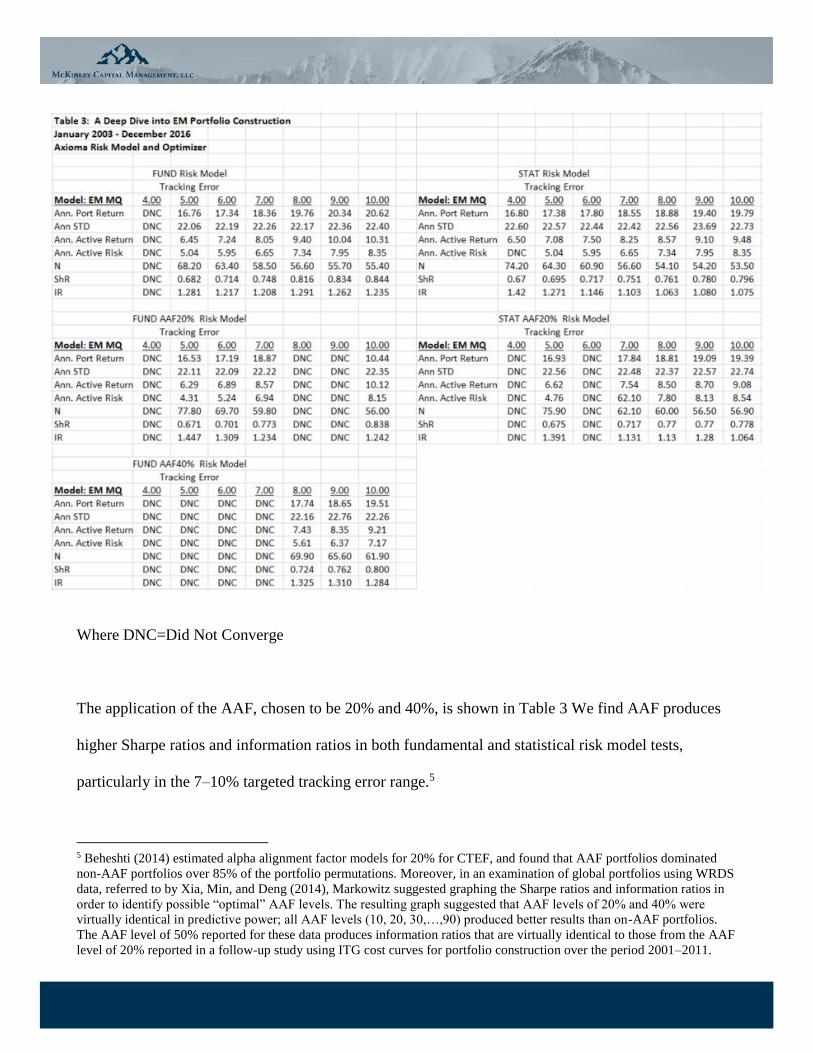
Where DNC=Did Not Converge
The application of the AAF, chosen to be 20% and 40%, is shown in Table 3 We find AAF produces
higher Sharpe ratios and information ratios in both fundamental and statistical risk model tests,
particularly in the 7–10% targeted tracking error range.5
5 Beheshti (2014) estimated alpha alignment factor models for 20% for CTEF, and found that AAF portfolios dominated
non-AAF portfolios over 85% of the portfolio permutations. Moreover, in an examination of global portfolios using WRDS
data, referred to by Xia, Min, and Deng (2014), Markowitz suggested graphing the Sharpe ratios and information ratios in
order to identify possible “optimal” AAF levels. The resulting graph suggested that AAF levels of 20% and 40% were
virtually identical in predictive power; all AAF levels (10, 20, 30,…,90) produced better results than on-AAF portfolios.
The AAF level of 50% reported for these data produces information ratios that are virtually identical to those from the AAF
level of 20% reported in a follow-up study using ITG cost curves for portfolio construction over the period 2001–2011.

5. Real-World Investment Performance
The Journal of Investing, since its first year of publication, has stressed real-time portfolio
performance to show effective implementation. The EM portfolio, run real-time since March 31, 2011,
has produced 446 basis points, as of September 29, 2017, since-inception, annualized Active Returns,
putting the portfolio in the top 5 percent of its peers in Geometric Means, Information Ratios, and
Sharpe Ratios. The portfolio benchmark is the MSCI Emerging Markets Growth Index. The MCM EM
portfolio produces 446 basis points is highly statistically significant, having a t-statistic of 2.69. The
Active Returns is composed of 261 basis points (t-statistic = 1.98, highly statistically significant) of
Factor Contribution, 333 basis points (t-statistic = 4.84) of which is Medium-Term Momentum
(Axioma Momentum exposure averages 0.60) and 185 basis points (t-statistic =1.49, not statistically
significant) of Specific Returns (stock selection). Many EM investors use the MSCI Emerging Index.
The MCM EM portfolio produces 624 basis points is highly statistically significant, having a t-statistic
of 2.97. The Active Returns is composed of 347 basis points (t-statistic = 2.03, highly statistically
significant) of Factor Contribution, 403 basis points (t-statistic = 4.60) of which is Medium-Term
Momentum (Axioma Momentum exposure averages 0.74) and 277 basis points (t-statistic =2.10,
statistically significant) of Specific Returns (stock selection).

The MCM EM portfolio has delivered statistically significant Active Returns against MSCI EM
benchmarks and statistically significant Specific Returns against the MSCI EM benchmark.
What is the future of EM portfolio construction? MCM research suggests that the Domowitz (2018)
Donuts analysis is extremely relevant and appropriate, particularly in universes where the benchmark
Source of Return Avg Exposure Risk IR T-Stat
Portfolio 16.11%
Benchmark 17.26%
Active 0.00% 5.35% 1.17 2.97
Specific Return 0.00% 3.36% 0.82 2.10
Factor Contribution 0.00% 4.35% 0.80 2.03
Style 0.9584 2.76% 0.45 1.14
Exchange Rate Sensitivity 0.0278 0.07% -1.05 -2.68
Growth 0.3058 0.33% 0.96 2.45
Leverage -0.0788 0.12% 0.44 1.13
Liquidity 0.1390 0.22% -0.71 -1.82
Medium-Term Momentum 0.7433 2.23% 1.80 4.60
Short-Term Momentum 0.1210 0.41% -1.91 -4.86
Size -0.1451 0.50% 0.09 0.24
Value -0.2992 0.56% -1.27 -3.23
Volatility 0.1447 0.76% -1.94 -4.96
Country -4.21% 1.04% 0.57 1.45
Industry -4.21% 1.17% 1.50 3.82
Currency -1.25% 0.81% 0.12 0.31
Local 0.36% 0.14% 0.31 0.78
Market -4.21% 0.66% -0.39 -0.99
Sectors -4.21% 1.17% 1.50 3.82
Table 4: EM Real-Time Attribtion Analysis
Portfolio: McKinley Capital Emerging Markets Growth Base Currency: USD
Benchmark: MSCI EM (EMERGING MARKETS) Return Scaling: Annualized (Geometric)
Period: 2011-03-31 to 2017-09-29 (Monthly) Risk Type: Realized Risk
Risk Model: WW21AxiomaMH Long/Short: Long Only
Contribution Hit Rate
8.18%
1.94%
6.24%
2.77%
3.47%
1.24%
-0.07% 38.46%
0.32% 67.95%
0.05% 55.13%
-0.16% 50.00%
4.03% 74.36%
-0.78% 21.79%
0.05% 52.56%
-0.71% 42.31%
-1.49% 34.62%
0.59%
1.76%
0.10%
0.04%
-0.25%
1.76%
Report Generated Using 2015.1.4 On: 2017-10-07 13:08:39

is dominated by 4-6 very large stocks. In Donuts, portfolio construction is composed of two steps; (1)
creating an equally active weighted (plus or minus two percent) subset of the sum of top five stocks;
and (2) an equally active weighted subset of the remaining stocks in the portfolio. What is the cost of
such a portfolio? Very little. The Portfolio Manager does not worry about very large stocks that may
often do meet the portfolio criteria, both good forecasted earnings acceleration and good price
momentum. The U.S. reader immediately recognizes the FANG applications to domestic portfolios.
6. Conclusions
Investing based on analysts’ expectations, fundamental data, and momentum variables is a
good investment strategy in the long-run. We create portfolios for January 2003–December 2016. We
report four conclusions: (1) analysts’ forecast information was rewarded by the global market between
January 2003 and December 2016; (2) analysts’ forecasts can be combined with reported fundamental
data, such as earnings, book value, cash flow and sales, and also with price momentum, in a stock
selection model for identifying mispriced securities; (3) emerging markets efficient frontiers dominate
non-US and global efficient frontiers; and (4) the portfolio returns of the multi-factor risk-controlled
emerging markets portfolios are consistent with real-time emerging markets excess returns. The
anomalies literature can be applied in real-world global portfolio construction.

References
Asness, C., Moskowitz, T., & Pedersen, L. (2013). Value and momentum Everywhere. Journal of
Finance, 68, 929-985.
Basu, S. (1977). Investment performance of common stocks in relation to their price earnings ratios: a
test of market efficiency. Journal of Finance, 32, 663-682.
Beaton, A. E., & Tukey, J. W. (1974). The fitting of power series, meaning polynomials, illustrated on
bank-spectroscopic data. Technometrics, 16, 147-185.
Bloch, M., Guerard Jr., J. B., Markowitz, H. M., Todd, P., & Xu, G.-L. (1993). A comparison of some
aspects of the U.S. and Japanese equity markets. Japan and the World Economy, 5, 3-26.
Brown, M. (2017). For style factors, one size does not fit all. Journal of Investing 26, 127-137.
Bruce, B., & Epstein, C. B. (1994). The Handbook of Corporate Earnings Analysis. Chicago: Probus
Publishing Company.
Conner, G. and R. A. Korajczyk. (2010). Factor Models in Portfolio and Asset Pricing Theory”. In J.
Guerard, Ed. The Handbook of Portfolio Construction: Contemporary Applications of Markowitz
Techniques. New York: Springer.
Conrad, J and G. Kaul. (1998). An anatomy of trading strategies. Review of Financial Studies 11, 489–
519.
Connor, G., L. Goldberg, and R. A. Korajczyk. (2010). Portfolio Risk Analysis. Princeton: Princeton
University Press.
Dimson, E. (1986). Stock Market Anomalies. Cambridge; Cambridge University Press.
Elton, E. J., Gruber, M. J., & Gultekin, M. (1981). Expectations and share prices. Management
Science, 27, 975-987.
Fama, E. F., & MacBeth, J. D. (1973). Risk, return, and equilibrium: empirical tests. Journal of
Political Economy, 81, 607-636.
Fama, E. F., & French, K. R. (1992). Cross-sectional variation in expected stock returns. Journal of
Finance, 47, 427-465.
Fama, E. F., & French, K. R. (1995). Size and the book-to-market factors in earnings and returns.
Journal of Finance, 50, 131-155.
Fama, E. F., & French, K. R. (2008). Dissecting Anomalies. Journal of Finance, 63, 1653-1678.

Grinold, R., & Kahn, R. (1999). Active Portfolio Management. New York: McGraw-Hill/Irwin.
Graham, B. and Dodd, D. (1934). Security Analysis: Principles and Technique (1st ed.). New York:
McGraw-Hill Book Company.
Graham, B., Dodd, D., & Cottle, S. (1962). Security Analysis: Principles and Technique (4th ed.). New
York: McGraw-Hill Book Company.
Guerard Jr., J. B. (2007). Emerging markets – How far can they go? Institute of Fiduciary Education.
Westlake Village, CA. July 15-18.
Guerard Jr., J. B., S. Chettiappan, and G. Xu, Stock-Selection Modeling and Data Mining Corrections:
Long-Only versus 130/30 Models. In J.B. Guerard (ed.), The Handbook of Portfolio
Construction: Contemporary Applications of Markowitz Techniques. New York: Springer
Guerard Jr., J. B., Xu, G., & Gultekin, M. N. (2012). Investing with momentum: the past, present, and
future. Journal of Investing, 21, 68-80.
Guerard Jr., J. B., Rachev, R. T., & Shao, B. (2013). Efficient global portfolios: big data and
investment universes. IBM Journal of Research and Development 57, No. 5, Paper 11.
Guerard, J.B., Jr., Markowitz, H. M. & Xu, G. (2015). Earnings forecasting in a global stock selection
model and efficient portfolio construction and management. International Journal of
Forecasting 31, 550-560.
Guerard Jr., J. B. & Chettiappan, S. (2017). Applied investment in emerging markets. Journal of
Investing 26, 138-154.
Guerard, J.B., Jr. (2016). Investing in Global Markets: Big Data and Applications of Robust
Regression, Frontiers in Applied Mathematics and Statistics, pp. 1-16.
Guerard, J.B., Jr. (2017). The development of mean-variance portfolios in Japan and the United States:
25 years after. Journal of Investing 26, 70-93.
Guerard, J.B., Jr. & Mark, A. (2018). Earnings forecasts and revisions, price momentum, and
fundamental data: further explorations of financial anomalies, in C.F. Lee, Editor, Handbook of
Financial Econometrics. Singapore, World Scientific Handbook in Financial Economics,
forthcoming.
Gunst, R. F., Webster, J. T., & Mason, R. L. (1976). A comparison of least squares and latent root
regression estimators. Technometrics, 18, 75-83.
Harvey, C. R. (1995). Predictable risk and returns in emerging markets. The Review of Financial
Studies 8, 773-816.

Harvey, CR, Lin,Y and Zhu, H (2016)…the cross-section of expected returns. Review of Financial
Studies 29(1), 5-69.
Hastie, T., R. Tibshirani, and J. Friedman. (2016). The Elements of Statistical Learning: Data Mining,
Inference, and Prediction. New York: Springer, 2nd edition, 11th printing.
Haugen, R.A. and N. Baker. (1996). Communality in the determinants of expected results. Journal of
Financial Economics 41, 401-440.
Haugen, R., & Baker, N. (2010). Case closed. In J.B. Guerard (ed.), The Handbook of Portfolio
Construction: Contemporary Applications of Markowitz Techniques. New York: Springer.
Hawkins, E. H., Chamberlain, S. C., & Daniel, W. E. (1984). Earnings expectations and security
prices. Financial Analysts Journal, 40(5), 24-38,74.
Korajczyk, R. A., & Sadka, R. (2004). Are momentum profits robust to trading costs? Journal of
Finance, 59, 1039-1082.
Lakonishok, J., Shleifer, A., & Vishny, R. W. (1994). Contrarian investment, extrapolation and risk.
Journal of Finance, 49, 1541-1578.
Latane, H. A. (1959). Criteria for Choice Among Risky Ventures. Journal of Politcal Economy 67,
144-155.
Lee, J. H., & Stefek, D. (2008). Do risk factors eat alphas? Journal of Portfolio Management, 34(4),
12-25.
Lesmond, D. A., Schill, M. J., & Zhou, C. (2004). The illusory nature of trading profits. Journal of
Financial Economics, 71, 349-380.
Levy, H. (1999). Introduction to Investments (2nd ed.). Cincinnati: South-Western College Publishing.
Levy, M. (2012). The Capital Asset Pricing Model in the 21st Century. Cambridge: Cambridge
University Press.
Malkiel, B. (1996). A Random Walk down Wall Street (6th ed.). New York: W.W. Norton & Company.
Markowitz, H. M. (1952). Portfolio selection. Journal of Finance, 7, 77-91.
Markowitz, H. M. (1959). PortfolioSselection: Efficient Diversification of Investment. Cowles
Foundation Monograph No.16. New York, John Wiley & Sons.
Markowitz, H.. 1987. Mean-Varance Analysis in Portfolio Choice and Capital Markets. London: Basil
Blackwell.

Markowitz, H. M. (1976). Investment in the long run: new evidence for an old rule. Journal of
Finance, 31, 1273-1286.
Markowitz, H. M., & Xu, G. L. (1994). Data mining corrections. Journal of Portfolio Management, 21,
60-69.
McKinley Capital Management, Inc. (2006). An Assessment of a McKinley Capital Emerging Markets
Growth portfolio: A Review of Factors, Returns, and Implementation. June.
McKinley Capital Management, Inc. (2007). Emerging Markets: How Far Can They Go? July.
Menchero, J., Morozov, A., & Shepard, P. (2010). Global equity modeling. In J.B. Guerard (ed.), The
Handbook of Portfolio Construction: Ccontemporary Applications of Markowitz Techniques. New
York: Springer.
Mobius, M. 1996. Mobius on Emerging Markets. London: FT PrenticeHall.
MSCI /Barra. Emerging Markets: A 20-Year Perspective. 2008.
MSCI /Barra. Risk Environment in Asian Emerging Markets. July 2008.
Ramnath, S., Rock, S., & Shane, P. (2008). The financial analyst forecasting literature: a taxonomy
with suggestions for further research. International Journal of Forecasting, 24, 34-75.
Rosenberg, B. (1974). Extra-market components of covariance in security returns. Journal of Financial
and Quantitative Analysis, 9, 263-274.
Rosenberg, B., & Marathe, V. (1979). Tests of capital asset pricing hypotheses. In H. Levy (ed.),
Research in finance (vol. 1).
Ross, S. A. (1976). The arbitrage theory of capital asset pricing. Journal of Economic Theory, 13, 341-
360.
Ross, S. A., & Roll, R. (1980). An empirical investigation of the arbitrage pricing theory. Journal of
Finance, 35(2), 1071-1103.
Rudd, A., & Clasing, H. K. (1982). Modern Portfolio Theory: The Principles of Investment Management.
Homewood, IL: Dow-Jones Irwin.
Saxena, A., & Stubbs, R. A. (2012). An empirical case study of factor alignment using the USER model.
Journal of Investing, 21, 25-44.

Sivaramakrishnan, K., & Stubbs, R. A. (2013). Improving the investment process with a custom risk
model: a case study with the GLER model. Journal of Investing, 22, 129-147.
Wheeler, L. B. (1994). Changes in consensus earnings estimates and their impact on stock returns. In
B. Bruce & C.B. Epstein (eds.), The handbook of corporate earnings analysis.
Williams, J. B. (1938). The Theory of Investment Value. Cambridge: Harvard University Press.
Wormald, L., & van der Merwe, M. (2012). Constrained optimization for portfolio construction. Journal
of Investing, 21, 44-59.
Xia, H., Min, H., & Deng, S. (2014). Effective of earnings forecasts in efficient global portfolios.
International Journal of Forecasting, forthcoming.
Van Der Hart, E. Slagter and Dijk, D. van. (2013). Stock selection Strategies in Emerging Markets.
Journal of Empirical Finance 10, 107-134.
DISCLOSURE
The views and opinions expressed in this paper are those of the authors and may not represent or reflect those of
McKinley Capital Management, LLC. All information contained herein is believed to be acquired from reliable
sources, but accuracy cannot be guaranteed. This presentation is for informational purposes only, was prepared
for academics and financially sophisticated and institutional audiences and does not represent specific financial
services, investment recommendations or advice. Data is subject to change without notice. For further information
regarding the material, please contact the presenter.
With regard to references to the S&P Index. Copyright © 2018 S&P Dow Jones Indices LLC. All rights reserved.
No content may be modified, reverse-engineered, reproduced or distributed in any form or by any means, or stored
in a database or retrieval system, without the prior written permission of S&P Dow Jones Indices. S&P Dow Jones
Indices and its third-party data providers and licensors (collectively “S&P Dow Jones Indices Parties”) do not
guarantee the accuracy, completeness, timeliness or availability of the Content. S&P Dow Jones Indices Parties
disclaim any and all express or implied warranties, including but not limited to warranties or fitness for a particular
purpose or use, freedom from bugs, errors, or defects. S&P Dow Jones Indices Parties cannot be held liable for
any direct, indirect, incidental, exemplary, compensatory, punitive, special or consequential damages, costs,
expenses, legal fees, or losses in connection with any use of its Content.
With regards to materials, if any, accredited to MSCI®: Neither MSCI nor any other party involved in or related
to compiling, computing or creating the MSCI data makes any express or implied warranties or representations
with respect to such data (or the results to be obtained by the use thereof), and all such parties hereby expressly
disclaim all warranties of originality, accuracy, completeness, merchantability or fitness for a particular purpose
with respect to any of such data. Without limiting any of the foregoing, in no event shall MSCI, any of its affiliates
or any third party involved in or related to compiling, computing or creating the data have any liability for any
direct, indirect, special, punitive, consequential or any other damages (including lost profits) even if notified of
the possibility of such damages. No further distribution or dissemination of the MSCI data is permitted without
MSCI’s express written consent. Please refer to the specific service provider’s web site for complete details on all
indices.

John B. Guerard, Jr., Ph.D., McKinley Capital Management, LLC, 3301 C Street, Suite 500, Anchorage,
AK 99503. [email protected].
Mr. Guerard is Director of Quantitative Research at McKinley Capital Management, in Anchorage,
Alaska. He earned his AB in Economics from Duke University, his MA in Economics from the
University of Virginia, MSIM from the Georgia Institute of Technology, and Ph.D. in Finance from the
University of Texas, Austin. Mr. Guerard has published several monographs, including Quantitative
Corporate Finance (Springer, 2007, with Eli Schwartz) and Introduction to Financial Forecasting in
Investment Analysis (Springer, 2013), and edited The Handbook of Portfolio Construction:
Contemporary Applications of Markowitz Techniques (Springer, 2010) and Portfolio Construction,
Measurement, and Efficiency (Springer, 2017). John serves an Associate Editor of the Journal of
Investing and The International Journal of Forecasting. Mr. Guerard has published research in The
International Journal of Forecasting, Management Science, the Journal of Forecasting, Journal of
Investing, Research in Finance, the IBM Journal of Research and Development, Research Policy, and
the Journal of the Operational Research Society.


![Background Methods Results & ConclusionsMethods Design [quant → QUAL] Quant Data Collection. Phase 1: Quant. Phase 2: QUAL . Quant Data Analysis. QUAL Data Analysis . Integration](https://img.pdfslide.net/doc/110x75/6000faa49b2cd844807c19b1/background-methods-results-conclusions-methods-design-quant-a-qual-quant.jpg)