Embed Size (px)
Citation preview
H I P P O W P U S 6192-209 (1996)
Activity of Hippocampal Pyramidal Neurons During Trace Eyeblink Conditioning Craig Weiss, Michelle A. Kronforst-Collins, and John F. Disterhoft
Department of Cell and Molecular Biology, Northwestern University Medical School, Chicago, I1 1 inois
ABSTRACT: The responsiveness of hippocampal pyramidal neurons was examined in young adult rabbits which were trained in a hip- pocampally dependent long interval trace eyeblink conditioning task. The majority of recorded cells were putative pyramidal neurons from area CAI. Our analysis indicates that 57% of 93 neurons had a statistically significant change in firing rate during some portion of the trial. The re- sponse patterns were quite heterogeneous, and inhibition was frequently observed. Inhibition was especially prominent in a post-trial period. Only a small percentage of the putative pyramidal cells exhibited robust changes in activity with prominent temporal modeling of the conditioned eyeblink response as previously described for rabbits trained with delay conditioning procedures (Berger et al. [1983] J Neurophysiol 50:1197- 121 9). These results were also similar for the CA3 pyramidal neurons that were recorded (N = 19). Few CA1 neurons had significant responses dur- ing unpaired presentations of tone and airpuff, and neural activity that was present was concentrated in the period commencing from airpuff on- set. Preliminary data were also recorded from putative pyramidal neu- rons during hippocampally independent delay eyeblink conditioning, where a longer tone overlapped and coterminated with the airpuff. In this task five of 13 neurons (CAl and CA3) were active during the trial period, another four were responsive only during the post-trial period, and other simultaneously recorded neurons were unresponsive.
These data suggest a relatively more varied pattern of pyramidal neu- ron engagement during hippocampally dependent trace eyeblink condi- tioning than was apparent in previous multiple- and single-neuron analy- ses of activity during eyeblink conditioning.
KEY WORDS: CA1, eyeblink, learning, memory, nictitating membrane, physiology
0 1996 Wiley-Liss, Inc.
The hippocampus has been of particular interest for studies of learning and memory since Scoville and Milner (1957) reported the profound amne- sia of patient H.M. following bilateral resection of the hippocampus. Classical conditioning of the eyeblink reflex has been adopted by many laboratories as a model paradigm to study the role of the hippocampus in learning and mem- ory (e.g., Thompson et al., 1976; Disterhoft et al., 1977; Woodruff-Pak and Thompson, 1985; Buchanan and Powell, 1990; Steinmetz, 1990). Berger et al. (1978) used this paradigm and reported that hippocampal neurons ex- hibited ‘‘temporal models” of the eyeblink response, i.e., the firing rate cor- related with the time and amplitude of the conditioned response.
Accepted for publication February 9, 1996. Address correspondence and reprint requests to Craig Weiss, Department of Cell and Molecular Biology, W129, Northwestern University Medical School, 303 E. Chicago Ave., Chicago, IL 6061 1.
That hippocampal neurons preferentially respond to stimuli that are temporally paired in such a way as to facilitate conditioning, while the same conditioning oc- curs in the absence of the hippocampus, has been an in- triguing paradox for many years (Schmaltz and Theios, 1972; Mauk and Thompson, 1987). One explanation may be that the hippocampus is simply responding to the “configural” relationship of the stimuli during con- ditioning while other neural substrates mediate the learned association (Cohen and Eichenbaum, 1993). This suggests that a better understanding of hippocam- pal function may be obtained by studying its physiol- ogy during hippocampally dependent tasks such as long interval trace conditioning (Solomon et al., 1986; Moyer et al., 1990). The essential component of the task ap- pears to be the greater temporal demand associated with a long interval trace conditioning paradigm (Solomon, 1979) since learning the task with a 500 ms trace pe- riod was dependent upon an intact hippocampus while a 300 ms trace interval was learned in hippocampec- tomized rabbits (Moyer et al., 1990). Data gathered from an experiment using reversible lesions support this suggestion (Tocco et al., 1993). Those rabbits exhibited retention in a delay paradigm, but not in a trace para- digm while the hippocampus was temporarily inacti- vated by injection of local anesthetics.
The activity of extracellularly recorded single neurons from the hippocampus of eyeblink conditioned rabbits is described in this report. The first part of this study examined the activity of a sample of hippocampal neu- rons during hippocampally dependent trace condition- ing. The second part of the study examined another set of rabbits trained with delay conditioning which can be acquired without the hippocampus. Recording bias in selecting cells to be studied in these experiments was minimized by recording from several microwires of an array. The neural activity was separated offline into that of single neurons (Jung et al., 1994) and then analyzed for changes in firing rate among several time windows associated with the trace paradigm. These data may be compared with those reported by others who used a sim-
0 1996 WLEY-LISS, INC
HIPPOCAMPAL NEURONS AND TRACE CONDITIONING 193
ple delay paradigm, i.e., overlapping stimuli (Berger et al., 1983), and with multiunit data from a similar trace paradigm (Solomon et al., 1986; Woodruff-Pak et al., 1987).
The results presented here suggest that the percentage of neu- rons related to conditioned responses during trace conditioning is smaller than previously reported for neurons recorded during delay paradigms. Many of the neurons which were unresponsive during trace conditioning were “silent cells” which would have been difficult to isolate with conventional hardware discrimina- tors and extracellular recording techniques based upon data col- lection with single probes. Furthermore, the neurons that were responsive exhibited either significant increases or significant de- creases during the conditioning trials. In general, we observed a more complex constellation of single neuron firing patterns in the hippocampally dependent trace eyeblink conditioning paradigm than has been reported in previous studies of eyeblink condi- tioning. Preliminary reports of these data have been presented in abstract form (Weiss et al., 1993, 1994, 1995).
Subjects and Surgery Subjects were 18 young adult New Zealand white female rab-
bits approximately 3 months of age. They were anesthetized with ketamine (60 mg/kg, i.m.) and xylazine (10 mg/kg, i.m.) and the eyes were kept moist by applying a thin coat of antibacterial oph- thalmic ointment. Surgeries were carried out under NIH and Northwestern University ACUC approved procedures. The skull was positioned with lambda 1.5 mm below bregma and the bun- dle or array of microwires was stereotaxically positioned (approx- imately P4.0, L6.0) and lowered into place after drilling through the skull and cutting away the dura matter. The resting position of the electrodes was determined under physiological guidance. A head restraining device containing four nylon bolts (6-32 X 3/4”) was attached to the top of the skull in front of the electrode con- nector. The rabbits were given Buprenex (0.3 mg/kg, s.c.) after surgery to minimize discomfort. The electrodes were not moved until the rabbit received at least 3 days of recovery.
Behavioral Conditioning The conditioning task involved pairing a tone (100 ms, 6 kHz,
85 dB, 5 ms rise/fall time) with an airpuff to the eye (150 ms, 3 psi) after a 500 ms stimulus free trace period. A computer con- trolled delivery of the stimuli and recording of the behavior (Akase et al., 1994). This frequency of the conditioning stimulus (CS) is optimal for the rabbit auditory system (Martin et al., 1980), and was delivered by an open field speaker or by headphones to each ear canal via rubber tubing. The airpuff was the uncondi- tioned stimulus (US) which was adequate to evoke extension of rhe nictitating membrane (NM) while the eyelids were held open with dress hooks. The airpuff was supplied by compressed air and controlled by a regulator and solenoid valve. Movement of the N M was transduced by an infrared sensor which converts a change
in reflectance from the cornea to a change in voltage (Thompson et al., 1994).
Training sessions were conducted while the rabbits were re- strained in a cloth bag and plexiglass box. They received one ses- sion per day with each session consisting of 80 presentations of the paired stimuli (during the first session no stimuli were pre- sented so the rabbit would habituate to the new surroundings). Sessions lasted about 1 h since each trial was separated by a ran- dom intertrial interval (ITI) of 30-60 s. Control rabbits (N = 4) received 160 trials with either a tone or an airpuff. Those trials were presented in random order every 15-30 s. Conditioned re- sponses (CRs) were defined as extensions of the N M which ex- ceeded the mean baseline amplitude by 4 SD for a minimum of 10 ms. Another group of rabbits (N = 2) received training un- der delay conditioning parameters (400 ms CS, I50 ms cotermi- nating US). This group was used to compare hippocampal re- sponses between hippocampally dependent and hippocampally independent learning paradigms.
Data Recording Neuronal activity from the hippocampus was recorded with
either a moveable bundle of 25 p m nichrome recording wires, which were prepared as stereotrodes (Kubie, 1984), or as an ar- ray of 50 p m stainless steel wires (NB Labs, Dennison, TX). The latter was modified into a microdrive according to Kubie’s tech- nique. The wires within the array were separated by either 0.5 or 1 .O mm. The activity on each wire was observed before each train- ing session began. The activity from the blink sensor and the four recording wires with the largest signal to noise were continuously collected for the duration of the session with a computer using the DataWave Technologies (formerly Brainwave) DiscoveryTM system. When fewer than four probes appeared to be near active cells the remaining channels were set with the threshold above the noise level to collect the activity of silent cells. In some rab- bits training was temporarily halted half way through a session to move the array and collect another set of data from different neu- rons. The data presented in this report were collected during train- ing days 4-30 for conditioned rabbits, and days 2-1 5 for the con- trol rabbits. Most of the data presented here are from rabbits that would be considered overtrained.
Data Analysis The DataWave system was used offline to separate the activ-
ity from each wire into the activity arising from single neurons. Averages of the single unit waveforms were then generated to de- termine spike width (peak time minus valley time) and spike du- ration (time difference between spike onset and zero voltage) ac- cording to the criteria of Ranck (1973). Examples of average action potentials (? 1 SD) for a putative pyramidal neuron and a putative interneuron are shown. The time points for the deter- mination of height, width and duration are also shown in Figure 1. Since pyramidal cells have slower rates and broader action po- tentials than interneurons, spike width and spontaneous firing rate were used to classify the type of cell being recorded when the presence of a complex spike was questionable. We refer to these

194 WEISS ET AL.
Pyramidal Theta
<‘ (&Peak 2
and included in the percentage of “silent cells” (Thompson and Best, 1989).
T2 W
FIGURE 1. Examples of an average pyramidal cell (left) and theta cell (right) action potential ( 2 1 SD) with four time points rep- resented (T1-T4). Spike duration was calculated as T3-TI. Spike width was calculated as T4-T2. Both positive going and negative going pyramidal cells were recorded during these experiments.
cells as putative pyramidal cells since antidromic activation and collision techniques were not used for definitive identication. The spontaneous firing rate of the cell was determined from the two second period prior to tone onset.
Statistically significant changes in response rate during the trial were determined by comparing the mean response rate in the pe- riod of interest with the mean response rate from the baseline pe- riod before CS onset relative to the variance of the baseline pe- riod (Olds et al., 1972; Berger et al., 1983). T-tests which yielded a probability level of 0.01 or less (two-tailed) were deemed sig- nificant. This level of probability compensated for the multiple t-tests and was adequate to identify meaningful changes in activ- ity from baseline. The windows of interest included the CS pe- riod (100 ms window from tone onset), the trace period (500 ms from tone offset), and a UR period (500 ms from airpuff onset). These analysis periods are collectively referred to as trial periods. A post-trial period (PT, 2 s from the offset of the UR period) was also analyzed. The control (baseline) window for each t-test was of the same duration as the test window and ended at tone on- set. In addition, the standard error for the t-test was that of the control window. This analysis is in effect a one sample t-test with the mean response rate for the window of interest compared to the mean response rate based on data collected in the baseline pe- riod. Each analysis period was divided into 20 samples to provide a measure of variance. The degrees of freedom for each test was equal to the number of bins in each window minus one, i.e., 20 minus 1, or 19.
Cells which responded so infrequently that only five or fewer of the 20 bins had activity (in either the sample or baseline win- dow) were analyzed with the nonparametric binomial test instead of the t-test (Siege1 and Castellan, 1988). The binomial test is in- sensitive to non-normal distributions and low frequency re- sponses. For consistency with the t-test analysis a probability level of 0.01 was also used for the binomial test. Cells which responded with fewer than six total spikes between the two windows would not show statistical significance. These cells were simply tallied
Histological Analysis After recording the activity of selected cells, or at the bottom
of selected tracks, marking lesions were produced by passing cur- rent through the recording wire (approximately f20 d, 10 s). The nichrome wire electrodes produced a lesion and gliosis as a result of passing current. The stainless steel electrodes resulted in the deposition of iron ions which turned blue when reacted with potassium ferrocyanide (the “Prussian blue” reaction; see Weiss and Disterhoft, 1994). The reaction was carried out on mounted sections or started by perfusion (under deep anesthesia) after a 0.9% saline rinse. For the latter a 50/50 solution of 10% potas- sium ferrocyanide and 10% formalin was perfused through the aorta. This was followed by 10% formalin without potassium fer- rocyanide. The recording wires were then raised within the mi- crodrive and the top of the skull was removed. The brain was re- moved, placed in a solution of 10% formalin/30% sucrose, and embedded in albumin/gelatin. Brain slices were cut at 50 pm, mounted onto subbed slides and stained with cresyl violet (and potassium ferrocyanide for brains that were not reacted during perfusion).
Histology/Cell Type A histological analysis of the marking lesions indicated that
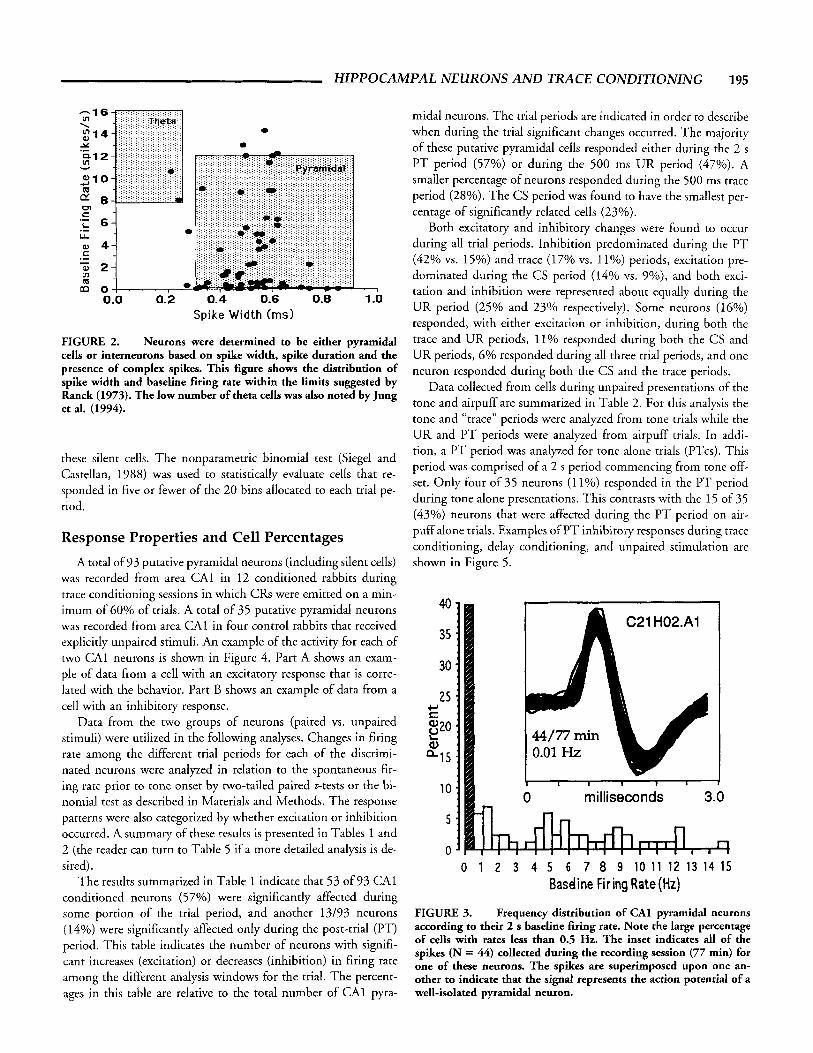
cells were recorded throughout the dorsal hippocampus. As in- tended, the vast majority of cells were recorded from area CAI (see below for more detail). A smaller population of cells was recorded from area CA3; these will be discussed separately. As in- dicated by the plot of spike width by baseline rate (Fig. 2) the majority of cells reported in this study were likely to be pyrami- dal neurons (cf. Jung et al., 1994). The presence of complex spikes and spike width were used to classify those few neurons which had a combination of baseline firing rate and spike width which were outside the limits described by Ranck (1973). The average action potential for the putative pyramidal neurons had a mean ( 2 SE) spike width of 0.53 5 0.01 ms, a mean duration of 0.46 2 0.01 ms, and a mean firing rate of 3.39 t 0.40 Hz.
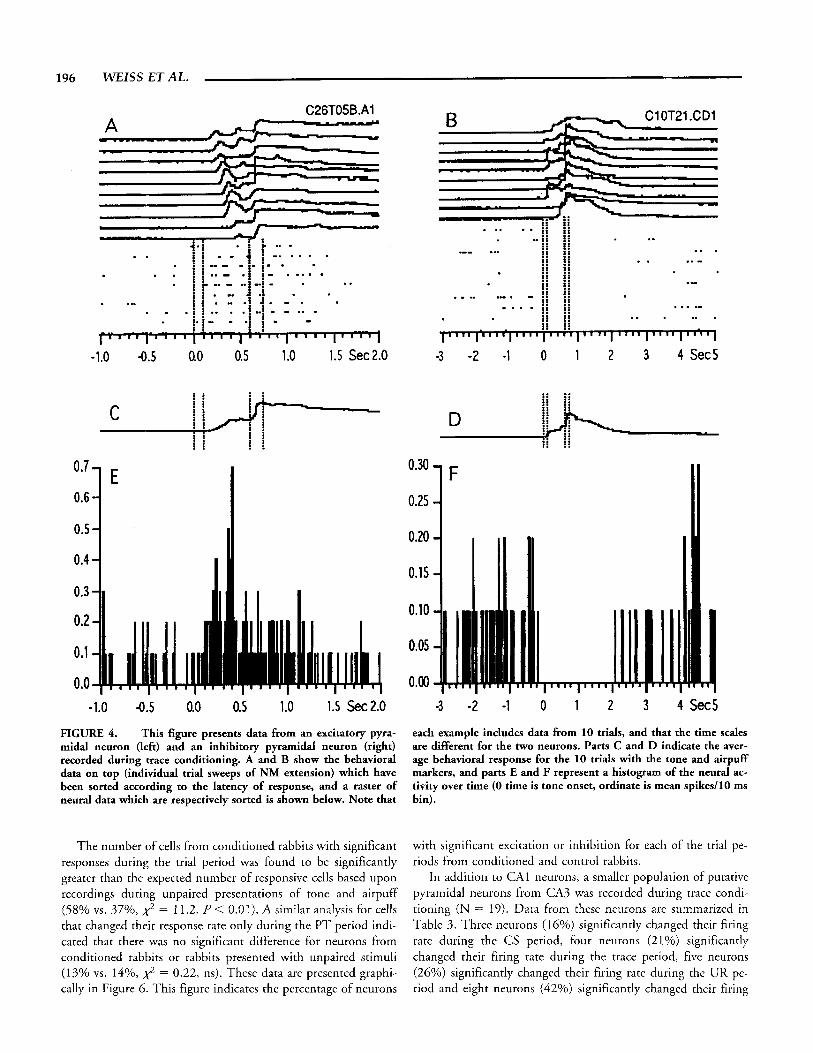
”Silent Cells” Firing rate is presented again in the histogram of Figure 3 to
illustrate the percentage of “silent cells” (Thompson and Best, 1989). Approximately 40% of the putative pyramidal neurons from CAI had a 2 s baseline response rate of 0.5 Hz or less. These neurons also had low response rates during the trial periods. Special care was used during the spike sorting routine to detect these cells since they could be overlooked easily. Although many of these cells responded infrequently, the spikes that were pro- duced appeared healthy and had consistent waveshapes. The in- set of Figure 3 shows all of the traces (superimposed) for one of
HIPPOCAMPAL NEURONS AND TRACE CONDITIONING 195
0.0 0.2 0.4 0.6 0.8 1 .o Spike Width (ms)
FIGURE 2. Neurons were determined to be either pyramidal cells or interneurons based on spike width, spike duration and the presence of complex spikes. This figure shows the distribution of spike width and baseline firing rate within the limits suggested by Ranck (1973). The low number of theta cells was also noted by Jung et al. (1994).
these silent cells. The nonparametric binomial test (Siege1 and Castellan, 1988) was used to statistically evaluate cells that re- sponded in five or fewer of the 20 bins allocated to each trial pe- riod.
Response Properties and Cell Percentages A total of 93 putative pyramidal neurons (including silent cells)
was recorded from area CA1 in 12 conditioned rabbits during trace conditioning sessions in which CRs were emitted on a min- imum of 60% of trials. A total of 35 putative pyramidal neurons was recorded from area CA1 in four control rabbits that received explicitly unpaired stimuli. An example of the activity for each of two CA1 neurons is shown in Figure 4. Part A shows an exam- ple of data from a cell with an excitatory response that is corre- lated with the behavior. Part B shows an example of data from a cell with an inhibitory response.
Data from the two groups of neurons (paired vs. unpaired stimuli) were utilized in the following analyses. Changes in firing rate among the different trial periods for each of the discrimi- nated neurons were analyzed in relation to the spontaneous fir- ing rate prior to tone onset by two-tailed paired t-tests or the bi- nomial test as described in Materials and Methods. The response patterns were also categorized by whether excitation or inhibition occurred. A summary of these results is presented in Tables 1 and 2 (the reader can turn to Table 5 if a more detailed analysis is de- sired).
The results summarized in Table 1 indicate that 53 of 93 CA1 conditioned neurons (57%) were significantly affected during some portion of the trial period, and another 13/93 neurons (14%) were significantly affected only during the post-trial (PT) period. This table indicates the number of neurons with signifi- cant increases (excitation) or decreases (inhibition) in firing rate among the different analysis windows for the trial. The percent- ages in this table are relative to the total number of CA1 pyra-
midal neurons. The trial periods are indicated in order to describe when during the trial significant changes occurred. The majority of these putative pyramidal cells responded either during the 2 s PT period (57%) or during the 500 ms UR period (47%). A smaller percentage of neurons responded during the 500 ms trace period (28%). The CS period was found to have the smallest per- centage of significantly related cells (23%).
Both excitatory and inhibitory changes were found to occur during all trial periods. Inhibition predominated during the PT (42% vs. 15%) and trace (17% vs. 11%) periods, excitation pre- dominated during the CS period (14% vs. 9%), and both exci- tation and inhibition were represented about equally during the UR period (25% and 23% respectively). Some neurons (16%) responded, with either excitation or inhibition, during both the trace and UR periods, 11% responded during both the CS and UR periods, 6% responded during all three trial periods, and one neuron responded during both the CS and the trace periods.
Data collected from cells during unpaired presentations of the tone and airpuff are summarized in Table 2. For this analysis the tone and “trace” periods were analyzed from tone trials while the UR and PT periods were analyzed from airpuff trials. In addi- tion, a PT period was analyzed for tone alone trials (PTcs). This period was comprised of a 2 s period commencing from tone off- set. Only four of 35 neurons (1 1%) responded in the PT period during tone alone presentations. This contrasts with the 15 of 35 (43%) neurons that were affected during the PT period on air- puff alone trials. Examples of PT inhibitory responses during trace conditioning, delay conditioning, and unpaired stimulation are shown in Figure 5.
0 1 2 3 4 5 6 7 8 9 1 0 1 1 1 2 1 3 1 4 1 5 Basdine Firing Rate(Hz)
FIGURE 3. Frequency distribution of CAI pyramidal neurons according to their 2 s baseline firing rate. Note the large percentage of cells with rates less than 0.5 Hz. The inset indicates all of the spikes (N = 44) collected during the recording session (77 min) for one of these neurons. The spikes are superimposed upon one an- other to indicate that the signal represents the action potential of a well-isolated pyramidal neuron.
196 WElSS ETAL.
-1.0 4.5 00 0.5 1.0 1.5 Sec2.0
. . . . . . i i : .
t i
C : : : :
i i : : : :
IY
-1.0 4.5 0.0 0.5 1.0 1.5 sec2.0
FIGURE 4. This figure presents data from an excitatory pyra- midal neuron (left) and an inhibitory pyramidal neuron (right) recorded during trace conditioning. A and B show the behavioral data on top (individual trial sweeps of NM extension) which have been sorted according to the latency of response, and a raster of neural data which are respectively sorted is shown below. Note that
The number of cells from conditioned rabbits with significant responses during the trial period was found to be significantly greater than the expected number of responsive cells based upon recordings during unpaired presentations of tone and airpuff (58% vs. 37%, 2 = 11.2, P < 0.01). A similar analysis for cells that changed their response rate only during the PT period indi- cated that there was no significant difference for neurons from conditioned rabbits or rabbits presented with unpaired stimuli (13% vs. 14%, 2 = 0.22, ns). These data are presented graphi- cally in Figure 6. This figure indicates the percentage of neurons
.. i i i i . . . . . 1; i f
" :: i l .. :: .. ::
... ii i i . . . . . .. I .-- I: i i ii li fi ii
. .- .. .. :: :: ........ !i i i !! i i i i i i i! ii ' I I ' I 1 I
.... ...... . . . . . . I"" I t ' l l I ' " I " " 1 " " I ltlll
-3 -2 -1 0 1 2 3 4 SecS
:: :: :: :: .. ::
,. :
.... .. .. .. i; . i' :: D .. .. .. .. i i
0.30
0.25 1 0.20
0.15
0.10
0.05
0.00 -3 -2 -1 0 1 2 3 4 SecS
each example includes data from 10 trials, and that the time scales are different for the two neurons. Parts C and D indicate the aver- age behavioral response for the 10 trials with the tone and airpuff markers, and parts E and F represent a histogram of the neural ac- tivity over time (0 time is tone onset, ordinate is mean spiked10 ms bin).
with significant excitation or inhibition for each of the trial pe- riods from conditioned and control rabbits.
In addition to CA1 neurons, a smaller population of putative pyramidal neurons from CA3 was recorded during trace condi- tioning (N = 19). Data from these neurons are summarized in Table 3. Three neurons (16%) significantly changed their firing rate during the CS period, four neurons (21%) significantly changed their firing rate during the trace period, five neurons (26%) significantly changed their firing rate during the UR pe- riod and eight neurons (42%) significantly changed their firing

HIPPOCAMPAL NEURONS AND TRACE CONDITIONING 197
TABLE 1.
CAI, Trace Conditioning CRs > 60%
cs Trace UR PT
Excitation 13(14%) 10(11%) 23(25%) 14(15%) Inhibition 8(9%) 16(17%) 21(23%) 39(42%) Total 21(23%) 26(28%) 44(47%) 53(57%) Total trial periods only: 53/93(57%) Total PT period only: 13/93 (14%)
~~
Summary of the results of statistical analyses to determine when dur- ing the trial period significant changes in firing rate occurred for CA1 pyramidal neurons during trace conditioning. The percentages repre- sent the proportion of cells out of all neurons for each section of the table, i.e., 93. An overall summary for the percentage of cells with sig- nificantly related activity anytime during the trial period, i.e., regard- less of activity in the PT period, or during the PT period only, i.e., no significant change during the trial periods, is included.
rate during the PT period. The activity of these cells during the trial periods are less skewed than those of CA1 neurons, i.e. the significant activity was not concentrated in the UR period. In all trial periods both excitatory and inhibitory changes were noted to occur, and only one of seven neurons that were responsive dur- ing the trial periods exhibited excitation in both the trace and UR periods. During the PT period only inhibition was observed for this population of putative pyramidal neurons from area CA3.
Data from another small population (N = 13) of putative pyramidal neurons in areas CAI and CA3 were collected during delay conditioning (400 ms CS, 150 ms coterminating US). These data are summarized in Table 4. The data indicate that five of 13 neurons (38%) were responsive during some portion of the trial period, and four of 13 (31%) neurons were responsive only dur- ing the PT period. During the CS period only one of the 13 neu-
TABLE 2.
CA1, Unpaired Stimuli
cs Trace UR PT PTcs
Excitation 3(9%) 3(9%) 5(14%) 3(9%) I(%) Inhibition 1(3%) 3(9%) 12(34%) 3(9%)
Total trial periods only: 13/35 (37%) Total PT period only: 5/35 (14%)
Total 4(11%) 4(11%) 8(23%) 15(43%) 4(11%)
Summary of the results of statistical analyses to determine when dur- ing the trial period significant changes in firing rate occurred for CA1 pyramidal neurons during unpaired presentations of tones and airpuffs to control rabbits. The percentages represent the proportion of cells out of all neurons for each section of the table, i.e., 35. An overall summary for the percentage of cells with significantly related activity anytime during the trial period, i.e., regardless of activity in the PT period, or exclusively during the PT period is included. The PT period on CS alone trials is also summarized.
4 NM
C14T07
". - ... .. . . . . .. c2
. I . . . -
.. i i - Trace .. I f .. .. .. .. ! i .. . .
I .
.. .. a . :
. . i i i i
!I '! !!
. - ii ::
. * 11 . -.
v .. I
.. i i
3 C25D03 Dd ay . .. . .. NM ! ig i ::
f if
: if f 1;
i g - . . .. . .. . .. . .. . .. : :: : :: . .. . I ...
. . . .. . .. i i i A2 . .. : :: : ..
* : :: : ::
. .. i f! . .. j :
, I I 1 1 1 1 1 I I 1 1 1
C NM
C08TP03 Puffs . ". . .. .. * -. . .I - a . . . . . . . * . . . :&. . . . .. . . . : g-.. I -. - . . . - .
.. . A2 ... . . .
..I . 4 . *
. .
* . . :-*.
C08TP03 1 : ti Tones 1 ::
: ' ..
. . . A2 . .
I - . .
- . . -
. . . . . . . . . . . . . .. . I .- ... . - . . . . .
I .i
1 1 ~ 1 1 1 1 1 1 1 1 1 1 1 1 1 I 1 1 1 1 1 ) 1 1 1 1 1 1 1
-2 0 2 4 6 sec FIGURE 5. Examples of post-trial (PT) inhibition during dif- ferent paradigms. In each part of the figure, the average behavioral response and a raster of single neuron activity are presented. As in- dicated at the bottom, 10 s of time are presented (3 s preCS and 7 s from tone onset). A: Trace conditioning. B: Delay conditioning. C: Airpuff alone trials during unpaired stimulation. D: Tone alone trials during unpaired stimulation from the same session as that in part c.

198 WEZSS ET AL.
CS Trace UR PT PTcs TABLE4. 30 7 20 .j Excitation n 10
% Sig o Resp
10
20
30
40 40 Conditioned U .x.,.: 1 Controls
50
FIGURE 6. This histogram indicates the percentage of neurons with significant excitation or inhibition (P 5 0.01 on t-test or bi- nomial test) for each of the trial periods and the post-trial period. The conditioned rabbits received paired tones and airpuffs. The con- trol rabbits received explicitly unpaired tones and airpuffs. The con- ditioned rabbits yielded a greater percentage of neurons with a sig- nificant change in activity whether it be excitation or inhibition in all periods except PTcs (post-trial period on tone alone trials). None of the cells from conditioned rabbits had a significant change in rate during the PTcs period.
rons responded; this cell was excited by the stimulus. During the UR period five neurons responded; three were excited and two were inhibited. During the PT period five neurons responded, all of these neurons were inhibited. An example of activity from a putative pyramidal cell during delay conditioning is shown in
TABLE 3.
CA3, Trace Conditioning, CRs > 60%
cs Trace UR PT
Excitation 2(11%) 1(5%) 1(5%) O(OY0) Inhibition 1(5%) 3(16%) 4(21%) 8(42%) Total 3(16Yo) 4(21%) 5(26%) 8(42”/0) Total trial periods only: 7/19(37%) Total PT period only: 2/19(11%)
Summary of the results of statistical analyses to determine when dur- ing the trial period significant changes in firing rate occurred for CA3 pyramidal neurons during trace conditioning. The percentages repre- sent the proportion of cells out of all neurons for each section of the table, i.e., 79. An overall summary for the percentage of cells with sig- nificantly related activity anytime during the trial period, i.e., regard- less of activity during the PT period, or exclusively during the PT pe- riod is included.
CAI and 3, Delay Conditioning, 87-97% CRs ~~
cs UR PT
Excitation 1(8%) 3( 23%) O(O%) Inhibition O(OY0) 2(15%) 5 (38%) Total 1 (SO/O) 5(38%) 5( 38%) Total trial periods only: 5/13(38%) Total PT period only: 4/13(31%)
Summary of the results of statistical analyses to determine when dur- ing the trial period significant changes in firing rate occurred for pyra- midal neurons during delay conditioning. The percentages represent the proportion of cells out of all neurons, i.e., 13. An overall summary for the percentage of cells with significantly related activity anytime during the trial period, i.e., regardless of activity during the PT period, or exclusively during the PT period is included. Due to the small N, the percentages from this table should be interpreted with caution. The trace period is not included since it does not exist in the delay para- digm.
Figure 7. This cell exhibited one of the more robust responses that was observed in this study.
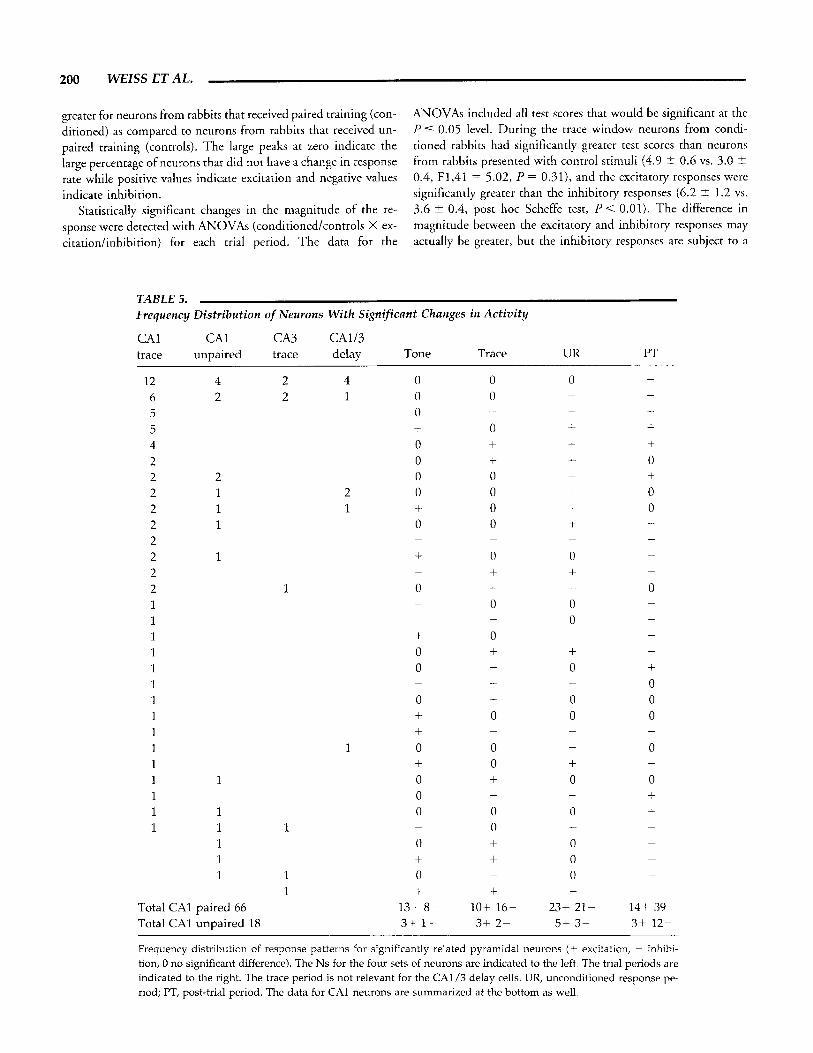
The analyses provided by Tables 1-4 still mask the great di- versity of responses which were found to occur, especially during the hippocampally dependent trace paradigm. A better apprecia- tion for the diversity of responses can be obtained by examining the distribution of response types as shown in Table 5. This table provides a frequency distribution for each response pattern en- countered for the four sets of data. The most frequent response pattern is listed at the top of the table. Of particular interest is the frequent observation of inhibitory responses, and the great va- riety of response patterns, i.e. many patterns were only found once.
Magnitude of Significant Responses
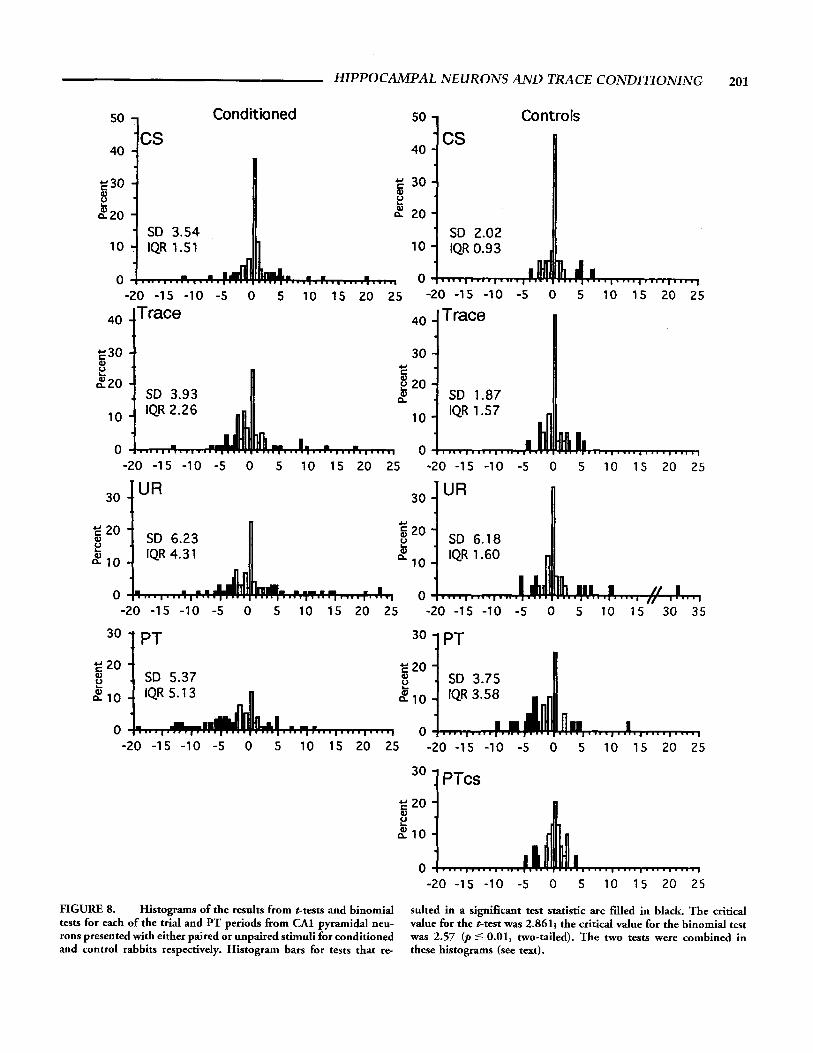
Neurons from conditioned rabbits were more likely to exhibit significant changes in firing rate than neurons from control rab- bits presented with unpaired stimuli. However, that result does not indicate the magnitude of the change. These data are indi- cated in the distribution of test scores as presented in Figure 8. This figure presents a frequency distribution of the t scores and z scores for the different analysis windows in each group (condi- tioned/controls). The t scores represent the result of the t-tests which were used to perform a parametric comparison for the time period of interest with the baseline firing rate. The z scores rep- resent the result of the binomial test which was used to perform a nonparametric comparison for slowly firing cells.
The effect of conditioning on the magnitude of response can best be appreciated by examining the tails of the graphs, i.e., the test values of neurons from conditioned rabbits are more dispersed than the values of neurons from control rabbits. This was con- firmed by comparing the SD and interquartile range (IQR) for each graph. In all of the analysis windows the two measures were

HIPPOCAMPAL NEURONS A N D TRACE CONDITIONING
5'
4 -
3 -
2 -
1 -
199
A1
I, I I I, I, ms 3.0
I I
I NM I
A1 I 1
I I l l I . I 1 1 1 1 1 1 1 1 II
I 1 I
I , I 111.1
I
I I I I I I I I I I
I
1-L Tone 17 , Puff C21 HD02.A1,2
FIGURE 7. Example of behavior and neural activity for two CAI pyramidal neurons collected during delay conditioning. The tone CS was on from 04.40 s, the airpuff was on from 0.25-0.40 s. The top section includes the averaged behavioral response (NM) and a raster
for each of the two cells (A1 and A2). A histogram of spikesllo ms bin is shown below the rasters for each of the two cells. The insets represent the mean (2 1 SD) action potential for the respective neu- ron.
200 WEZSS ET AL.
greater for neurons from rabbits that received paired training (con- ditioned) as compared to neurons from rabbits that received un- paired training (controls). The large peaks at zero indicate the large percentage of neurons that did not have a change in response rate while positive values indicate excitation and negative values indicate inhibition.
Statistically significant changes in the magnitude of the re- sponse were detected with ANOVAs (conditioned/controls X ex- citatiodinhibition) for each trial period. The data for the
ANOVAs included all test scores that would be significant at the 2'5 0.05 level. During the trace window neurons from condi- tioned rabbits had significantly greater test scores than neurons from rabbits presented with control stimuli (4.9 i 0.6 vs. 3.0 t 0.4, F1,41 = 5.02, P = 0.31), and the excitatory responses were significantly greater than the inhibitory responses (6.2 rt 1.2 vs. 3.6 2 0.4, post hoc Scheffe test, P < 0.01). The difference in magnitude between the excitatory and inhibitory responses may actually be greater, but the inhibitory responses are subject to a
TABLE 5. Frequency Distribution of Neurons W i t h Significant Changes in Act iv i ty
2 1
1
1
1
CA 1 CA1 CA3 CA1/3 trace unpaired trace delay Tone Trace UR PT
- 12 4 2 4 0 0 0 - - 6 2 2 1 0 0
5 0 5 + 0 + + 4 0 + + + 2 0 + + 0 2 0 0 + + 2 0 0 + 0 2 + 0 + 0 2 0 0 + 2 2 + 0 0 2 2 0
0 0 1 0 1
1 + 0 1 0 + + 1 0 0 +
0 1 1 0 0 0 1 + 0 0 0 1 +
0 1 0 0 1 + 0 + 1 1 0 + 0 0
+ 1 0 1 1 0 0 0 + 1 1 1
- - -
- - - - -
- - + + -
0 - -
- -
- - - - -
-
-
- - -
-
- - -
-
-
- -
- - 0 -
- 1 0 + 0 1 + + 0
0 1 1 0 1 + + +
-
- -
-
Total CA1 paired 66 13+ 8- 10+ 16- 23+ 21- 14+ 39- Total CA1 unpaired 18 3+ 1- 3+ 2- 5+ 3- 3+ 12-
Frequency distribution of response patterns for significantly related pyramidal neurons ( + excitation, - inhibi- tion, 0 no significant difference). The Ns for the four sets of neurons are indicated to the left. The trial periods are indicated to the right. The trace period is not relevant for the CA1/3 delay cells. UR, unconditioned response pe- riod; PT, post-trial period. The data for CA1 neurons are summarized at the bottom as well.
HIPPOCAMPAL NEURONS A N D TRACE CONDITIONING 201
Conditioned 1
40 lcs E.30 P) 1 2 2 20
50
40
g 30 e 0)
2 20 SD 3.54
0
Controls 1
-20 -15 -10 -5 0 5 10 15 20 25 -20 -15 -10 -5 0 5 10 15 20 25
-20 -15 -10 -5 0 5 10 15 20 25 -20 -15 -10 -5 0 5 10 15 30 35
30 1 PT 30 3PT
-20 -15 -10 -5 0 5 10 15 20 25 -20 -15 -10 -5 0 5 10 15 20 25
-20 -15 -10 -5 0 5 10 15 20 25
FIGURE 8. Histograms of the results from t-tests and binomial tests for each of the trial and PT periods from CAI pyramidal neu- rons presented with either paired or unpaired stimuli for conditioned and control rabbits respectively. Histogram bars for tests that re-
sulted in a significant test statistic are filled in black. The critical value for the t-test was 2.861; the critical value for the binomial test was 2.57 (p 5 0.01, two-tailed). The two tests were combined in these histograms (see text).

202 WEISS ETAL.
“floor effect.” During the UR period the excitatory responses were also significantly greater in magnitude than the inhibitory re- sponses (8.8 i 1.3 vs. 4.4 & 0.6, F1,59 = 7.44, P < 0.01). During the CS and PT periods there were no statistically signif- icant differences in magnitude of response between the groups or between the response types.
CR vs. nonCR Trials The analysis of response magnitude presented above included
all trials during a session with at least 60% CRs. T o determine if there was a difference in the firing rate of individual neurons ac- cording to whether or not a CR was emitted, an ANOVA with planned comparisons was performed for cells with a firing rate that permitted a parametric analysis, and which were recorded during sessions where CRs were exhibited on 60-8 1 % of the tri- als (N = 32). The ANOVA was designed to detect changes in the firing rate of each cell as a function of response type (CWnonCR) and analysis window (preCS, CS trace, U R and PT). It included ten trials with CRs and ten trials without CRs (nonCRs). Fewer trials were used if there were too few nonCRs in the dataset. Trials with the largest behavioral response and smoothest baseline were selected for the ANOVA to maximize the detection of differences between the two types of responses.
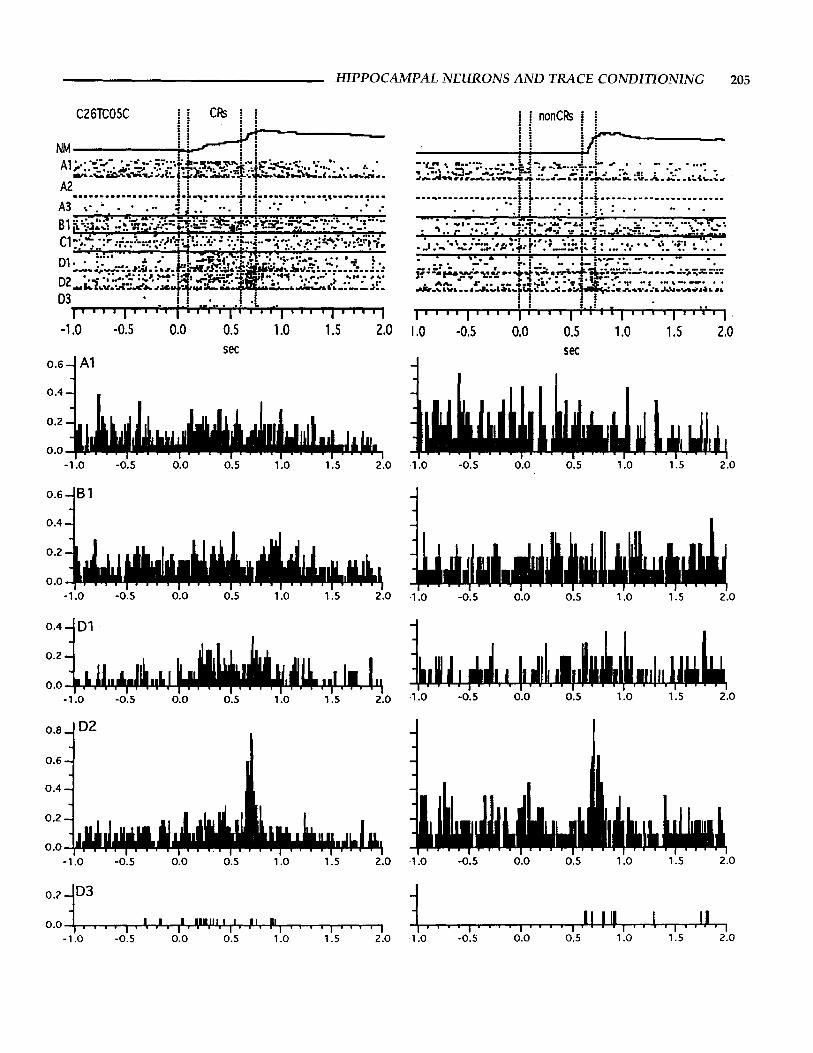
The results indicate that 69% of the cells had a significant in- teraction of response type and analysis window. This effect was quite varied in that some cells responded more during CR trials while other cells responded more during nonCR trials. The main effect of response type (CR/nonCR) was robust enough to ex- hibit a significant difference in 38% of the cells. Examples of the different response patterns, separated into CR and nonCR trials, can be seen in Figure 9. Differences in response profiles were also found among simultaneously recorded cells as shown in Figure 10.
The last response type is shown in Figure 11. This response was generated from one of the few interneurons recorded during these experiments. It is shown because of its unique response char- acteristics which was similar to that described by Berger et al. (1 983) as an inhibitory interneuron.
Comparison with Previous Rabbit Data
The firing rate of hippocampal pyramidal cells has often been noted to form a “temporal neural model” of the average behav- ioral response in eyeblink conditioning studies (Berger et al., 1976), i.e., the firing rate is highly correlated with the amplitude and duration of the average eyeblink. Berger et al. (1983) recorded the activity of CAl/CA3 pyramidal cells during paired condi- tioning trials in a hippocampally independent delay paradigm. The cells were identified by antidromic activation, and some were confirmed with the collision test. The majority of the pyramidal cells (83%, 40148) in their study exhibited increased activity dur- ing either the CS period, US period or both periods (the per-
centage of inhibitory responses for collided cells was not explic- itly stated).
Multiple-unit recording studies during trace eyeblink condi- tioning have also found significantly related activity during the trial period (Solomon et al., 1986; Woodruff-Pak et a]., 1987). Prior to the emergence of behavioral CRs the increased activity began shortly after CS onset and then decayed shortly after CS offset; the activity appeared again in the US period where it mod- eled the amplitude-time course of the behavioral response. As CRs emerged, and the percent of CRs increased, the increased activ- ity shifted to the later portion of the trace period and continued into the US period. In all of these studies the percentage of sig- nificantly related cells is surprisingly large, and surprisingly biased towards excitatory responses.
The current report examined the electrophysiological response of single pyramidal neurons, but under the conditions of hip- pocampally dependent trace eyeblink conditioning. A more de- tailed analysis was also reported by separating the percentage of responsive cells for each of the time windows, i.e., preCS, CS, trace, UR, and PT. The analysis of the PT period was especially interesting since many cells changed their activity during this time period. Berger et al. (1983) noted that during delay conditioning few pyramidal neurons, but many interneurons, responded dur- ing the PT period.
While the percentage of statistically related pyramidal neurons in the present study is less than that reported by Berger et al. (1983), i.e., 57% vs. 83%, the percentage becomes more equiv- alent if the silent cells are omitted from the analysis. Such cells were also likely to have been omitted by Solomon et al. (1986), who eliminated records when the average number of spikes in the preCS period was less than 30. A reanalysis of our data, with silent cells omitted, indicates that 50 of 59 neurons (85%) had statis- tically significant changes in firing rate during the trial period. Although this result is nearly identical to that of Berger et al. ( I 983), the smaller percentage obtained while including silent cells in the current data more accurately quantifies the percent- age of responsive CA1 pyramidal cells. The result with silent cells included is also more similar to the number of responsive neu- rons found in other species and other tasks (see below). In addi- tion, the analysis of nonsilent cells yields a large number of in- hibitory responses which was not emphasized in previous studies. Berger et al. (1983) noted inhibitory responses, but only in four of 16 cells which were likely to have been silent pyramidal neu-
FIGURE 9. Examples of different response patterns for five CA1 pyramidal neurons (A-E) during trials with and without behavioral CRs. The data from trials with CRs are shown on the left; the data from nonCR trials are shown on the right. Each figure includes the average behavioral response and a raster of the neural activity. Notice the variability in response in terms of the trial window and response type. Especially interesting is the increased activity during the UR period for nonCR trials from cells C and E, and the inhibition dur- ing the trace period of nonCR trials for cell B1. The difference in activity for cell D resulted in a significant interaction according to the ANOVA (F4,76 = 6.2; see text for details) which was due to the greater response rate during the trace period for CR trials as com- pared to nonCR trials.

HIPPOCAMPAL NEURONS AND TAACE CONDITIONING 203
A
CRs nonCRs i ! 2605A.61 i : : I i !.i ... \ -4.. . . i i . I - ;
i ; . . i-.i i i i i
-1ro 4!5 do d. 5 l!O 1!5 21.0
: i . . . . : : : : : : : : : :
* . .. : : i i
1 1 . 1 - 1 - .
* . i i
... i i" - . . . r . ; . : I - - -..*- -.*. - ...... . . . . . . . . . . - . . . .. ..... .%-, ... i : . . . i i . . ...
.! i .... . : B . . .. : .... --!.. :. ............. .....--. ... ? I . . . . . . . . . . . . . : : : . . . L : .... ,.: ..: . . . . . . . :.: ...... -.,-., . . . . . . . .. I " " I " " . " * ' . . '
-1to 4 l S 0.0 0.5 l!O 115 2 0
C
i !
. . lOTlO.CD3 i i i : : : : : : ..-. . - - . . . .
a . . . . -- I {
i i i i . .
. . . . . . -.: .: . . . . . . . . . . ..- . - . : : . . . i + . _ . I . .
4 i - : : : 'I * . - . .- - :.: - . - i i . . i i .
1 9 = I . I 8 I 1 . 1 I I 3 . I 1 ' I ' - - ' I -1.0 -0.5 0.0 0.5 1.0 1.5 2.0
. . . . . . - - .- -..- . . - . . i 'i - * . . . . . . . . . . . : : - .
. . . . . . . . .--: : ... :
: , . . . . i ' ". ...- . . . - . --.. . . I. - - .. : . .
. . : : ___L 15T13.D2 . . j I i i : i : : . . . . . . . . . . . .-.- -. -..---. .......... - .. . . i i . . i i .. i i .--... ...........
- i i *- .*
........... D ..i i _... .! i i .I" . - .. . . . . . . . . . . : ..).. ........ rl
i i i -?.. - . . . . . j y-..-. * . . . . . . . . .
.. ....: ! : : --....-. t .! . . . . . . -l!O -0!5 do 0'5 l!O 115 2!0
. . . . . : ; . . : -:.. ... : : : : : :
-.-.-.. .......--. i i .....................
. . . .
E
. . i ; 15T14.81 1- : i . . i i i i i i . . ....... . 1.I - .-- - . - . . I 4. -. - - ..i. -. . . . . . . . . .- . . . . a . . . :- : i i : : - . - - . . . . . ... - ... - .. . . . . . . . . . . a . . . . .
a . . .
i i . . : i . . . . . . . . . . . . . . . . . . . . . . . . . . . . . . . . . . . . . . . . . . . . - . . . . :-: - . . . - _ ....... i i -. . : :- -: . ,- ... -. . . . -
I . . " I " ' - l = " I " " I " " I . " ' I -1.0 0 . 5 0.0 0.5 1.0 1.5 2.0
: : - i
i i
i i : : : :
. :- ...... -. .......... : :
. . . . . . . . . . . . . . . . . . -.- .-..
: : i -1. .- . . i j t ?
. - - . - t ! ~. . . . . . . ....... . . . . . . . . . . . . . . . . . ..- . . . . . . . . . . i . i - . - . - . . : : ......... . . . . . . . :- :- .. * i ' i . . -. . .--. f j... . ' j j . - - . . - ; ! I. i - - - f i - - -. . . . . . . . . . . i i - . . . . - - . - . . . . . . . . . . . . .
1 . ' . ' I "" I " . I I " " I " ' ' I ' ' " 1 -1.0 -0.5 0.0 0.5 1.0 1.5 2.0
i i : : i i . .
: : . . . . i i . . . . .. :-:. ... . I . f .... - . . . : : : *
-. ........ ..-...-a ! !.. . . . i"'!" .... . -... ' 1 ! t ..... * "!.. ........
I .. i . . - -..---.. . . . . *i i-* .- i i ..[ "' .-..- -.. * . . . . . . . . . . . . . . ---- .-.: . . . . .:. . . . . . . . . . . : : . . . . . i ; . i . . r . . . . . . . . .
? I * ? . . . . ............. .- . . . . . : : . . . . -1fo .of5 0'0 d 5 l!O 115 21.0
sec sec
rons (slow rate, broad action potential, but not antidromically or orthodromically activated).
Aside from differences in the proportion of responsive cells be- tween our data and those of Berger et al. (1983), we also found more varied and less robust temporal modeling of neural activity with the eyeblink response. This may reflect an even greater vari- ability in phase relations between neural activity and CRS as noted by Berger et al. (1983). This also suggests that different hip- pocampal neurons are mediating different aspects of the condi- tioned response, just as different neurons within a cluster of recorded cells exhibit graded responses to spatial location (Eichenbaum et al., 1989), and to different phases ofactivity dur- ing a delayed matching to sample task in the rat (Hampson et al., 1993). These data also suggest that robust temporally related neural activity is not necessarily indicative of more complex pro- cessing. Instead, the most robust activity may be related to the most simple associations, e.g., delay conditioning, while more dif- ficult associations may require the activation of different neurons which mediate different aspects of the response, especially throughout the long trace interval.
The differences between these data and those reported by Berger et al. (1983) may be due to differences between the record- ing techniques (single electrode vs. multiple probes), condition- ing paradigms (trace vs. delay), amount of training, rate of ac- quisition and consolidation of learning, or other factors. In the trace paradigm the CS is shorter, the interstimulus interval is longer, and learning occurs more slowly. The responses are also less stereotypical than those generally observed with delay condi- tioning paradigms. In this study we have only analyzed data from training days in which a minimum of 60% CRs were exhibited, i.e. the rabbits could be considered overtrained. In Berger’s delay conditioning study the rabbits reached asymptotic conditioning levels within I or 2 days, and cells were recorded only up to 7 days. Our population of rabbits showed relatively slow acquisi- tion rates, and consolidation of the conditioned response was likely well under way during many of the recording sessions. More cells may have reduced their activity rate during the consolida- tion phase of learning (Sears and Steinmetz, 1990) as the neural substrate for the association between the tone and airpuff is shifted from the hippocampus to the cerebral cortex for permanent stor- age (Squire, 1987; Rolls and Treves, 1994; Disterhoft et a]., 1996). These differences may or may not account for the differ- ences in the percentage of significantly related neurons. The data shown in Figure 9 do, however, indicate that simultaneously recorded neurons can exhibit quite different response profiles for a given state of learning, or position on a learning curve. The cur- rent study also differed from Berger’s by including a large popu- lation of “silent” cells, i.e., neurons with a 2 s baseline firing rate of 0.5 Hz or less. These cells would have been too difficult to study in behaving animals prior to the advent or multichannel single neuron recording techniques and software discriminators.
Comparison With Other Tasks and Species Single neuron studies from area CAI in other species indicate
that the percentage of neurons which respond to specific stimuli
during memory related tasks converge more closely with the per- centages reported here than with those from previous studies us- ing the eyeblink paradigm. In a continuous delayed nonmatch to sample task, Otto and Eichenbaum (1992) found that 46% of CA1 neurons in the rat had significant increases in firing rate dur- ing some portion of the trial. In a nonspatial radial maze task, Young et al. (1994) reported that 77% of the recorded CAI and CA3 neurons were responsive, but different neurons in their sam- ple were responsive to different aspects of the task, e.g., cue type, spatial location, or relative position on the goal arm.
Most of the reports from the primate literature area in line with our results as well. Riches et al. (1991) reported that GOYO of CA1 neurons (55 of 92) were responsive during a delayed matching to sample task, and Wilson et al. (1990) reported that 38% (35 of 92) of neurons in the monkey were response related on a delayed matching to sample task. In both of the reports on primates, both excitatory and inhibitory responses were noted. Eifuku et al. (1995) also reported that either type of response was found for 27% of cells recorded throughout the primate hip- pocampal formation during a place-dependent, conditional, stim-. ulus-response association task. Other single neuron studies have reported even lower percentages of responsive neurons. For ex- ample, Cahusac and Miyashita (1988) found that 9% (121137) of CA1 neurons in the monkey exhibited differential responses during instrumental conditioning; Tamura et al. (1990) found that only 9% (28/299) of CAI neurons responded to auditory and/or visual stimuli in a delayed matching to sample task; and Miyashita et al. (1989) reported that only 14% of hippocampal formation neurons in the primate were related to a conditional spatial response task. These percentages of responsive neurons are what would be expected if the hippocampus is to function with- out becoming specialized for one association (Cahusac et al., 1993).
Implications of Response Patterns The activity of hippocampal pyramidal cells was significantly
correlated with the average conditioned eyeblink response for a majority of the cells in the delay paradigm as a result of the tem- poral pairing of a CS (tone) and US (airpuff) which leads to be- havioral conditioning (Berger et al., 1976). Our data from ani-
FIGURE 10. Example of the responses from several simultane- ously recorded neurons during trace eyeblink conditioning. The left side has data from trials with CRs, the right side has data from nonCR trials. The top trace (NM) represents the average behavioral response. Below this are rasters for the activity from simultaneously recorded neurons. Neurons recorded from the same wire electrode are coded with the same letter, e.g. A1-A3, and are separated by dashed lines. Neurons recorded from different wires are separated by solid lines and are indicated by different letters, i.e., A-D. The time of tone and airpuff presentation are indicated by the vertical lines. Below each set of rasters are histograms of the activity for five of the neurons. The ordinate represents the mean number of spikes per 10 ms bin. The response rate for cells B1, D1 and D2 had sig- nificant interactions of response type and analysis period according to the ANOVA (see text for details).
HIPPOCAMPAL NEURONS A N D TRACE CONDITIONING 205
. . 03 . 1.1 ._.... . f .: ..
I " " I " ' I I ' 1 1 ' 1 ' ' I ' I ' " ' 1 -1.0 -0.5 0.0 0.5 1 .o 1.5 2.0
sec
0.4
0.2
0 .0 ...
-1 .o -0.5 0.0 0.5 1 .o 1.5 2.0
0.4
0.2
o n I " ' ' I " m m - .-
-1 .o -0.5 0.0 0.5 1 .o 1.5 2.0
0.2
0.0 -1 .o -0.5 0.0 0.5 1 .o 1.5 2.0
0.8 02
0.6 1 0.4
0.2
0.0 -l:o -0:s 0:o 0.5 1 :o 1 :5 2:o
. . , I . 1. ,', w,'II, !I, !II , . . , I * , . , 1 -1 .o -0.5 0.0 0.5 1 .o 1.5 2 .o
i i nonCRs f f i i ! i
. . . . . . : . : : i .
i. .I. I .. i i . . I " ' I " ' I " ' I " # I 1 .
1.0 -0.5 0.0 0.5 1 .o 1.5 2.0 SeC
I
. . . . . . . . . . . . . . . . I . I . . . . , . . . . I .1.0 -0.5 0.0 0.5 1 .o 1.5 2.0
I
' . . . . . . . . . . . .
.1.0 -0.5 0.0 0.5 1 .o 1.5 2.0
.1.0 -0.5 0.0 0.5 1 .o 1.5 2.0
. . . . I ' . . . I . . . . I " . . I . . , . I . . . . , .1.0 -0.5 0.0 0.5 1 .o 1.5 2.0
.1 .o -0.5 0.0 0.5 1 .o 1.5 2.0
206 W E B S ET AL.
mals trained with unpaired stimuli support this conclusion. Fewer cells with significantly related activity during the trial period were found using this control paradigm. Furthermore, during the trace period the responsive neurons recorded during paired training re- sulted in greater increases in excitation or inhibition than the re- sponsive neurons recorded during unpaired presentations of the stimuli. However, the overall picture which arises from the data reported here in hippocampally dependent trace conditioning is quite different from that reported in the delay conditioning stud- ies. There is not a strong tendency for temporal modeling of the sort emphasized by Berger et al. (1983) although some neurons did show excitatory responses which modeled the average condi- tioned response (Fig. 4A), and Berger et al. noted that many cells responded only during a portion of the trial period. The fact that inhibition and excitation were about equal is also inconsistent with the predominant report of excitatory temporal modeling stressed by Berger et al. (1983). It is quite striking that the most robust example of temporal modeling found in the present Sam- ple of neurons was in a cell recorded from a delay conditioned rabbit (Fig. 7). This neuron fits the picture stressed by Berger et al. (1983) quite well and suggests that there may be an interest- ing and important difference in the temporal pattern of engage- ment of CAI pyramidal neurons in hippocampally dependent and independent tasks.
The fact that delay conditioning can be mediated in the ab- sence of a functioning hippocampus suggests that the hippocam- pus may be responding to the configuration of the environmen- tal cues and temporally related afferent input in an obligatory nature whether or not the processing is required for the develop- ment of an associative response (Cohen and Eichenbaum, 1993). Alternatively, the low percentage of responsive cells recorded in the present sample of delay conditioned neurons suggests that the effects of delay conditioning on CAI neurons should be re-ex- amined using indwelling multichannel recording techniques (al- though the sample of neurons recorded during delay condition- ing was small). These techniques have advantages for quantifying the percentage of responsive cells that is not available to more tra- ditional single neuron recording methods, especially given the number of silent cells that need to be detected and considered. Modern waveform separation techniques are also a more power- ful method for insuring that single units are being analyzed (McNaughton et al., 1983; Thompson and Best, 1990; Jung and McNaughton, 1993; Wilson and McNaughton, 1993; Jung et al., 1994).
0.25
0.20
0.1 5
0.10
0.05
0.00 -1.0 -0.5 0.0 0.5 1.0 1.5 2.0
SeC
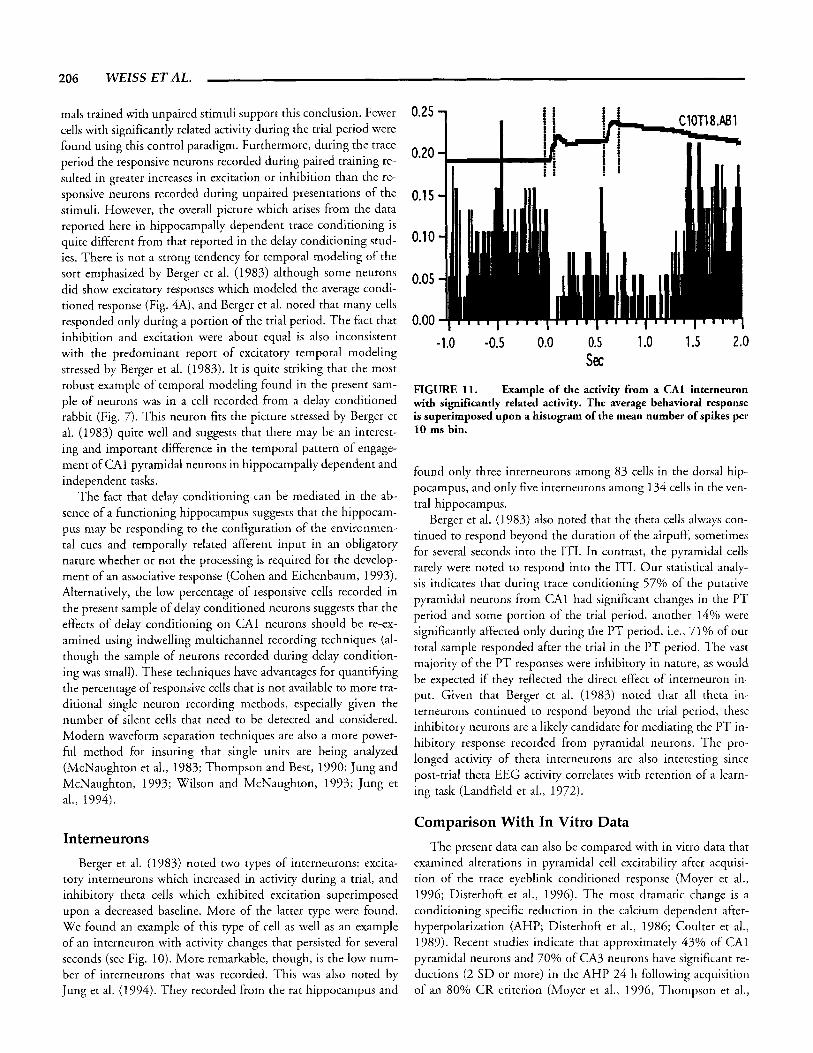
FIGURE 11. Fxample of the activity from a CA1 interneuron with significantly related activity. The average behavioral response is superimposed upon a histogram of the mean number of spikes per 10 ms bin.
found only three interneurons among 83 cells in the dorsal hip- pocampus, and only five interneurons among 134 cells in the ven- tral hippocampus.
Berger et al. (1983) also noted that the theta cells always con- tinued to respond beyond the duration of the airpuff, sometimes for several seconds into the ITI. In contrast, the pyramidal cells rarely were noted to respond into the ITI. Our statistical analy- sis indicates that during trace conditioning 57% of the putative pyramidal neurons from CA1 had significant changes in the PT period and some portion of the trial period, another 140/0 were significantly affected only during the PT period, i.e., 71% of our total sample responded after the trial in the PT period. The vast majority of the PT responses were inhibitory in nature, as would be expected if they reflected the direct effect of interneuron in- put. Given that Berger et al. (1983) noted that all theta in- terneurons continued to respond beyond the trial period, these inhibitory neurons are a likely candidate for mediating the PT in- hibitory response recorded from pyramidal neurons. The pro- longed activity of theta interneurons are also interesting since post-trial theta EEG activity correlates with retention of a learn- ing task (Landfield et al., 1972).
Interneurons Berger et al. (1983) noted two types of interneurons: excita-
tory interneurons which increased in activity during a trial, and inhibitory theta cells which exhibited excitation superimposed upon a decreased baseline. More of the latter type were found. We found an example of this type of cell as well as an example of an interneuron with activity changes that persisted for several seconds (see Fig. 10). More remarkable, though, is the low num- ber of interneurons that was recorded. This was also noted by Jung et al. (1994). They recorded from the rat hippocampus and
Comparison With In Vitro Data The present data can also be compared with in vitro data that
examined alterations in pyramidal cell excitability after acquisi- tion of the trace eyeblink conditioned response (Moyer et al., 1996; Disterhoft et al., 1996). The most dramatic change is a conditioning specific reduction in the calcium dependent after- hyperpolarization (AHP; Disterhoft et al., 1986; Coulter et al., 1989). Recent studies indicate that approximately 43% of CA1 pyramidal neurons and 70% of CA3 neurons have significant re- ductions (2 SD or more) in the AHP 24 h following acquisition of an 80% CR criterion (Moyer et al., 1996, Thompson et al.,
HIPPOCAMPAL NEURONS A N D TRACE CONDITIONING 207
I996a). This result parallels the percentage of significantly related cells (57%) found in the current study.
Both the in vivo and in vitro experiments attempted to eval- uate all pyramidal neurons available for study. However, the two experiments measure different aspects of neuronal function. A de- crease in the AHP, or spike frequency accommodation, reflects a postsynaptic increase in excitability that may manifest itself if spe- cific and appropriate convergence of synaptic inputs occur. Since approximately equal numbers of inhibitory and excitatory re- sponses were recorded in vivo in the current experiments, it is clear that the postsynaptic excitability changes reflected in the al- tered AHP and accommodation of pyramidal neurons reflect only part of the alterations which mitst be occurring in the hip- pocampus during trace eyeblink conditioning. It is also clear that important synaptically mediated inhibitory changes are occurring which are not reflected in the postsynaptic excitability measures. A closer examination of inhibitory synaptic inputs remains to be done in the in vitro experiments.
Hippocampal Dependency and Cerebellar Interactions
An increase or decrease in response rate recorded from a hip- pocampal neuron in a conscious rabbit performing the trace con- ditioning task indicates the actual output of the neuron. This out- put may then influence other components of the conditioned reflex. We hypothesize that these other components are part of a hippocampal-subicular-cortical-pontine circuit as described by Berger and Basset (1992) and Weiss and Disterhoft (1996). In trace conditioning, the increased responsiveness of hippocampal pyramidal cells would be necessary to augment the CS input to the cerebellum via a subicular-cortical-pontine circuit. In essence, the limbic system could be acting to “store” the CS input during the trace interval as would be required for the association to be formed in the cerebellum (McCormick et al., 1982; McCormick and Thompson, 1984). In delay conditioning the ponto-cerebel- lar circuitry is adequately activated to mediate conditioning in- dependently of the hippocampus (Thompson, 1986, 1990, for reviews), and the appropriate timing of the CR can be mediated with feedback from the cerebellar cortex (Perret et al., 1993; Perret and Mauk, 1995) or the red nucleus and rostral dorsal accessory olive (Weiss et al., 1990). Inhibition may also be necessary in the CS and trace period to appropriately time CR onset in trace con- ditioning.
The interaction of hippocampal and cerebellar activity must be bidirectional since the hippocampus is required for the acqui- sition of trace eyeblink conditioning (Moyer et al., 1990) and cerebellar nuclear lesions abolish behavioral CRs as well as tem- poral models of hippocampal activity during eyeblink condition- ing (Clark et al., 1984; Sears and Steinmetz, 1990). Cerebellar neurons are also more active when involved in cognitive process- ing as compared to simple motor activity (Kim et al., 1994) per- haps by way of transynaptic projections to the prefrontal cortex (Middleton and Strick, 1994). The activity of spatially related hippocampal neurons is influenced by the motor set of the ani- mal as well (Rupniak and Gaffan, 1987; Breese et al., 1989; Foster
et al., 1989; Wiener et al., 1989). An evaluation of the interac- tion between the cerebellum and hippocampus in the context of eyeblink conditioning is planned for future experiments.
The data reported here suggest a more varied pattern of pyra- midal neuron engagement during eyeblink conditioning than was apparent in previous multiple- and single-neuron analyses of this paradigm, especially during hippocampally independent delay conditioning (e.g., Berger et al., 1983). These data are clearly giv- ing a picture of hippocampal neuronal involvement which is more reminiscent of that reported for primates and rats in hippocam- pally dependent tasks (Cohen and Eichenbaum, 1993, for review). This suggests that eyeblink conditioning in the rabbit may well be a very powerful preparation in which to probe hippocampal function, especially when hippocampally dependent tasks are used during in vivo extracellular recording sessions and the data are collected and analyzed with modern techniques. Recordings dur- ing acquisition of trace conditioning will be necessary to deter- mine if pyramidal neurons change their firing rate as early as they do in delay conditioning (Berger et al., 1976), and to determine if the percentage and/or temporal pattern of significantly related cells changes as learning progresses, perhaps as a consequence of consolidation (see Thompson et al., 1996a; Kim et al., 1995). Recordings from chronically implanted microelectrodes during trace conditioning should enable an analysis of the time course of activity changes throughout the limbic/cerebellar system in re- lation to the acquisition and consolidation of hippocampally de- pendent learning.
Acknowledgments We thank R. Akhavein, R. Kettner, C. Larson, L. Miller, J.R.
Moyer, L.T. Thompson for comments and/or technical assis- tance. This work was supported by NIH ROlMH47340, ROlAG06796, and F31MH10837.
Akase E, Thompson LT, Disterhoft JF (1 994) A system for quantitative analysis of associative learning. 2. Real-time sofnvare for MS-DOS microcomputers. J Neurosci Methods 54: 119-130.
Berger TW, Bassett JL (1992) System properties of the hippocampus. In: Learning and memory: The behavioral and biological substrates (Gormezano I, Wasserman EA, eds). Hillsdale, NJ: Lawrence Erlbaum. 275-320.
Berger TW, Thompson RF (1978) Neuronal plasticity in the limbic sys- tem during classical conditioning of the rabbit nictirating membrane response. I. The hippocampus. Brain Res 145:323-346.
Berger TW, Alger B, Thompson RF (1976) Neuronal substrate of clas- sical conditioning in the hippocampus. Science 192:483-485.
Berger TW, Rinaldi P, Weisz DJ, Thompson RF (1983) Single unit analysis of different hippocampal cell types during classical condi- tioning of the rabbit J Neurophysiol 50:1197-1219.

208 W E I S S ET AL.
Breese CR, Hampson RE, Deadwyler SA (1989) Hippocampal place cells: Stereotypy and plasticity. J Neurosci 9(4): 1097-1 11 1.
Buchanan SL, Powell DA (1980) Divergencies in Pavlovian conditioned heart rate and eyeblink responses produced by hippocampectomy in the rabbit. Behav Neural Biol 30:20-38.
Cahusac PMB, Miyashita Y (1988) Hippocampal activity related to pro- cessing of single sensory-motor associations. Neurosci Lett 90:265- 272.
Cahusac PMB, Rolls ET, Miyashita Y, Niki H (1993) Modification of the responses of hippocampal neurons in the monkey during the learning of a conditional spatial response task. Hippocampus 3( 1): 29-42.
Clark GA, McCormick DA, Lavond DG, Thompson RF (1 984) Effects of lesions of cerebellar nuclei on conditioned behavioral and hip- pocampal neuronal responses. Brain Res 29 1 : 125-1 36.
Cohen NJ, Eichenbaum H (1993) Memory, amnesia, and the hip- pocampal system. Cambridge, MA: MIT Press.
Coulter DA, LoTurco JJ, Kubota M, Disterhofi JF, Moore JW, Alkon DL (1989) Classical conditioning reduces the amplitude and dura- tion of the calcium-dependent afterhyperpolarization in rabbit hip- pocampal pyramidal cells. J Neurophysiol 6137 1-98 1.
Disterhoft JF, Kwan HH, Lo W D (1977) Nictitating membrane con- ditioning to tone in the immobilized albino rabbit. Brain Res 137: 127-143.
Disterhoft JF, Coulter DA, Alkon DL (1 986) Conditioning-specific membrane changes of rabbit hippocampal neurons measured in vitro. PNAS USA 83:2733-2737.
Disterhoft JF, Kronforst MA, Moyer JR Jr, Thompson LT, Van der Zee E, Weiss C (1 996) Hippocampal neuron changes during txace eye- blink conditioning in the rabbit. In: Acquisition of motor behavior in vertebrates (Bloedel JP, Ebner TJ, Wise SR, eds). Cambridge, MA: MIT Press. 143-174.
Eichenbaum H, Wiener SI, Shapiro ML, and Cohen NJ (1 989) The or- ganization of spatial coding in the hippocampus: A study of neural ensemble activity. J Neurosci 9(8):2764-2775.
Eifuku E, Nishijo H, Kita T, Ono T (1995) Neuronal activity in the primate hippocampal formation during a conditional association task based on the subject’s location. J Neurosci 15(7):4952-4969.
Foster TC, Castro CA, McNaughton BL (1989) Spatial selectivity of rat hippocampal neurons: Dependence on preparedness for movement. Science 244:1580-1582.
Harnpson RE, Heyser CJ, Deadwyler SA (1993) Hippocampal cell fir- ing correlates of delayed-match-to-sample performance in the rat. Behav Neurosci 107:715-739.
Jung MW, McNaughton BL (1993) Spatial selectivity of unit activity in the hippocampal granular layer. Hippocampus 3: 165-1 82.
Jung MW, Wiener SI, McNaughton BL (1994) Comparison of spatial firing characteristics of units in dorsal and ventral hippocampus of the rat. J Neurosci 14:7347-7356.
Kim SG, Ugurbil K, Strick PL (1994) Activation of a cerebellar output nucleus during cognitive processing. Science 265:949-95 1.
Kim JJ, Clark RE, Thompson RF (1 995) Hippocampectomy impairs the memory of recently, but not remotely, acquired trace eyeblink con- ditioned responses. Behav Neurosci 109: 195-203.
Kubie JL (1 984) A driveable bundle of microwires for collecting single- unit data from freely moving rats. Physiol Behav 32:115-118.
Landfield PW, McGaugh JL, Tusa RJ (1972) Theta rhythm: A tempo- ral correlate of memory storage processes in the rat. Science 175:87- 89.
Martin GK, Lonsbury-Martin BL, Kimm J (1980) A rabbit preparation for neurobehavioral auditory research. Hearing Res 265-78.
Mauk MD, Thompson RF (1987) Retention of classically conditioned eyelid responses following acute decerebration. Brain Res 403:89-95.
McCorniick DA, Thompson RF (195’4) Neuronal responses of the rabbit cerebellum during acquisition and performance of a classically condi- tioned nictitating membrane-eyelid response. J Neurosci 4:28 11-2822.
McCormick DA, Clark GA, Lavond DG, Thompson RF (1982) Initial
localization of the memory trace for a basic form of learning. Proc Natl Acad Sci USA 79:2731-2735.
McNaughton BL, Barnes CA, O’Keefe J (1983) The stereotrode: A new technique for simultaneous isolation of several single units in the cen- tral nervous system from multiple unit records. J Neurosci Methods
Middleton FA, Strick PL (1994) Anatomical evidence for cerebellar and basal ganglia involvement in higher cognitive function. Science 266:458-461.
Miyashita Y, Rolls ET, Cahusac PMB, Niki H, Feigenbaum JD (1989) Activity of hippocampal neurons in the monkey related to a condi- tional spatial response task. J Neurophysiol 61 :669-678.
Moyer JR, Deyo RA, Disterhoft JF (1990) Hippocampectomy disrupts trace eyeblink conditioning in rabbits. Behav Neurosci 104:243- 252.
Moyer JR Jr , Thompson LT, Disterhoft JF (1996) Trace eyeblink con- ditioning increases CA1 excitability in a transient and learning-spe- cific manner. J Neuroscience (in press).
Olds J, Disterhoft JF, Segal M, Kornblith CL, Hirsh R (1972) Learning centers of rat brain mapped by measuring latencies of conditioned unit responses. J Neurophysiol 35:202-219.
Otto T, Eichenbaum H (1992) Neuronal activity in the hippocampus during delayed non-match to sample performance in rats: Evidence for hippocampal processing in recognition memory. Hippocampus 2:323-334.
Perrett SP, Mauk M D (1995) Extinction of conditioned eyelid responses requires the anterior lobe of cerebellar cortex. J Neurosci 15:2074- 2080.
Perrett SP, Ruiz BP, Mauk MD (1993) Cerebellar cortex lesions disrupt learning dependent timing of conditioned eyelid responses. J Neurosci
Ranck JB (1973) Studies on single neurons in dorsal hippocampal for- mation and septum in unrestrained rats. I. Behavioral correlates and firing repertoires. Exp Neurol 41:461-555.
Riches IP, Wilson FAW, Brown M W (1991) The effects of visual stim- ulation and memory on neurons of the hippocampal formation and the neighboring parahippocampal gyrus and inferior temporal cortex of the primate. J Neurosci 1 1 (6): 1763-1779.
Rolls ET, Treves A (1994) Neural networks in the brain involved in memory and recall. Prog Brain Res I 02:335-34 1.
Rupniak NMJ, Gaffan D (1987) Monkey hippocampus and learning about spatially directed movements. J Neurosci 7:2331-2337.
Schmaltz LW, Theios J (1972) Acquisition and extinction of a classically conditioned response in hippocampectomized rabbits (Oryctalagous cuniculus). J Comp Physiol Psychol 79328-333.
Scoville WB, Milner B (1957) Loss of recent memory after bilateral hip- pocampal lesions. J Neurol Neurosurg Psychiatry 20:ll-21.
Sears LL, Steinmetz JE (1 990) Acquisition of classically conditioned-re- lated activity in the hippocampus is affected by lesions of the cere- bellar interpositus nucleus. Behav Neurosci 104:681-692.
Siege1 S, Castellan NJ Jr (1988) Nonparametric statistics for the behav- ioral sciences. 2nd ed. St. Louis: McGraw-Hill.
Solomon PR (1 979) Temporal versus spatial information processing views of hippocampal function. Psychol Bull 86: 1272-1279.
Solomon PR, Vander Schaaf ER, Weisz DJ, Thompson RF (1986) Hippocampus and trace conditioning of the rabbit’s nictitating Inem- brane response. Behav Neurosci 100:729-744.
Squire LR (1987) Memory and brain. New York: Oxford University Press.
Steinmetz JE (1990) Classical nictitating membrane conditioning in rab- bits with varying interstimulus intervals and direct activation of cere- bellar mossy fibers as the CS. Behav Brain Res 38:97-108.
Tamura R, Ono T, Fukada M, Nakamura K (1 990) Recognition of ego- centric and allocenrric visual and auditory space by neurons in the hippocampus of monkeys. Neurosci Lett 109:293-298.
Thompson LT, Best PJ (1989) Place cells and silent cells in the hip- pocampus of freely-behaving rats. J Neurosci 9:2382-2390.
8~391-397.
13: 1708-171 8.

HIPPOCAMPAL NEURONS AND TRACE CONDITIONING 209
Thompson LT, Best PJ (1 990) Long-term stability of the place-field ac- tivity of single units recorded from the dorsal hippocampus of freely behaving rats. Brain Res 509:299-308.
Thompson LT, Deyo RA, Disterhoft JF (1990) Nimodipine enhances spontaneous activity of hippocampal pyramidal neurons in aging rab- bits at a dose that facilitates associative learning. Brain Res 535:119- 130.
Thompson LT, Moyer JR, Akase E, Disterhoft JF (1994) A system for quantitative analysis of associative learning. 1. Hardware interfaces with cross-species applications. J Neurosci Methods 54: 109-1 17.
Thompson LT, Moyer JR, Disterhoft JF (1996a) Transient changes in excitability of rabbit CA3 neurons with a time-course appropriate to support memory consolidation. J Neurophysiol (in press).
Thompson RF (1986) The neurobiology of learning and memory. Science 233:941-947.
Thompson RF (1 990) Neural mechanisms of classical conditioning in mammals. Philos Trans R SOC Lond [Biol] 329:161-170.
Thompson RF, Berger TW, Cegavske CF, Patterson MM, Roemer RA, Teyler TJ, Young RA (1976) A search for the engram. Am Psycho1 31:209-227.
Tocco G, Ramirez 0, Nordholm A, Baudry M, Thompson RF (1993) Abolition of the rabbit nictitating membrane conditioned response by reversible inactivation of brain structures. Soc Neurosci Abs 19:999.
Weiss C, Disterhoft JF (1 994) Multichannel extracellular recording tech- niques. Kopf Carrier 4O:l-5.
Weiss C, Disterhoft JF (1996) Eyeblink conditioning, motor control, and the analysis of limbic-cerebellar interactions. Behav Brain Sci (in press).
Weiss C, Houk JC, Gibson AR (1 990) Inhibition of sensory responses
of cat inferior olive neurons produced by stimulation of red nucleus. J Neurophysiol 64:1170-1185.
Weiss C, Kronforst MA, Thompson LT, Disterhoft JF (1993) Electrophysiological characterization of hippocampal neurons during trace eyeblink conditioning in the rabbit. SOC Neurosci Abs 19:801.
Weiss C, Kronforst MA, Disterhoft JF (1994) Comparison of hippocam- pal single cell activity during hippocampal-dependent and hippocam- pal-independent eyeblink Conditioning. Soc Neurosci Abs 20:796.
Weiss C, Kronforst MA, Disterhoft JF (1995) Hippocampal CA1 sin- gle neuron activity during trace eyeblink conditioning. SOC Neurosci Abs 21:1931.
Wiener SI, Paul CA, Eichenbaum H (1989) Spatial and behavioral cor- relates of hippocampal neuronal activity. J Neurosci 9(8):2737-2763.
Wilson MA, McNaughton BL (1993) Dynamics of the hippocampal en- semble code for space. Science 261:1055-1058.
Wilson FAW, Riches IP, Brown M W (1 990) Hippocampus and medial temporal cortex: neuronal activity related to behavioral responses dur- ing performance of memory tasks by primates. Behav Brain Res 40:7-28.
Woodruff-Pak DS, Thompson RF (1985) Classical conditioning of the eyelid response in rabbits as a model system for the study of brain mechanisms of learning and memory in aging. Exp Aging Res 11:
Woodruff-Pak DS, Lavond DG, Logan CG, Thompson RF (1987) Classical conditioning in 3-, 30-, and 45-month-old rabbits: Behavioral learning and hippocampal unit activity. Neurobiol Aging
Young BJ, Fox GD, Eichenbaum H (1994) Correlates of hippocampal complex-spike cell activity in rats performing a nonspatial radial maze task. J Neurosci 14(11):6553-6563.
109-122.
8:lOl-108.