Embed Size (px)
Citation preview
Actuarial Office P.O. Box 942709 Sacramento, CA 94229-2709 Telecommunications Device for the Deaf - (916) 795-3240 (888) CalPERS (225-7377) FAX (916) 795-2744
California Public Employees’ Retirement System Lincoln Plaza - 400 Q Street - Sacramento, CA 95811
October 2008
MISCELLANEOUS PLAN OF THE CITY OF STOCKTON (EMPLOYER # 55) Annual Valuation Report as of June 30, 2007
Dear Employer, Enclosed please find a copy of the June 30, 2007 actuarial valuation report of your pension plan. This report contains important actuarial information about your pension plan at CalPERS. Your CalPERS staff actuary is available to discuss the report with you. Changes Since the Prior Year’s Valuation There may be changes specific to your plan such as contract amendments and funding changes. There are no other material changes since the prior valuation. Future Contribution Rates The exhibit below displays the required employer contribution rate and Superfunded status for 2009/2010 along with an estimate of the contribution rate and the probable Superfunded status for 2010/2011. The estimated rate for 2010/2011 is based solely on a projection of the investment return for fiscal 2007/2008, namely -2.5%. Please disregard any projections that we may have provided to you in the past.
Fiscal Year Employer Contribution Rate Superfunded?
2009/2010 13.084% NO 2010/2011 12.9% (projected) NO
Member contributions (whether paid by the employer or the employee) are in addition to the above rates.
The estimate for 2010/2011 also assumes that there are no future amendments and no liability gains or losses (such as from larger than expected pay increases, more retirements than expected, etc.). This is a very important assumption because these gains and losses do occur and can have a significant effect on your contribution rate. Even for the largest plans, such gains and losses often cause a change in the employer’s contribution rate by one or two percent, even larger in some less common instances. These gains and losses cannot be predicted in advance so the projected employer contribution rate for 2010/2011 is just an est imate. Your actual rate for 2010/2011 will be provided in next year’s report. We are very busy preparing actuarial valuations for other public agencies and expect to complete all such valuations by the end of October. We understand that you might have a number of questions about these results. While we are very interested in discussing these results with your agency, in the interest of allowing us to give every public agency their result, we ask that, if at all possible, you wait until after October 31 to contact us with questions. If you have questions, please call (888) CalPERS (225-7377).
Sincerely,
Ronald L. Seeling, Ph.D., FCA, ASA, MAAA Enrolled Actuary Chief Actuary, CalPERS


California Public Employees’ Retirement System P.O. Box 942709
Sacramento, CA 94229-2709 (888) CalPERS (225-7377)
ACTUARIAL VALUATION as of June 30, 2007
for the MISCELLANEOUS PLAN
of the CITY OF STOCKTON
(EMPLOYER # 55)
REQUIRED CONTRIBUTIONS
FOR FISCAL YEAR July 1, 2009 – June 30, 2010

TABLE OF CONTENTS
ACTUARIAL CERTIFICATION 1
HIGHLIGHTS AND EXECUTIVE SUMMARY
Purpose of the Report 5 Required Contributions 5 Funded Status 5 Cost and Volatility 6 Changes Since the Prior Valuation 7 Subsequent Events 7
SUMMARY OF LIABILITIES AND RATES
Development of Accrued and Unfunded Liabilities 11 (Gain) / Loss Analysis 12 Schedule of Amortization Bases 13 Development of Required Employer Contributions 14 Reconciliation of Required Employer Contributions 14 Employer Contribution Rate History 15 Funding History 15
SUMMARY OF ASSETS Reconciliation of the Market Value of Assets 19 Development of the Actuarial Value of Assets 19 Asset Allocation 20
SUMMARY OF PARTICIPANT DATA Summary of Valuation Data 23 Active Members 24 Transferred and Terminated Members 25 Retired Members and Beneficiaries 26
APPENDIX A
Statement Of Actuarial Data, Methods And Assumptions APPENDIX B
Summary Of Principal Plan Provisions APPENDIX C
GASB Statement No. 27 for a Single Employer Defined Benefit Pension Plan APPENDIX D
Glossary of Actuarial Terms
FIN PROCESS CONTROL ID (CY) 318606 FIN PROCESS CONTROL ID (PY) 293907 REPORT ID 55405

CALPERS ACTUARIAL VALUATION - June 30, 2007 MISCELLANEOUS PLAN OF THE CITY OF STOCKTON EMPLOYER NUMBER 55
Page 1
ACTUARIAL CERTIFICATION To the best of our knowledge, this report is complete and accurate and contains sufficient information to disclose, fully and fairly, the funded condition of the MISCELLANEOUS PLAN OF THE CITY OF STOCKTON. This valuation is based on the member and financial data as of June 30, 2007 provided by the various CalPERS databases and the benefits under this plan with CalPERS as of the date this report was produced. It is our opinion that the valuation has been performed in accordance with generally accepted actuarial principles, in accordance with standards of practice prescribed by the Actuarial Standards Board, and that the assumptions and methods are internally consistent and reasonable for this plan, as prescribed by the CalPERS Board of Administration according to provisions set forth in the California Public Employees’ Retirement Law. The undersigned listed are actuaries for CalPERS. Both are members of the American Academy of Actuaries and Society of Actuaries and meet the Qualification Standards of the American Academy of Actuaries to render the actuarial opinion contained herein.
Bill Karch, ASA, MAAA Senior Pension Actuary, CalPERS Plan Actuary
Ron Seeling, Ph.D., FCA, ASA, MAAA Enrolled Actuary Chief Actuary, CalPERS

HIGHLIGHTS AND EXECUTIVE SUMMARY
• PURPOSE OF THE REPORT • REQUIRED CONTRIBUTIONS
• FUNDED STATUS
• COST AND VOLATILITY
• CHANGES SINCE THE PRIOR VALUATION
• SUBSEQUENT EVENTS

CALPERS ACTUARIAL VALUATION - June 30, 2007 MISCELLANEOUS PLAN OF THE CITY OF STOCKTON EMPLOYER NUMBER 55
Page 5
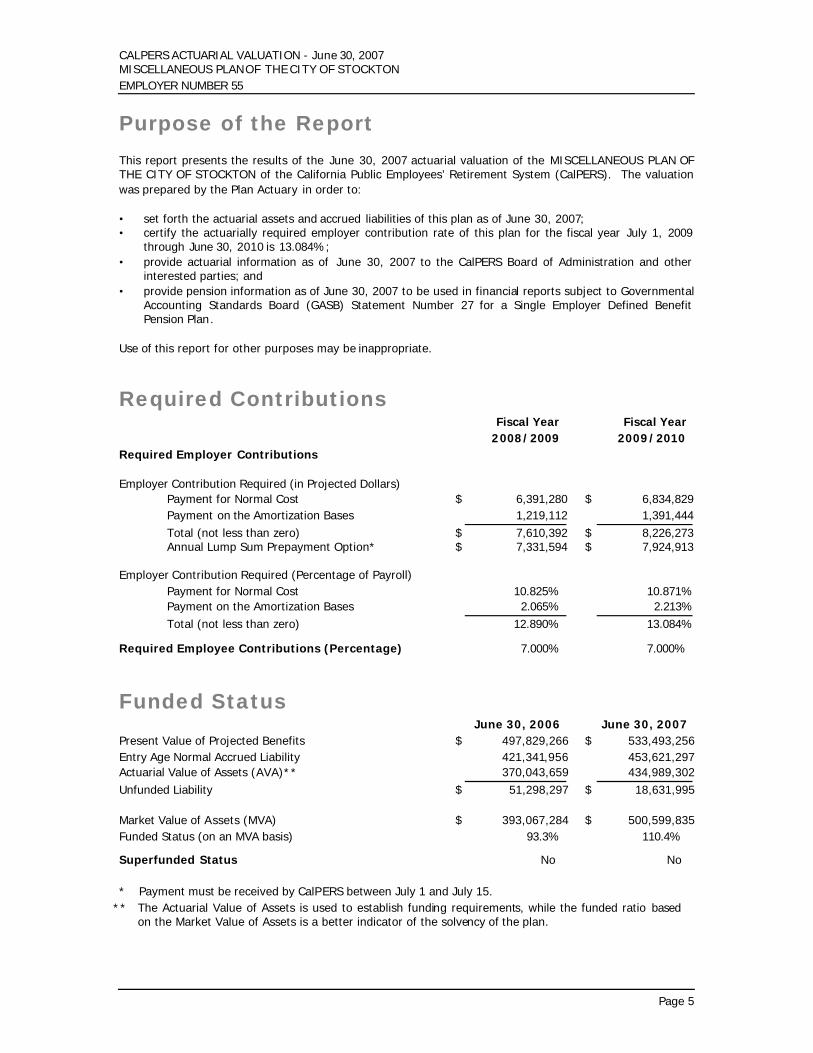
Purpose of the Report This report presents the results of the June 30, 2007 actuarial valuation of the MISCELLANEOUS PLAN OF THE CITY OF STOCKTON of the California Public Employees’ Retirement System (CalPERS). The valuation was prepared by the Plan Actuary in order to: • set forth the actuarial assets and accrued liabilities of this plan as of June 30, 2007; • certify the actuarially required employer contribution rate of this plan for the fiscal year July 1, 2009
through June 30, 2010 is 13.084%; • provide actuarial information as of June 30, 2007 to the CalPERS Board of Administration and other
interested parties; and • provide pension information as of June 30, 2007 to be used in financial reports subject to Governmental
Accounting Standards Board (GASB) Statement Number 27 for a Single Employer Defined Benefit Pension Plan.
Use of this report for other purposes may be inappropriate.
Required Contributions
Fiscal Year Fiscal Year 2008/2009 2009/2010 Required Employer Contributions Employer Contribution Required (in Projected Dollars)
Payment for Normal Cost $ 6,391,280 $ 6,834,829Payment on the Amortization Bases 1,219,112 1,391,444Total (not less than zero) $ 7,610,392 $ 8,226,273Annual Lump Sum Prepayment Option* $ 7,331,594 $ 7,924,913
Employer Contribution Required (Percentage of Payroll) Payment for Normal Cost 10.825% 10.871%Payment on the Amortization Bases 2.065% 2.213%Total (not less than zero) 12.890% 13.084%
Required Employee Contributions (Percentage) 7.000% 7.000%
Funded Status
June 30, 2006 June 30, 2007 Present Value of Projected Benefits $ 497,829,266 $ 533,493,256Entry Age Normal Accrued Liability 421,341,956 453,621,297Actuarial Value of Assets (AVA)** 370,043,659 434,989,302Unfunded Liability $ 51,298,297 $ 18,631,995 Market Value of Assets (MVA) $ 393,067,284 $ 500,599,835Funded Status (on an MVA basis) 93.3% 110.4% Superfunded Status No No
* Payment must be received by CalPERS between July 1 and July 15.
** The Actuarial Value of Assets is used to establish funding requirements, while the funded ratio based on the Market Value of Assets is a better indicator of the solvency of the plan.
CALPERS ACTUARIAL VALUATION - June 30, 2007 MISCELLANEOUS PLAN OF THE CITY OF STOCKTON EMPLOYER NUMBER 55
Page 6
Cost and Volatility Actuarial Cost Estimates in General What will this pension plan cost? Unfortunately, there is no simple answer. There are two major reasons for the complexity of the answer. First, all actuarial calculations, including the ones in this report, are based on a number of assumptions about the future.
• There are demographic assumptions about the percentage of employees that will terminate, die, become disabled, and retire in each future year.
• There are economic assumptions about future salary increases for each active employee, and the assumption with the greatest impact, future asset returns at CalPERS for each year into the future until the last dollar is paid to current members of your plan.
While CalPERS has set these assumptions to reflect our best estimate of the real future of your plan, it must be understood that these assumptions are very long term predictors and will surely not be realized each year as we go forward. For example, the assumption for investment return is 7.75% per year. The actual asset earnings for the past 15 years at CalPERS have ranged from -7.2% to 20.1% while the 15 year compound return has been 10.4%. Second, the very nature of actuarial funding produces the answer to the question of plan cost as the sum of two separate pieces.
• The Normal Cost (i.e., the future annual premiums in the absence of surplus or unfunded liability) expressed as a percentage of total active payroll.
• The Past Service Cost (i.e., Accrued Liability – representing the current value of the benefit for all credited past service of current members) which is expressed as a lump sum dollar amount.
The cost is the sum of a percent of future pay and a lump sum dollar amount (the sum of an apple and an orange if you will). To communicate the total cost, either the Normal Cost (i.e., future percent of payroll) must be converted to a lump sum dollar amount (in which case the total cost is the present value of benefits), or the Past Service Cost (i.e., the lump sum) must be converted to a percent of payroll (in which case the total cost is expressed as the employer’s rate part of which is permanent and part temporary). Converting the Past Service Cost lump sum to a percent of payroll requires a specific amortization period. So, the employer rate can be computed in many different ways depending on how long one will take to pay for it. And as the first point above states; all of these results depend on all assumptions being exactly realized. Rate Volatility As is stated above, the actuarial calculations supplied in this communication are based on a number of assumptions about very long term demographic and economic behavior. Unless these assumptions (terminations, deaths, disabilities, retirements, salary growth, and investment return) are exactly realized each year, there will be differences on a year to year basis. The year to year differences between actual experience and the assumptions are called actuarial gains and losses and serve to lower or raise the employer’s rates from year to year. Therefore, the rates will inevitably fluctuate, especially due to the ups and downs of investment returns. Plans that have higher asset to payroll ratios produce more volatile employer rates. On the following page we have shown your volatility index, a measure of the plan’s potential future rate volatility. We are disclosing the ratio of accrued liability to payroll, rather than assets to payroll because the desired state for any plan is to be 100% funded (i.e., with assets equal to accrued liability). It should be noted that this ratio increases over time but generally tends to stabilize as the plan matures. Beginning with the June 30, 2004 actuarial valuation, rate stabilization methodologies were implemented. Although there is no method that can provide perfectly stable rates, the new methods have been shown to be very effective in mitigating rate volatility. It continues to be true that a plan that has a volatility index that is three times the index of a second plan will have three times the volatility in rates as compared to the second plan. However, the amount of change has been dramatically reduced through the rate stabilization process. In most situations, the new rate stabilization policies will reduce rate volatili ty due to actual gains and losses about 50%.
CALPERS ACTUARIAL VALUATION - June 30, 2007 MISCELLANEOUS PLAN OF THE CITY OF STOCKTON EMPLOYER NUMBER 55
Page 7
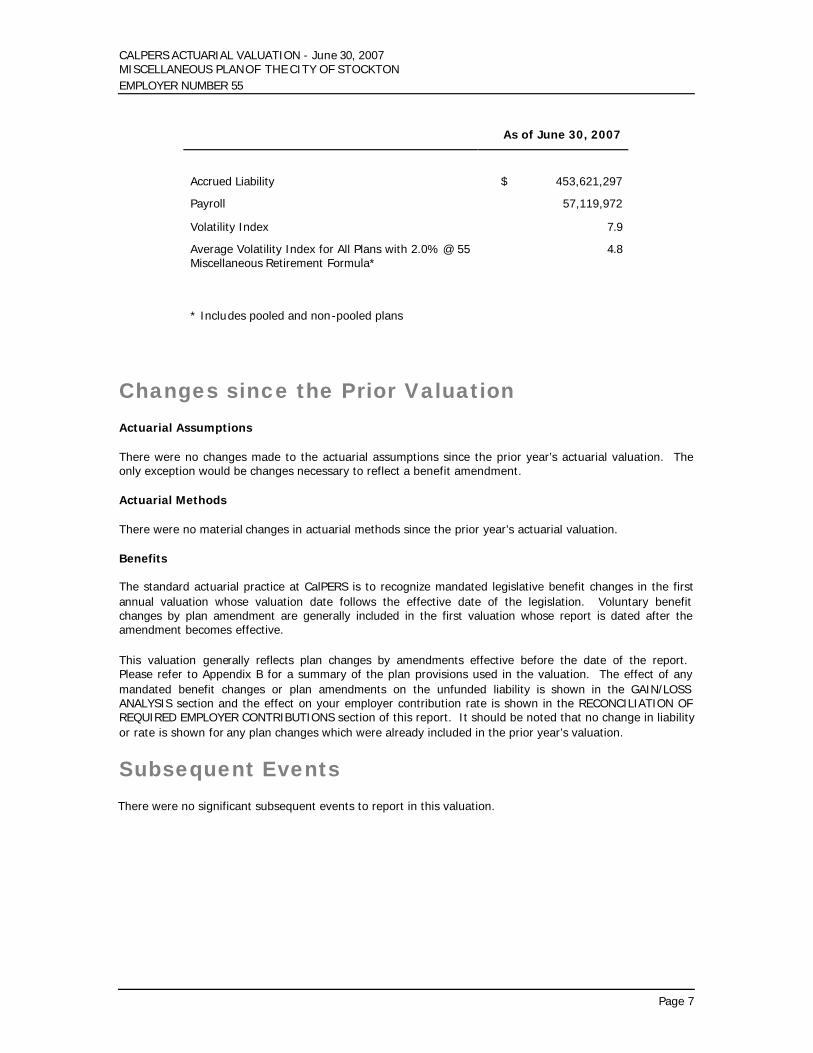
As of June 30, 2007
Accrued Liability $ 453,621,297
Payroll 57,119,972
Volatility Index 7.9
Average Volatility Index for All Plans with 2.0% @ 55 Miscellaneous Retirement Formula*
4.8
* Includes pooled and non-pooled plans
Changes since the Prior Valuation Actuarial Assumptions There were no changes made to the actuarial assumptions since the prior year’s actuarial valuation. The only exception would be changes necessary to reflect a benefit amendment. Actuarial Methods There were no material changes in actuarial methods since the prior year’s actuarial valuation. Benefits The standard actuarial practice at CalPERS is to recognize mandated legislative benefit changes in the first annual valuation whose valuation date follows the effective date of the legislation. Voluntary benefit changes by plan amendment are generally included in the first valuation whose report is dated after the amendment becomes effective. This valuation generally reflects plan changes by amendments effective before the date of the report. Please refer to Appendix B for a summary of the plan provisions used in the valuation. The effect of any mandated benefit changes or plan amendments on the unfunded liability is shown in the GAIN/LOSS ANALYSIS section and the effect on your employer contribution rate is shown in the RECONCILIATION OF REQUIRED EMPLOYER CONTRIBUTIONS section of this report. It should be noted that no change in liability or rate is shown for any plan changes which were already included in the prior year’s valuation.
Subsequent Events There were no significant subsequent events to report in this valuation.

SUMMARY OF LIABILITIES AND RATES
• DEVELOPMENT OF ACCRUED AND UNFUNDED LIABILITIES • (GAIN) / LOSS ANALYSIS
• SCHEDULE OF AMORTIZATION BASES
• DEVELOPMENT OF REQUIRED EMPLOYER CONTRIBUTIONS
• RECONCILIATION OF REQUIRED EMPLOYER CONTRIBUTIONS
• EMPLOYER CONTRIBUTION RATE HISTORY
• FUNDING HISTORY

CALPERS ACTUARIAL VALUATION - June 30, 2007 MISCELLANEOUS PLAN OF THE CITY OF STOCKTON EMPLOYER NUMBER 55
Page 11
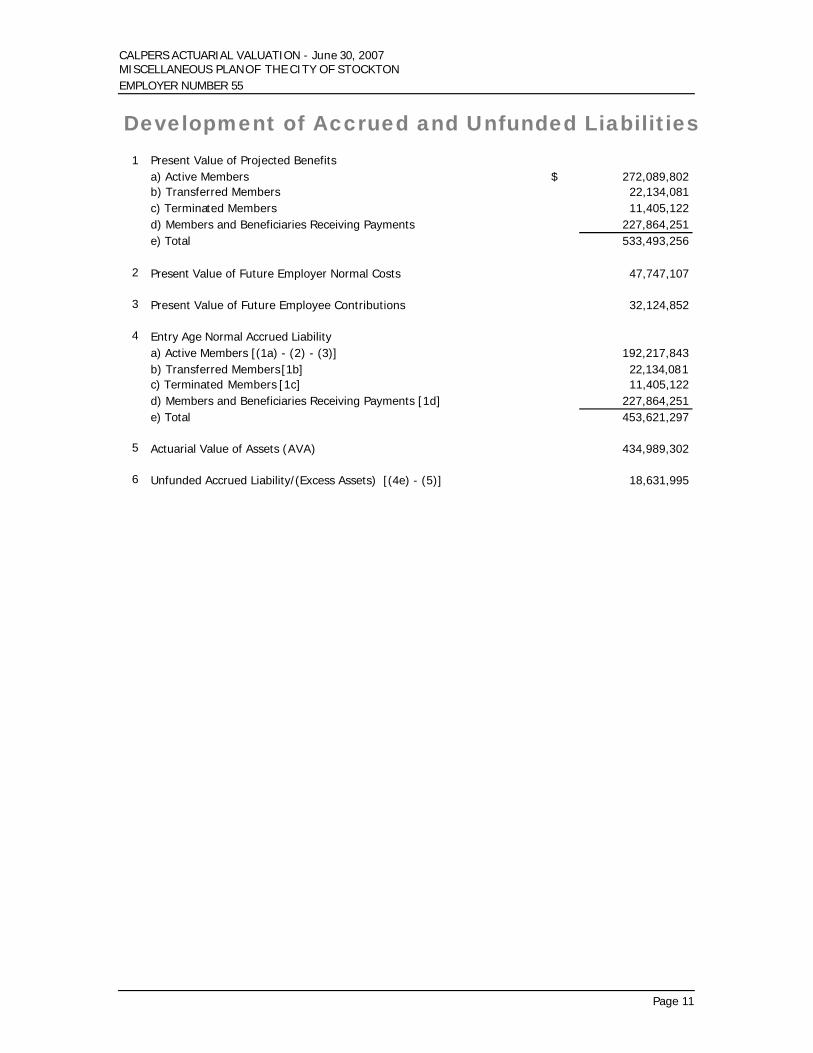
Development of Accrued and Unfunded Liabilities
1.
Present Value of Projected Benefits a) Active Members $ 272,089,802 b) Transferred Members 22,134,081 c) Terminated Members 11,405,122 d) Members and Beneficiaries Receiving Payments 227,864,251 e) Total 533,493,256 2.
Present Value of Future Employer Normal Costs 47,747,107 3.
Present Value of Future Employee Contributions 32,124,852 4.
Entry Age Normal Accrued Liability a) Active Members [(1a) - (2) - (3)] 192,217,843 b) Transferred Members [1b] 22,134,081 c) Terminated Members [1c] 11,405,122 d) Members and Beneficiaries Receiving Payments [1d] 227,864,251 e) Total 453,621,297 5.
Actuarial Value of Assets (AVA) 434,989,302 6.
Unfunded Accrued Liability/(Excess Assets) [(4e) - (5)] 18,631,995
CALPERS ACTUARIAL VALUATION - June 30, 2007 MISCELLANEOUS PLAN OF THE CITY OF STOCKTON EMPLOYER NUMBER 55
Page 12
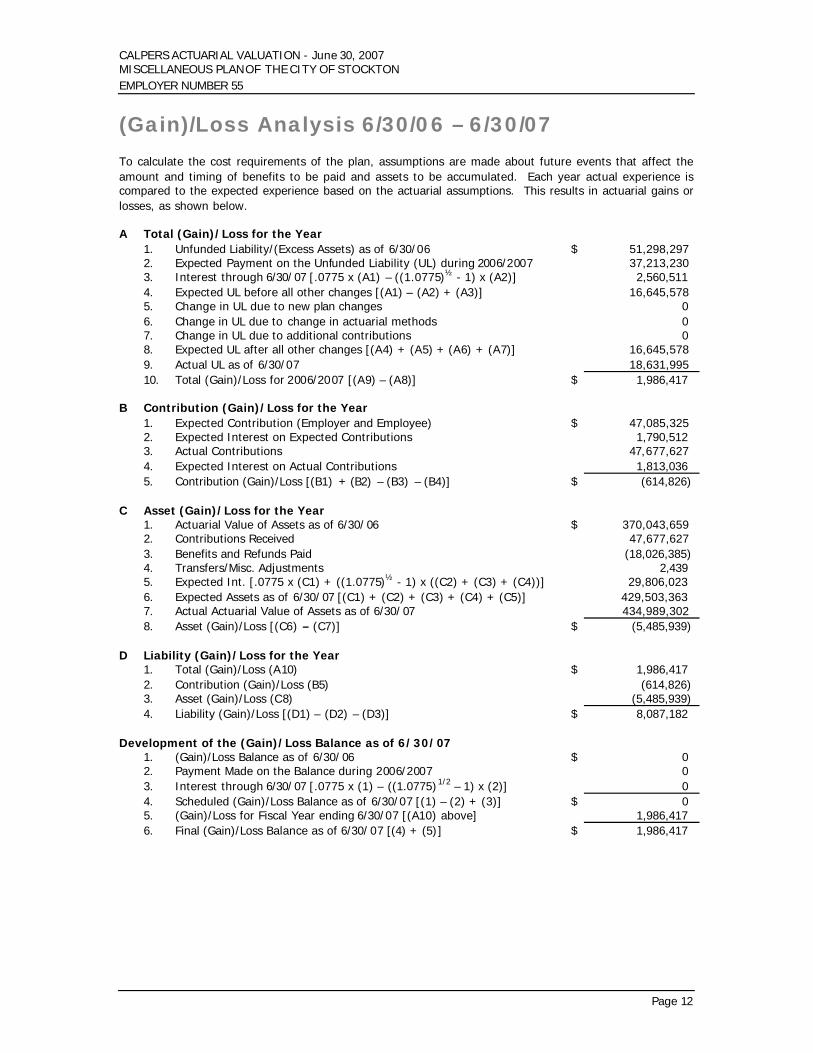
(Gain)/Loss Analysis 6/30/06 – 6/30/07 To calculate the cost requirements of the plan, assumptions are made about future events that affect the amount and timing of benefits to be paid and assets to be accumulated. Each year actual experience is compared to the expected experience based on the actuarial assumptions. This results in actuarial gains or losses, as shown below. A Total (Gain)/Loss for the Year 1. Unfunded Liability/(Excess Assets) as of 6/30/06 $ 51,298,297 2. Expected Payment on the Unfunded Liability (UL) during 2006/2007 37,213,230 3. Interest through 6/30/ 07 [.0775 x (A1) – ((1.0775)½ - 1) x (A2)] 2,560,511 4. Expected UL before all other changes [(A1) – (A2) + (A3)] 16,645,578 5. Change in UL due to new plan changes 0 6. Change in UL due to change in actuarial methods 0 7. Change in UL due to additional contributions 0 8. Expected UL after all other changes [(A4) + (A5) + (A6) + (A7)] 16,645,578 9. Actual UL as of 6/30/07 18,631,995 10. Total (Gain)/Loss for 2006/2007 [(A9) – (A8)] $ 1,986,417 B Contribution (Gain)/Loss for the Year 1. Expected Contribution (Employer and Employee) $ 47,085,325 2. Expected Interest on Expected Contributions 1,790,512 3. Actual Contributions 47,677,627 4. Expected Interest on Actual Contributions 1,813,036 5. Contribution (Gain)/Loss [(B1) + (B2) – (B3) – (B4)] $ (614,826) C Asset (Gain)/Loss for the Year 1. Actuarial Value of Assets as of 6/30/ 06 $ 370,043,659 2. Contributions Received 47,677,627 3. Benefits and Refunds Paid (18,026,385) 4. Transfers/Misc. Adjustments 2,439 5. Expected Int. [.0775 x (C1) + ((1.0775)½ - 1) x ((C2) + (C3) + (C4))] 29,806,023 6. Expected Assets as of 6/30/ 07 [(C1) + (C2) + (C3) + (C4) + (C5)] 429,503,363 7. Actual Actuarial Value of Assets as of 6/30/ 07 434,989,302 8. Asset (Gain)/Loss [(C6) – (C7)] $ (5,485,939) D Liability (Gain)/Loss for the Year 1. Total (Gain)/Loss (A10) $ 1,986,417 2. Contribution (Gain)/Loss (B5) (614,826) 3. Asset (Gain)/Loss (C8) (5,485,939) 4. Liability (Gain)/Loss [(D1) – (D2) – (D3)] $ 8,087,182 Development of the (Gain)/Loss Balance as of 6/30/07 1. (Gain)/Loss Balance as of 6/30/ 06 $ 0 2. Payment Made on the Balance during 2006/2007 0 3. Interest through 6/30/ 07 [.0775 x (1) – ((1.0775)1/2 – 1) x (2)] 0 4. Scheduled (Gain)/Loss Balance as of 6/30/07 [(1) – (2) + (3)] $ 0 5. (Gain)/Loss for Fiscal Year ending 6/30/07 [(A10) above] 1,986,417 6. Final (Gain)/Loss Balance as of 6/30/ 07 [(4) + (5)] $ 1,986,417
CALPERS ACTUARIAL VALUATION - June 30, 2007 MISCELLANEOUS PLAN OF THE CITY OF STOCKTON EMPLOYER NUMBER 55
Page 13
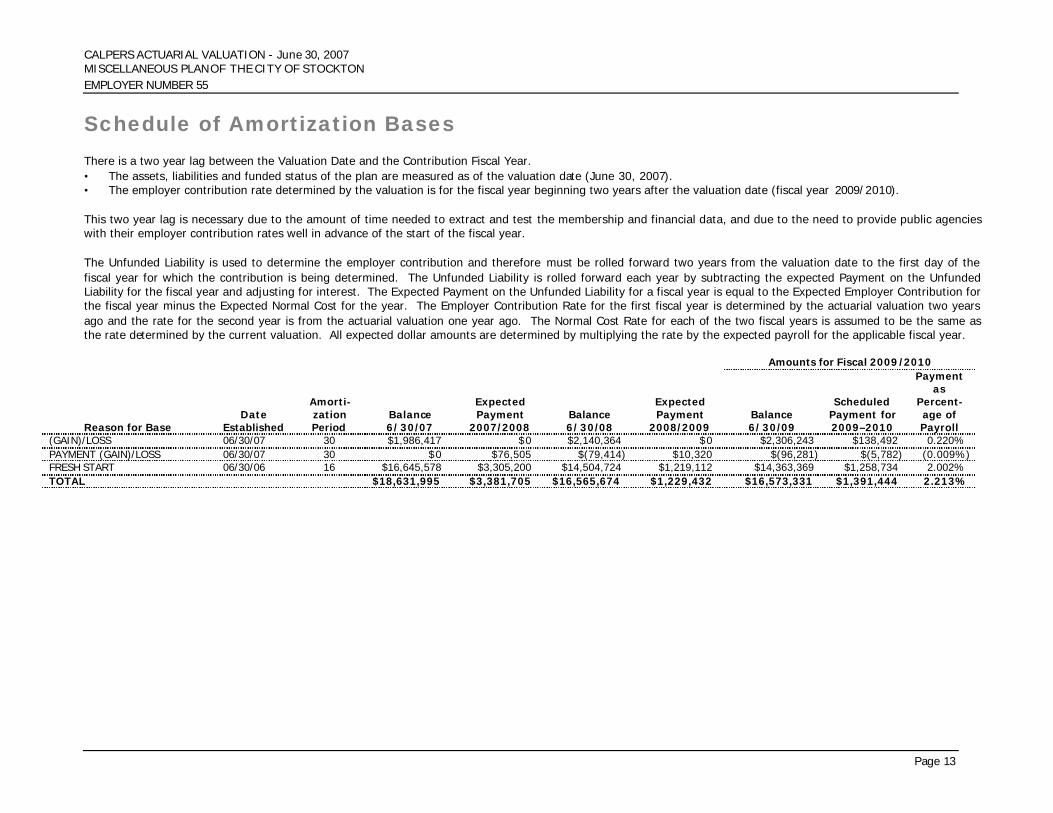
Schedule of Amortization Bases There is a two year lag between the Valuation Date and the Contribution Fiscal Year. • The assets, liabilities and funded status of the plan are measured as of the valuation date (June 30, 2007). • The employer contribution rate determined by the valuation is for the fiscal year beginning two years after the valuation date (fiscal year 2009/2010). This two year lag is necessary due to the amount of time needed to extract and test the membership and financial data, and due to the need to provide public agencies with their employer contribution rates well in advance of the start of the fiscal year. The Unfunded Liability is used to determine the employer contribution and therefore must be rolled forward two years from the valuation date to the first day of the fiscal year for which the contribution is being determined. The Unfunded Liability is rolled forward each year by subtracting the expected Payment on the Unfunded Liability for the fiscal year and adjusting for interest. The Expected Payment on the Unfunded Liability for a fiscal year is equal to the Expected Employer Contribution for the fiscal year minus the Expected Normal Cost for the year. The Employer Contribution Rate for the first fiscal year is determined by the actuarial valuation two years ago and the rate for the second year is from the actuarial valuation one year ago. The Normal Cost Rate for each of the two fiscal years is assumed to be the same as the rate determined by the current valuation. All expected dollar amounts are determined by multiplying the rate by the expected payroll for the applicable fiscal year.
Amounts for Fiscal 2009/2010
Reason for Base Date
Established
Amorti-zation Period
Balance 6/30/07
Expected Payment
2007/2008 Balance 6/30/08
Expected Payment
2008/2009 Balance 6/30/09
Scheduled Payment for 2009–2010
Payment as
Percent-age of Payroll
(GAIN)/LOSS 06/30/07 30 $1,986,417 $0 $2,140,364 $0 $2,306,243 $138,492 0.220% PAYMENT (GAIN)/LOSS 06/30/07 30 $0 $76,505 $(79,414) $10,320 $(96,281) $(5,782) (0.009%) FRESH START 06/30/06 16 $16,645,578 $3,305,200 $14,504,724 $1,219,112 $14,363,369 $1,258,734 2.002% TOTAL $18,631,995 $3,381,705 $16,565,674 $1,229,432 $16,573,331 $1,391,444 2.213%
CALPERS ACTUARIAL VALUATION - June 30, 2007 MISCELLANEOUS PLAN OF THE CITY OF STOCKTON EMPLOYER NUMBER 55
Page 14
Development of Required Employer Contributions
Fiscal Year 2009/2010
Percentage of
Projected Payroll
Estimated $ Based On
Projected Payroll
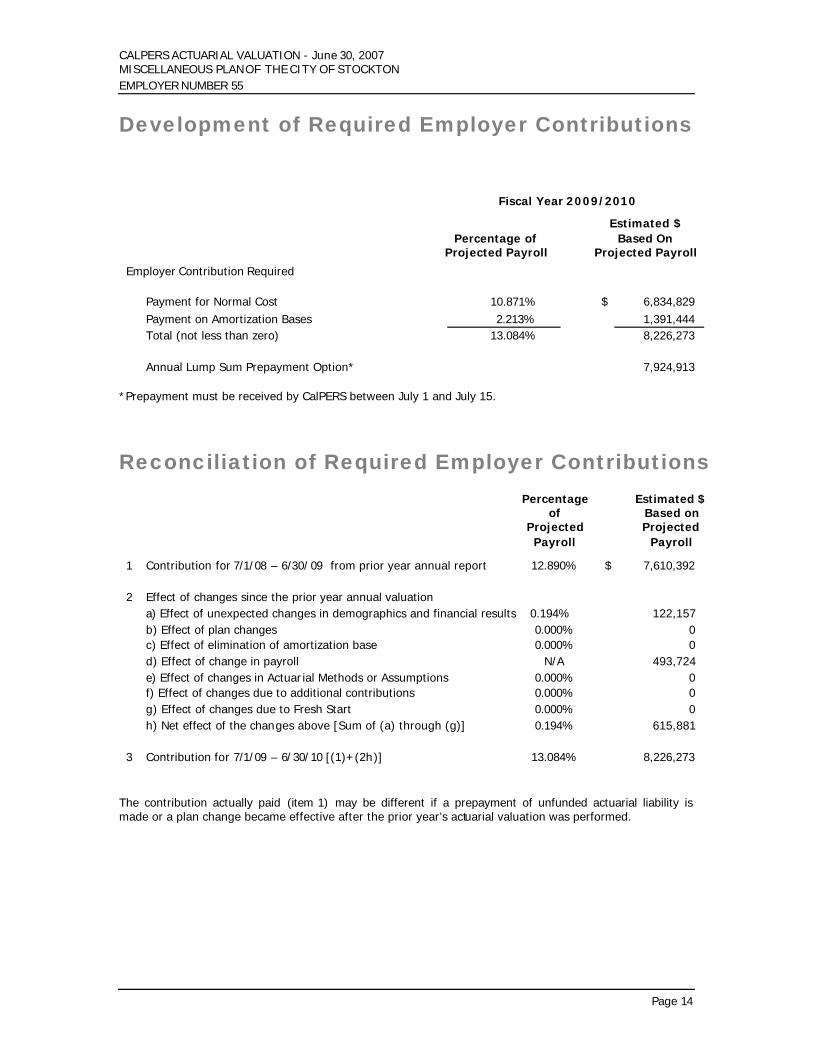
Employer Contribution Required Payment for Normal Cost 10.871% $ 6,834,829 Payment on Amortization Bases 2.213% 1,391,444 Total (not less than zero) 13.084% 8,226,273 Annual Lump Sum Prepayment Option* 7,924,913
*Prepayment must be received by CalPERS between July 1 and July 15.
Reconciliation of Required Employer Contributions
Percentage of
Projected Payroll
Estimated $Based on Projected
Payroll
1.
Contribution for 7/1/08 – 6/30/ 09 from prior year annual report 12.890% $ 7,610,392 2.
Effect of changes since the prior year annual valuation a) Effect of unexpected changes in demographics and financial results 0.194% 122,157 b) Effect of plan changes 0.000% 0 c) Effect of elimination of amortization base 0.000% 0 d) Effect of change in payroll N/A 493,724 e) Effect of changes in Actuar ial Methods or Assumptions 0.000% 0 f) Effect of changes due to additional contributions 0.000% 0 g) Effect of changes due to Fresh Start 0.000% 0 h) Net effect of the changes above [Sum of (a) through (g)] 0.194% 615,881 3.
Contribution for 7/1/09 – 6/30/10 [(1)+(2h)] 13.084% 8,226,273 The contribution actually paid (item 1) may be different if a prepayment of unfunded actuarial liability is made or a plan change became effective after the prior year’s actuarial valuation was performed.
CALPERS ACTUARIAL VALUATION - June 30, 2007 MISCELLANEOUS PLAN OF THE CITY OF STOCKTON EMPLOYER NUMBER 55
Page 15
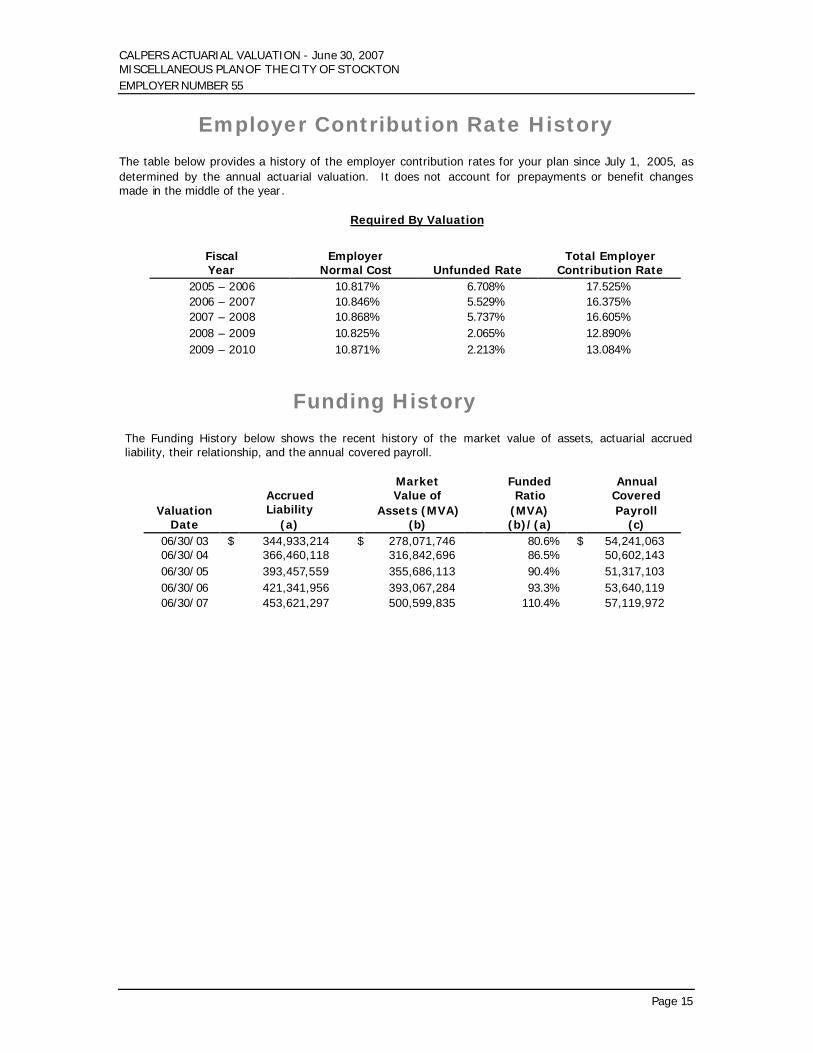
Employer Contribution Rate History The table below provides a history of the employer contribution rates for your plan since July 1, 2005, as determined by the annual actuarial valuation. It does not account for prepayments or benefit changes made in the middle of the year.
Required By Valuation
Fiscal Year
Employer Normal Cost Unfunded Rate
Total Employer Contribution Rate
2005 – 2006 10.817% 6.708%
17.525% 2006 – 2007 10.846% 5.529%
16.375%
2007 – 2008 10.868% 5.737%
16.605% 2008 – 2009 10.825% 2.065%
12.890%
2009 – 2010 10.871% 2.213%
13.084%
Funding History The Funding History below shows the recent history of the market value of assets, actuarial accrued liability, their relationship, and the annual covered payroll.
Valuation Date
Accrued Liability
(a)
Market Value of
Assets (MVA) (b)
Funded Ratio
(MVA) (b)/(a)
Annual Covered Payroll
(c) 06/30/ 03 $ 344,933,214 $ 278,071,746 80.6% $ 54,241,063 06/30/ 04 366,460,118 316,842,696 86.5% 50,602,143 06/30/ 05 393,457,559 355,686,113 90.4% 51,317,103 06/30/ 06 421,341,956 393,067,284 93.3% 53,640,119 06/30/ 07 453,621,297 500,599,835 110.4% 57,119,972


SUMMARY OF ASSETS
• RECONCILIATION OF THE MARKET VALUE OF ASSETS
• DEVELOPMENT OF THE ACTUARIAL VALUE OF ASSETS
• ASSET ALLOCATION

CALPERS ACTUARIAL VALUATION - June 30, 2007 MISCELLANEOUS PLAN OF THE CITY OF STOCKTON EMPLOYER NUMBER 55
Page 19
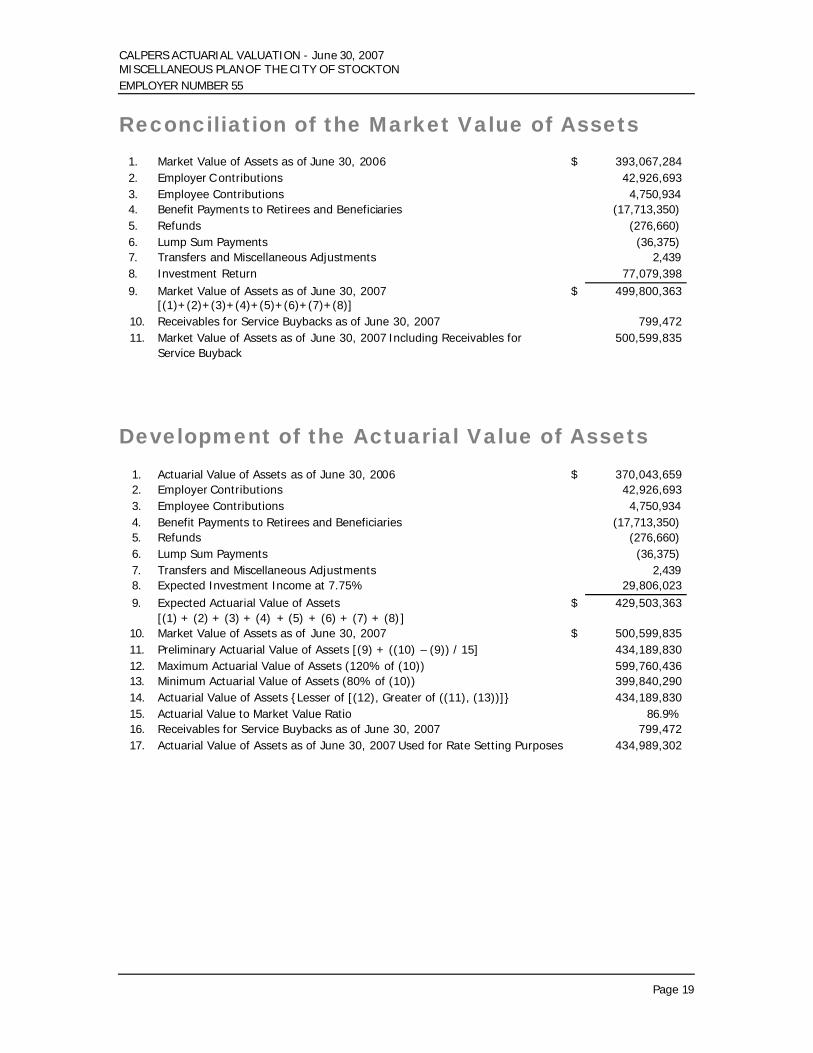
Reconciliation of the Market Value of Assets
1. Market Value of Assets as of June 30, 2006 $ 393,067,284 2. Employer C ontributions 42,926,693 3. Employee Contributions 4,750,934 4. Benefit Payments to Retirees and Beneficiaries (17,713,350) 5. Refunds (276,660) 6. Lump Sum Payments (36,375) 7. Transfers and Miscellaneous Adjustments 2,439 8. Investment Return 77,079,398 9. Market Value of Assets as of June 30, 2007 $ 499,800,363 [(1)+(2)+(3)+(4)+(5)+(6)+(7)+(8)] 10. Receivables for Service Buybacks as of June 30, 2007 799,472 11. Market Value of Assets as of June 30, 2007 Including Receivables for 500,599,835 Service Buyback
Development of the Actuarial Value of Assets
1. Actuarial Value of Assets as of June 30, 2006 $ 370,043,659 2. Employer Contributions 42,926,693 3. Employee Contributions 4,750,934 4. Benefit Payments to Retirees and Beneficiaries (17,713,350) 5. Refunds (276,660) 6. Lump Sum Payments (36,375) 7. Transfers and Miscellaneous Adjustments 2,439 8. Expected Investment Income at 7.75%
29,806,023
9. Expected Actuarial Value of Assets $ 429,503,363 [(1) + (2) + (3) + (4) + (5) + (6) + (7) + (8)]
10. Market Value of Assets as of June 30, 2007 $ 500,599,835 11. Preliminary Actuarial Value of Assets [(9) + ((10) – (9)) / 15] 434,189,830 12. Maximum Actuarial Value of Assets (120% of (10)) 599,760,436 13. Minimum Actuarial Value of Assets (80% of (10)) 399,840,290 14. Actuarial Value of Assets {Lesser of [(12), Greater of ((11), (13))]} 434,189,830 15. Actuarial Value to Market Value Ratio 86.9% 16. Receivables for Service Buybacks as of June 30, 2007 799,472 17. Actuarial Value of Assets as of June 30, 2007 Used for Rate Setting Purposes 434,989,302
CALPERS ACTUARIAL VALUATION - June 30, 2007 MISCELLANEOUS PLAN OF THE CITY OF STOCKTON EMPLOYER NUMBER 55
Page 20
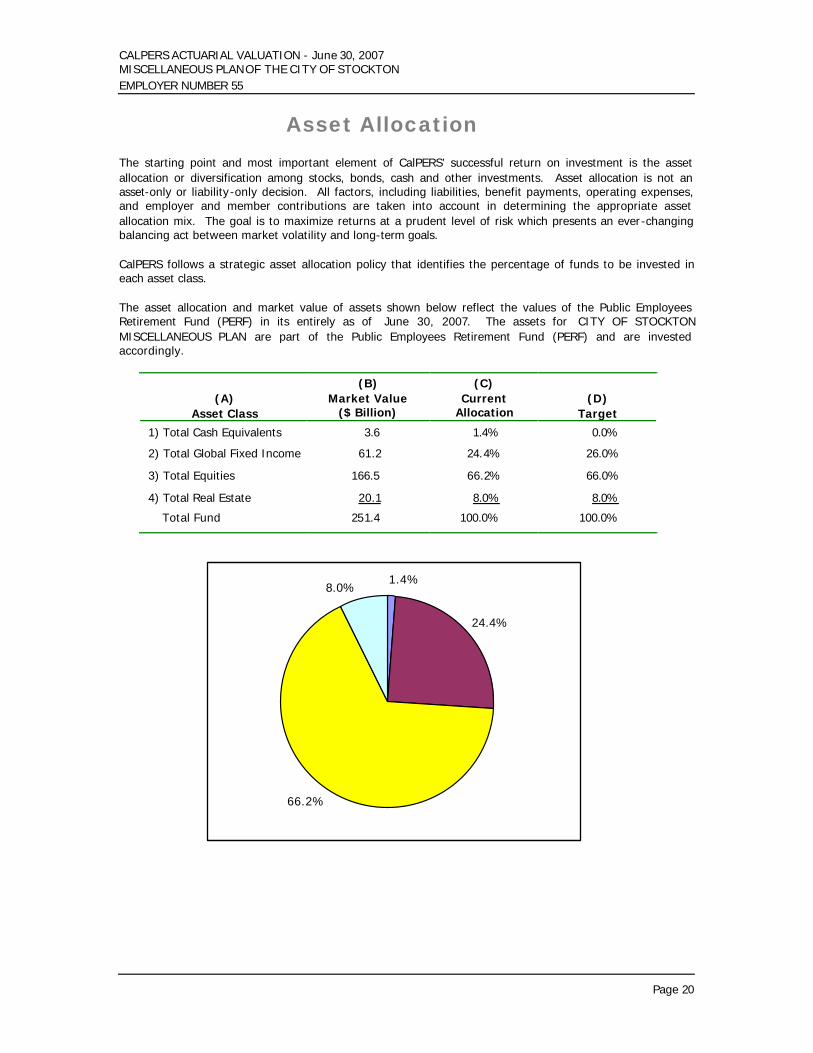
Asset Allocation The starting point and most important element of CalPERS’ successful return on investment is the asset allocation or diversification among stocks, bonds, cash and other investments. Asset allocation is not an asset-only or liability -only decision. All factors, including liabilities, benefit payments, operating expenses, and employer and member contributions are taken into account in determining the appropriate asset allocation mix. The goal is to maximize returns at a prudent level of risk which presents an ever-changing balancing act between market volatility and long-term goals. CalPERS follows a strategic asset allocation policy that identifies the percentage of funds to be invested in each asset class. The asset allocation and market value of assets shown below reflect the values of the Public Employees Retirement Fund (PERF) in its entirely as of June 30, 2007. The assets for CITY OF STOCKTON MISCELLANEOUS PLAN are part of the Public Employees Retirement Fund (PERF) and are invested accordingly.
(A) Asset Class
(B) Market Value
($ Billion)
(C) Current
Allocation (D)
Target
1) Total Cash Equivalents 3.6 1.4% 0.0%
2) Total Global Fixed Income 61.2 24.4% 26.0%
3) Total Equities 166.5 66.2% 66.0%
4) Total Real Estate 20.1 8.0% 8.0%
Total Fund 251.4 100.0% 100.0%
66.2%
24.4%
1.4%8.0%
SUMMARY OF PARTICIPANT DATA
• SUMMARY OF VALUATION DATA
• DISTRIBUTION OF ACTIVE MEMBERS
• DISTRIBUTION OF TRANSFERRED AND TERMINATED MEMBERS • DISTRIBUTION OF RETIRED MEMBERS AND BENEFICIARIES

CALPERS ACTUARIAL VALUATION - June 30, 2007 MISCELLANEOUS PLAN OF THE CITY OF STOCKTON EMPLOYER NUMBER 55
Page 23
Summary of Valuation Data
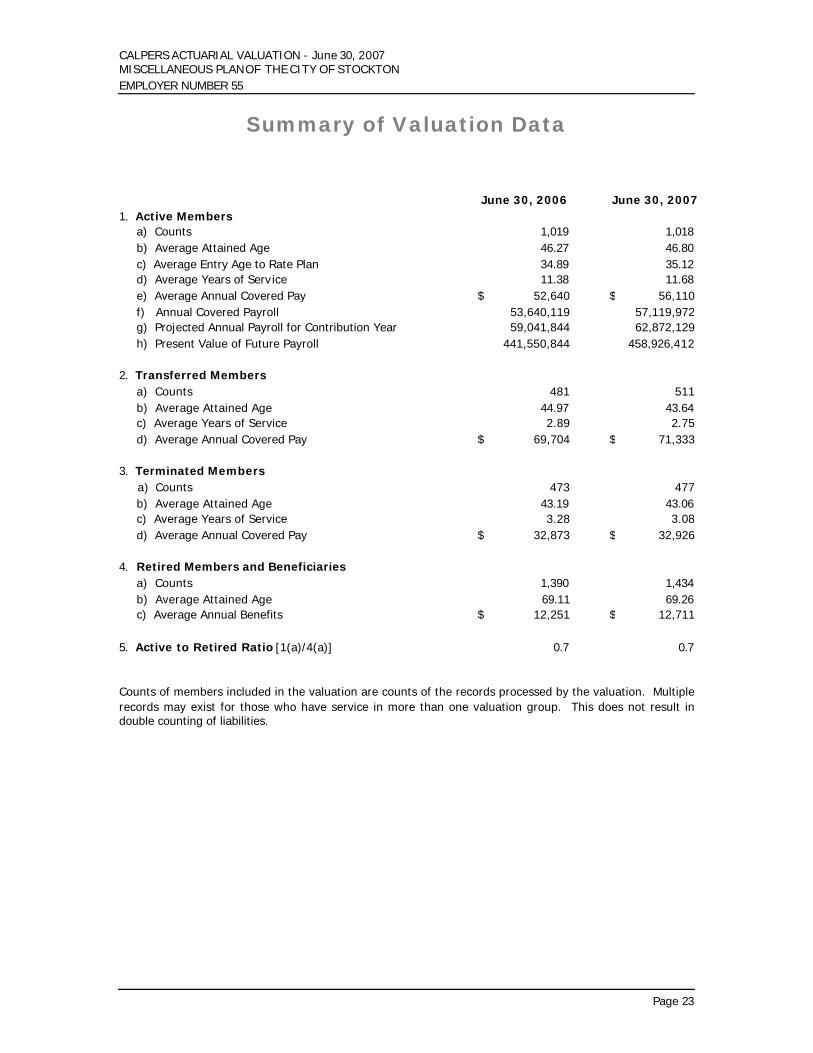
June 30, 2006 June 30, 2007 1. Active Members
a) Counts 1,019 1,018 b) Average Attained Age 46.27 46.80 c) Average Entry Age to Rate Plan 34.89 35.12 d) Average Years of Serv ice 11.38 11.68 e) Average Annual Covered Pay $ 52,640 $ 56,110 f) Annual Covered Payroll 53,640,119 57,119,972 g) Projected Annual Payroll for Contribution Year 59,041,844 62,872,129 h) Present Value of Future Payroll 441,550,844 458,926,412
2. Transferred Members a) Counts 481 511 b) Average Attained Age 44.97 43.64 c) Average Years of Service 2.89 2.75 d) Average Annual Covered Pay $ 69,704 $ 71,333 3. Terminated Members a) Counts 473 477 b) Average Attained Age 43.19 43.06 c) Average Years of Service 3.28 3.08 d) Average Annual Covered Pay $ 32,873 $ 32,926 4. Retired Members and Beneficiaries a) Counts 1,390 1,434 b) Average Attained Age 69.11 69.26 c) Average Annual Benefits $ 12,251 $ 12,711 5. Active to Retired Ratio [1(a)/4(a)] 0.7 0.7 Counts of members included in the valuation are counts of the records processed by the valuation. Multiple records may exist for those who have service in more than one valuation group. This does not result in double counting of liabilities.
CALPERS ACTUARIAL VALUATION - June 30, 2007 MISCELLANEOUS PLAN OF THE CITY OF STOCKTON EMPLOYER NUMBER 55
Page 24
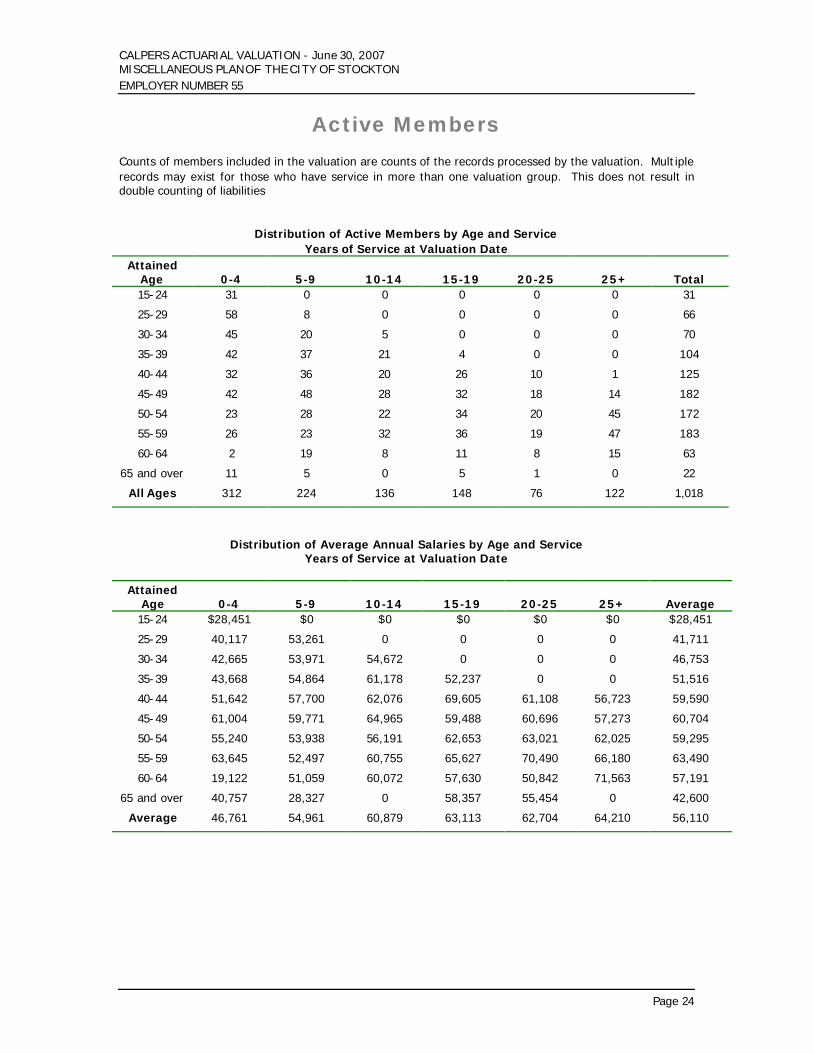
Active Members Counts of members included in the valuation are counts of the records processed by the valuation. Mult iple records may exist for those who have service in more than one valuation group. This does not result in double counting of liabilities
Distribution of Active Members by Age and Service Years of Service at Valuation Date
Attained Age 0-4 5-9 10-14 15-19 20-25 25+ Total 15-24 31 0 0 0 0 0 31
25-29 58 8 0 0 0 0 66
30-34 45 20 5 0 0 0 70
35-39 42 37 21 4 0 0 104
40-44 32 36 20 26 10 1 125
45-49 42 48 28 32 18 14 182
50-54 23 28 22 34 20 45 172
55-59 26 23 32 36 19 47 183
60-64 2 19 8 11 8 15 63
65 and over 11 5 0 5 1 0 22
All Ages 312 224 136 148 76 122 1,018
Distribution of Average Annual Salaries by Age and Service Years of Service at Valuation Date
Attained
Age 0-4 5-9 10-14 15-19 20-25 25+ Average 15-24 $28,451 $0 $0 $0 $0 $0 $28,451
25-29 40,117 53,261 0 0 0 0 41,711
30-34 42,665 53,971 54,672 0 0 0 46,753
35-39 43,668 54,864 61,178 52,237 0 0 51,516
40-44 51,642 57,700 62,076 69,605 61,108 56,723 59,590
45-49 61,004 59,771 64,965 59,488 60,696 57,273 60,704
50-54 55,240 53,938 56,191 62,653 63,021 62,025 59,295
55-59 63,645 52,497 60,755 65,627 70,490 66,180 63,490
60-64 19,122 51,059 60,072 57,630 50,842 71,563 57,191
65 and over 40,757 28,327 0 58,357 55,454 0 42,600
Average 46,761 54,961 60,879 63,113 62,704 64,210 56,110
CALPERS ACTUARIAL VALUATION - June 30, 2007 MISCELLANEOUS PLAN OF THE CITY OF STOCKTON EMPLOYER NUMBER 55
Page 25
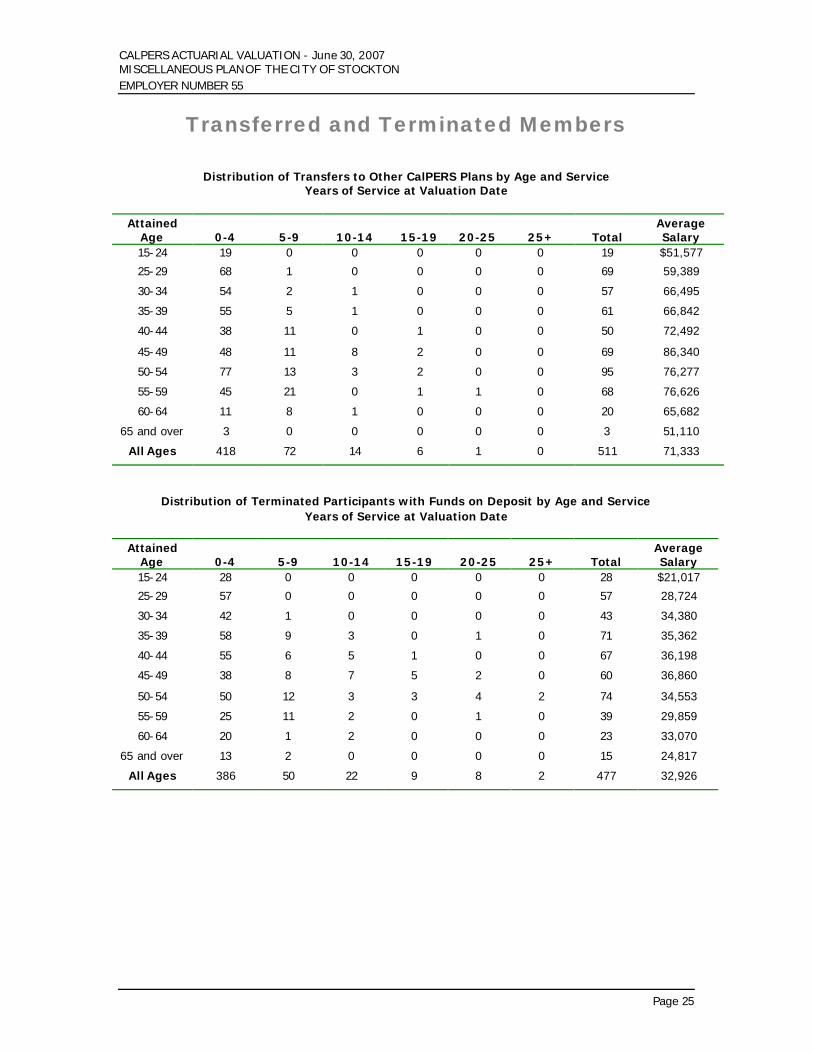
Transferred and Terminated Members
Distribution of Transfers to Other CalPERS Plans by Age and Service Years of Service at Valuation Date
Attained
Age 0-4 5-9 10-14 15-19 20-25 25+ Total Average Salary
15-24 19 0 0 0 0 0 19 $51,577
25-29 68 1 0 0 0 0 69 59,389
30-34 54 2 1 0 0 0 57 66,495
35-39 55 5 1 0 0 0 61 66,842
40-44 38 11 0 1 0 0 50 72,492
45-49 48 11 8 2 0 0 69 86,340
50-54 77 13 3 2 0 0 95 76,277
55-59 45 21 0 1 1 0 68 76,626
60-64 11 8 1 0 0 0 20 65,682
65 and over 3 0 0 0 0 0 3 51,110
All Ages 418 72 14 6 1 0 511 71,333
Distribution of Terminated Participants with Funds on Deposit by Age and Service Years of Service at Valuation Date
Attained
Age 0-4 5-9 10-14 15-19 20-25 25+ Total Average Salary
15-24 28 0 0 0 0 0 28 $21,017
25-29 57 0 0 0 0 0 57 28,724
30-34 42 1 0 0 0 0 43 34,380
35-39 58 9 3 0 1 0 71 35,362
40-44 55 6 5 1 0 0 67 36,198
45-49 38 8 7 5 2 0 60 36,860
50-54 50 12 3 3 4 2 74 34,553
55-59 25 11 2 0 1 0 39 29,859
60-64 20 1 2 0 0 0 23 33,070
65 and over 13 2 0 0 0 0 15 24,817
All Ages 386 50 22 9 8 2 477 32,926
CALPERS ACTUARIAL VALUATION - June 30, 2007 MISCELLANEOUS PLAN OF THE CITY OF STOCKTON EMPLOYER NUMBER 55
Page 26
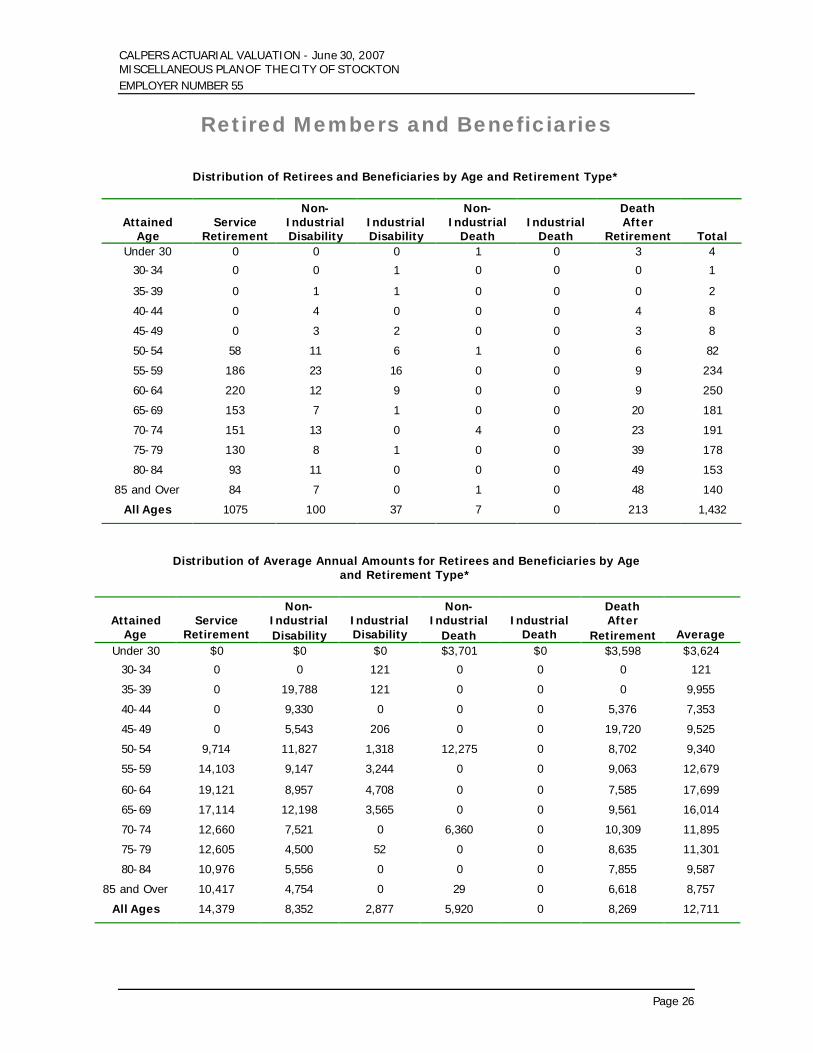
Retired Members and Beneficiaries
Distribution of Retirees and Beneficiaries by Age and Retirement Type*
Attained Age
Service Retirement
Non-Industrial Disability
Industrial Disability
Non-Industrial
Death Industrial
Death
Death After
Retirement Total Under 30 0 0 0 1 0 3 4
30-34 0 0 1 0 0 0 1
35-39 0 1 1 0 0 0 2
40-44 0 4 0 0 0 4 8
45-49 0 3 2 0 0 3 8
50-54 58 11 6 1 0 6 82
55-59 186 23 16 0 0 9 234
60-64 220 12 9 0 0 9 250
65-69 153 7 1 0 0 20 181
70-74 151 13 0 4 0 23 191
75-79 130 8 1 0 0 39 178
80-84 93 11 0 0 0 49 153
85 and Over 84 7 0 1 0 48 140
All Ages 1075 100 37 7 0 213 1,432
Distribution of Average Annual Amounts for Retirees and Beneficiaries by Age and Retirement Type*
Attained Age
Service Retirement
Non-Industrial Disability
Industrial Disability
Non-Industrial
Death Industrial
Death
Death After
Retirement Average Under 30 $0 $0 $0 $3,701 $0 $3,598 $3,624
30-34 0 0 121 0 0 0 121
35-39 0 19,788 121 0 0 0 9,955
40-44 0 9,330 0 0 0 5,376 7,353
45-49 0 5,543 206 0 0 19,720 9,525
50-54 9,714 11,827 1,318 12,275 0 8,702 9,340
55-59 14,103 9,147 3,244 0 0 9,063 12,679
60-64 19,121 8,957 4,708 0 0 7,585 17,699
65-69 17,114 12,198 3,565 0 0 9,561 16,014
70-74 12,660 7,521 0 6,360 0 10,309 11,895
75-79 12,605 4,500 52 0 0 8,635 11,301
80-84 10,976 5,556 0 0 0 7,855 9,587
85 and Over 10,417 4,754 0 29 0 6,618 8,757
All Ages 14,379 8,352 2,877 5,920 0 8,269 12,711
CALPERS ACTUARIAL VALUATION - June 30, 2007 MISCELLANEOUS PLAN OF THE CITY OF STOCKTON EMPLOYER NUMBER 55
Page 27
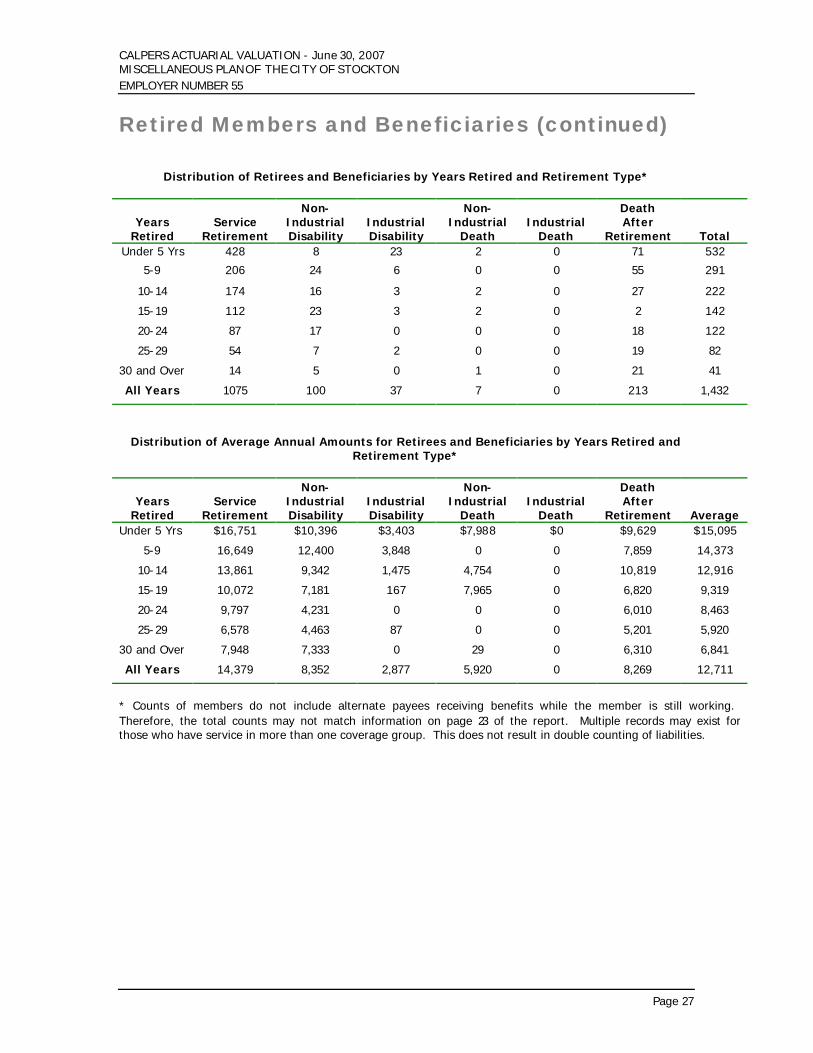
Retired Members and Beneficiaries (continued)
Distribution of Retirees and Beneficiaries by Years Retired and Retirement Type*
Years Retired
Service Retirement
Non-Industrial Disability
Industrial Disability
Non-Industrial
Death Industrial
Death
Death After
Retirement Total Under 5 Yrs 428 8 23 2 0 71 532
5-9 206 24 6 0 0 55 291
10-14 174 16 3 2 0 27 222
15-19 112 23 3 2 0 2 142
20-24 87 17 0 0 0 18 122
25-29 54 7 2 0 0 19 82
30 and Over 14 5 0 1 0 21 41
All Years 1075 100 37 7 0 213 1,432
Distribution of Average Annual Amounts for Retirees and Beneficiaries by Years Retired and Retirement Type*
Years Retired
Service Retirement
Non-Industrial Disability
Industrial Disability
Non-Industrial
Death Industrial
Death
Death After
Retirement Average Under 5 Yrs $16,751 $10,396 $3,403 $7,988 $0 $9,629 $15,095
5-9 16,649 12,400 3,848 0 0 7,859 14,373
10-14 13,861 9,342 1,475 4,754 0 10,819 12,916
15-19 10,072 7,181 167 7,965 0 6,820 9,319
20-24 9,797 4,231 0 0 0 6,010 8,463
25-29 6,578 4,463 87 0 0 5,201 5,920
30 and Over 7,948 7,333 0 29 0 6,310 6,841
All Years 14,379 8,352 2,877 5,920 0 8,269 12,711
* Counts of members do not include alternate payees receiving benefits while the member is still working. Therefore, the total counts may not match information on page 23 of the report. Multiple records may exist for those who have service in more than one coverage group. This does not result in double counting of liabilities.

APPENDICES
• APPENDIX A - STATEMENT OF ACTUARIAL DATA, METHODS AND ASSUMPTIONS
• APPENDIX B - SUMMARY OF PRINCIPAL PLAN PROVISIONS
• APPENDIX C - GASB STATEMENT NO. 27
• APPENDIX D – GLOSSARY OF ACTUARIAL TERMS


APPENDIX A
• STATEMENT OF ACTUARIAL DATA, METHODS AND ASSUMPTIONS

CALPERS ACTUARIAL VALUATION – June 30, 2007 APPENDIX A STATEMENT OF ACTUARIAL METHODS AND ASSUMPTIONS
A-1
Actuarial Data As stated in the Actuarial Certification, the data which serves as the basis of this valuation has been obtained from the various CalPERS databases. We have reviewed the valuation data and believe that it is reasonable and appropriate in aggregate. We are unaware of any potential data issues that would have a material effect on the results of this valuation, except that data does not always contain the latest salary information for former members now in reciprocal systems and does not recognize the potential for usually large salary deviation in certain cases such as elected officials. Therefore, salary information in these cases may not be accurate. These situations are relatively infrequent, however, and when they do occur, they generally do not have a material impact on the employer contribution rates.
Actuarial Methods Funding Method The actuarial funding method used for the Retirement Program is the Entry Age Normal Cost Method. Under this method, projected benefits are determined for all members and the associated liabilities are spread in a manner that produces level annual cost as a percent of pay in each year from the age of hire (entry age) to the assumed retirement age. The cost allocated to the current fiscal year is called the normal cost. The actuarial accrued liability for active members is then calculated as the portion of the total cost of the plan allocated to prior years. The actuarial accrued liability for members currently receiving benefits, for active members beyond the assumed retirement age, and for members entitled to deferred benefits, is equal to the present value of the benefits expected to be paid. No normal costs are applicable for these participants. The excess of the total actuarial accrued liability over the actuarial value of plan assets is called the unfunded actuarial accrued liability. Funding requirements are determined by adding the normal cost and an amortization of the unfunded liability as a level percentage of assumed future payrolls. All changes in liability due to plan amendments, changes in actuarial assumptions, or changes in actuarial methodology are amortized separately over a 20-year period. In addition, all gains or losses are tracked and amortized over a rolling 30 year period. Finally, if a plan’s accrued liability exceeds the actuarial value of assets, the annual contribution with respect to the total unfunded liability may not be less than the amount produced by a 30-year amortization of the unfunded liability. An exception to the funding rules above is used whenever the application of such rules results in inconsistencies. In these cases a “fresh start” approach is used. This simply means that the current unfunded actuarial liability is projected and amortized over a set number of years. As mentioned above, if the annual contribution on the total unfunded liability was less than the amount produced by a 30-year amortization of the unfunded liability, the plan actuary would implement a 30-year fresh start. However, in the case of a 30-year fresh start, just the unfunded liability not already in the (gain)/loss base (which already is amortized over 30 years) will go into the new fresh start base. In addition, a fresh start is needed in the following situations:
1) when a positive payment would be required on a negative unfunded actuarial liability (or conversely a negative payment on a positive unfunded actuarial liability); or
2) when there are excess assets, rather than an unfunded liability. In this situation a 30-year fresh
start is used, unless a longer fresh start is needed to avoid a negative total rate. It should be noted that the actuary may choose to use a fresh start under other circumstances. In all cases, the fresh start period is set by the actuary at what he deems appropriate, and will not be less than five years nor greater than 30 years.
CALPERS ACTUARIAL VALUATION – June 30, 2007 APPENDIX A STATEMENT OF ACTUARIAL METHODS AND ASSUMPTIONS
A-2
Asset Valuation Method In order to dampen the effect of short term market value fluctuations on employer contribution rates, the following asset smoothing technique is used. First an Expected Value of Assets is computed by bringing forward the prior year’s Actuarial Value of Assets and the contributions received and benefits paid during the year at the assumed actuarial rate of return. The Actuarial Value of Assets is then computed as the Expected Value of Assets plus one-fifteenth of the difference between the actual Market Value of Assets and the Expected Value of Assets as of the valuation date. However in no case will the Actuarial Value of Assets be less than 80% or greater than 120% of the actual Market Value of Assets.
Miscellaneous Superfunded Status If a rate plan is superfunded (actuarial value of assets exceeds the present value of benefits), as of the most recently completed annual valuation, the employer may cover their employees’ member contributions (both taxed and tax-deferred) using their employer assets during the fiscal year for which this valuation applies. This would entail transferring assets within the Public Employees’ Retirement Fund (PERF) from the employer account to the member accumulated contribution accounts. This change was implemented effective January 1, 1999 pursuant to Chapter 231 (Assembly Bill 2099) which added Government Code Section 20816. Superfunded status applies only to individual plans, not risk pools. For rate plans within a risk pool, actuarial value of assets is the sum of the rate plan’s side fund plus the rate plan’s pro-rata share of non-side fund assets. Internal Revenue Code Section 415 The limitations on benefits imposed by Internal Revenue Code Section 415 were not taken into account in this valuation. The effect of these limitations has been deemed immaterial on the overall results of this valuation. Internal Revenue Code Section 401(a)(17) The limitations on compensation imposed by Internal Revenue Code Section 401(a)(17) were taken into account in this valuation. It was determined that this change generally had minimal impact on the employer rates and no special amortization base has been created.
CALPERS ACTUARIAL VALUATION – June 30, 2007 APPENDIX A STATEMENT OF ACTUARIAL METHODS AND ASSUMPTIONS
A-3
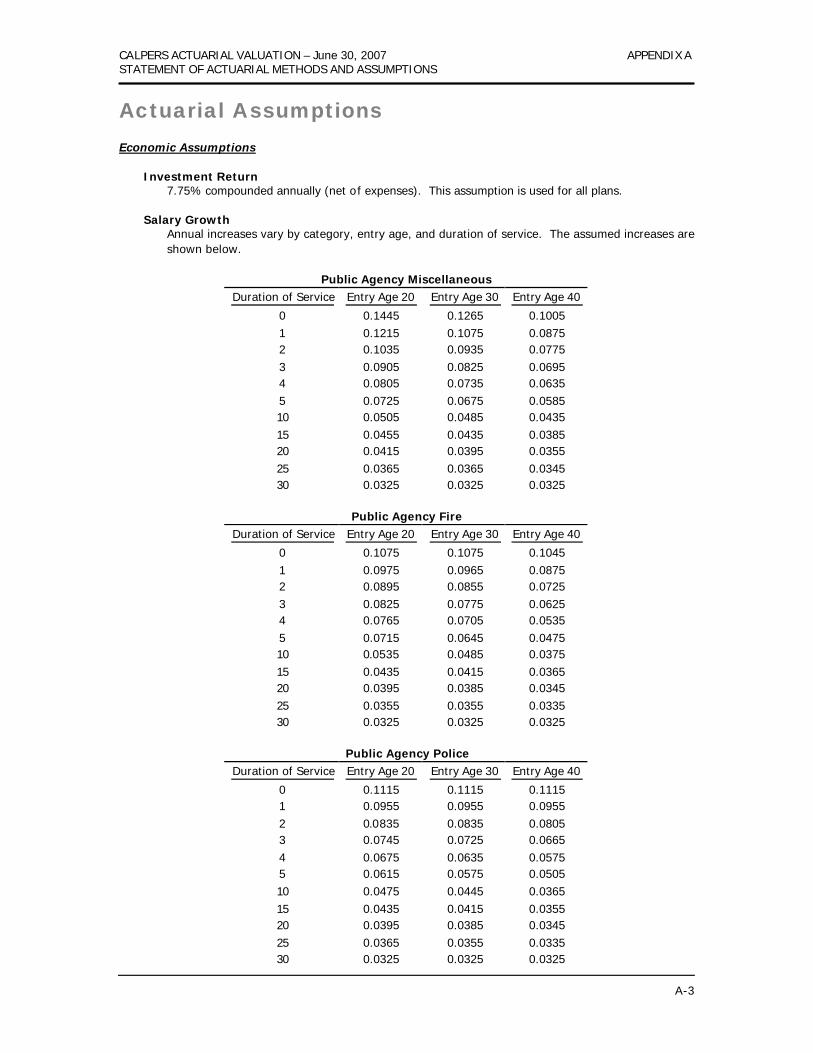
Actuarial Assumptions Economic Assumptions
Investment Return 7.75% compounded annually (net of expenses). This assumption is used for all plans.
Salary Growth Annual increases vary by category, entry age, and duration of service. The assumed increases are shown below.
Public Agency Miscellaneous
Duration of Service Entry Age 20 Entry Age 30 Entry Age 40
0 0.1445 0.1265 0.1005 1 0.1215 0.1075 0.0875 2 0.1035 0.0935 0.0775 3 0.0905 0.0825 0.0695 4 0.0805 0.0735 0.0635 5 0.0725 0.0675 0.0585 10 0.0505 0.0485 0.0435 15 0.0455 0.0435 0.0385 20 0.0415 0.0395 0.0355 25 0.0365 0.0365 0.0345 30 0.0325 0.0325 0.0325
Public Agency Fire
Duration of Service Entry Age 20 Entry Age 30 Entry Age 40
0 0.1075 0.1075 0.1045 1 0.0975 0.0965 0.0875 2 0.0895 0.0855 0.0725 3 0.0825 0.0775 0.0625 4 0.0765 0.0705 0.0535 5 0.0715 0.0645 0.0475 10 0.0535 0.0485 0.0375 15 0.0435 0.0415 0.0365 20 0.0395 0.0385 0.0345 25 0.0355 0.0355 0.0335 30 0.0325 0.0325 0.0325
Public Agency Police
Duration of Service Entry Age 20 Entry Age 30 Entry Age 40
0 0.1115 0.1115 0.1115 1 0.0955 0.0955 0.0955 2 0.0835 0.0835 0.0805 3 0.0745 0.0725 0.0665 4 0.0675 0.0635 0.0575 5 0.0615 0.0575 0.0505 10 0.0475 0.0445 0.0365 15 0.0435 0.0415 0.0355 20 0.0395 0.0385 0.0345 25 0.0365 0.0355 0.0335 30 0.0325 0.0325 0.0325
CALPERS ACTUARIAL VALUATION – June 30, 2007 APPENDIX A STATEMENT OF ACTUARIAL METHODS AND ASSUMPTIONS
A-4
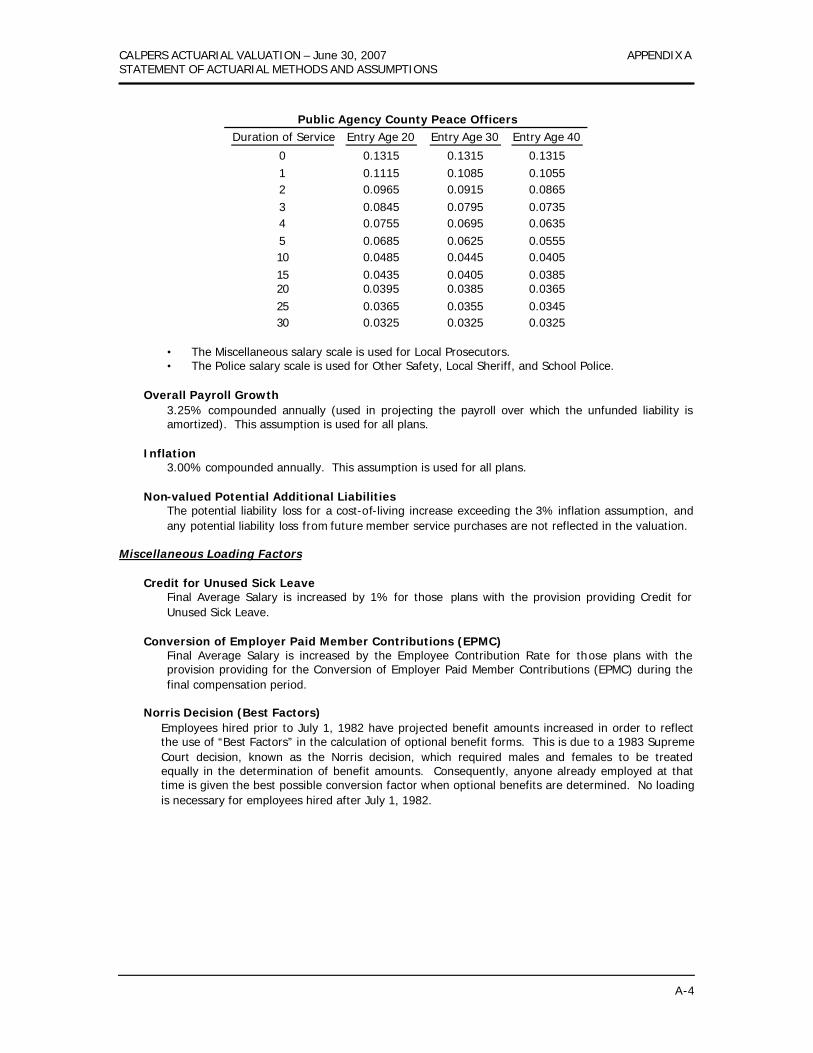
Public Agency County Peace Officers
Duration of Service Entry Age 20 Entry Age 30 Entry Age 40
0 0.1315 0.1315 0.1315 1 0.1115 0.1085 0.1055 2 0.0965 0.0915 0.0865 3 0.0845 0.0795 0.0735 4 0.0755 0.0695 0.0635 5 0.0685 0.0625 0.0555 10 0.0485 0.0445 0.0405 15 0.0435 0.0405 0.0385 20 0.0395 0.0385 0.0365 25 0.0365 0.0355 0.0345 30 0.0325 0.0325 0.0325
• The Miscellaneous salary scale is used for Local Prosecutors. • The Police salary scale is used for Other Safety, Local Sheriff, and School Police.
Overall Payroll Growth
3.25% compounded annually (used in projecting the payroll over which the unfunded liability is amortized). This assumption is used for all plans.
Inflation 3.00% compounded annually. This assumption is used for all plans.
Non-valued Potential Additional Liabilities The potential liability loss for a cost-of-living increase exceeding the 3% inflation assumption, and any potential liability loss from future member service purchases are not reflected in the valuation.
Miscellaneous Loading Factors
Credit for Unused Sick Leave Final Average Salary is increased by 1% for those plans with the provision providing Credit for Unused Sick Leave.
Conversion of Employer Paid Member Contributions (EPMC) Final Average Salary is increased by the Employee Contribution Rate for those plans with the provision providing for the Conversion of Employer Paid Member Contributions (EPMC) during the final compensation period.
Norris Decision (Best Factors) Employees hired prior to July 1, 1982 have projected benefit amounts increased in order to reflect the use of “Best Factors” in the calculation of optional benefit forms. This is due to a 1983 Supreme Court decision, known as the Norris decision, which required males and females to be treated equally in the determination of benefit amounts. Consequently, anyone already employed at that time is given the best possible conversion factor when optional benefits are determined. No loading is necessary for employees hired after July 1, 1982.
CALPERS ACTUARIAL VALUATION – June 30, 2007 APPENDIX A STATEMENT OF ACTUARIAL METHODS AND ASSUMPTIONS
A-5
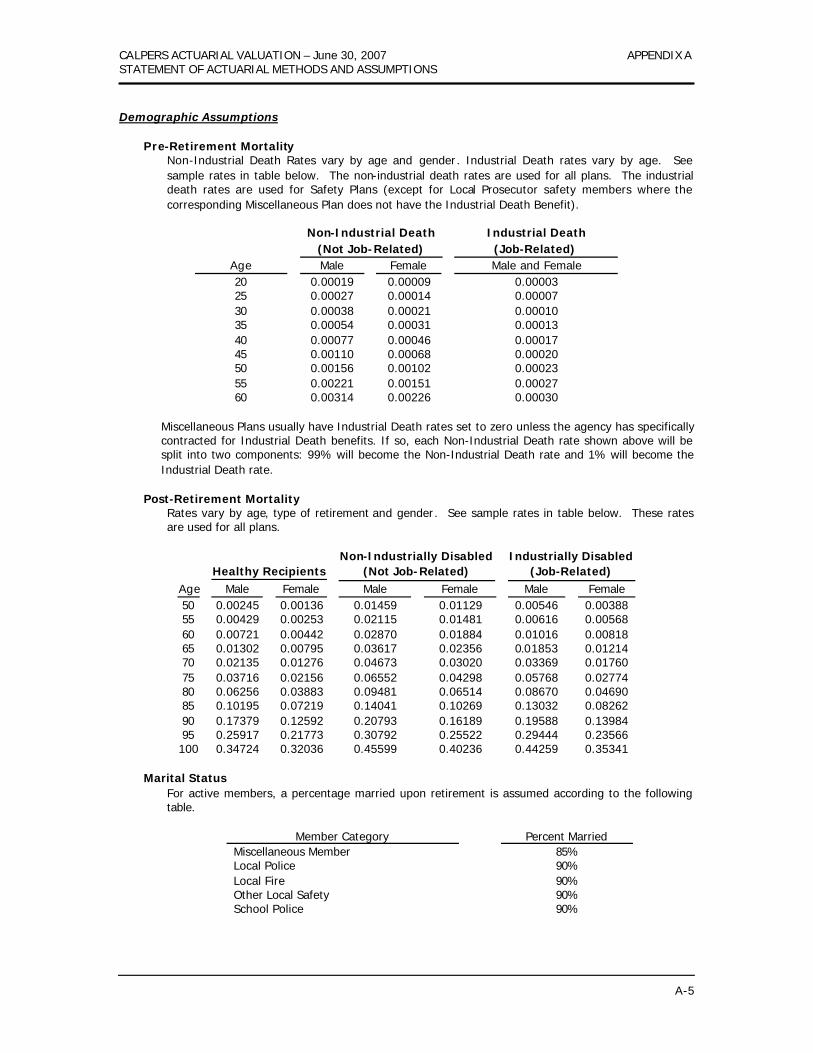
Demographic Assumptions
Pre-Retirement Mortality Non-Industrial Death Rates vary by age and gender. Industrial Death rates vary by age. See sample rates in table below. The non-industrial death rates are used for all plans. The industrial death rates are used for Safety Plans (except for Local Prosecutor safety members where the corresponding Miscellaneous Plan does not have the Industrial Death Benefit).
Non-Industrial Death Industrial Death (Not Job-Related) (Job-Related)
Age Male Female Male and Female 20 0.00019 0.00009 0.00003 25 0.00027 0.00014 0.00007 30 0.00038 0.00021 0.00010 35 0.00054 0.00031 0.00013 40 0.00077 0.00046 0.00017 45 0.00110 0.00068 0.00020 50 0.00156 0.00102 0.00023 55 0.00221 0.00151 0.00027 60 0.00314 0.00226 0.00030
Miscellaneous Plans usually have Industrial Death rates set to zero unless the agency has specifically contracted for Industrial Death benefits. If so, each Non-Industrial Death rate shown above will be split into two components: 99% will become the Non-Industrial Death rate and 1% will become the Industrial Death rate.
Post-Retirement Mortality Rates vary by age, type of retirement and gender. See sample rates in table below. These rates are used for all plans.
Non-Industrially Disabled Industrially Disabled Healthy Recipients (Not Job-Related) (Job-Related)
Age Male Female Male Female Male Female 50 0.00245 0.00136 0.01459 0.01129 0.00546 0.00388 55 0.00429 0.00253 0.02115 0.01481 0.00616 0.00568 60 0.00721 0.00442 0.02870 0.01884 0.01016 0.00818 65 0.01302 0.00795 0.03617 0.02356 0.01853 0.01214 70 0.02135 0.01276 0.04673 0.03020 0.03369 0.01760 75 0.03716 0.02156 0.06552 0.04298 0.05768 0.02774 80 0.06256 0.03883 0.09481 0.06514 0.08670 0.04690 85 0.10195 0.07219 0.14041 0.10269 0.13032 0.08262 90 0.17379 0.12592 0.20793 0.16189 0.19588 0.13984 95 0.25917 0.21773 0.30792 0.25522 0.29444 0.23566 100 0.34724 0.32036 0.45599 0.40236 0.44259 0.35341
Marital Status
For active members, a percentage married upon retirement is assumed according to the following table.
Member Category Percent Married Miscellaneous Member 85% Local Police 90% Local Fire 90% Other Local Safety 90% School Police 90%
CALPERS ACTUARIAL VALUATION – June 30, 2007 APPENDIX A STATEMENT OF ACTUARIAL METHODS AND ASSUMPTIONS
A-6
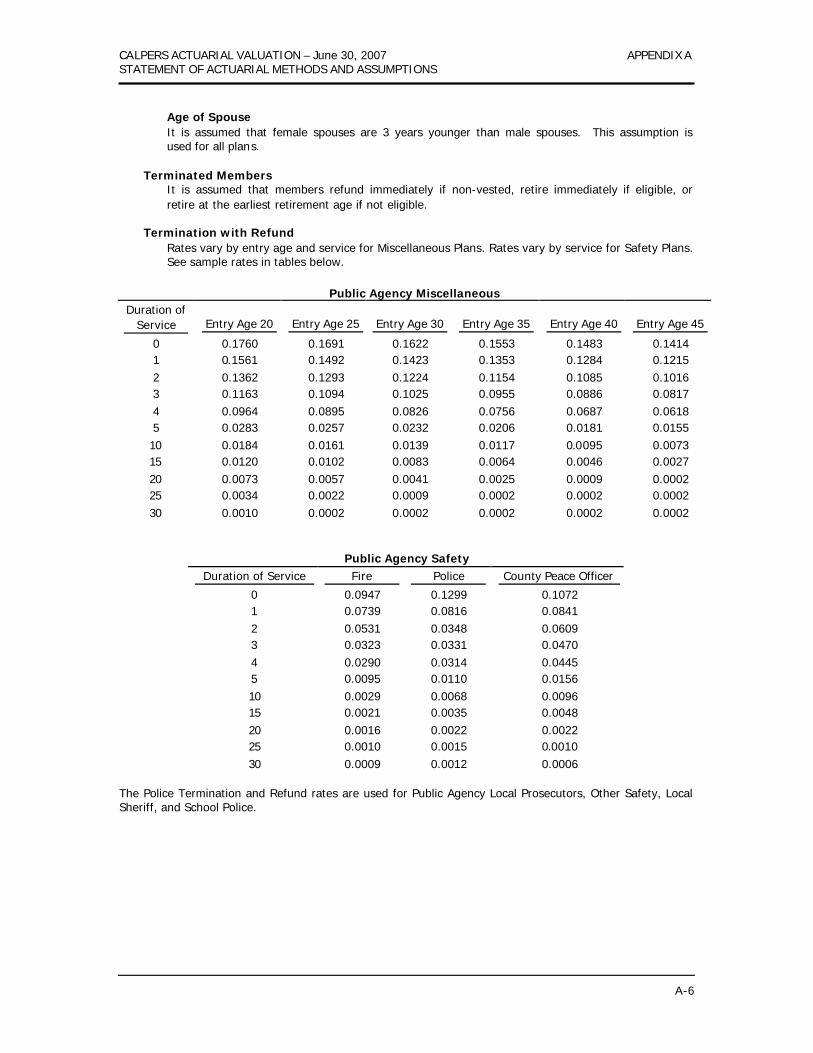
Age of Spouse
It is assumed that female spouses are 3 years younger than male spouses. This assumption is used for all plans.
Terminated Members It is assumed that members refund immediately if non-vested, retire immediately if eligible, or retire at the earliest retirement age if not eligible.
Termination with Refund Rates vary by entry age and service for Miscellaneous Plans. Rates vary by service for Safety Plans. See sample rates in tables below.
Public Agency Miscellaneous Duration of
Service Entry Age 20 Entry Age 25 Entry Age 30 Entry Age 35 Entry Age 40 Entry Age 45
0 0.1760 0.1691 0.1622 0.1553 0.1483 0.1414 1 0.1561 0.1492 0.1423 0.1353 0.1284 0.1215 2 0.1362 0.1293 0.1224 0.1154 0.1085 0.1016 3 0.1163 0.1094 0.1025 0.0955 0.0886 0.0817 4 0.0964 0.0895 0.0826 0.0756 0.0687 0.0618 5 0.0283 0.0257 0.0232 0.0206 0.0181 0.0155 10 0.0184 0.0161 0.0139 0.0117 0.0095 0.0073 15 0.0120 0.0102 0.0083 0.0064 0.0046 0.0027 20 0.0073 0.0057 0.0041 0.0025 0.0009 0.0002 25 0.0034 0.0022 0.0009 0.0002 0.0002 0.0002 30 0.0010 0.0002 0.0002 0.0002 0.0002 0.0002
Public Agency Safety Duration of Service Fire Police County Peace Officer
0 0.0947 0.1299 0.1072 1 0.0739 0.0816 0.0841 2 0.0531 0.0348 0.0609 3 0.0323 0.0331 0.0470 4 0.0290 0.0314 0.0445 5 0.0095 0.0110 0.0156 10 0.0029 0.0068 0.0096 15 0.0021 0.0035 0.0048 20 0.0016 0.0022 0.0022 25 0.0010 0.0015 0.0010 30 0.0009 0.0012 0.0006
The Police Termination and Refund rates are used for Public Agency Local Prosecutors, Other Safety, Local Sheriff, and School Police.
CALPERS ACTUARIAL VALUATION – June 30, 2007 APPENDIX A STATEMENT OF ACTUARIAL METHODS AND ASSUMPTIONS
A-7
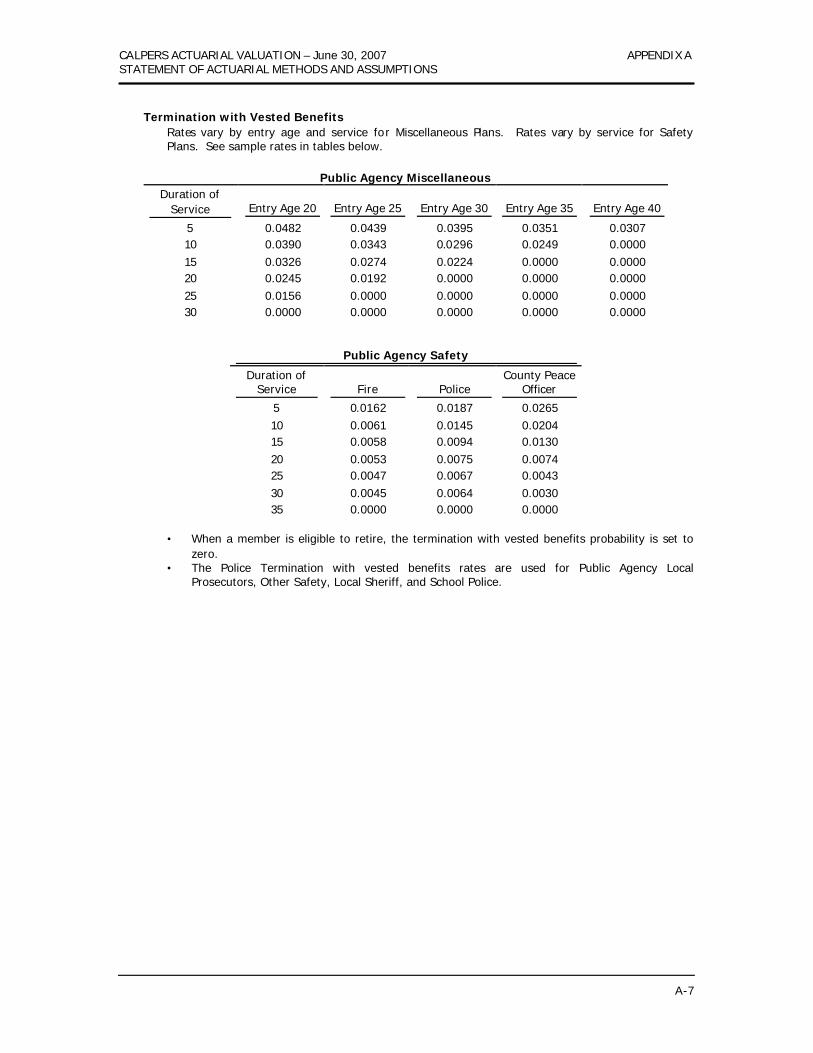
Termination with Vested Benefits
Rates vary by entry age and service for Miscellaneous Plans. Rates vary by service for Safety Plans. See sample rates in tables below.
Public Agency Miscellaneous Duration of
Service Entry Age 20 Entry Age 25 Entry Age 30 Entry Age 35 Entry Age 40
5 0.0482 0.0439 0.0395 0.0351 0.0307 10 0.0390 0.0343 0.0296 0.0249 0.0000 15 0.0326 0.0274 0.0224 0.0000 0.0000 20 0.0245 0.0192 0.0000 0.0000 0.0000 25 0.0156 0.0000 0.0000 0.0000 0.0000 30 0.0000 0.0000 0.0000 0.0000 0.0000
Public Agency Safety
Duration of Service Fire Police
County Peace Officer
5 0.0162 0.0187 0.0265 10 0.0061 0.0145 0.0204 15 0.0058 0.0094 0.0130 20 0.0053 0.0075 0.0074 25 0.0047 0.0067 0.0043 30 0.0045 0.0064 0.0030 35 0.0000 0.0000 0.0000
• When a member is eligible to retire, the termination with vested benefits probability is set to
zero. • The Police Termination with vested benefits rates are used for Public Agency Local
Prosecutors, Other Safety, Local Sheriff, and School Police.
CALPERS ACTUARIAL VALUATION – June 30, 2007 APPENDIX A STATEMENT OF ACTUARIAL METHODS AND ASSUMPTIONS
A-8
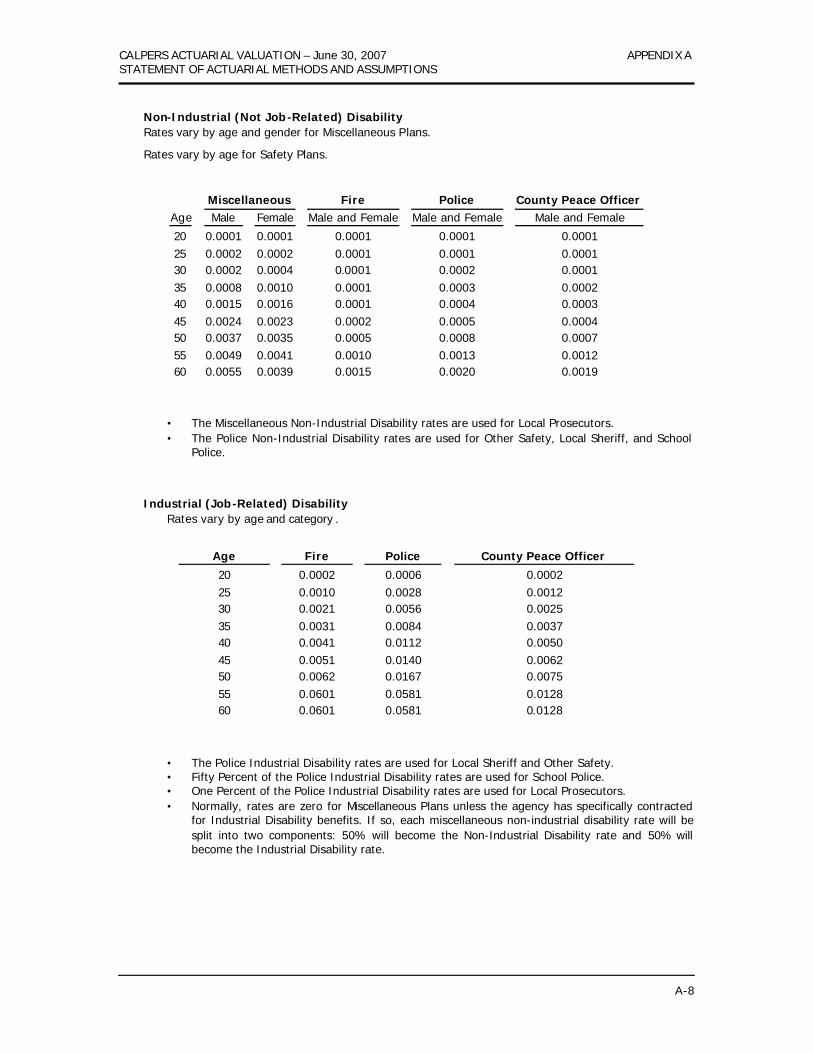
Non-Industrial (Not Job-Related) Disability Rates vary by age and gender for Miscellaneous P lans.
Rates vary by age for Safety Plans.
Miscellaneous Fire Police County Peace Officer Age Male Female Male and Female Male and Female Male and Female
20 0.0001 0.0001 0.0001 0.0001 0.0001 25 0.0002 0.0002 0.0001 0.0001 0.0001 30 0.0002 0.0004 0.0001 0.0002 0.0001 35 0.0008 0.0010 0.0001 0.0003 0.0002 40 0.0015 0.0016 0.0001 0.0004 0.0003 45 0.0024 0.0023 0.0002 0.0005 0.0004 50 0.0037 0.0035 0.0005 0.0008 0.0007 55 0.0049 0.0041 0.0010 0.0013 0.0012 60 0.0055 0.0039 0.0015 0.0020 0.0019
• The Miscellaneous Non-Industrial Disability rates are used for Local Prosecutors. • The Police Non-Industrial Disability rates are used for Other Safety, Local Sheriff, and School
Police.
Industrial (Job-Related) Disability Rates vary by age and category .
Age Fire Police County Peace Officer
20 0.0002 0.0006 0.0002 25 0.0010 0.0028 0.0012 30 0.0021 0.0056 0.0025 35 0.0031 0.0084 0.0037 40 0.0041 0.0112 0.0050 45 0.0051 0.0140 0.0062 50 0.0062 0.0167 0.0075 55 0.0601 0.0581 0.0128 60 0.0601 0.0581 0.0128
• The Police Industrial Disability rates are used for Local Sheriff and Other Safety. • Fifty Percent of the Police Industrial Disability rates are used for School Police. • One Percent of the Police Industrial Disability rates are used for Local Prosecutors. • Normally, rates are zero for Miscellaneous Plans unless the agency has specifically contracted
for Industrial Disability benefits. If so, each miscellaneous non-industrial disability rate will be split into two components: 50% will become the Non-Industrial Disability rate and 50% will become the Industrial Disability rate.
CALPERS ACTUARIAL VALUATION – June 30, 2007 APPENDIX A STATEMENT OF ACTUARIAL METHODS AND ASSUMPTIONS
A-9
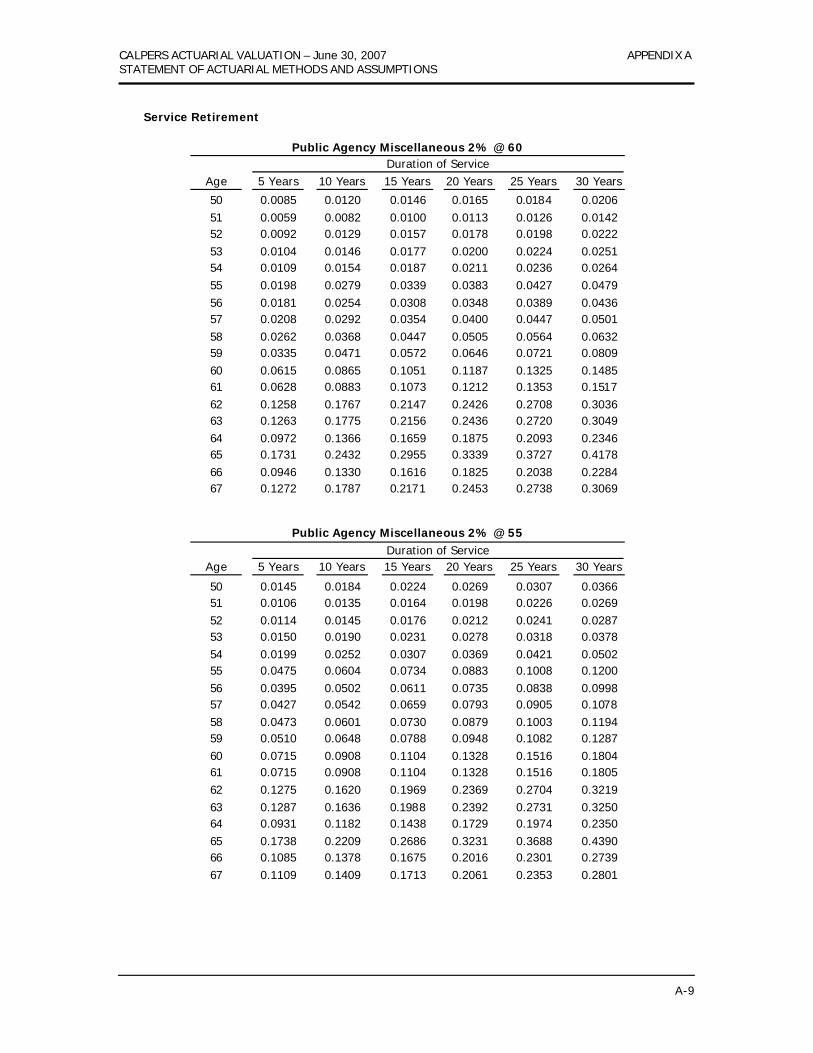
Service Retirement
Public Agency Miscellaneous 2% @ 60
Duration of Service Age 5 Years 10 Years 15 Years 20 Years 25 Years 30 Years
50 0.0085 0.0120 0.0146 0.0165 0.0184 0.0206 51 0.0059 0.0082 0.0100 0.0113 0.0126 0.0142 52 0.0092 0.0129 0.0157 0.0178 0.0198 0.0222 53 0.0104 0.0146 0.0177 0.0200 0.0224 0.0251 54 0.0109 0.0154 0.0187 0.0211 0.0236 0.0264 55 0.0198 0.0279 0.0339 0.0383 0.0427 0.0479 56 0.0181 0.0254 0.0308 0.0348 0.0389 0.0436 57 0.0208 0.0292 0.0354 0.0400 0.0447 0.0501 58 0.0262 0.0368 0.0447 0.0505 0.0564 0.0632 59 0.0335 0.0471 0.0572 0.0646 0.0721 0.0809 60 0.0615 0.0865 0.1051 0.1187 0.1325 0.1485 61 0.0628 0.0883 0.1073 0.1212 0.1353 0.1517 62 0.1258 0.1767 0.2147 0.2426 0.2708 0.3036 63 0.1263 0.1775 0.2156 0.2436 0.2720 0.3049 64 0.0972 0.1366 0.1659 0.1875 0.2093 0.2346 65 0.1731 0.2432 0.2955 0.3339 0.3727 0.4178 66 0.0946 0.1330 0.1616 0.1825 0.2038 0.2284 67 0.1272 0.1787 0.2171 0.2453 0.2738 0.3069
Public Agency Miscellaneous 2% @ 55
Duration of Service Age 5 Years 10 Years 15 Years 20 Years 25 Years 30 Years
50 0.0145 0.0184 0.0224 0.0269 0.0307 0.0366 51 0.0106 0.0135 0.0164 0.0198 0.0226 0.0269 52 0.0114 0.0145 0.0176 0.0212 0.0241 0.0287 53 0.0150 0.0190 0.0231 0.0278 0.0318 0.0378 54 0.0199 0.0252 0.0307 0.0369 0.0421 0.0502 55 0.0475 0.0604 0.0734 0.0883 0.1008 0.1200 56 0.0395 0.0502 0.0611 0.0735 0.0838 0.0998 57 0.0427 0.0542 0.0659 0.0793 0.0905 0.1078 58 0.0473 0.0601 0.0730 0.0879 0.1003 0.1194 59 0.0510 0.0648 0.0788 0.0948 0.1082 0.1287 60 0.0715 0.0908 0.1104 0.1328 0.1516 0.1804 61 0.0715 0.0908 0.1104 0.1328 0.1516 0.1805 62 0.1275 0.1620 0.1969 0.2369 0.2704 0.3219 63 0.1287 0.1636 0.1988 0.2392 0.2731 0.3250 64 0.0931 0.1182 0.1438 0.1729 0.1974 0.2350 65 0.1738 0.2209 0.2686 0.3231 0.3688 0.4390 66 0.1085 0.1378 0.1675 0.2016 0.2301 0.2739 67 0.1109 0.1409 0.1713 0.2061 0.2353 0.2801
CALPERS ACTUARIAL VALUATION – June 30, 2007 APPENDIX A STATEMENT OF ACTUARIAL METHODS AND ASSUMPTIONS
A-10
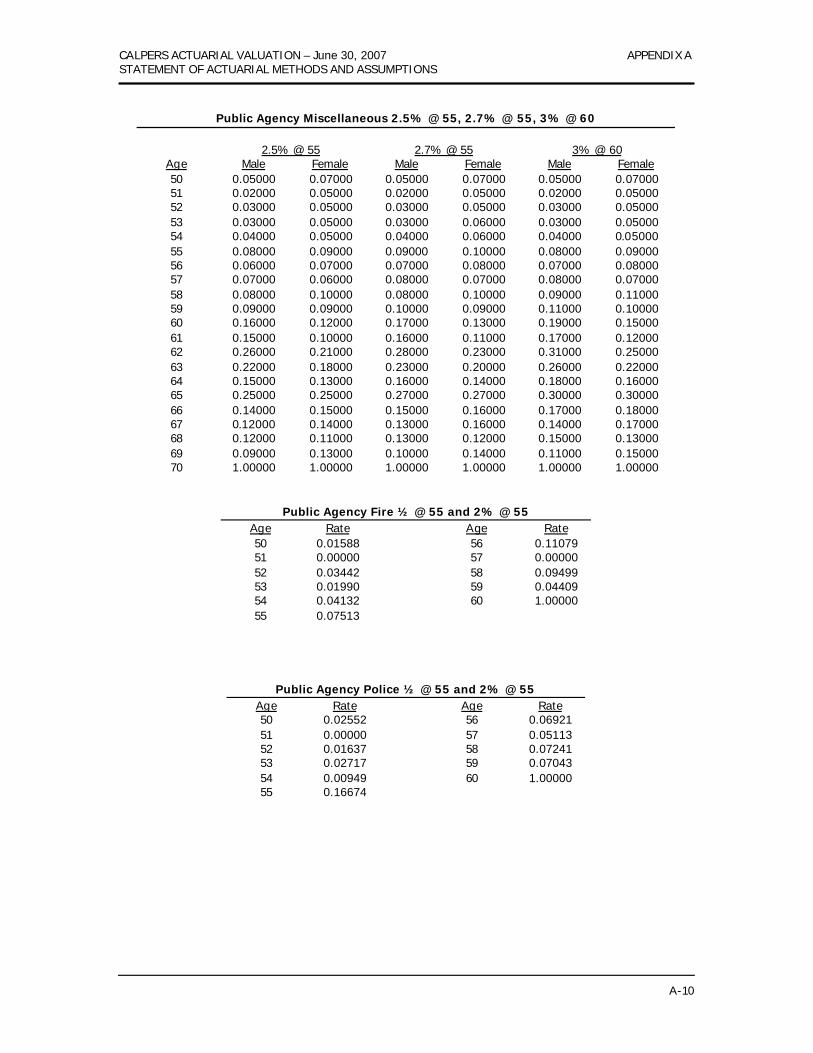
Public Agency Miscellaneous 2.5% @ 55, 2.7% @ 55, 3% @ 60
2.5% @ 55 2.7% @ 55 3% @ 60
Age 50 51 52 53 54 55 56 57 58 59 60 61 62 63 64 65 66 67 68 69 70
Male 0.05000 0.02000 0.03000 0.03000 0.04000 0.08000 0.06000 0.07000 0.08000 0.09000 0.16000 0.15000 0.26000 0.22000 0.15000 0.25000 0.14000 0.12000 0.12000 0.09000 1.00000
Female 0.07000 0.05000 0.05000 0.05000 0.05000 0.09000 0.07000 0.06000 0.10000 0.09000 0.12000 0.10000 0.21000 0.18000 0.13000 0.25000 0.15000 0.14000 0.11000 0.13000 1.00000
Male 0.05000 0.02000 0.03000 0.03000 0.04000 0.09000 0.07000 0.08000 0.08000 0.10000 0.17000 0.16000 0.28000 0.23000 0.16000 0.27000 0.15000 0.13000 0.13000 0.10000 1.00000
Female 0.07000 0.05000 0.05000 0.06000 0.06000 0.10000 0.08000 0.07000 0.10000 0.09000 0.13000 0.11000 0.23000 0.20000 0.14000 0.27000 0.16000 0.16000 0.12000 0.14000 1.00000
Male 0.05000 0.02000 0.03000 0.03000 0.04000 0.08000 0.07000 0.08000 0.09000 0.11000 0.19000 0.17000 0.31000 0.26000 0.18000 0.30000 0.17000 0.14000 0.15000 0.11000 1.00000
Female 0.07000 0.05000 0.05000 0.05000 0.05000 0.09000 0.08000 0.07000 0.11000 0.10000 0.15000 0.12000 0.25000 0.22000 0.16000 0.30000 0.18000 0.17000 0.13000 0.15000 1.00000
Public Agency Fire ½ @ 55 and 2% @ 55 Age 50 51 52 53 54 55
Rate 0.01588 0.00000 0.03442 0.01990 0.04132 0.07513
Age 56 57 58 59 60
Rate 0.11079 0.00000 0.09499 0.04409 1.00000
Public Agency Police ½ @ 55 and 2% @ 55 Age 50 51 52 53 54 55
Rate 0.02552 0.00000 0.01637 0.02717 0.00949 0.16674
Age 56 57 58 59 60
Rate 0.06921 0.05113 0.07241 0.07043 1.00000
CALPERS ACTUARIAL VALUATION – June 30, 2007 APPENDIX A STATEMENT OF ACTUARIAL METHODS AND ASSUMPTIONS
A-11
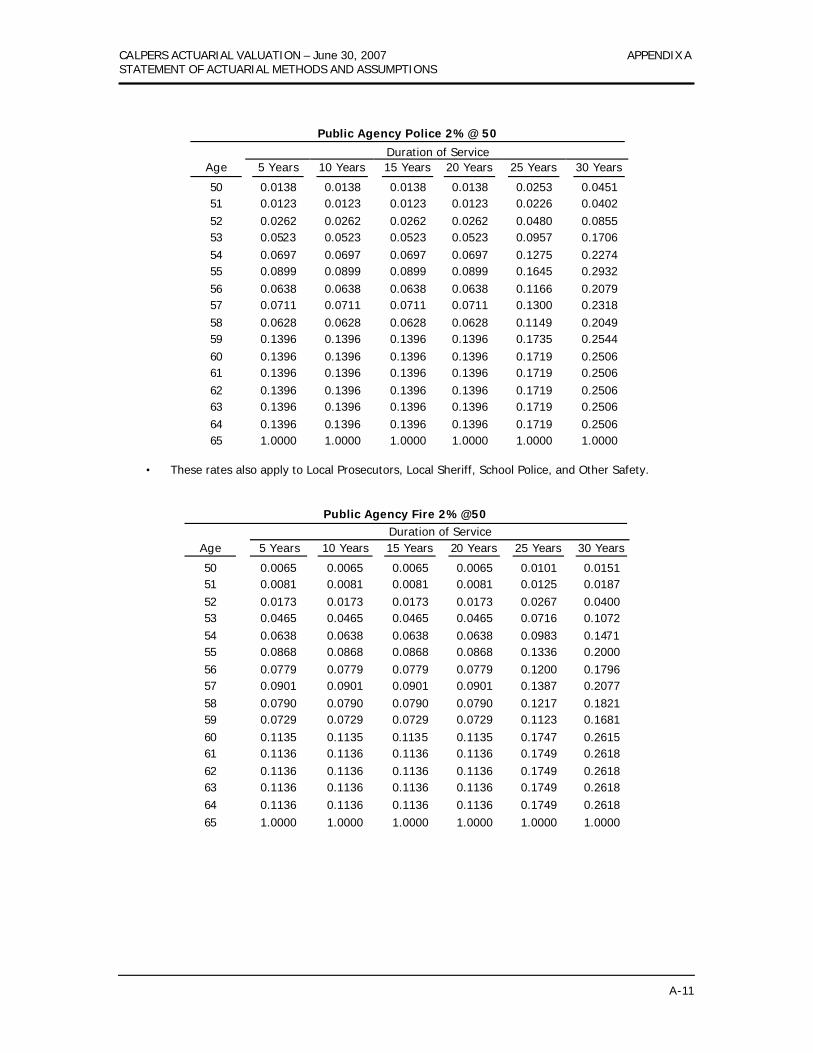
Public Agency Police 2%@ 50
Duration of Service Age 5 Years 10 Years 15 Years 20 Years 25 Years 30 Years
50 0.0138 0.0138 0.0138 0.0138 0.0253 0.0451 51 0.0123 0.0123 0.0123 0.0123 0.0226 0.0402 52 0.0262 0.0262 0.0262 0.0262 0.0480 0.0855 53 0.0523 0.0523 0.0523 0.0523 0.0957 0.1706 54 0.0697 0.0697 0.0697 0.0697 0.1275 0.2274 55 0.0899 0.0899 0.0899 0.0899 0.1645 0.2932 56 0.0638 0.0638 0.0638 0.0638 0.1166 0.2079 57 0.0711 0.0711 0.0711 0.0711 0.1300 0.2318 58 0.0628 0.0628 0.0628 0.0628 0.1149 0.2049 59 0.1396 0.1396 0.1396 0.1396 0.1735 0.2544 60 0.1396 0.1396 0.1396 0.1396 0.1719 0.2506 61 0.1396 0.1396 0.1396 0.1396 0.1719 0.2506 62 0.1396 0.1396 0.1396 0.1396 0.1719 0.2506 63 0.1396 0.1396 0.1396 0.1396 0.1719 0.2506 64 0.1396 0.1396 0.1396 0.1396 0.1719 0.2506 65 1.0000 1.0000 1.0000 1.0000 1.0000 1.0000
• These rates also apply to Local Prosecutors, Local Sheriff, School Police, and Other Safety.
Public Agency Fire 2%@50
Duration of Service Age 5 Years 10 Years 15 Years 20 Years 25 Years 30 Years
50 0.0065 0.0065 0.0065 0.0065 0.0101 0.0151 51 0.0081 0.0081 0.0081 0.0081 0.0125 0.0187 52 0.0173 0.0173 0.0173 0.0173 0.0267 0.0400 53 0.0465 0.0465 0.0465 0.0465 0.0716 0.1072 54 0.0638 0.0638 0.0638 0.0638 0.0983 0.1471 55 0.0868 0.0868 0.0868 0.0868 0.1336 0.2000 56 0.0779 0.0779 0.0779 0.0779 0.1200 0.1796 57 0.0901 0.0901 0.0901 0.0901 0.1387 0.2077 58 0.0790 0.0790 0.0790 0.0790 0.1217 0.1821 59 0.0729 0.0729 0.0729 0.0729 0.1123 0.1681 60 0.1135 0.1135 0.1135 0.1135 0.1747 0.2615 61 0.1136 0.1136 0.1136 0.1136 0.1749 0.2618 62 0.1136 0.1136 0.1136 0.1136 0.1749 0.2618 63 0.1136 0.1136 0.1136 0.1136 0.1749 0.2618 64 0.1136 0.1136 0.1136 0.1136 0.1749 0.2618 65 1.0000 1.0000 1.0000 1.0000 1.0000 1.0000
CALPERS ACTUARIAL VALUATION – June 30, 2007 APPENDIX A STATEMENT OF ACTUARIAL METHODS AND ASSUMPTIONS
A-12
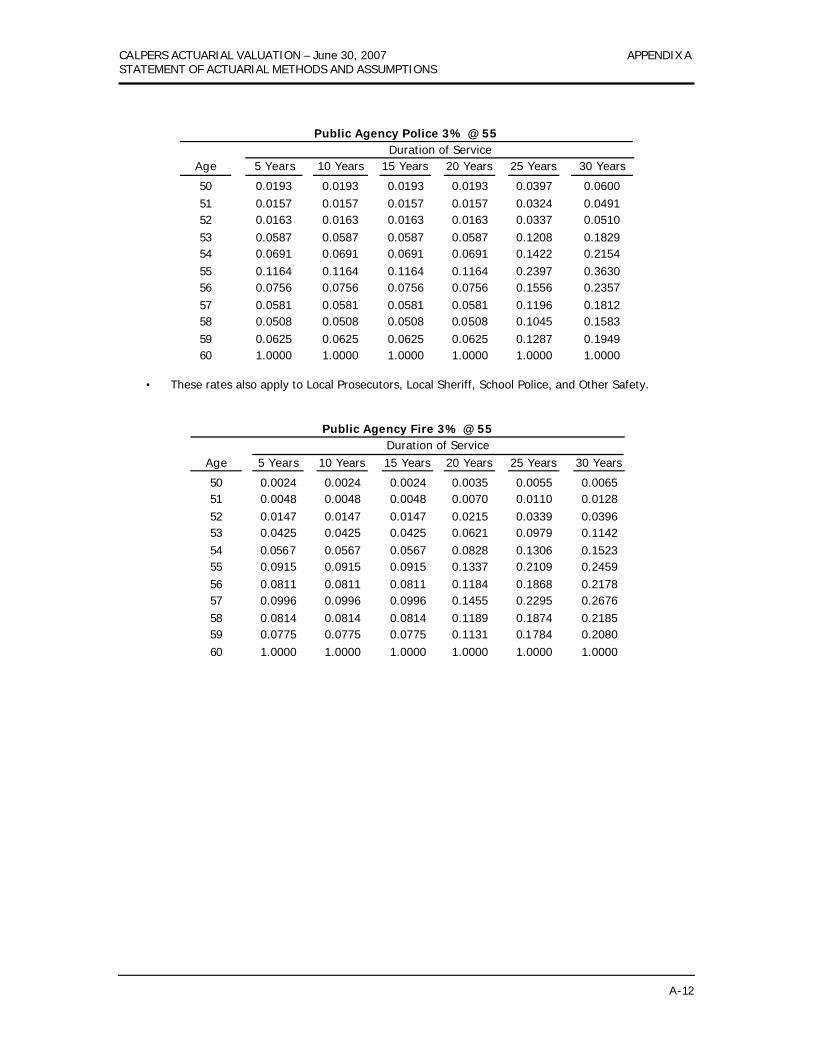
Public Agency Police 3% @ 55
Duration of Service Age 5 Years 10 Years 15 Years 20 Years 25 Years 30 Years
50 0.0193 0.0193 0.0193 0.0193 0.0397 0.0600 51 0.0157 0.0157 0.0157 0.0157 0.0324 0.0491 52 0.0163 0.0163 0.0163 0.0163 0.0337 0.0510 53 0.0587 0.0587 0.0587 0.0587 0.1208 0.1829 54 0.0691 0.0691 0.0691 0.0691 0.1422 0.2154 55 0.1164 0.1164 0.1164 0.1164 0.2397 0.3630 56 0.0756 0.0756 0.0756 0.0756 0.1556 0.2357 57 0.0581 0.0581 0.0581 0.0581 0.1196 0.1812 58 0.0508 0.0508 0.0508 0.0508 0.1045 0.1583 59 0.0625 0.0625 0.0625 0.0625 0.1287 0.1949 60 1.0000 1.0000 1.0000 1.0000 1.0000 1.0000
• These rates also apply to Local Prosecutors, Local Sheriff, School Police, and Other Safety.
Public Agency Fire 3% @ 55
Duration of Service Age 5 Years 10 Years 15 Years 20 Years 25 Years 30 Years
50 0.0024 0.0024 0.0024 0.0035 0.0055 0.0065 51 0.0048 0.0048 0.0048 0.0070 0.0110 0.0128 52 0.0147 0.0147 0.0147 0.0215 0.0339 0.0396 53 0.0425 0.0425 0.0425 0.0621 0.0979 0.1142 54 0.0567 0.0567 0.0567 0.0828 0.1306 0.1523 55 0.0915 0.0915 0.0915 0.1337 0.2109 0.2459 56 0.0811 0.0811 0.0811 0.1184 0.1868 0.2178 57 0.0996 0.0996 0.0996 0.1455 0.2295 0.2676 58 0.0814 0.0814 0.0814 0.1189 0.1874 0.2185 59 0.0775 0.0775 0.0775 0.1131 0.1784 0.2080 60 1.0000 1.0000 1.0000 1.0000 1.0000 1.0000
CALPERS ACTUARIAL VALUATION – June 30, 2007 APPENDIX A STATEMENT OF ACTUARIAL METHODS AND ASSUMPTIONS
A-13
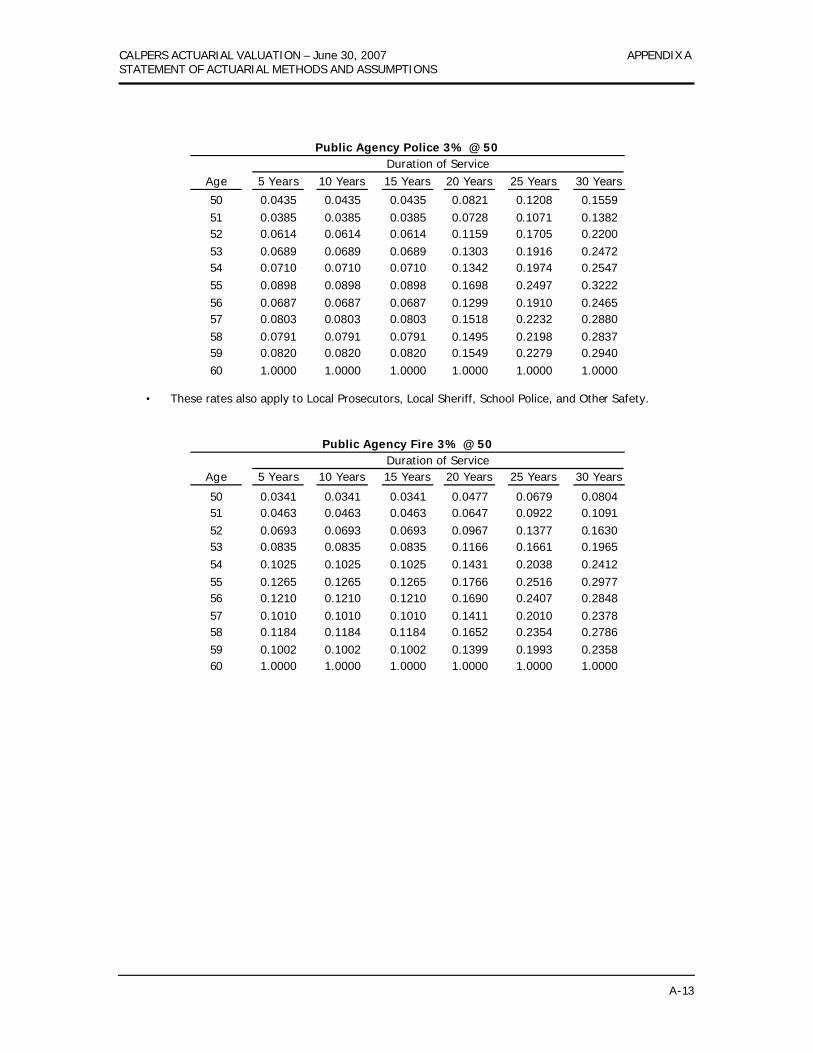
Public Agency Police 3% @ 50
Duration of Service Age 5 Years 10 Years 15 Years 20 Years 25 Years 30 Years
50 0.0435 0.0435 0.0435 0.0821 0.1208 0.1559 51 0.0385 0.0385 0.0385 0.0728 0.1071 0.1382 52 0.0614 0.0614 0.0614 0.1159 0.1705 0.2200 53 0.0689 0.0689 0.0689 0.1303 0.1916 0.2472 54 0.0710 0.0710 0.0710 0.1342 0.1974 0.2547 55 0.0898 0.0898 0.0898 0.1698 0.2497 0.3222 56 0.0687 0.0687 0.0687 0.1299 0.1910 0.2465 57 0.0803 0.0803 0.0803 0.1518 0.2232 0.2880 58 0.0791 0.0791 0.0791 0.1495 0.2198 0.2837 59 0.0820 0.0820 0.0820 0.1549 0.2279 0.2940 60 1.0000 1.0000 1.0000 1.0000 1.0000 1.0000
• These rates also apply to Local Prosecutors, Local Sheriff, School Police, and Other Safety.
Public Agency Fire 3% @ 50
Duration of Service Age 5 Years 10 Years 15 Years 20 Years 25 Years 30 Years
50 0.0341 0.0341 0.0341 0.0477 0.0679 0.0804 51 0.0463 0.0463 0.0463 0.0647 0.0922 0.1091 52 0.0693 0.0693 0.0693 0.0967 0.1377 0.1630 53 0.0835 0.0835 0.0835 0.1166 0.1661 0.1965 54 0.1025 0.1025 0.1025 0.1431 0.2038 0.2412 55 0.1265 0.1265 0.1265 0.1766 0.2516 0.2977 56 0.1210 0.1210 0.1210 0.1690 0.2407 0.2848 57 0.1010 0.1010 0.1010 0.1411 0.2010 0.2378 58 0.1184 0.1184 0.1184 0.1652 0.2354 0.2786 59 0.1002 0.1002 0.1002 0.1399 0.1993 0.2358 60 1.0000 1.0000 1.0000 1.0000 1.0000 1.0000


APPENDIX B
• SUMMARY OF MAJOR BENEFIT OPTIONS
• DESCRIPTIONS OF PRINCIPAL PLAN PROVISIONS

CALPERS ACTUARIAL VALUATION – June 30, 2007 APPENDIX B MISCELLANEOUS PLAN OF THE CITY OF STOCKTON EMPLOYER NUMBER 55
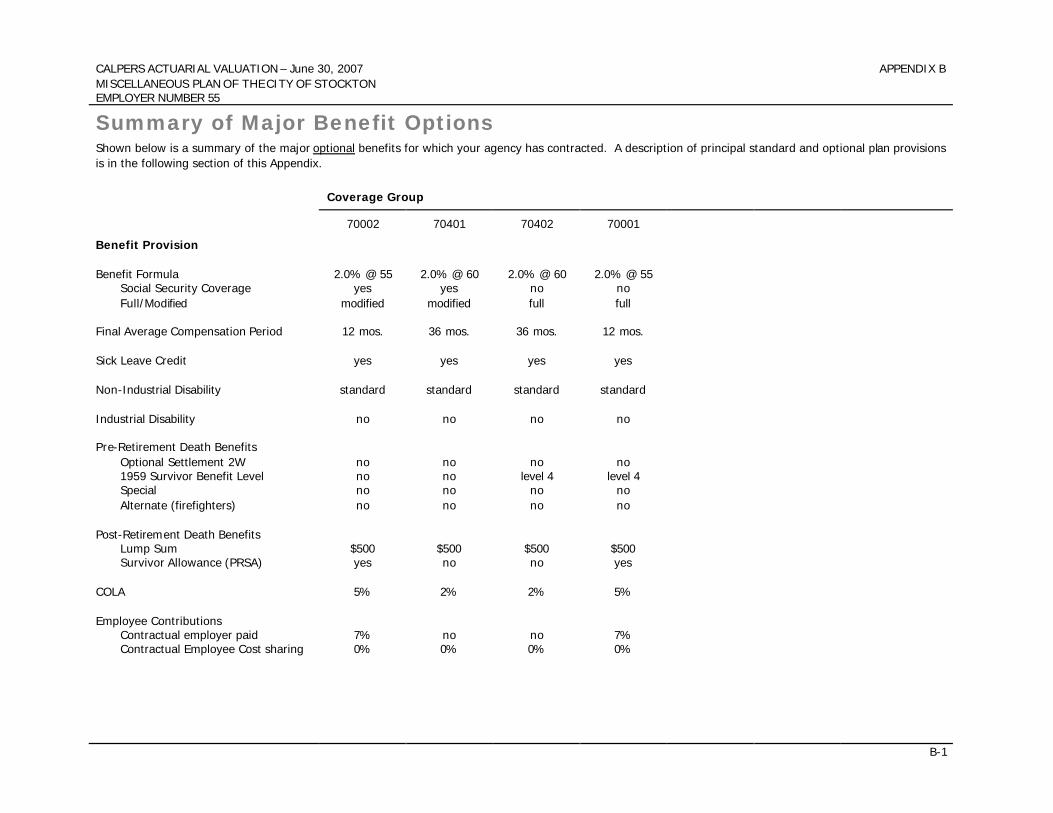
Summary of Major Benefit Options Shown below is a summary of the major optional benefits for which your agency has contracted. A description of principal standard and optional plan provisions is in the following section of this Appendix.
Coverage Group
70002 70401 70402 70001
Benefit Provision Benefit Formula 2.0% @ 55 2.0% @ 60 2.0% @ 60 2.0% @ 55
Social Security Coverage yes yes no no Full/Modified modified modified full full
Final Average Compensation Period 12 mos. 36 mos. 36 mos. 12 mos. Sick Leave Credit yes yes yes yes Non-Industrial Disability standard standard standard standard Industrial Disability no no no no Pre-Retirement Death Benefits
Optional Settlement 2W no no no no 1959 Survivor Benefit Level no no level 4 level 4 Special no no no no Alternate (firefighters) no no no no
Post-Retirement Death Benefits
Lump Sum $500 $500 $500 $500 Survivor Allowance (PRSA) yes no no yes
COLA 5% 2% 2% 5% Employee Contributions
Contractual employer paid 7% no no 7% Contractual Employee Cost sharing 0% 0% 0% 0%
B-1

CALPERS ACTUARIAL VALUATION – June 30, 2007 APPENDIX B MISCELLANEOUS PLAN OF THE CITY OF STOCKTON EMPLOYER NUMBER 55
Summary of Major Benefit Options Shown below is a summary of the major optional benefits for which your agency has contracted. A description of principal standard and optional plan provisions is in the following section of this Appendix.
Coverage Group
Benefit Provision Benefit Formula
Social Security Coverage Full/Modified
Final Average Compensation Period Sick Leave Credit Non-Industrial Disability Industrial Disability Pre-Retirement Death Benefits
Optional Settlement 2W 1959 Survivor Benefit Level Special Alternate (firefighters)
Post-Retirement Death Benefits
Lump Sum Survivor Allowance (PRSA)
COLA Employee Contributions
Contractual employer paid Contractual Employee Cost sharing B-2
CALPERS ACTUARIAL VALUATION – June 30, 2007 APPENDIX B MISCELLANEOUS PLAN OF THE CITY OF STOCKTON EMPLOYER NUMBER 55
B-3
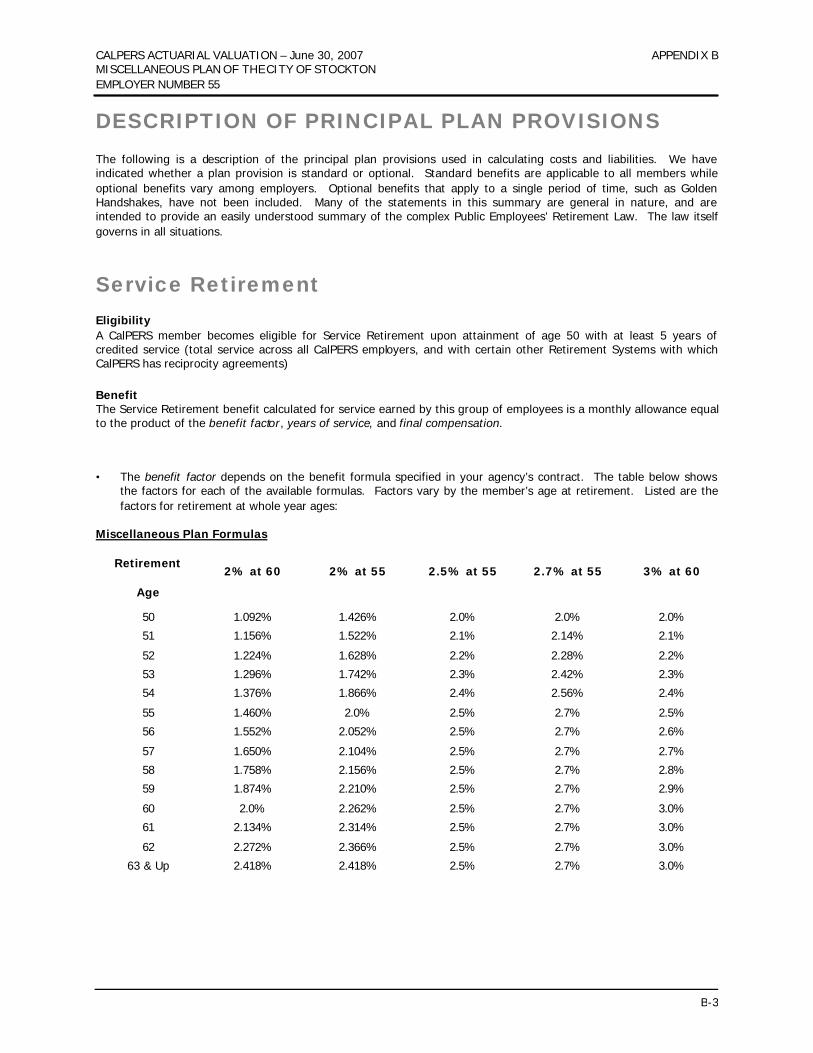
DESCRIPTION OF PRINCIPAL PLAN PROVISIONS The following is a description of the principal plan provisions used in calculating costs and liabilities. We have indicated whether a plan provision is standard or optional. Standard benefits are applicable to all members while optional benefits vary among employers. Optional benefits that apply to a single period of time, such as Golden Handshakes, have not been included. Many of the statements in this summary are general in nature, and are intended to provide an easily understood summary of the complex Public Employees’ Retirement Law. The law itself governs in all situations.
Service Retirement Eligibility A CalPERS member becomes eligible for Service Retirement upon attainment of age 50 with at least 5 years of credited service (total service across all CalPERS employers, and with certain other Retirement Systems with which CalPERS has reciprocity agreements) Benefit The Service Retirement benefit calculated for service earned by this group of employees is a monthly allowance equal to the product of the benefit factor, years of service, and final compensation.
• The benefit factor depends on the benefit formula specified in your agency’s contract. The table below shows the factors for each of the available formulas. Factors vary by the member’s age at retirement. Listed are the factors for retirement at whole year ages:
Miscellaneous Plan Formulas
Retirement
Age
2% at 60 2% at 55 2.5% at 55 2.7% at 55 3% at 60
50 1.092% 1.426% 2.0% 2.0% 2.0%
51 1.156% 1.522% 2.1% 2.14% 2.1%
52 1.224% 1.628% 2.2% 2.28% 2.2%
53 1.296% 1.742% 2.3% 2.42% 2.3%
54 1.376% 1.866% 2.4% 2.56% 2.4%
55 1.460% 2.0% 2.5% 2.7% 2.5%
56 1.552% 2.052% 2.5% 2.7% 2.6%
57 1.650% 2.104% 2.5% 2.7% 2.7%
58 1.758% 2.156% 2.5% 2.7% 2.8%
59 1.874% 2.210% 2.5% 2.7% 2.9%
60 2.0% 2.262% 2.5% 2.7% 3.0%
61 2.134% 2.314% 2.5% 2.7% 3.0%
62 2.272% 2.366% 2.5% 2.7% 3.0%
63 & Up 2.418% 2.418% 2.5% 2.7% 3.0%
CALPERS ACTUARIAL VALUATION – June 30, 2007 APPENDIX B MISCELLANEOUS PLAN OF THE CITY OF STOCKTON EMPLOYER NUMBER 55
B-4
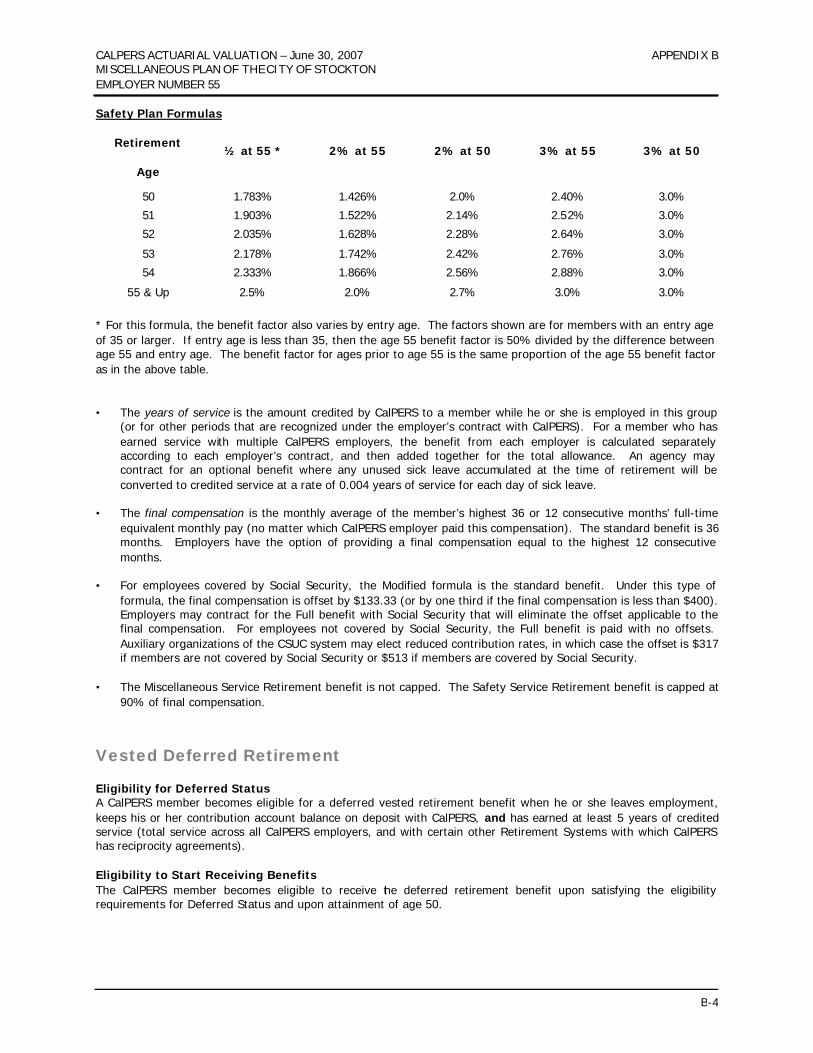
Safety Plan Formulas
Retirement
Age
½ at 55 * 2% at 55 2% at 50 3% at 55 3% at 50
50 1.783% 1.426% 2.0% 2.40% 3.0%
51 1.903% 1.522% 2.14% 2.52% 3.0%
52 2.035% 1.628% 2.28% 2.64% 3.0%
53 2.178% 1.742% 2.42% 2.76% 3.0%
54 2.333% 1.866% 2.56% 2.88% 3.0%
55 & Up 2.5% 2.0% 2.7% 3.0% 3.0%
* For this formula, the benefit factor also varies by entry age. The factors shown are for members with an entry age of 35 or larger. If entry age is less than 35, then the age 55 benefit factor is 50% divided by the difference between age 55 and entry age. The benefit factor for ages prior to age 55 is the same proportion of the age 55 benefit factor as in the above table. • The years of service is the amount credited by CalPERS to a member while he or she is employed in this group
(or for other periods that are recognized under the employer’s contract with CalPERS). For a member who has earned service with multiple CalPERS employers, the benefit from each employer is calculated separately according to each employer’s contract, and then added together for the total allowance. An agency may contract for an optional benefit where any unused sick leave accumulated at the time of retirement will be converted to credited service at a rate of 0.004 years of service for each day of sick leave.
• The final compensation is the monthly average of the member’s highest 36 or 12 consecutive months’ full-time
equivalent monthly pay (no matter which CalPERS employer paid this compensation). The standard benefit is 36 months. Employers have the option of providing a final compensation equal to the highest 12 consecutive months.
• For employees covered by Social Security, the Modified formula is the standard benefit. Under this type of
formula, the final compensation is offset by $133.33 (or by one third if the final compensation is less than $400). Employers may contract for the Full benefit with Social Security that will eliminate the offset applicable to the final compensation. For employees not covered by Social Security, the Full benefit is paid with no offsets. Auxiliary organizations of the CSUC system may elect reduced contribution rates, in which case the offset is $317 if members are not covered by Social Security or $513 if members are covered by Social Security.
• The Miscellaneous Service Retirement benefit is not capped. The Safety Service Retirement benefit is capped at
90% of final compensation.
Vested Deferred Retirement Eligibility for Deferred Status A CalPERS member becomes eligible for a deferred vested retirement benefit when he or she leaves employment, keeps his or her contribution account balance on deposit with CalPERS, and has earned at least 5 years of credited service (total service across all CalPERS employers, and with certain other Retirement Systems with which CalPERS has reciprocity agreements). Eligibility to Start Receiving Benefits The CalPERS member becomes eligible to receive the deferred retirement benefit upon satisfying the eligibility requirements for Deferred Status and upon attainment of age 50.
CALPERS ACTUARIAL VALUATION – June 30, 2007 APPENDIX B MISCELLANEOUS PLAN OF THE CITY OF STOCKTON EMPLOYER NUMBER 55
B-5
Benefit The vested deferred retirement benefit is the same as the Service Retirement benefit, where the benefit factor is based on the member’s age at allowance commencement. For members who have earned service with multiple CalPERS employers, the benefit from each employer is calculated separately according to each employer’s contract, and then added together for the total allowance.
Non-Industrial (Non-Job Related) Disability Retirement Eligibility A CalPERS member is eligible for Non-Industrial Disability Retirement if he or she becomes disabled and has at least 5 years of credited service (total service across all CalPERS employers, and with certain other Retirement Systems with which CalPERS has reciprocity agreements). There is no special age requirement. Disabled means the member is unable to perform his or her job because of an illness or injury which is expected to be permanent or to last indefinitely. The illness or injury does not have to be job related. A CalPERS member must be actively employed by any CalPERS employer at the time of disability in order to be eligible for this benefit. Standard Benefit The standard Non-Industrial Disability Retirement benefit is a monthly allowance equal to 1.8% of final compensation, multiplied by service, which is determined as follows: • service is CalPERS credited service, for members with less than 10 years of service or greater than 18.518 years
of service; or • service is CalPERS credited service plus the additional number of years that the member would have worked
until age 60, for members with at least 10 years but not more than 18.518 years of service. The maximum benefit in this case is 33 1/3% of Final Compensation.
Improved Benefit Employers have the option of providing the improved Non-Industrial Disability Retirement benefit. This benefit provides a monthly allowance equal to 30% of final compensation for the first 5 years of service, plus 1% for each additional year of service to a maximum of 50% of final compensation. Members who are eligible for a larger service retirement benefit may choose to receive that benefit in lieu of a disability benefit. Members eligible to retire, and who have attained the normal retirement age determined by their service retirement benefit formula, will receive the same dollar amount for disability retirement as that payable for service retirement. For members who have earned service with multiple CalPERS employers, the benefit attributed to each employer is the total disability allowance multiplied by the ratio of service with a particular employer to the total CalPERS service.
Industrial (Job Related) Disability Retirement All safety members have this benefit. For miscellaneous members, employers have the option of providing this benefit. An employer may choose to provide the Increased benefit option or the Improved benefit option. Eligibility An employee is eligible for Industrial Disability Retirement if he or she becomes disabled while working, where disabled means the member is unable to perform the duties of the job because of a work-related illness or injury which is expected to be permanent or to last indefinitely. A CalPERS member who has left active employment within this group is not eligible for this benefit, except to the extent described below. Standard Benefit The standard Industrial Disability Retirement benefit is a monthly allowance equal to 50% of final compensation.
CALPERS ACTUARIAL VALUATION – June 30, 2007 APPENDIX B MISCELLANEOUS PLAN OF THE CITY OF STOCKTON EMPLOYER NUMBER 55
B-6
Increased Benefit (75% of Final Compensation) The increased Industrial Disability Retirement benefit is a monthly allowance equal to 75% of final compensation for total disability. Improved Benefit (50% to 90% of Final Compensation) The improved Industrial Disability Retirement benefit is a monthly allowance equal to the Workman’s Compensation Appeals Board permanent disability rate percentage (if 50% or greater, with a maximum of 90%) times the final compensation. For a CalPERS member not actively employed in this group who became disabled while employed by some other CalPERS employer, the benefit is a return of accumulated member contributions with respect to employment in this group. With the standard or increased benefit, a member may also choose to receive the annuitization of the accumulated member contributions. If a member is eligible for Service Retirement and if the Service Retirement benefit is more than the Industrial Disability Retirement benefit, the member may choose to receive the larger benefit.
Post-Retirement Death Benefit Standard Lump Sum Payment Upon the death of a retiree, a one-time lump sum payment of $500 will be made to the retiree’s designated survivor(s), or to the retiree’s estate.
Improved Lump Sum Payment Employers have the option of providing an improved lump sum death benefit of $600, $2,000, $3,000, $4,000 or $5,000.
Form of Payment for Retirement Allowance
Standard Form of Payment Generally, the retirement allowance is paid to the retiree in the form of an annuity for as long as he or she is alive. The retiree may choose to provide for a portion of his or her allowance to be paid to any designated beneficiary after the retiree’s death. CalPERS provides for a variety of such benefit options, which the retiree pays for by taking a reduction in his or her retirement allowance. Such reduction takes into account the amount to be provided to the beneficiary and the probable duration of payments (based on the ages of the member and beneficiary) made subsequent to the member’s death.
Improved Form of Payment (Post Retirement Survivor Allowance) Employers have the option to contract for the post retirement survivor allowance.
For retirement allowances with respect to service subject to the modified formula, 25% of the retirement allowance will automatically be continued to certain statutory beneficiaries upon the death of the retiree, without a reduction in the retiree’s allowance. For retirement allowances with respect to service subject to the full or supplemental formula, 50% of the retirement allowance will automatically be continued to certain statutory beneficiaries upon the death of the retiree, without a reduction in the retiree’s allowance. This additional benefit is often referred to as post retirement survivor allowance (PRSA) or simply as survivor continuance.
In other words, 25% or 50% of the allowance, the continuance portion, is paid to the retiree for as long as he or she is alive, and that same amount is continued to the retiree’s spouse (or if no eligible spouse, to unmarried children until they attain age 18; or, if no eligible children, to a qualifying dependent parent) for the rest of his or her lifetime. This benefit will not be discontinued in the event the spouse remarries.
CALPERS ACTUARIAL VALUATION – June 30, 2007 APPENDIX B MISCELLANEOUS PLAN OF THE CITY OF STOCKTON EMPLOYER NUMBER 55
B-7
The remaining 75% or 50% of the retirement allowance, which may be referred to as the option portion of the benefit, is paid to the retiree as an annuity for as long as he or she is alive. Or, the retiree may choose to provide for some of this option portion to be paid to any designated beneficiary after the retiree’s death. Benefit options applicable to the option portion are the same as those offered with the standard form. The reduction is calculated in the same manner but is applied only to the option portion.
Pre-Retirement Death Benefits
Basic Death Benefit This is a standard benefit. Eligibility An employee’s beneficiary (or estate) may receive the Basic Death benefit if the member dies while actively employed. A CalPERS member must be actively employed with the CalPERS employer providing this benefit to be eligible for this benefit. A member’s survivor who is eligible for any other pre-retirement death benefit may choose to receive that death benefit instead of this Basic Death benefit. Benefit The Basic Death Benefit is a lump sum in the amount of the member’s accumulated contributions, where interest is currently credited at 7.75% per year, plus a lump sum in the amount of one month's salary for each completed year of current service, up to a maximum of six months' salary. For purposes of this benefit, one month's salary is defined as the member's average monthly full-time rate of compensation during the 12 months preceding death.
1957 Survivor Benefit This is a standard benefit. Eligibility An employee’s eligible survivor(s) may receive the 1957 Survivor benefit if the member dies while actively employed, has attained at least age 50, and has at least 5 years of credited service (total service across all CalPERS employers and with certain other Retirement Systems with which CalPERS has reciprocity agreements). A CalPERS member must be actively employed with the CalPERS employer providing this benefit to be eligible for this benefit. An eligible survivor means the surviving spouse to whom the member was married at least one year before death or, if there is no eligible spouse, to the member's unmarried children under age 18. A member’s survivor who is eligible for any other pre-retirement death benefit may choose to receive that death benefi t instead of this 1957 Survivor benefit. Benefit The 1957 Survivor benefit is a monthly allowance equal to one-half of the unmodified Service Retirement benefit that the member would have been entitled to receive if the member had retired on the date of his or her death. If the benefit is payable to the spouse, the benefit is discontinued upon the death of the spouse. If the benefit is payable to a dependent child, the benefit will be discontinued upon death or attainment of age 18, unless the child is disabled. The total amount paid will be at least equal to the Basic Death benefit.
Optional Settlement 2 Death Benefit
This is an optional benefit. Eligibility
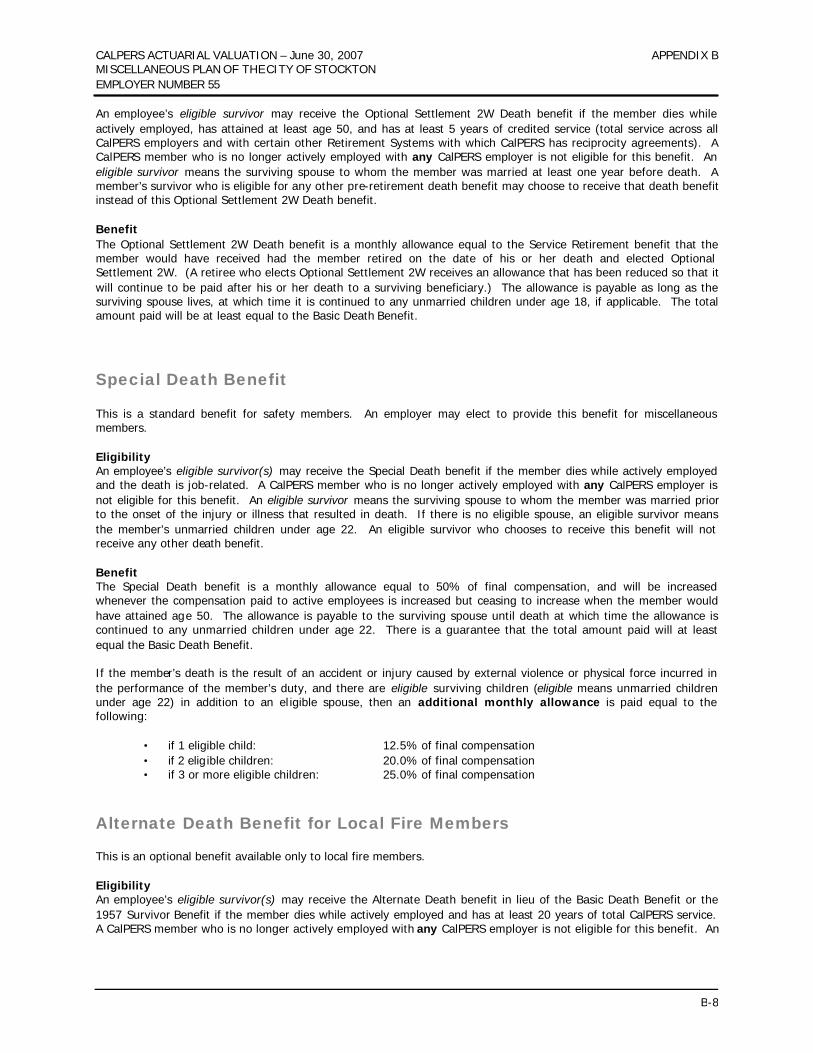
CALPERS ACTUARIAL VALUATION – June 30, 2007 APPENDIX B MISCELLANEOUS PLAN OF THE CITY OF STOCKTON EMPLOYER NUMBER 55
B-8
An employee’s eligible survivor may receive the Optional Settlement 2W Death benefit if the member dies while actively employed, has attained at least age 50, and has at least 5 years of credited service (total service across all CalPERS employers and with certain other Retirement Systems with which CalPERS has reciprocity agreements). A CalPERS member who is no longer actively employed with any CalPERS employer is not eligible for this benefit. An eligible survivor means the surviving spouse to whom the member was married at least one year before death. A member’s survivor who is eligible for any other pre-retirement death benefit may choose to receive that death benefit instead of this Optional Settlement 2W Death benefit.
Benefit The Optional Settlement 2W Death benefit is a monthly allowance equal to the Service Retirement benefit that the member would have received had the member retired on the date of his or her death and elected Optional Settlement 2W. (A retiree who elects Optional Settlement 2W receives an allowance that has been reduced so that it will continue to be paid after his or her death to a surviving beneficiary.) The allowance is payable as long as the surviving spouse lives, at which time it is continued to any unmarried children under age 18, if applicable. The total amount paid will be at least equal to the Basic Death Benefit.
Special Death Benefit
This is a standard benefit for safety members. An employer may elect to provide this benefit for miscellaneous members. Eligibility An employee’s eligible survivor(s) may receive the Special Death benefit if the member dies while actively employed and the death is job-related. A CalPERS member who is no longer actively employed with any CalPERS employer is not eligible for this benefit. An eligible survivor means the surviving spouse to whom the member was married prior to the onset of the injury or illness that resulted in death. If there is no eligible spouse, an eligible survivor means the member's unmarried children under age 22. An eligible survivor who chooses to receive this benefit will not receive any other death benefit.
Benefit The Special Death benefit is a monthly allowance equal to 50% of final compensation, and will be increased whenever the compensation paid to active employees is increased but ceasing to increase when the member would have attained age 50. The allowance is payable to the surviving spouse until death at which time the allowance is continued to any unmarried children under age 22. There is a guarantee that the total amount paid will at least equal the Basic Death Benefit.
If the member’s death is the result of an accident or injury caused by external violence or physical force incurred in the performance of the member’s duty, and there are eligible surviving children (eligible means unmarried children under age 22) in addition to an el igible spouse, then an additional monthly allowance is paid equal to the following:
• if 1 eligible child: 12.5% of final compensation • if 2 eligible children: 20.0% of final compensation • if 3 or more eligible children: 25.0% of final compensation
Alternate Death Benefit for Local Fire Members
This is an optional benefit available only to local fire members. Eligibility An employee’s eligible survivor(s) may receive the Alternate Death benefit in lieu of the Basic Death Benefit or the 1957 Survivor Benefit if the member dies while actively employed and has at least 20 years of total CalPERS service. A CalPERS member who is no longer actively employed with any CalPERS employer is not eligible for this benefit. An
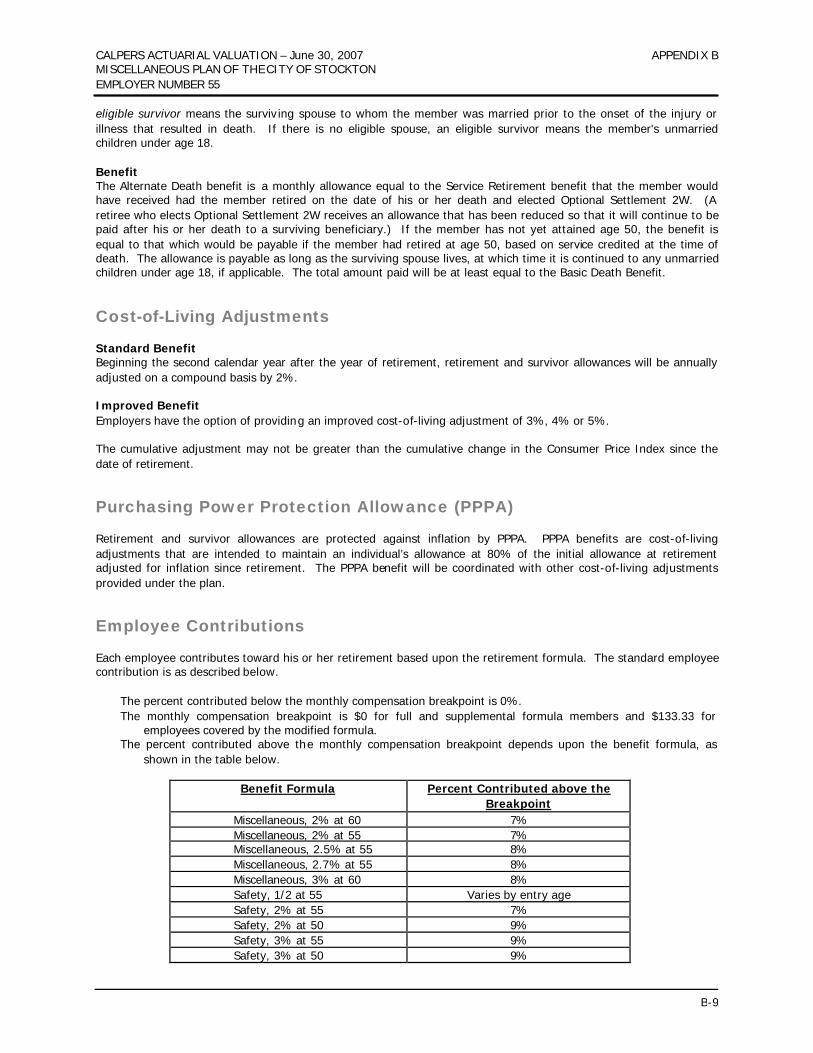
CALPERS ACTUARIAL VALUATION – June 30, 2007 APPENDIX B MISCELLANEOUS PLAN OF THE CITY OF STOCKTON EMPLOYER NUMBER 55
B-9
eligible survivor means the surviv ing spouse to whom the member was married prior to the onset of the injury or illness that resulted in death. If there is no eligible spouse, an eligible survivor means the member's unmarried children under age 18.
Benefit The Alternate Death benefit is a monthly allowance equal to the Service Retirement benefit that the member would have received had the member retired on the date of his or her death and elected Optional Settlement 2W. (A retiree who elects Optional Settlement 2W receives an allowance that has been reduced so that it will continue to be paid after his or her death to a surviving beneficiary.) If the member has not yet attained age 50, the benefit is equal to that which would be payable if the member had retired at age 50, based on service credited at the time of death. The allowance is payable as long as the surviving spouse lives, at which time it is continued to any unmarried children under age 18, if applicable. The total amount paid will be at least equal to the Basic Death Benefit.
Cost-of-Living Adjustments Standard Benefit Beginning the second calendar year after the year of retirement, retirement and survivor allowances will be annually adjusted on a compound basis by 2%. Improved Benefit Employers have the option of providing an improved cost-of-living adjustment of 3%, 4% or 5%.
The cumulative adjustment may not be greater than the cumulative change in the Consumer Price Index since the date of retirement.
Purchasing Power Protection Allowance (PPPA) Retirement and survivor allowances are protected against inflation by PPPA. PPPA benefits are cost-of-living adjustments that are intended to maintain an individual’s allowance at 80% of the initial allowance at retirement adjusted for inflation since retirement. The PPPA benefit will be coordinated with other cost-of-living adjustments provided under the plan.
Employee Contributions Each employee contributes toward his or her retirement based upon the retirement formula. The standard employee contribution is as described below.
The percent contributed below the monthly compensation breakpoint is 0%. The monthly compensation breakpoint is $0 for full and supplemental formula members and $133.33 for
employees covered by the modified formula. The percent contributed above the monthly compensation breakpoint depends upon the benefit formula, as
shown in the table below.
Benefit Formula Percent Contributed above the Breakpoint
Miscellaneous, 2% at 60 7% Miscellaneous, 2% at 55 7% Miscellaneous, 2.5% at 55 8% Miscellaneous, 2.7% at 55 8% Miscellaneous, 3% at 60 8% Safety, 1/2 at 55 Varies by entry age Safety, 2% at 55 7% Safety, 2% at 50 9% Safety, 3% at 55 9% Safety, 3% at 50 9%
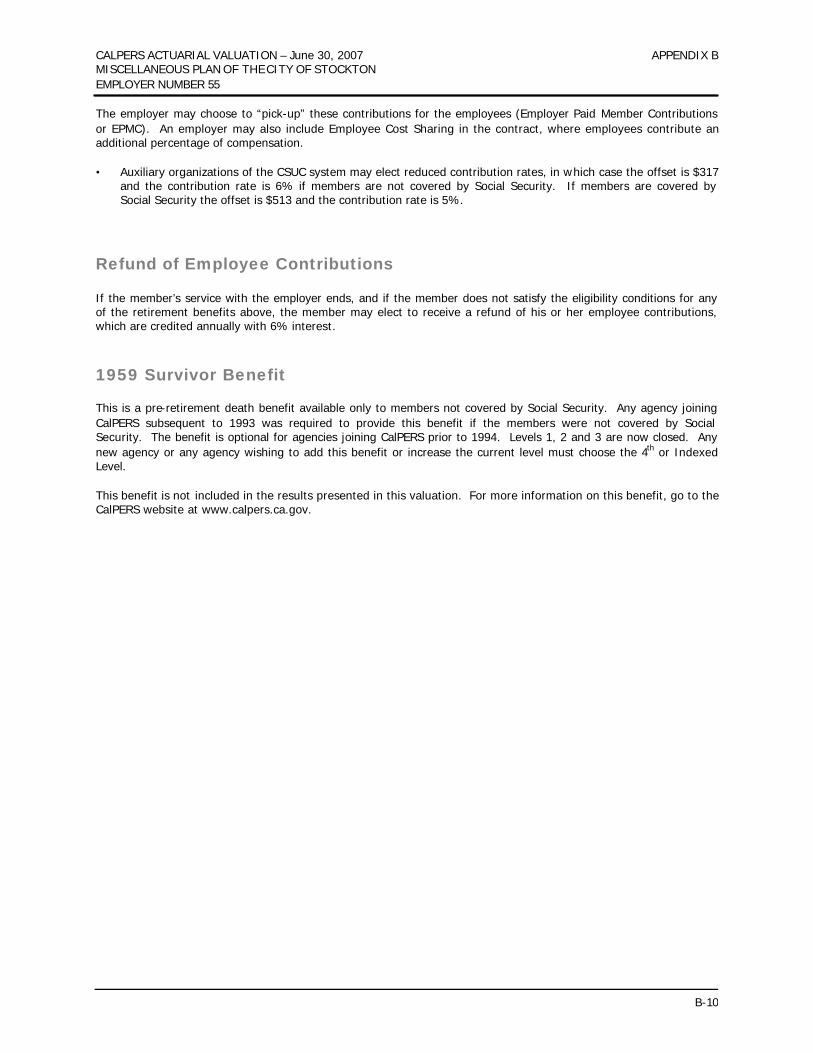
CALPERS ACTUARIAL VALUATION – June 30, 2007 APPENDIX B MISCELLANEOUS PLAN OF THE CITY OF STOCKTON EMPLOYER NUMBER 55
B-10
The employer may choose to “pick-up” these contributions for the employees (Employer Paid Member Contributions or EPMC). An employer may also include Employee Cost Sharing in the contract, where employees contribute an additional percentage of compensation. • Auxiliary organizations of the CSUC system may elect reduced contribution rates, in which case the offset is $317
and the contribution rate is 6% if members are not covered by Social Security. If members are covered by Social Security the offset is $513 and the contribution rate is 5%.
Refund of Employee Contributions If the member’s service with the employer ends, and if the member does not satisfy the eligibility conditions for any of the retirement benefits above, the member may elect to receive a refund of his or her employee contributions, which are credited annually with 6% interest.
1959 Survivor Benefit This is a pre-retirement death benefit available only to members not covered by Social Security. Any agency joining CalPERS subsequent to 1993 was required to provide this benefit if the members were not covered by Social Security. The benefit is optional for agencies joining CalPERS prior to 1994. Levels 1, 2 and 3 are now closed. Any new agency or any agency wishing to add this benefit or increase the current level must choose the 4th or Indexed Level. This benefit is not included in the results presented in this valuation. For more information on this benefit, go to the CalPERS website at www.calpers.ca.gov.

APPENDIX C
• GASB STATEMENT NO. 27

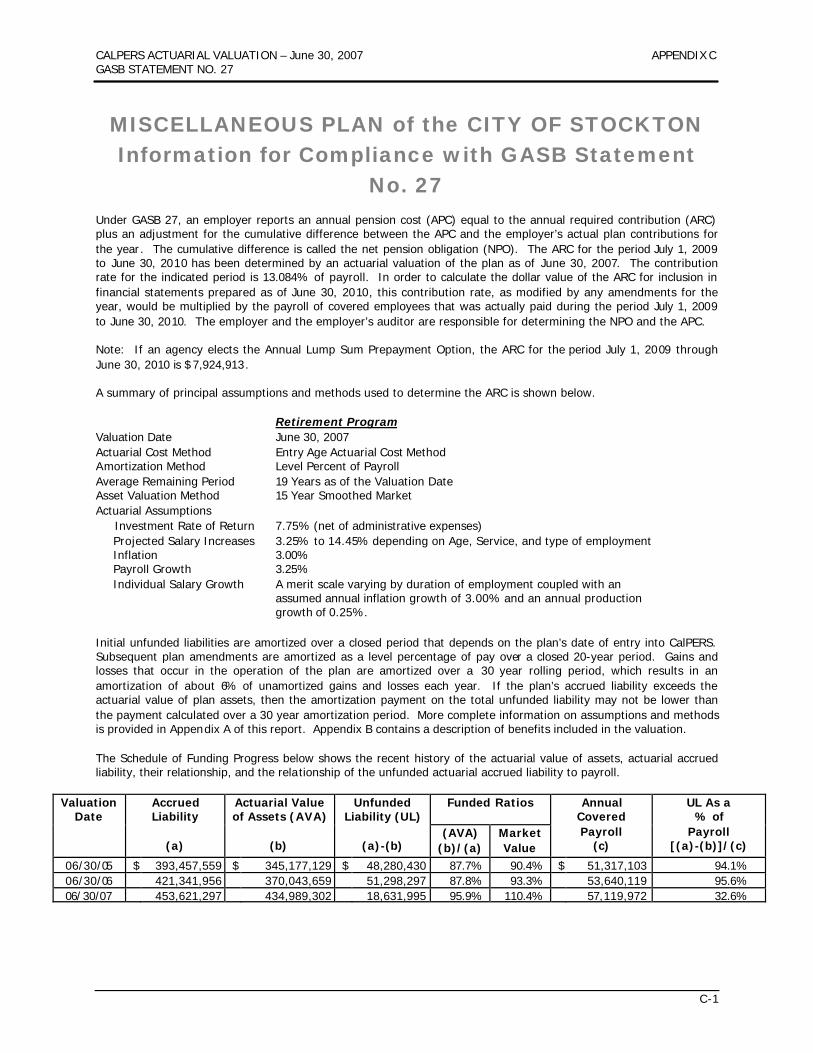
CALPERS ACTUARIAL VALUATION – June 30, 2007 APPENDIX C GASB STATEMENT NO. 27
C-1
MISCELLANEOUS PLAN of the CITY OF STOCKTON Information for Compliance with GASB Statement
No. 27
Under GASB 27, an employer reports an annual pension cost (APC) equal to the annual required contribution (ARC) plus an adjustment for the cumulative difference between the APC and the employer’s actual plan contributions for the year. The cumulative difference is called the net pension obligation (NPO). The ARC for the period July 1, 2009 to June 30, 2010 has been determined by an actuarial valuation of the plan as of June 30, 2007. The contribution rate for the indicated period is 13.084% of payroll. In order to calculate the dollar value of the ARC for inclusion in financial statements prepared as of June 30, 2010, this contribution rate, as modified by any amendments for the year, would be multiplied by the payroll of covered employees that was actually paid during the period July 1, 2009 to June 30, 2010. The employer and the employer’s auditor are responsible for determining the NPO and the APC. Note: If an agency elects the Annual Lump Sum Prepayment Option, the ARC for the period July 1, 2009 through June 30, 2010 is $ 7,924,913. A summary of principal assumptions and methods used to determine the ARC is shown below. Retirement Program Valuation Date June 30, 2007 Actuarial Cost Method Entry Age Actuarial Cost Method Amortization Method Level Percent of Payroll Average Remaining Period 19 Years as of the Valuation Date Asset Valuation Method 15 Year Smoothed Market Actuarial Assumptions Investment Rate of Return 7.75% (net of administrative expenses) Projected Salary Increases 3.25% to 14.45% depending on Age, Service, and type of employment Inflation 3.00% Payroll Growth 3.25% Individual Salary Growth A merit scale varying by duration of employment coupled with an
assumed annual inflation growth of 3.00% and an annual production growth of 0.25%.
Initial unfunded liabilities are amortized over a closed period that depends on the plan’s date of entry into CalPERS. Subsequent plan amendments are amortized as a level percentage of pay over a closed 20-year period. Gains and losses that occur in the operation of the plan are amortized over a 30 year rolling period, which results in an amortization of about 6% of unamortized gains and losses each year. If the plan’s accrued liability exceeds the actuarial value of plan assets, then the amortization payment on the total unfunded liability may not be lower than the payment calculated over a 30 year amortization period. More complete information on assumptions and methods is provided in Appendix A of this report. Appendix B contains a description of benefits included in the valuation. The Schedule of Funding Progress below shows the recent history of the actuarial value of assets, actuarial accrued liability, their relationship, and the relationship of the unfunded actuarial accrued liability to payroll.
Funded Ratios Valuation Date
Accrued Liability
(a)
Actuarial Value of Assets (AVA)
(b)
Unfunded Liability (UL)
(a)-(b)
(AVA) (b)/(a)
Market Value
Annual Covered Payroll
(c)
UL As a % of
Payroll [(a)-(b)]/(c)
06/30/05 $ 393,457,559 $ 345,177,129 $ 48,280,430 87.7% 90.4% $ 51,317,103 94.1% 06/30/06 421,341,956 370,043,659 51,298,297 87.8% 93.3% 53,640,119 95.6% 06/30/07 453,621,297 434,989,302 18,631,995 95.9% 110.4% 57,119,972 32.6%


APPENDIX D
GLOSSARY OF ACTUARIAL TERMS

CALPERS ACTUARIAL VALUATION – June 30, 2007 APPENDIX D GLOSSARY OF ACTUARIAL TERMS
D-1
Glossary of Actuarial Terms Accrued Liability (also called Actuarial Accrued Liability or Entry Age Normal Accrued Liability)
The total dollars needed as of the valuation date to fund all benefits earned in the past for current members.
Actuarial Assumptions
Assumptions made about certain events that will affect pension costs. Assumptions generally can be broken down into two categories: demographic and economic. Demographic assumptions include such things as mortality, disability and retirement rates. Economic assumptions include investment return, salary growth and inflation.
Actuarial Methods
Procedures employed by actuaries to achieve certain goals of a pension plan. These may include things such as funding method, setting the length of time to fund the past service liability and determining the actuarial value of assets.
Actuarial Valuation The determination, as of a valuation date, of the normal cost, actuarial accrued liability, actuarial value of assets and related actuarial present values for a pension plan. These valuations are performed annually or when an employer is contemplating a change to their plan provisions.
Actuarial Value of Assets The actuarial value of assets used for funding purposes is obtained through an asset smoothing technique where investment gains and losses are partially recognized in the year they are incurred, with the remainder recognized in subsequent years.
This method helps to dampen large fluctuations in the employer contribution rate.
Amortization Bases
Separate payment schedules for different portions of the unfunded liability. The total unfunded liability of a risk pool or non-pooled plan can be segregated by "cause", creating “bases” and each such base will be separately amortized and paid for over a specific period of time. This can be likened to a home mortgage that has 24 years of remaining payments and a second on that mortgage that has 10 years left. Each base or each mortgage note has its own terms (payment period, principal, etc.) Generally in an actuarial valuation, the separate bases consist of changes in unfunded liability due to amendments, actuarial assumption changes, actuarial methodology changes, and gains and losses. Payment periods are determined by Board policy and vary based on the cause of the change.
Amortization Period
The number of years required to pay off an amortization base. Annual Required Contributions (ARC)
The employer's periodic required annual contributions to a defined benefit pension plan as set forth in GASB Statement No. 27, calculated in accordance with the plan assumptions. The ARC is determined by multiplying the employer contribution rate by the payroll reported to CalPERS for the applicable fiscal year. However, if this contribution is fully prepaid in a lump sum, then the dollar value of the ARC is equal to the Lump Sum Prepayment.
Entry Age
The earliest age at which a plan member begins to accrue benefits under a defined benefit pension plan or risk pool. In most cases, this is age of the member on their date of hire.
Entry Age Normal Cost Method
An actuarial cost method designed to fund a member's total plan benefit over the course of his or her career. This method is designed to yield a rate expressed as a level percentage of payroll.
CALPERS ACTUARIAL VALUATION – June 30, 2007 APPENDIX D GLOSSARY OF ACTUARIAL TERMS
D-2
(The assumed retirement age less the entry age is the amount of time required to fund a member’s total benefit. Generally, the older a member on the date of hire, the greater the entry age normal cost. This is mainly because there is less time to earn investment income to fund the future benefits.)
Excess Assets When a plan’s actuarial value of assets is greater than its accrued liability, the difference is the plan’s excess assets. A plan with excess assets is said to be overfunded. The result of having excess assets is that the plan may temporarily reduce future contributions.
Fresh Start
A fresh start is the single amortization base created when multiple amortization bases are collapsed into one base and amortized over a new funding period.
Funded Status A measure of how well funded a plan is. Or equivalently, how "on track" a plan is with respect to assets vs. accrued liabilities. We calculate a funded ratio by dividing the market value of assets by the accrued liabilities. A ratio greater than 100% means the plan or risk pool has more assets than liabilities and a ratio less than 100% means liabilities are greater than assets.
GASB 27
Statement No. 27 of the Governmental Accounting Standards Board. The accounting standard governing a state of local governmental employer’s accounting for pensions.
Lump Sum Contribution A payment made by the employer to reduce or eliminate the unfunded liability.
Normal Cost The annual cost of service accrual for the upcoming fiscal year for active employees. The normal cost should be viewed as the long term contribution rate.
Pension Actuary A person who is responsible for the calculations necessary to proper ly fund a pension plan. Prepayment Contribution
A payment made by the employer to reduce or eliminate the year’s required employer contribution. Present Value of Benefits
The total dollars needed as of the valuation date to fund all benefits earned in the past or expected to be earned in the future for current members.
Rolling Amortization Period An amortization period that remains the same each year, rather than declining. Superfunded
A condition existing when the actuarial value of assets exceeds the present value of benefits. When this condition exists on a given valuation date for a given plan, employee contributions for the rate year covered by that valuation may be waived.
Unfunded Liability
A plan with an actuarial value of assets below the accrued liability is said to have an unfunded liability and must temporarily increase contributions to get back on schedule.