Embed Size (px)
Citation preview
Actuarial Valuation of the State of Alaska Long Term Care Program
as of 5/31/2012
PREPARED BY: Peggy Hauser, F.S.A., M.A.A.A SVP & Actuary Univita Health, Inc. Stephanie Joyce, A.S.A., M.A.A.A Associate Actuary Univita Health, Inc.
March 8, 2013
March 8, 2013 Ms. Monica DeGraff Consultant, Health and Productivity Buck Consultants, an ACS company 1200 17th Street, Suite 1200 Denver, CO 80202 RE: VALUATION OF THE STATE OF ALASKA LONG TERM CARE PROGRAM Dear Monica: This report provides actuarial values and projections of the State of Alaska Long Term Care Program as of May 31, 2012. Section I outlines the scope of and qualifications related to the analysis. Results are summarized in Section II. Key actuarial assumptions are provided in Section III. In Section IV, we reconcile the current results to those from the prior valuation completed as of June 2009. Results of sensitivity testing are provided in Section V. Appendix A summarizes methodology, models and actuarial assumptions used in the analysis. Appendix B provides experience analysis of historical persistency and claims. Appendix C provides detailed projection results. We are available to answer any questions regarding the assumptions and methods used to develop these projections. Please contact us with any questions. Sincerely,
Peggy L. Hauser, FSA, MAAA Senior Vice President Actuarial Services
Univita
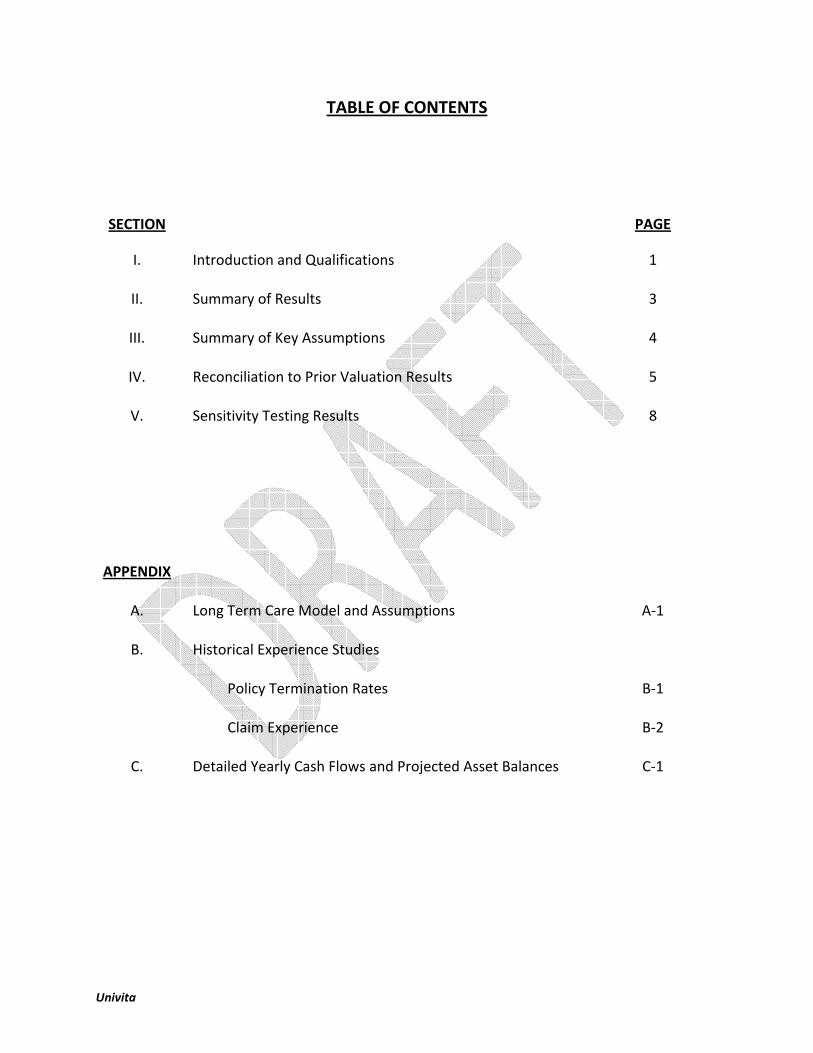
TABLE OF CONTENTS
SECTION
PAGE
I. Introduction and Qualifications
1
II. Summary of Results
3
III. Summary of Key Assumptions
4
IV. Reconciliation to Prior Valuation Results
5
V. Sensitivity Testing Results
8
APPENDIX
A. Long Term Care Model and Assumptions
A-1
B. Historical Experience Studies
Policy Termination Rates Claim Experience
B-1
B-2
C. Detailed Yearly Cash Flows and Projected Asset Balances
C-1
Univita Page 1
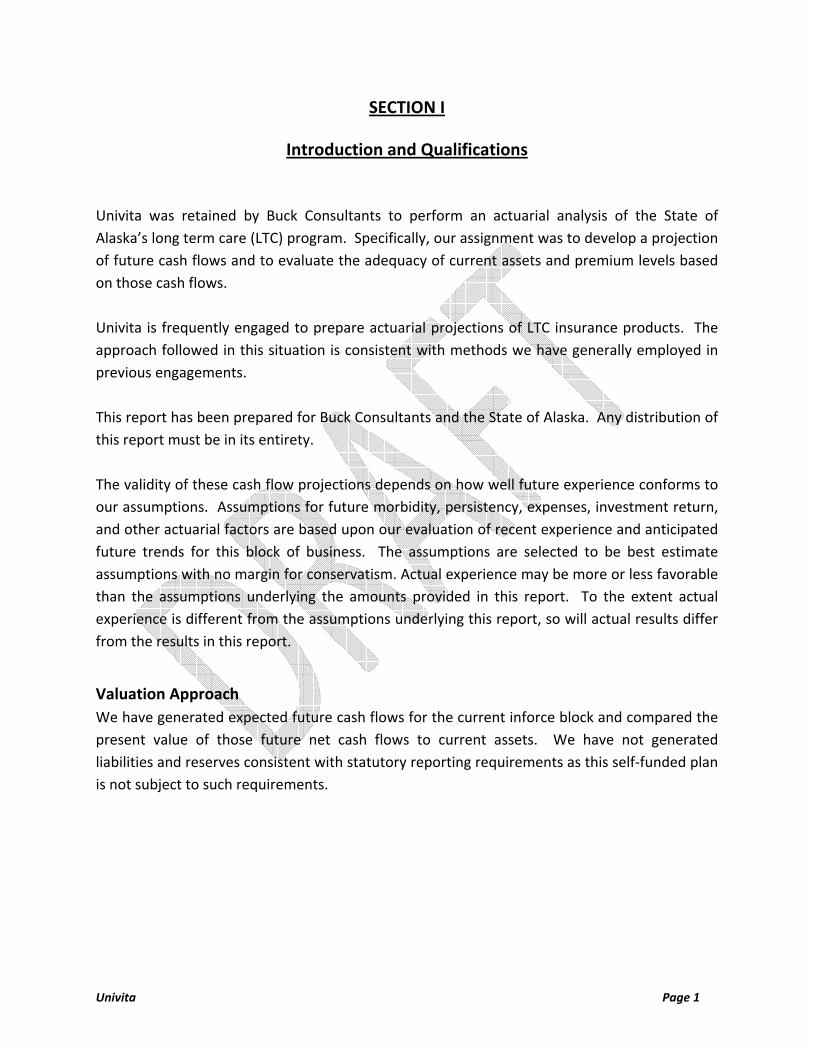
SECTION I
Introduction and Qualifications
Univita was retained by Buck Consultants to perform an actuarial analysis of the State of Alaska’s long term care (LTC) program. Specifically, our assignment was to develop a projection of future cash flows and to evaluate the adequacy of current assets and premium levels based on those cash flows.
Univita is frequently engaged to prepare actuarial projections of LTC insurance products. The approach followed in this situation is consistent with methods we have generally employed in previous engagements. This report has been prepared for Buck Consultants and the State of Alaska. Any distribution of this report must be in its entirety. The validity of these cash flow projections depends on how well future experience conforms to our assumptions. Assumptions for future morbidity, persistency, expenses, investment return, and other actuarial factors are based upon our evaluation of recent experience and anticipated future trends for this block of business. The assumptions are selected to be best estimate assumptions with no margin for conservatism. Actual experience may be more or less favorable than the assumptions underlying the amounts provided in this report. To the extent actual experience is different from the assumptions underlying this report, so will actual results differ from the results in this report.
Valuation Approach We have generated expected future cash flows for the current inforce block and compared the present value of those future net cash flows to current assets. We have not generated liabilities and reserves consistent with statutory reporting requirements as this self-funded plan is not subject to such requirements.
Univita Page 2
Data Reliance We relied on data and information supplied by State of Alaska personnel. In addition, since Univita administers the claims for these policies, we also relied on data and information supplied by Univita data services personnel. We have not audited or independently verified the information furnished to us. Although we have no reason to suspect the integrity of the underlying data, to the extent that the data is materially flawed, the results of our analysis may be materially impacted. The principal materials relied upon that were provided by State of Alaska and Univita personnel include:
1. Census of State of Alaska members (LTC CENSUS Data for Univita 06132012.xls).
2. Data extracts from Univita administrative system.
3. Financial statements.
4. Plan descriptions.
5. Premium and claim summaries (FY12 LTC-Premiums&ClaimsPaid.xls).
Univita Page 3
SECTION II
Summary of Results
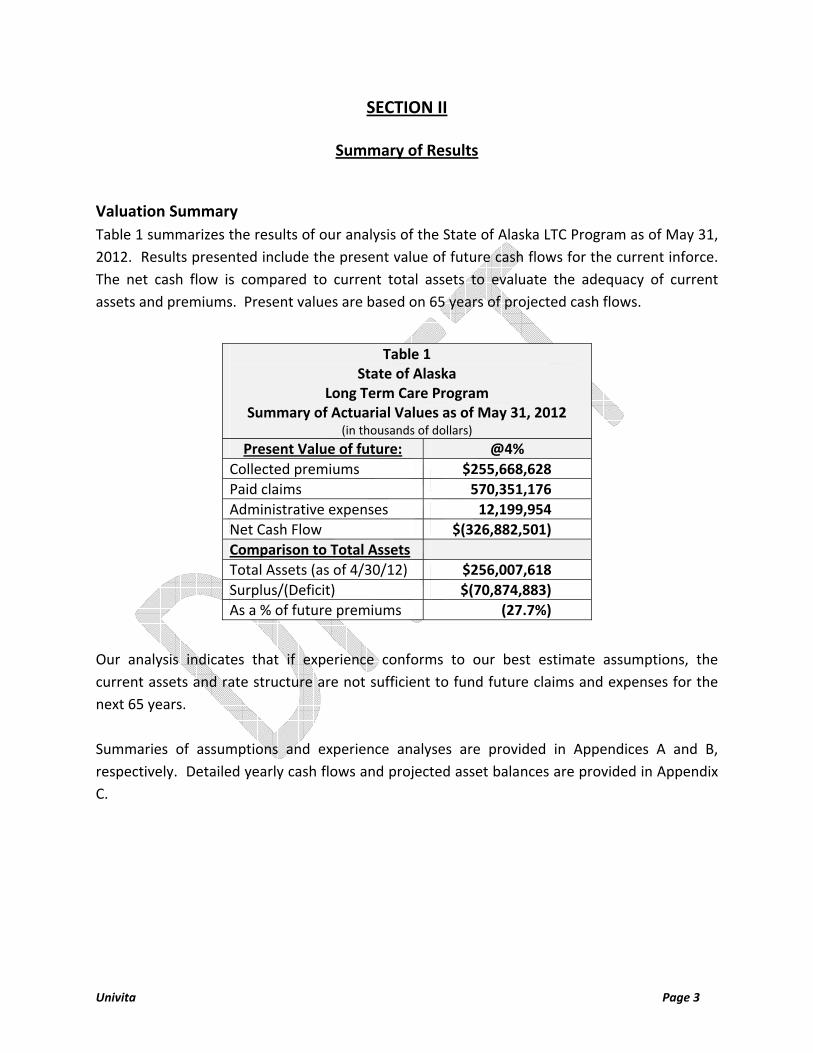
Valuation Summary Table 1 summarizes the results of our analysis of the State of Alaska LTC Program as of May 31, 2012. Results presented include the present value of future cash flows for the current inforce. The net cash flow is compared to current total assets to evaluate the adequacy of current assets and premiums. Present values are based on 65 years of projected cash flows.
Table 1 State of Alaska
Long Term Care Program Summary of Actuarial Values as of May 31, 2012
(in thousands of dollars)Present Value of future: @4%
Collected premiums $255,668,628 Paid claims 570,351,176 Administrative expenses 12,199,954 Net Cash Flow $(326,882,501) Comparison to Total Assets Total Assets (as of 4/30/12) $256,007,618 Surplus/(Deficit) $(70,874,883) As a % of future premiums (27.7%)
Our analysis indicates that if experience conforms to our best estimate assumptions, the current assets and rate structure are not sufficient to fund future claims and expenses for the next 65 years. Summaries of assumptions and experience analyses are provided in Appendices A and B, respectively. Detailed yearly cash flows and projected asset balances are provided in Appendix C.
Univita Page 4
SECTION III
Summary of Key Assumptions
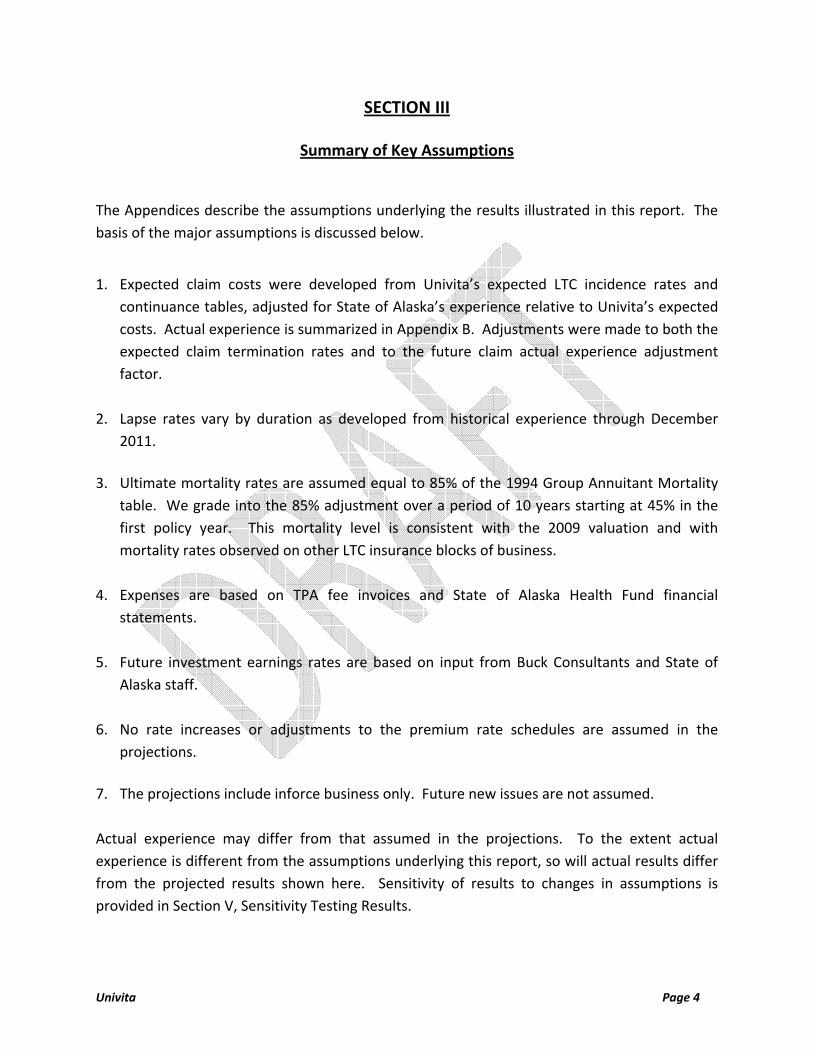
The Appendices describe the assumptions underlying the results illustrated in this report. The basis of the major assumptions is discussed below.
1. Expected claim costs were developed from Univita’s expected LTC incidence rates and continuance tables, adjusted for State of Alaska’s experience relative to Univita’s expected costs. Actual experience is summarized in Appendix B. Adjustments were made to both the expected claim termination rates and to the future claim actual experience adjustment factor.
2. Lapse rates vary by duration as developed from historical experience through December
2011.
3. Ultimate mortality rates are assumed equal to 85% of the 1994 Group Annuitant Mortality table. We grade into the 85% adjustment over a period of 10 years starting at 45% in the first policy year. This mortality level is consistent with the 2009 valuation and with mortality rates observed on other LTC insurance blocks of business.
4. Expenses are based on TPA fee invoices and State of Alaska Health Fund financial
statements. 5. Future investment earnings rates are based on input from Buck Consultants and State of
Alaska staff. 6. No rate increases or adjustments to the premium rate schedules are assumed in the
projections.
7. The projections include inforce business only. Future new issues are not assumed. Actual experience may differ from that assumed in the projections. To the extent actual experience is different from the assumptions underlying this report, so will actual results differ from the projected results shown here. Sensitivity of results to changes in assumptions is provided in Section V, Sensitivity Testing Results.
Univita Page 5
SECTION IV
Reconciliation to Prior Valuation Results
Univita evaluated the adequacy of the State of Alaska’s LTC Program as of June 30, 2009. In this section we compare actual program experience since June 2009 to our prior projection values. In addition, we provide intermediate projection results to give insight into how various experience and assumption changes have impacted valuation results.
Comparison of Actual Experience to 2009 Valuation Projections
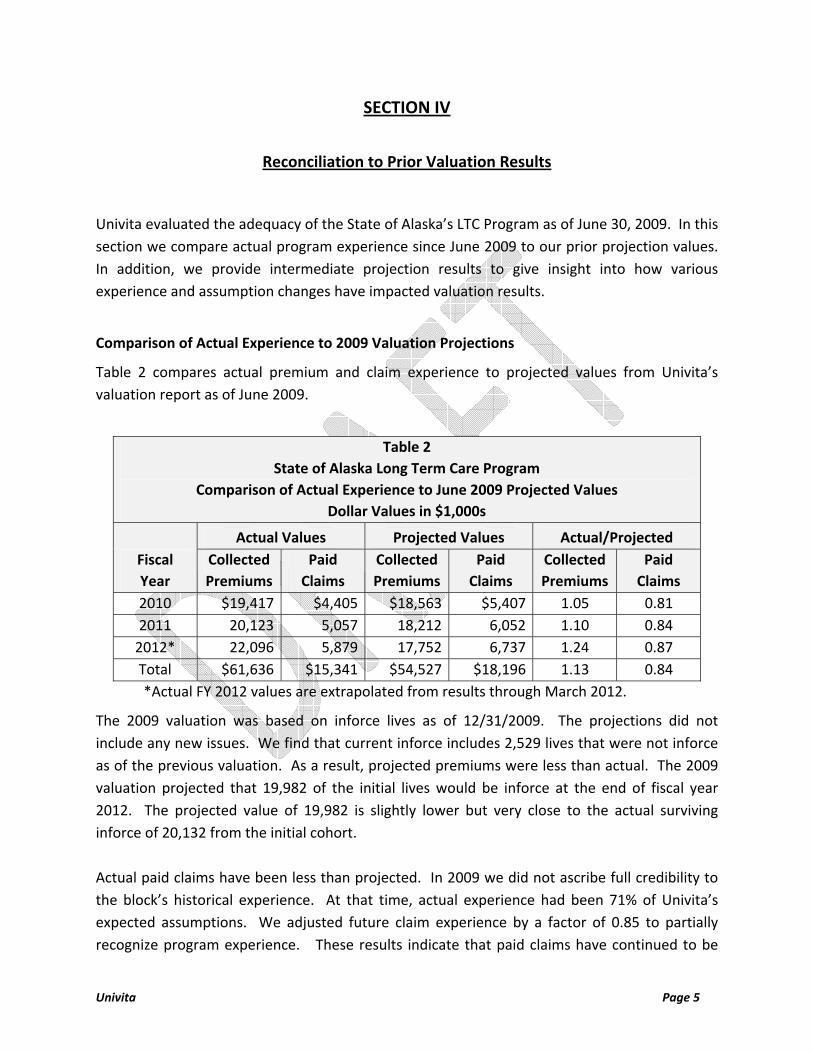
Table 2 compares actual premium and claim experience to projected values from Univita’s valuation report as of June 2009.
Table 2 State of Alaska Long Term Care Program
Comparison of Actual Experience to June 2009 Projected Values Dollar Values in $1,000s
Fiscal Year
Actual Values Projected Values Actual/Projected Collected Premiums
Paid Claims
Collected Premiums
Paid Claims
Collected Premiums
Paid Claims
2010 $19,417 $4,405 $18,563 $5,407 1.05 0.81 2011 20,123 5,057 18,212 6,052 1.10 0.84
2012* 22,096 5,879 17,752 6,737 1.24 0.87 Total $61,636 $15,341 $54,527 $18,196 1.13 0.84
*Actual FY 2012 values are extrapolated from results through March 2012.
The 2009 valuation was based on inforce lives as of 12/31/2009. The projections did not include any new issues. We find that current inforce includes 2,529 lives that were not inforce as of the previous valuation. As a result, projected premiums were less than actual. The 2009 valuation projected that 19,982 of the initial lives would be inforce at the end of fiscal year 2012. The projected value of 19,982 is slightly lower but very close to the actual surviving inforce of 20,132 from the initial cohort. Actual paid claims have been less than projected. In 2009 we did not ascribe full credibility to the block’s historical experience. At that time, actual experience had been 71% of Univita’s expected assumptions. We adjusted future claim experience by a factor of 0.85 to partially recognize program experience. These results indicate that paid claims have continued to be
Univita Page 6
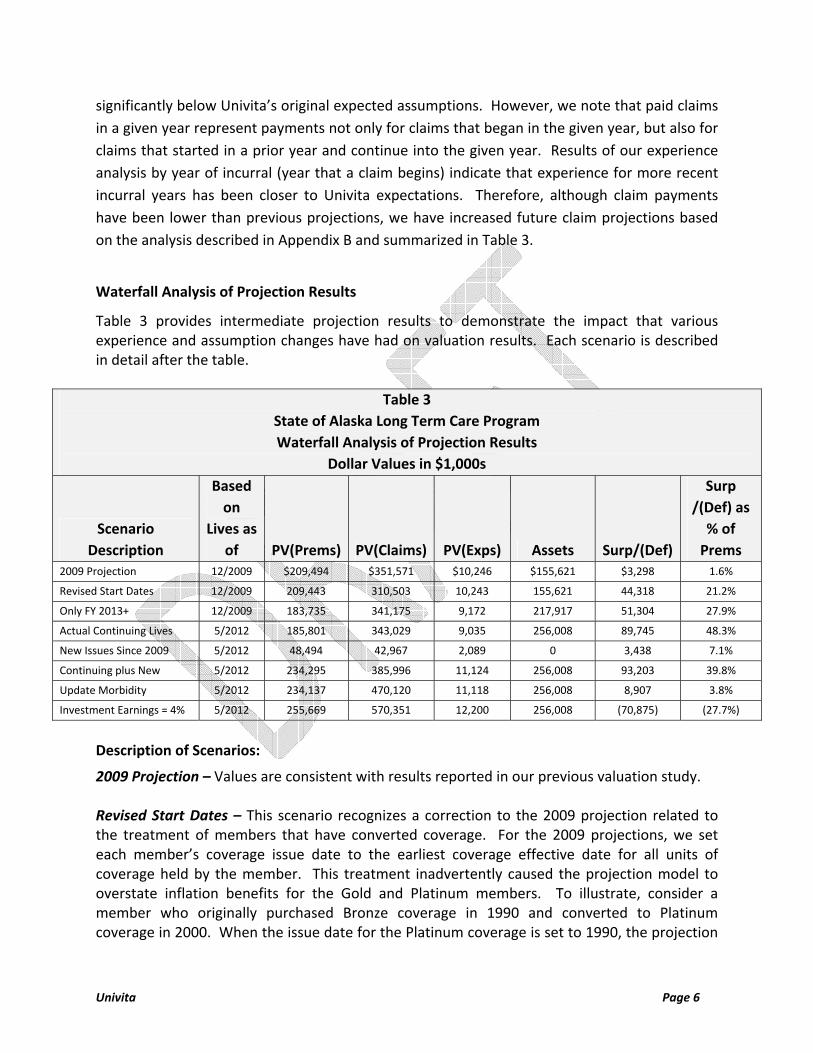
significantly below Univita’s original expected assumptions. However, we note that paid claims in a given year represent payments not only for claims that began in the given year, but also for claims that started in a prior year and continue into the given year. Results of our experience analysis by year of incurral (year that a claim begins) indicate that experience for more recent incurral years has been closer to Univita expectations. Therefore, although claim payments have been lower than previous projections, we have increased future claim projections based on the analysis described in Appendix B and summarized in Table 3.
Waterfall Analysis of Projection Results
Table 3 provides intermediate projection results to demonstrate the impact that various experience and assumption changes have had on valuation results. Each scenario is described in detail after the table.
Table 3 State of Alaska Long Term Care Program Waterfall Analysis of Projection Results
Dollar Values in $1,000s
Scenario Description
Based on
Lives as of PV(Prems) PV(Claims) PV(Exps) Assets Surp/(Def)
Surp /(Def) as
% of Prems
2009 Projection 12/2009 $209,494 $351,571 $10,246 $155,621 $3,298 1.6%
Revised Start Dates 12/2009 209,443 310,503 10,243 155,621 44,318 21.2%
Only FY 2013+ 12/2009 183,735 341,175 9,172 217,917 51,304 27.9%
Actual Continuing Lives 5/2012 185,801 343,029 9,035 256,008 89,745 48.3%
New Issues Since 2009 5/2012 48,494 42,967 2,089 0 3,438 7.1%
Continuing plus New 5/2012 234,295 385,996 11,124 256,008 93,203 39.8%
Update Morbidity 5/2012 234,137 470,120 11,118 256,008 8,907 3.8%
Investment Earnings = 4% 5/2012 255,669 570,351 12,200 256,008 (70,875) (27.7%)
Description of Scenarios:
2009 Projection – Values are consistent with results reported in our previous valuation study. Revised Start Dates – This scenario recognizes a correction to the 2009 projection related to the treatment of members that have converted coverage. For the 2009 projections, we set each member’s coverage issue date to the earliest coverage effective date for all units of coverage held by the member. This treatment inadvertently caused the projection model to overstate inflation benefits for the Gold and Platinum members. To illustrate, consider a member who originally purchased Bronze coverage in 1990 and converted to Platinum coverage in 2000. When the issue date for the Platinum coverage is set to 1990, the projection
Univita Page 7
software set the maximum daily benefit to be $310 in calendar year 2000 (=$200 * 1.059) rather than to the actual maximum daily benefit of $200. This correction improved the valuation results due to a reduction in future claims for the Gold and Platinum plans. Only FY 2013+ - This scenario does not actually represent a new projection run. Rather, for this scenario present values are calculated using the same projections as the prior scenario; however we only include values for fiscal years 2013 and later in the present value calculations. This scenario provides a snapshot of what the 2009 valuation projections expected the current valuation results to be (as of fiscal year end 2012). Results indicate that the 2009 valuation anticipated that premium adequacy would increase between 2009 and 2012. Actual Continuing Lives – For this scenario, we isolated the members that were included in the 2009 projection that remain in force as of May 2012. This scenario indicates that the persisting lives are very consistent with the lives that the 2009 projection assumed for future premiums, claims and expenses. The 2009 projection did not however predict the actual asset levels as of fiscal year end 2012. Actual asset levels are 17.4% higher than projected, which increases the premium adequacy to 48.3%. New Issues Since 2009 – This scenario provides results for lives that are inforce as of May 2012, which were not inforce as of December 2009. Note that the future premiums for these lives are adequate to cover future benefits and expenses using 2009 valuation assumptions. As a result, we did not allocate any assets to this cohort of lives. Continuing Plus New – This scenario is the sum of the prior two scenarios and provides results for the entire cohort of lives inforce as of May 2012 using assumptions from the 2009 valuation. Update Morbidity – We made four changes to the morbidity assumptions for the 2012 valuation:
• Updated claim termination rates based on actual experience. • Revised actual to expected factors based on actual experience. • Recognized that Bronze home health care benefits are payable up to $200,000. • Recognized that benefits for Bronze care provided outside of Alaska are payable at
reduced daily benefit amounts but for potentially longer periods of time. • Recognized changes in the availability of licensed HHC agencies that are willing to
provide custodial care services. These changes are documented in more detail in Appendices A and B. In aggregate these changes cause future claims to increase by 21.8% and premium adequacy to decrease from 39.8% to 3.8%. Investment Earnings = 4% – The 2009 projections assume an investment earnings rate of 5%. This rate was decreased to 4% for the 2012 valuation based on input from program staff. This change also has a significant impact on premium adequacy, which decreased from 3.8% to (27.7%). Lower than anticipated investment earnings have been a common challenge to LTC insurance carriers.
Univita Page 8
SECTION V
Sensitivity Testing Results
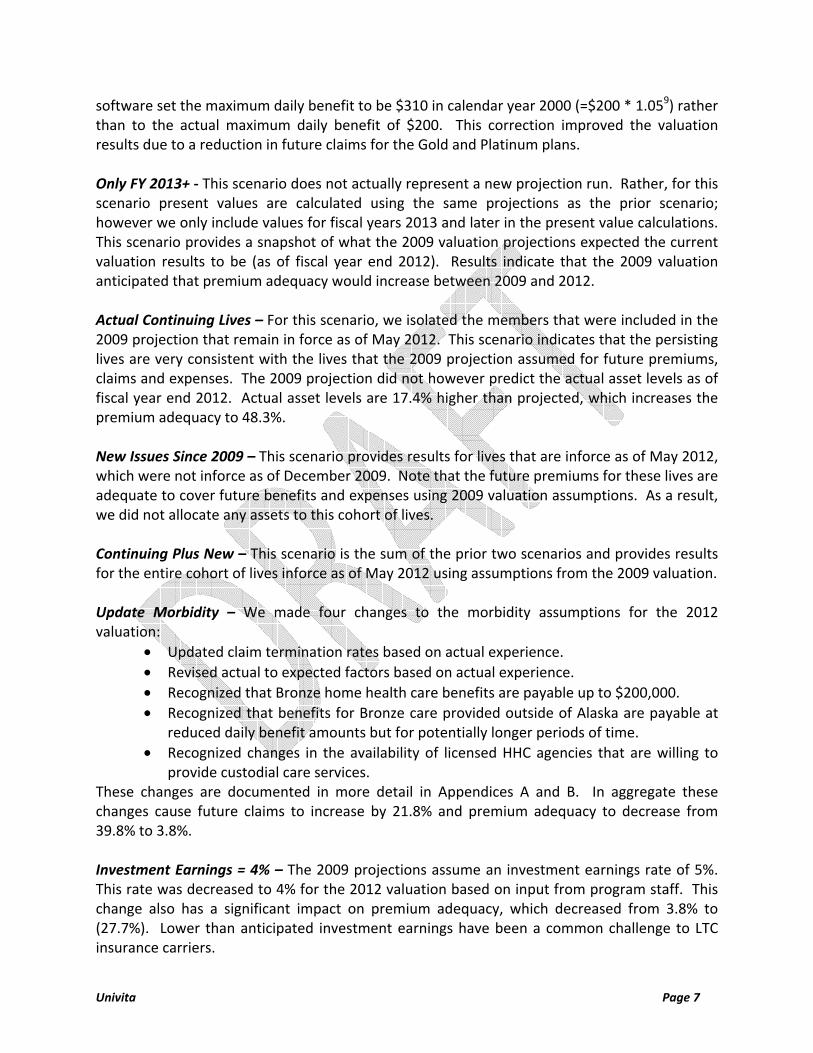
We analyzed the sensitivity of asset adequacy levels to changes in assumptions with respect to morbidity, voluntary lapses, mortality, and investment earnings. Table 4 illustrates the impact of changes to the base assumptions on asset adequacy levels. Results are highly sensitive to the assumptions underlying the calculations. While these tests indicate outcomes under each of these scenarios, they do not indicate the likelihood of each scenario. Thus, this testing does not indicate the probability that projected values will be realized. Each of these tests is independent. We have not tested the impact of multiple assumptions deviating from expectations.
Table 4 State of Alaska Long Term Care Program
Sensitivity Testing Asset Adequacy (Deficiency) Results Surplus (Deficit) = Current Assets plus the Present Value of Net Cash Flows
(in thousands of dollars and as a % of future premiums)
Scenario Surplus (Deficit) As a % of Future
Premium Base case scenario $(70,875) (27.7%) Increase in morbidity of 10%, all years (127,994) (50.1%) Decrease in morbidity of 10%, all years (13,755) (5.4%) Voluntary lapse = 200% of best estimate 988 0.4% Voluntary lapse = 50% of best estimate (114,364) (42.6%) Mortality = 100% of 1994 GAM (17,363) (7.1%) Mortality = 70% of 1994 GAM (140,153) (52.4%) Investment earnings = 3.0% (176,883) (62.9%) Investment earnings = 3.5% (120,064) (44.8%) Investment earnings = 4.5% (28,198) (11.5%) Investment earnings = 5.0% 8,907 3.8%
Appendix A
Long Term Care Model and Assumptions
Univita Page A-1
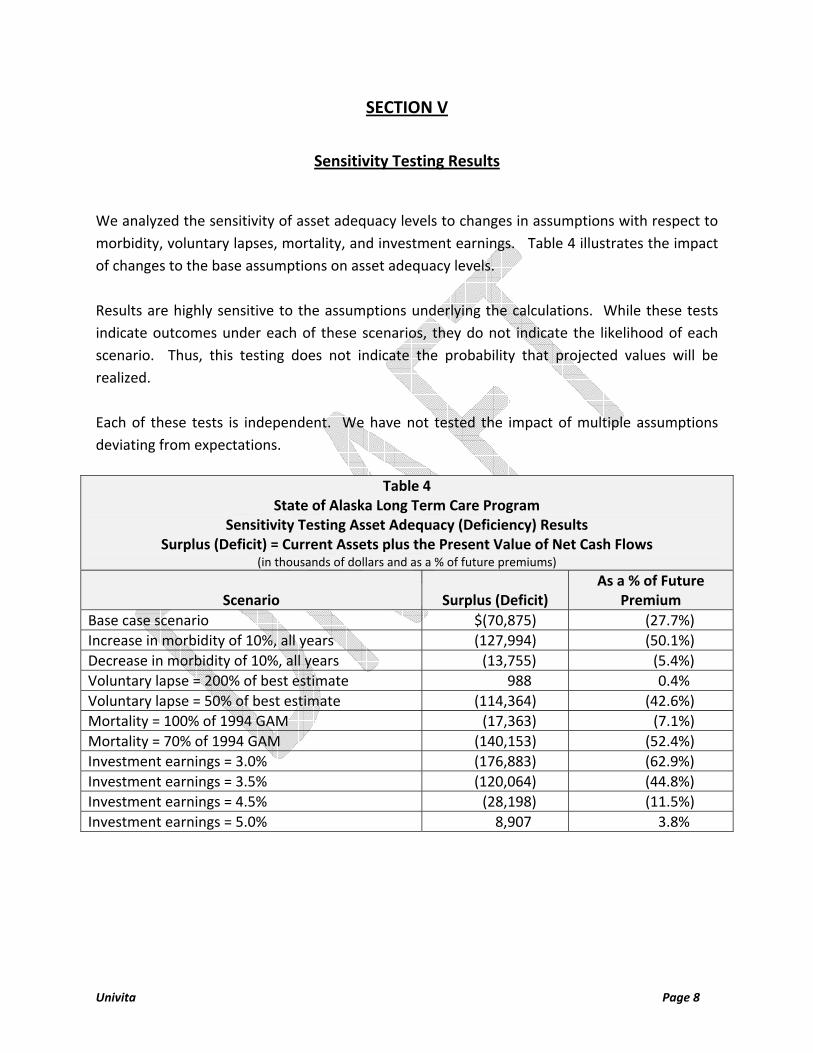
Model The State of Alaska LTC program includes four plan offerings: Bronze, Silver, Gold and Platinum. Table 5 describes benefits included in each plan.
Table 5 State of Alaska Long Term Care Program
Benefit Summary by Plan Option Benefit Bronze Silver Gold Platinum
Lifetime Maximum
$200,000 (HH is limited to $50,000)*
$400,000 $300,000 $300,000
Inflation Protection
None None 5% Simple until attained age 85
5% Compound until attained age 85
Elimination Period
90 Day 90 Day
Benefit Trigger 2 of 5 ADLs 2 of 6 ADLs or cognitively impaired
Nursing Home Daily Benefit
$125 in-state $75 out-of-state
$200
Assisted Living Facility Daily Benefit
If approved $150 (75% of NH)
Home Health Care Daily Benefit
$75 in-state $40 out-of-state
$125 (62.5% of NH)
Hospice Daily Benefit
Not covered $125 (62.5% of NH)
Respite Benefit Not covered Up to $200 daily Up to 14 days per calendar year
*Although the benefit description booklet limits Home Health Care benefits to a lifetime maximum of $50,000, we understand that the State of Alaska LTC program has elected to expand HHC benefits up to the $200,000 lifetime maximum. Expected claim costs and claim reserves reflect this benefit change.
The cash flow results are based on a seriatim projection of 22,705 inforce lives as of 5/31/2012. Current projections do not include any new issues.
Appendix A
Long Term Care Model and Assumptions
Univita Page A-2
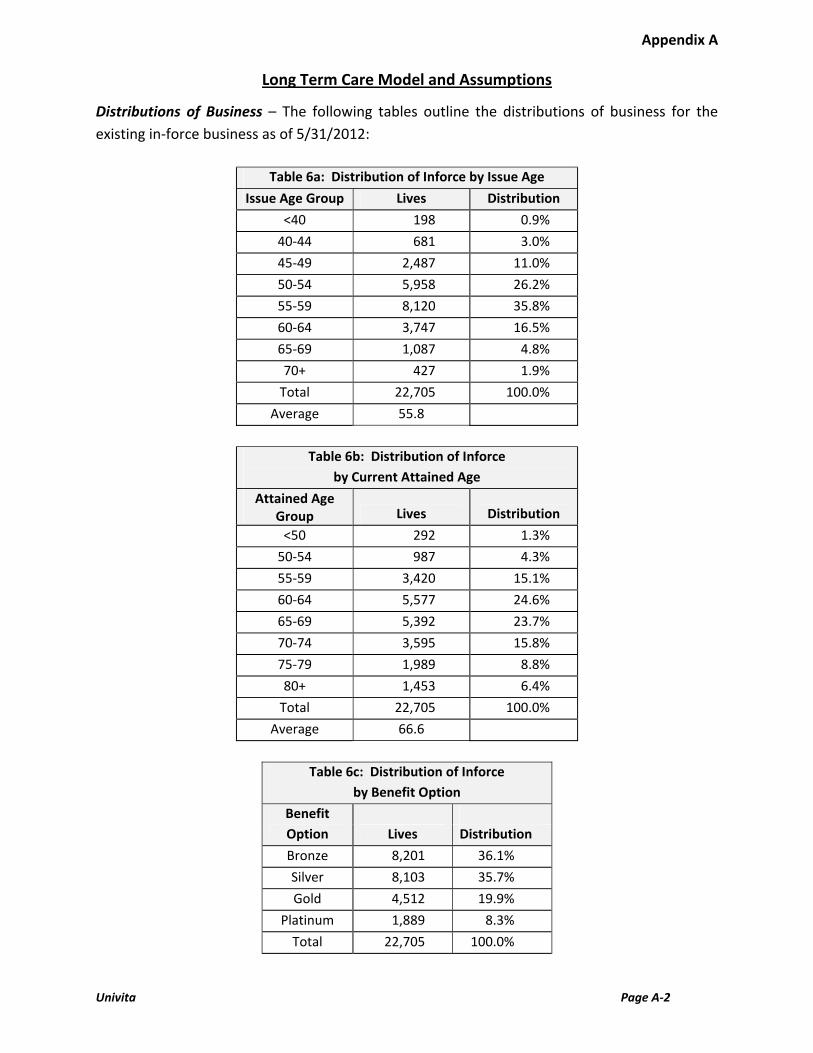
Distributions of Business – The following tables outline the distributions of business for the existing in-force business as of 5/31/2012:
Table 6a: Distribution of Inforce by Issue Age
Issue Age Group Lives Distribution <40 198 0.9%
40-44 681 3.0% 45-49 2,487 11.0% 50-54 5,958 26.2% 55-59 8,120 35.8% 60-64 3,747 16.5% 65-69 1,087 4.8% 70+ 427 1.9%
Total 22,705 100.0% Average 55.8
Table 6b: Distribution of Inforce
by Current Attained Age Attained Age
Group Lives Distribution <50 292 1.3%
50-54 987 4.3% 55-59 3,420 15.1% 60-64 5,577 24.6% 65-69 5,392 23.7% 70-74 3,595 15.8% 75-79 1,989 8.8% 80+ 1,453 6.4%
Total 22,705 100.0% Average 66.6
Table 6c: Distribution of Inforce
by Benefit Option Benefit Option Lives
Distribution
Bronze 8,201 36.1% Silver 8,103 35.7% Gold 4,512 19.9%
Platinum 1,889 8.3% Total 22,705 100.0%
Appendix A
Long Term Care Model and Assumptions
Univita Page A-3
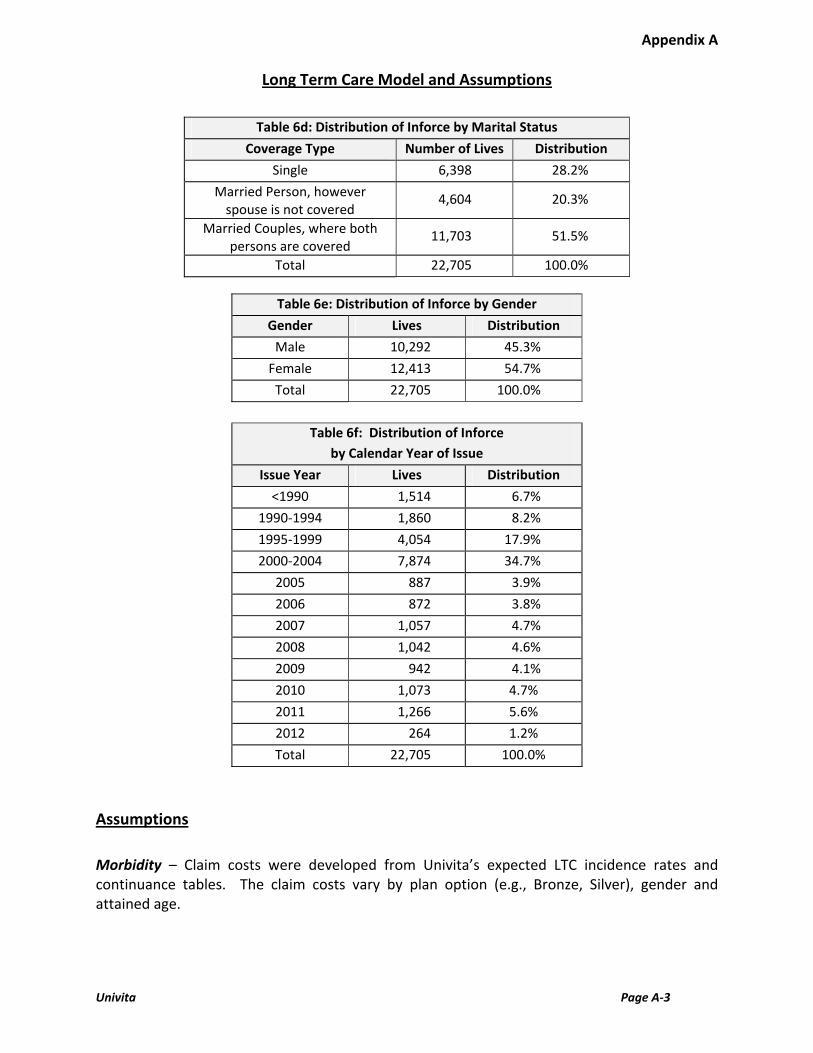
Table 6d: Distribution of Inforce by Marital Status
Coverage Type Number of Lives Distribution Single 6,398 28.2%
Married Person, however spouse is not covered
4,604 20.3%
Married Couples, where both persons are covered
11,703 51.5%
Total 22,705 100.0%
Table 6e: Distribution of Inforce by Gender Gender Lives Distribution
Male 10,292 45.3% Female 12,413 54.7%
Total 22,705 100.0%
Table 6f: Distribution of Inforce by Calendar Year of Issue
Issue Year Lives Distribution <1990 1,514 6.7%
1990-1994 1,860 8.2% 1995-1999 4,054 17.9% 2000-2004 7,874 34.7%
2005 887 3.9% 2006 872 3.8% 2007 1,057 4.7% 2008 1,042 4.6% 2009 942 4.1% 2010 1,073 4.7% 2011 1,266 5.6% 2012 264 1.2% Total 22,705 100.0%
Assumptions Morbidity – Claim costs were developed from Univita’s expected LTC incidence rates and continuance tables. The claim costs vary by plan option (e.g., Bronze, Silver), gender and attained age.
Appendix A
Long Term Care Model and Assumptions
Univita Page A-4
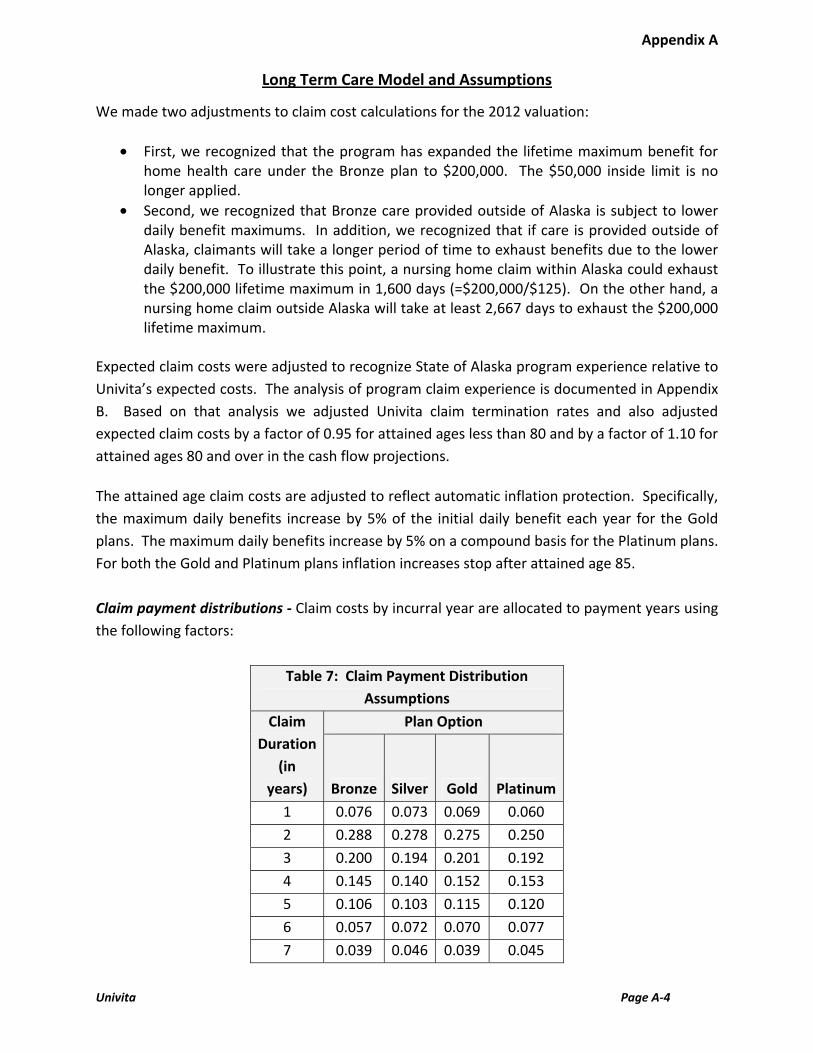
We made two adjustments to claim cost calculations for the 2012 valuation:
• First, we recognized that the program has expanded the lifetime maximum benefit for home health care under the Bronze plan to $200,000. The $50,000 inside limit is no longer applied.
• Second, we recognized that Bronze care provided outside of Alaska is subject to lower daily benefit maximums. In addition, we recognized that if care is provided outside of Alaska, claimants will take a longer period of time to exhaust benefits due to the lower daily benefit. To illustrate this point, a nursing home claim within Alaska could exhaust the $200,000 lifetime maximum in 1,600 days (=$200,000/$125). On the other hand, a nursing home claim outside Alaska will take at least 2,667 days to exhaust the $200,000 lifetime maximum.
Expected claim costs were adjusted to recognize State of Alaska program experience relative to Univita’s expected costs. The analysis of program claim experience is documented in Appendix B. Based on that analysis we adjusted Univita claim termination rates and also adjusted expected claim costs by a factor of 0.95 for attained ages less than 80 and by a factor of 1.10 for attained ages 80 and over in the cash flow projections. The attained age claim costs are adjusted to reflect automatic inflation protection. Specifically, the maximum daily benefits increase by 5% of the initial daily benefit each year for the Gold plans. The maximum daily benefits increase by 5% on a compound basis for the Platinum plans. For both the Gold and Platinum plans inflation increases stop after attained age 85. Claim payment distributions - Claim costs by incurral year are allocated to payment years using the following factors:
Table 7: Claim Payment Distribution Assumptions
Claim Duration
(in years)
Plan Option
Bronze Silver Gold Platinum1 0.076 0.073 0.069 0.0602 0.288 0.278 0.275 0.2503 0.200 0.194 0.201 0.1924 0.145 0.140 0.152 0.1535 0.106 0.103 0.115 0.1206 0.057 0.072 0.070 0.0777 0.039 0.046 0.039 0.045
Appendix A
Long Term Care Model and Assumptions
Univita Page A-5
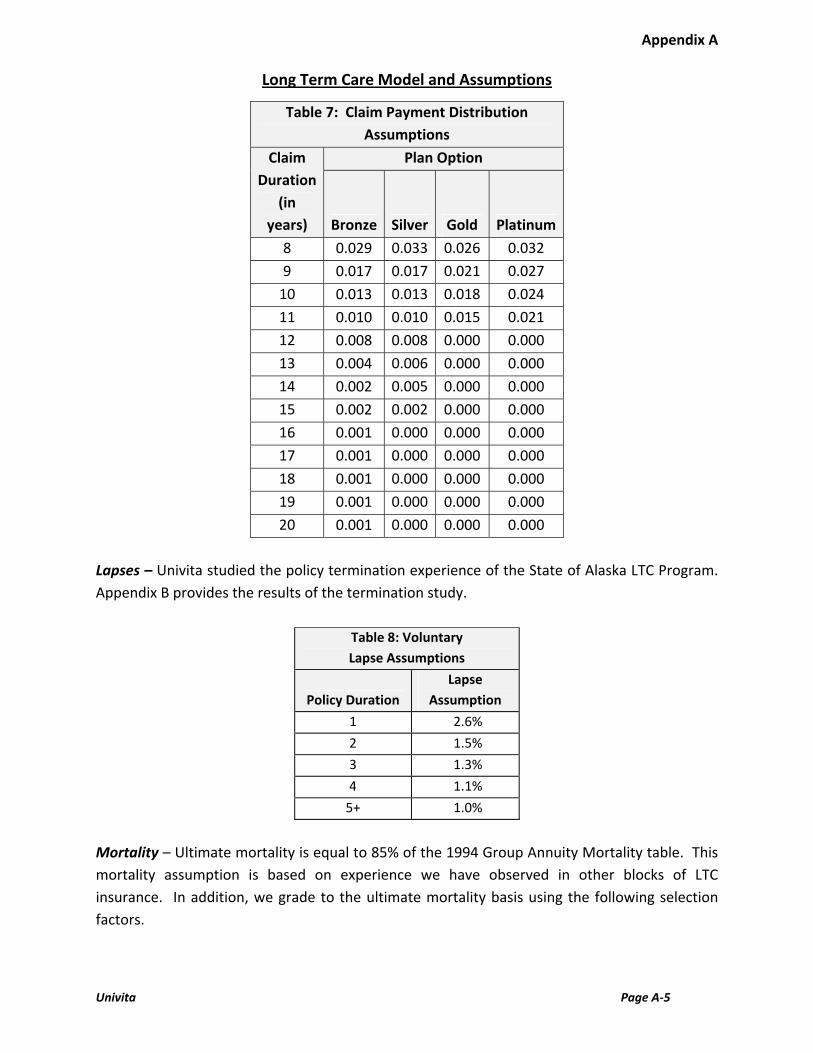
Table 7: Claim Payment Distribution Assumptions
Claim Duration
(in years)
Plan Option
Bronze Silver Gold Platinum8 0.029 0.033 0.026 0.0329 0.017 0.017 0.021 0.027
10 0.013 0.013 0.018 0.02411 0.010 0.010 0.015 0.02112 0.008 0.008 0.000 0.00013 0.004 0.006 0.000 0.000 14 0.002 0.005 0.000 0.000 15 0.002 0.002 0.000 0.000 16 0.001 0.000 0.000 0.000 17 0.001 0.000 0.000 0.000 18 0.001 0.000 0.000 0.000 19 0.001 0.000 0.000 0.000 20 0.001 0.000 0.000 0.000
Lapses – Univita studied the policy termination experience of the State of Alaska LTC Program. Appendix B provides the results of the termination study.
Table 8: Voluntary Lapse Assumptions
Policy Duration Lapse
Assumption 1 2.6% 2 1.5% 3 1.3% 4 1.1%
5+ 1.0% Mortality – Ultimate mortality is equal to 85% of the 1994 Group Annuity Mortality table. This mortality assumption is based on experience we have observed in other blocks of LTC insurance. In addition, we grade to the ultimate mortality basis using the following selection factors.
Appendix A
Long Term Care Model and Assumptions
Univita Page A-6
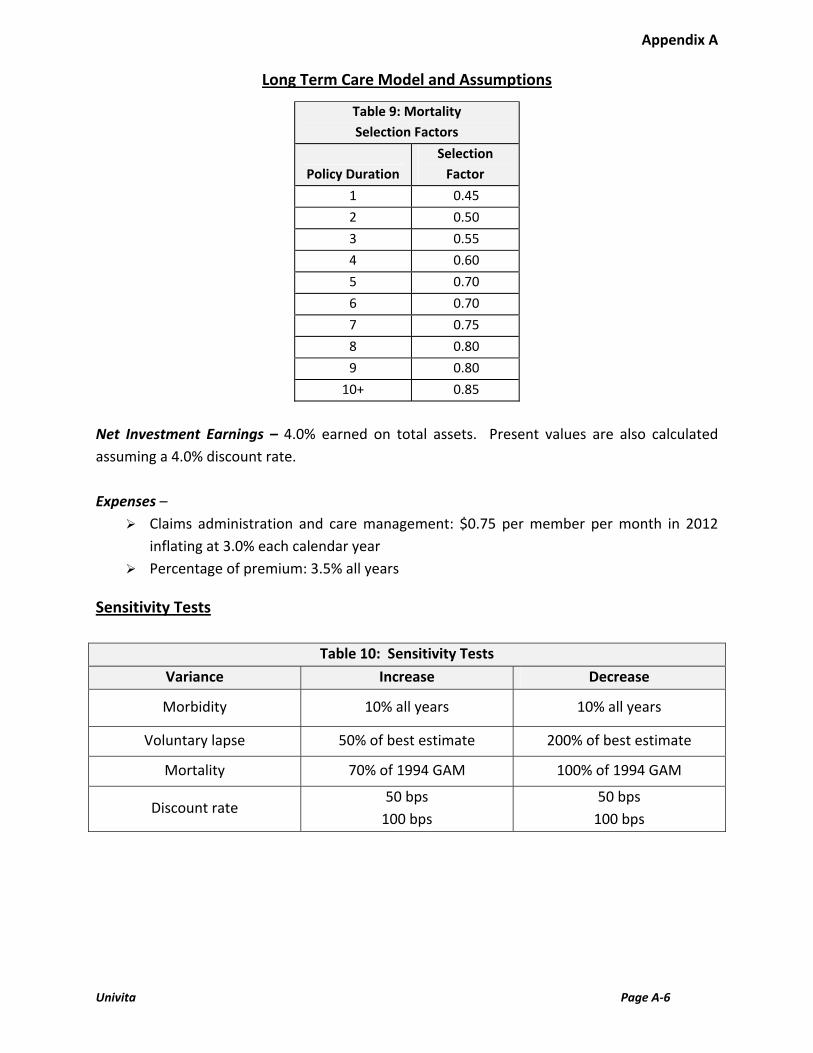
Table 9: Mortality Selection Factors
Policy Duration Selection
Factor 1 0.45 2 0.50 3 0.55 4 0.60 5 0.70 6 0.70 7 0.75 8 0.80 9 0.80
10+ 0.85 Net Investment Earnings – 4.0% earned on total assets. Present values are also calculated assuming a 4.0% discount rate. Expenses –
Claims administration and care management: $0.75 per member per month in 2012 inflating at 3.0% each calendar year
Percentage of premium: 3.5% all years Sensitivity Tests
Table 10: Sensitivity TestsVariance Increase Decrease
Morbidity 10% all years 10% all years
Voluntary lapse 50% of best estimate 200% of best estimate
Mortality 70% of 1994 GAM 100% of 1994 GAM
Discount rate 50 bps
100 bps 50 bps
100 bps
Appendix B
State of Alaska LTC Program Experience Analysis
Univita Page B-1
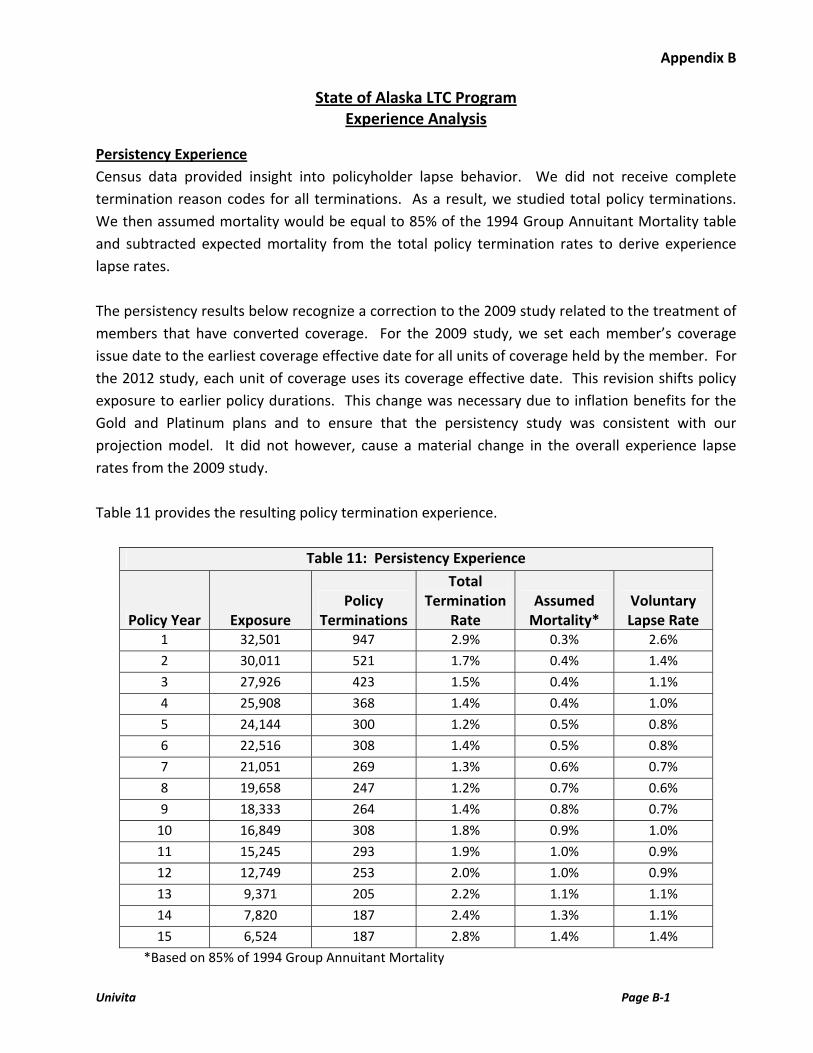
Persistency Experience Census data provided insight into policyholder lapse behavior. We did not receive complete termination reason codes for all terminations. As a result, we studied total policy terminations. We then assumed mortality would be equal to 85% of the 1994 Group Annuitant Mortality table and subtracted expected mortality from the total policy termination rates to derive experience lapse rates. The persistency results below recognize a correction to the 2009 study related to the treatment of members that have converted coverage. For the 2009 study, we set each member’s coverage issue date to the earliest coverage effective date for all units of coverage held by the member. For the 2012 study, each unit of coverage uses its coverage effective date. This revision shifts policy exposure to earlier policy durations. This change was necessary due to inflation benefits for the Gold and Platinum plans and to ensure that the persistency study was consistent with our projection model. It did not however, cause a material change in the overall experience lapse rates from the 2009 study. Table 11 provides the resulting policy termination experience.
Table 11: Persistency Experience
Policy Year Exposure Policy
Terminations
Total Termination
Rate Assumed
Mortality* Voluntary Lapse Rate
1 32,501 947 2.9% 0.3% 2.6% 2 30,011 521 1.7% 0.4% 1.4% 3 27,926 423 1.5% 0.4% 1.1% 4 25,908 368 1.4% 0.4% 1.0% 5 24,144 300 1.2% 0.5% 0.8% 6 22,516 308 1.4% 0.5% 0.8% 7 21,051 269 1.3% 0.6% 0.7% 8 19,658 247 1.2% 0.7% 0.6% 9 18,333 264 1.4% 0.8% 0.7%
10 16,849 308 1.8% 0.9% 1.0% 11 15,245 293 1.9% 1.0% 0.9% 12 12,749 253 2.0% 1.0% 0.9% 13 9,371 205 2.2% 1.1% 1.1% 14 7,820 187 2.4% 1.3% 1.1% 15 6,524 187 2.8% 1.4% 1.4%
*Based on 85% of 1994 Group Annuitant Mortality
Appendix B
State of Alaska LTC Program Experience Analysis
Univita Page B-2
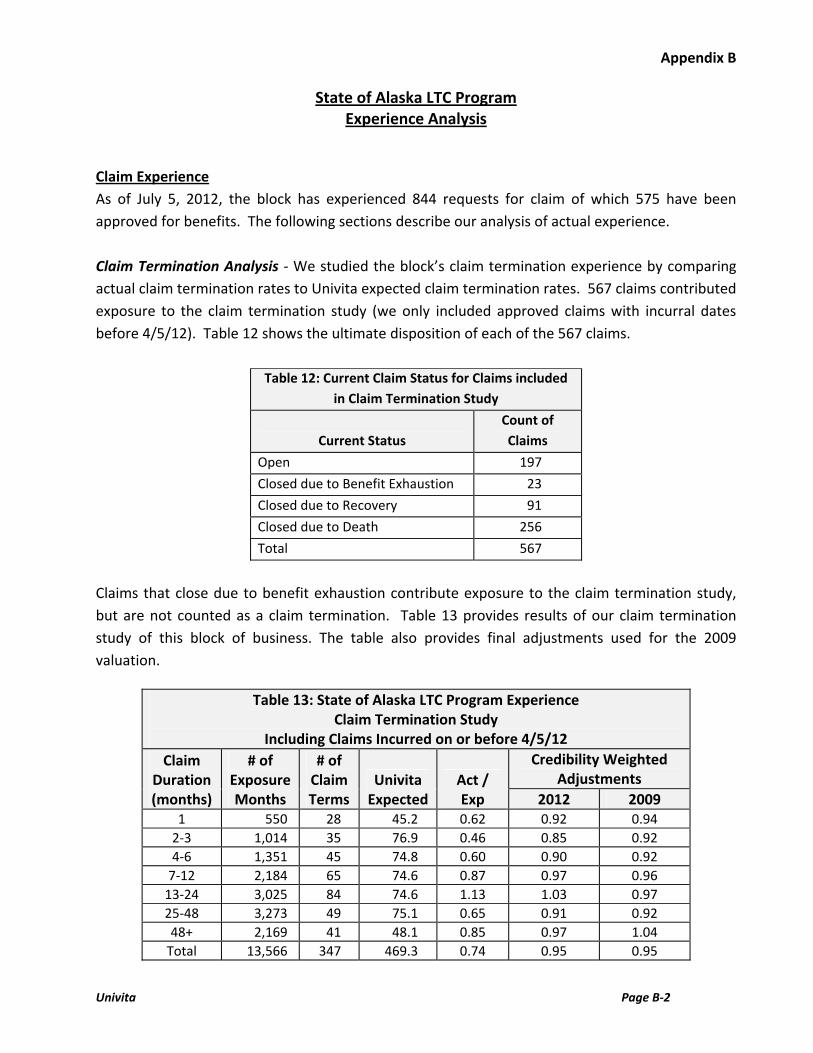
Claim Experience As of July 5, 2012, the block has experienced 844 requests for claim of which 575 have been approved for benefits. The following sections describe our analysis of actual experience. Claim Termination Analysis - We studied the block’s claim termination experience by comparing actual claim termination rates to Univita expected claim termination rates. 567 claims contributed exposure to the claim termination study (we only included approved claims with incurral dates before 4/5/12). Table 12 shows the ultimate disposition of each of the 567 claims.
Table 12: Current Claim Status for Claims included in Claim Termination Study
Current Status Count of Claims
Open 197 Closed due to Benefit Exhaustion 23 Closed due to Recovery 91 Closed due to Death 256 Total 567
Claims that close due to benefit exhaustion contribute exposure to the claim termination study, but are not counted as a claim termination. Table 13 provides results of our claim termination study of this block of business. The table also provides final adjustments used for the 2009 valuation.
Table 13: State of Alaska LTC Program Experience
Claim Termination Study Including Claims Incurred on or before 4/5/12
Claim Duration (months)
# of Exposure Months
# of Claim Terms
Univita Expected
Act / Exp
Credibility Weighted Adjustments
2012 2009 1 550 28 45.2 0.62 0.92 0.94
2-3 1,014 35 76.9 0.46 0.85 0.92 4-6 1,351 45 74.8 0.60 0.90 0.92
7-12 2,184 65 74.6 0.87 0.97 0.96 13-24 3,025 84 74.6 1.13 1.03 0.97 25-48 3,273 49 75.1 0.65 0.91 0.92 48+ 2,169 41 48.1 0.85 0.97 1.04
Total 13,566 347 469.3 0.74 0.95 0.95
Appendix B
State of Alaska LTC Program Experience Analysis
Univita Page B-3
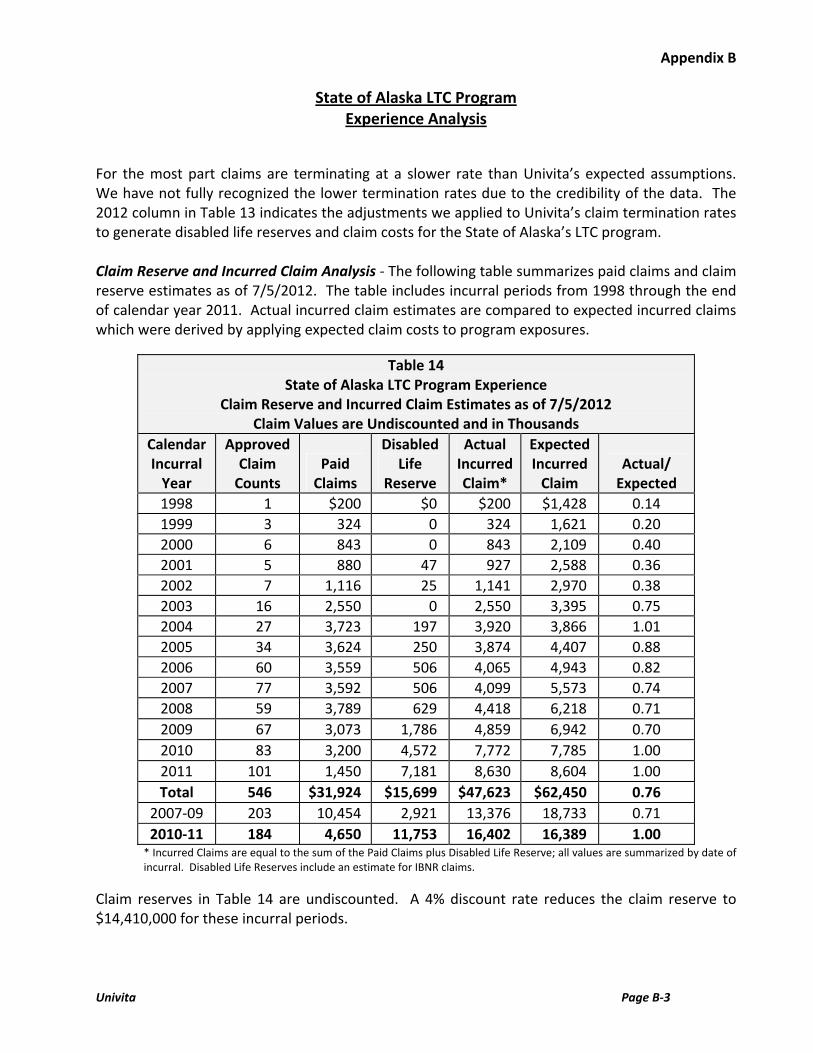
For the most part claims are terminating at a slower rate than Univita’s expected assumptions. We have not fully recognized the lower termination rates due to the credibility of the data. The 2012 column in Table 13 indicates the adjustments we applied to Univita’s claim termination rates to generate disabled life reserves and claim costs for the State of Alaska’s LTC program. Claim Reserve and Incurred Claim Analysis - The following table summarizes paid claims and claim reserve estimates as of 7/5/2012. The table includes incurral periods from 1998 through the end of calendar year 2011. Actual incurred claim estimates are compared to expected incurred claims which were derived by applying expected claim costs to program exposures.
Table 14 State of Alaska LTC Program Experience
Claim Reserve and Incurred Claim Estimates as of 7/5/2012 Claim Values are Undiscounted and in Thousands
Calendar Incurral
Year
Approved Claim
Counts Paid
Claims
Disabled Life
Reserve
Actual Incurred Claim*
Expected Incurred
Claim Actual/
Expected 1998 1 $200 $0 $200 $1,428 0.14 1999 3 324 0 324 1,621 0.20 2000 6 843 0 843 2,109 0.40 2001 5 880 47 927 2,588 0.36 2002 7 1,116 25 1,141 2,970 0.38 2003 16 2,550 0 2,550 3,395 0.75 2004 27 3,723 197 3,920 3,866 1.01 2005 34 3,624 250 3,874 4,407 0.88 2006 60 3,559 506 4,065 4,943 0.82 2007 77 3,592 506 4,099 5,573 0.74 2008 59 3,789 629 4,418 6,218 0.71 2009 67 3,073 1,786 4,859 6,942 0.70 2010 83 3,200 4,572 7,772 7,785 1.00 2011 101 1,450 7,181 8,630 8,604 1.00 Total 546 $31,924 $15,699 $47,623 $62,450 0.76
2007-09 203 10,454 2,921 13,376 18,733 0.71 2010-11 184 4,650 11,753 16,402 16,389 1.00
* Incurred Claims are equal to the sum of the Paid Claims plus Disabled Life Reserve; all values are summarized by date of incurral. Disabled Life Reserves include an estimate for IBNR claims.
Claim reserves in Table 14 are undiscounted. A 4% discount rate reduces the claim reserve to $14,410,000 for these incurral periods.
Appendix B
State of Alaska LTC Program Experience Analysis
Univita Page B-4
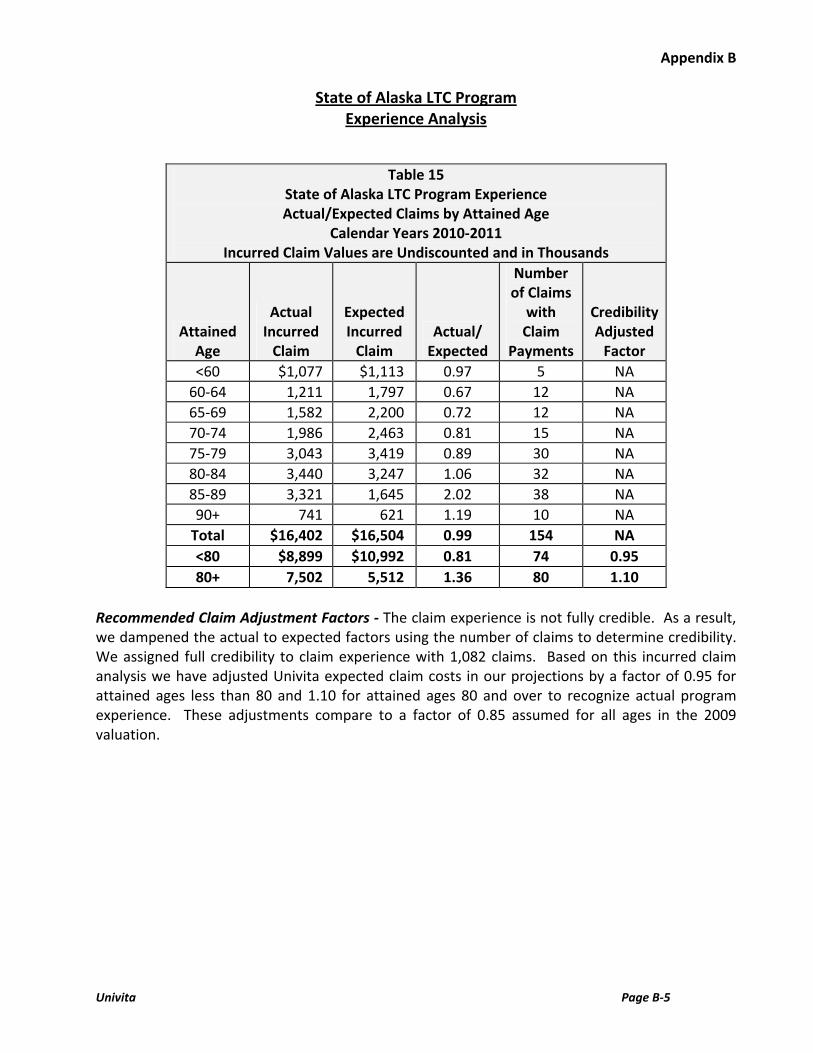
Table 14 shows that the block’s historical experience has been somewhat lower than Univita’s morbidity assumptions (using adjusted claim termination rates). However, in recent calendar years, the actual experience is consistent with Univita expected assumptions. Impact of Changes to HHC Licensing Requirements – We believe the shift in claim experience during calendar year 2010 is partially driven by changes in the eligible home health care providers. The State of Alaska LTC Program contracts require that home health care must be provided by licensed home health agencies. In recent years, licensed home health care providers in Alaska and Nationwide have shifted their services away from the custodial care required by the LTC program claimants and toward more acute care services, which are covered by Medicare. This shift has made it difficult for program claimants to obtain custodial care from licensed HHC providers. As a result, on a case by case basis, the program has begun to authorize care provided by Agency Based Personal Care Assistant programs (ABPCAs) and where ABPCAs or licensed HHC agencies are not available, Independent Providers. It is difficult to ascertain how much of the shift in experience can be attributed to the relaxation of the licensing requirement. We analyzed whether claim approval rates have increased since the protocol change. We found that claim approval rates since 9/1/2010 are actually lower than claim approval rates prior to 9/1/2010 (73.7% for decisions made on or after 9/1/2010 versus 79.0% for decisions before 9/1/2010). In addition, we analyzed whether the protocol change has caused an increase in the number of claims using HHC. In fact, the proportion of claims using HHC has declined from 26.2% to 22.9% before and after the protocol change. As a result, we cannot be certain that elevated claim levels in 2010 and 2011 can be attributed to the shift in HHC claim adjudication protocol. Nevertheless, we believe it is prudent to assume that claims will continue at this level until we see evidence to the contrary. Experience Analysis by Attained Age - We also analyzed the historical claim experience by attained age. Table 15 provides actual to expected ratios by attained age for claim experience from calendar years 2010 through 2011.
Appendix B
State of Alaska LTC Program Experience Analysis
Univita Page B-5
Table 15 State of Alaska LTC Program Experience Actual/Expected Claims by Attained Age
Calendar Years 2010-2011 Incurred Claim Values are Undiscounted and in Thousands
Attained Age
Actual Incurred
Claim
Expected Incurred
Claim Actual/
Expected
Number of Claims
with Claim
Payments
Credibility Adjusted
Factor <60 $1,077 $1,113 0.97 5 NA
60-64 1,211 1,797 0.67 12 NA 65-69 1,582 2,200 0.72 12 NA 70-74 1,986 2,463 0.81 15 NA 75-79 3,043 3,419 0.89 30 NA 80-84 3,440 3,247 1.06 32 NA 85-89 3,321 1,645 2.02 38 NA 90+ 741 621 1.19 10 NA
Total $16,402 $16,504 0.99 154 NA <80 $8,899 $10,992 0.81 74 0.95 80+ 7,502 5,512 1.36 80 1.10
Recommended Claim Adjustment Factors - The claim experience is not fully credible. As a result, we dampened the actual to expected factors using the number of claims to determine credibility. We assigned full credibility to claim experience with 1,082 claims. Based on this incurred claim analysis we have adjusted Univita expected claim costs in our projections by a factor of 0.95 for attained ages less than 80 and 1.10 for attained ages 80 and over to recognize actual program experience. These adjustments compare to a factor of 0.85 assumed for all ages in the 2009 valuation.
Appendix C
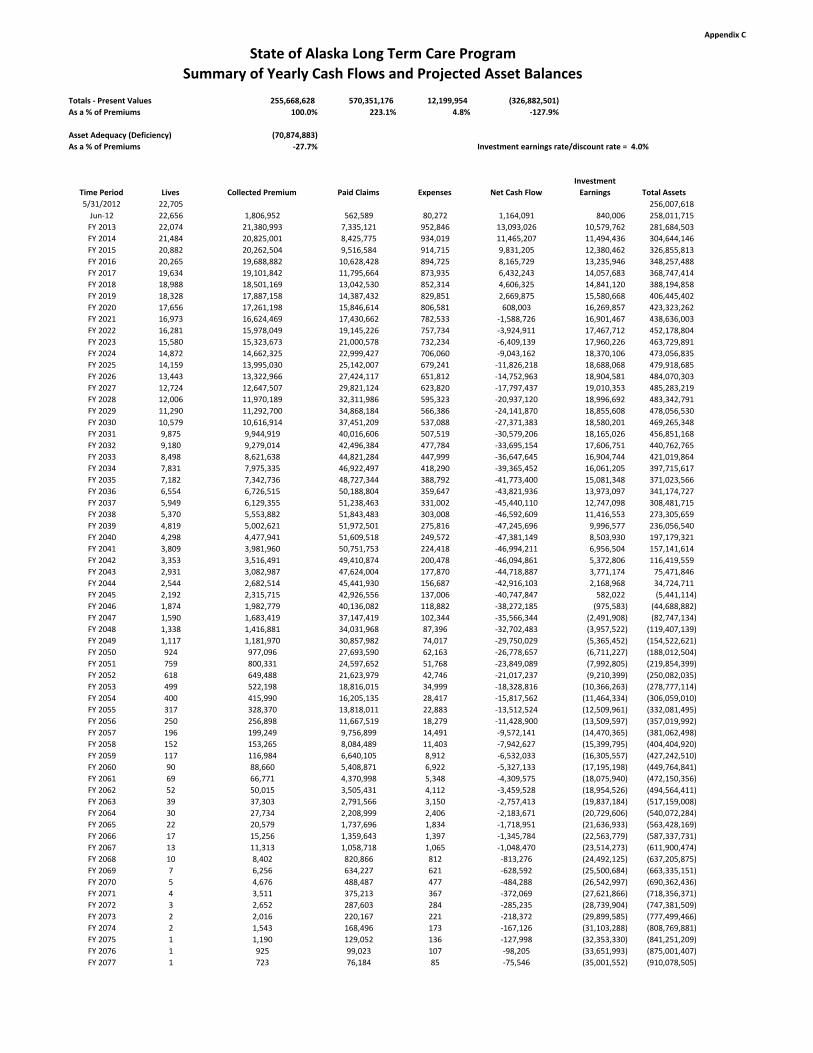
State of Alaska Long Term Care ProgramSummary of Yearly Cash Flows and Projected Asset Balances
Totals ‐ Present Values 255,668,628 570,351,176 12,199,954 (326,882,501) As a % of Premiums 100.0% 223.1% 4.8% ‐127.9%
Asset Adequacy (Deficiency) (70,874,883) As a % of Premiums ‐27.7% Investment earnings rate/discount rate = 4.0%
Time Period Lives Collected Premium Paid Claims Expenses Net Cash FlowInvestment Earnings Total Assets
5/31/2012 22,705 256,007,618 Jun‐12 22,656 1,806,952 562,589 80,272 1,164,091 840,006 258,011,715 FY 2013 22,074 21,380,993 7,335,121 952,846 13,093,026 10,579,762 281,684,503 FY 2014 21,484 20,825,001 8,425,775 934,019 11,465,207 11,494,436 304,644,146 FY 2015 20,882 20,262,504 9,516,584 914,715 9,831,205 12,380,462 326,855,813 FY 2016 20,265 19,688,882 10,628,428 894,725 8,165,729 13,235,946 348,257,488 FY 2017 19,634 19,101,842 11,795,664 873,935 6,432,243 14,057,683 368,747,414 FY 2018 18,988 18,501,169 13,042,530 852,314 4,606,325 14,841,120 388,194,858 FY 2019 18,328 17,887,158 14,387,432 829,851 2,669,875 15,580,668 406,445,402 FY 2020 17,656 17,261,198 15,846,614 806,581 608,003 16,269,857 423,323,262 FY 2021 16,973 16,624,469 17,430,662 782,533 ‐1,588,726 16,901,467 438,636,003 FY 2022 16,281 15,978,049 19,145,226 757,734 ‐3,924,911 17,467,712 452,178,804 FY 2023 15,580 15,323,673 21,000,578 732,234 ‐6,409,139 17,960,226 463,729,891 FY 2024 14,872 14,662,325 22,999,427 706,060 ‐9,043,162 18,370,106 473,056,835 FY 2025 14,159 13,995,030 25,142,007 679,241 ‐11,826,218 18,688,068 479,918,685 FY 2026 13,443 13,322,966 27,424,117 651,812 ‐14,752,963 18,904,581 484,070,303 FY 2027 12,724 12,647,507 29,821,124 623,820 ‐17,797,437 19,010,353 485,283,219 FY 2028 12,006 11,970,189 32,311,986 595,323 ‐20,937,120 18,996,692 483,342,791 FY 2029 11,290 11,292,700 34,868,184 566,386 ‐24,141,870 18,855,608 478,056,530 FY 2030 10,579 10,616,914 37,451,209 537,088 ‐27,371,383 18,580,201 469,265,348 FY 2031 9,875 9,944,919 40,016,606 507,519 ‐30,579,206 18,165,026 456,851,168 FY 2032 9,180 9,279,014 42,496,384 477,784 ‐33,695,154 17,606,751 440,762,765 FY 2033 8,498 8,621,638 44,821,284 447,999 ‐36,647,645 16,904,744 421,019,864 FY 2034 7,831 7,975,335 46,922,497 418,290 ‐39,365,452 16,061,205 397,715,617 FY 2035 7,182 7,342,736 48,727,344 388,792 ‐41,773,400 15,081,348 371,023,566 FY 2036 6,554 6,726,515 50,188,804 359,647 ‐43,821,936 13,973,097 341,174,727 FY 2037 5,949 6,129,355 51,238,463 331,002 ‐45,440,110 12,747,098 308,481,715 FY 2038 5,370 5,553,882 51,843,483 303,008 ‐46,592,609 11,416,553 273,305,659 FY 2039 4,819 5,002,621 51,972,501 275,816 ‐47,245,696 9,996,577 236,056,540 FY 2040 4,298 4,477,941 51,609,518 249,572 ‐47,381,149 8,503,930 197,179,321 FY 2041 3,809 3,981,960 50,751,753 224,418 ‐46,994,211 6,956,504 157,141,614 FY 2042 3,353 3,516,491 49,410,874 200,478 ‐46,094,861 5,372,806 116,419,559 FY 2043 2,931 3,082,987 47,624,004 177,870 ‐44,718,887 3,771,174 75,471,846 FY 2044 2,544 2,682,514 45,441,930 156,687 ‐42,916,103 2,168,968 34,724,711 FY 2045 2,192 2,315,715 42,926,556 137,006 ‐40,747,847 582,022 (5,441,114) FY 2046 1,874 1,982,779 40,136,082 118,882 ‐38,272,185 (975,583) (44,688,882) FY 2047 1,590 1,683,419 37,147,419 102,344 ‐35,566,344 (2,491,908) (82,747,134) FY 2048 1,338 1,416,881 34,031,968 87,396 ‐32,702,483 (3,957,522) (119,407,139) FY 2049 1,117 1,181,970 30,857,982 74,017 ‐29,750,029 (5,365,452) (154,522,621) FY 2050 924 977,096 27,693,590 62,163 ‐26,778,657 (6,711,227) (188,012,504) FY 2051 759 800,331 24,597,652 51,768 ‐23,849,089 (7,992,805) (219,854,399) FY 2052 618 649,488 21,623,979 42,746 ‐21,017,237 (9,210,399) (250,082,035) FY 2053 499 522,198 18,816,015 34,999 ‐18,328,816 (10,366,263) (278,777,114) FY 2054 400 415,990 16,205,135 28,417 ‐15,817,562 (11,464,334) (306,059,010) FY 2055 317 328,370 13,818,011 22,883 ‐13,512,524 (12,509,961) (332,081,495) FY 2056 250 256,898 11,667,519 18,279 ‐11,428,900 (13,509,597) (357,019,992) FY 2057 196 199,249 9,756,899 14,491 ‐9,572,141 (14,470,365) (381,062,498) FY 2058 152 153,265 8,084,489 11,403 ‐7,942,627 (15,399,795) (404,404,920) FY 2059 117 116,984 6,640,105 8,912 ‐6,532,033 (16,305,557) (427,242,510) FY 2060 90 88,660 5,408,871 6,922 ‐5,327,133 (17,195,198) (449,764,841) FY 2061 69 66,771 4,370,998 5,348 ‐4,309,575 (18,075,940) (472,150,356) FY 2062 52 50,015 3,505,431 4,112 ‐3,459,528 (18,954,526) (494,564,411) FY 2063 39 37,303 2,791,566 3,150 ‐2,757,413 (19,837,184) (517,159,008) FY 2064 30 27,734 2,208,999 2,406 ‐2,183,671 (20,729,606) (540,072,284) FY 2065 22 20,579 1,737,696 1,834 ‐1,718,951 (21,636,933) (563,428,169) FY 2066 17 15,256 1,359,643 1,397 ‐1,345,784 (22,563,779) (587,337,731) FY 2067 13 11,313 1,058,718 1,065 ‐1,048,470 (23,514,273) (611,900,474) FY 2068 10 8,402 820,866 812 ‐813,276 (24,492,125) (637,205,875) FY 2069 7 6,256 634,227 621 ‐628,592 (25,500,684) (663,335,151) FY 2070 5 4,676 488,487 477 ‐484,288 (26,542,997) (690,362,436) FY 2071 4 3,511 375,213 367 ‐372,069 (27,621,866) (718,356,371) FY 2072 3 2,652 287,603 284 ‐285,235 (28,739,904) (747,381,509) FY 2073 2 2,016 220,167 221 ‐218,372 (29,899,585) (777,499,466) FY 2074 2 1,543 168,496 173 ‐167,126 (31,103,288) (808,769,881) FY 2075 1 1,190 129,052 136 ‐127,998 (32,353,330) (841,251,209) FY 2076 1 925 99,023 107 ‐98,205 (33,651,993) (875,001,407) FY 2077 1 723 76,184 85 ‐75,546 (35,001,552) (910,078,505)