Embed Size (px)
Citation preview

Prepared by The Littlejohn Group - 704-377-2262 – www.thelittlejohngroup.com
1
August 10, 2015
Radha Krishna Swayampakala
RS&H Engineering
1520 South Blvd, Suite 200
Charlotte, NC 28203
AC&W Railroad Relocation Analysis Market Study
Assignment
The Littlejohn Group and JMS Retail Advisory Services completed the following market analysis as part of the
AC&W Railroad Relocation Analysis Study for the City of Charlotte on behalf of RS&H Engineering.
The primary goals of the greater study include the following;
Identify the best alignment for the railroad relocation
Develop street and trail plans to enhance connectivity
Develop street and trail plans to enhance safety
Explore public-private partnership opportunities
Provide strategic recommendations for area economic development
In this phase of the study, the focus is to provide a residential and retail market analysis for the purpose of
assessing the impact of the alignment on residential and retail market potential. This report provides
demographic and real estate research to guide strategic decision making for the AC&W Railroad Relocation
Analysis. The first section includes the residential market analysis and the second section is the demographic and
commercial market analysis.

Prepared by The Littlejohn Group - 704-377-2262 – www.thelittlejohngroup.com
2
2012 2013 2014 thru 3/31/15
Av. Price $158,439.00 $247,453.00 $281,463.00 $302,492.00
Homes Sold 33 43 57 62
0
10
20
30
40
50
60
70
$0.00
$50,000.00
$100,000.00
$150,000.00
$200,000.00
$250,000.00
$300,000.00
$350,000.00
Ho
me
Pri
ce
NoDa Neighborhood New Single Family Home Sales
Residential Executive Summary There is moderate to high potential for residential development in the NoDa study area over the next 10-20
years. Residential development will primarily be accelerated by the Sugar Creek BLE Station and the number of
under-utilized parcels in the study area. A number of residential developers interviewed for this study are actively
seeking parcels in the NoDa area. Interest is spurred by the growth that continues along the Blue Line south of
Uptown; however, it is moderated by a wariness of developing too far north of the 36th street core. Residential
development within the walkable core of 36th street is premium.
Lower home values in the area west of Sugar Creek Road, pro-industrial parcels and the distance to retail/grocery
options in Plaza Midwood are mitigating factors, as is the success of new projects on the fringes of the study
area. Steel Gardens has begun building and pre-selling their 2nd phase of townhomes after a successful first
phase, and developer Bob Nixon is moving forward with a 36 unit condominium project “Galleries NoDa” at
North Davidson Street and Anderson Street, which has seen steady presales since the 2015 launch.
NoDa area new single family home sales have increased yearly since 2012 and have performed well through
March of 2015. This trend is unabated, as builders and developers continue to seek out development or
redevelopment opportunities in the neighborhood.

Prepared by The Littlejohn Group - 704-377-2262 – www.thelittlejohngroup.com
3
The planned rail relocation will not negatively affect home values and development potential in the study area.
Transportation improvements of any kind, in addition to infrastructure improvements planned by the City for rail
relocation, will serve to better connect the area to greater NoDa and spur the eventual re-development of
parcels. Extending North Davidson Street, Atmore Street, Bearwood Avenue and Card Street are crucial to the
residential redevelopment potential resulting from rail relocation. NoDa has a high level of organic for-sale
residential opportunities and continues to attract development in anticipation of the BLE beginning operation.
With 1,300 apartment units under construction in the East-1 submarket (Charlotte submarket map is shown on
page 26), it is logical that for-sale housing will be the most viable development strategy in the NoDa area, with
market-driven apartment development continuing as the market absorbs current demand.
The major limitations to increased residential development and sales in NoDa include the following:
Quality of the school district.
Availability and proximity of retail and neighborhood services such as banks, grocery and drug stores.
Lack of available parking.
Perception of crime.
Bike and Trail Connections to Plaza Midwood, Center City and the University Area.
Projected Residential Demand 2015-2030
Year Single Family Townhome Condominium Apartment
2015-2020 72 30 36 0
2020-2025 54 42 0 42
2025-2030 52 58 45 62
Total 178 130 81 104

Prepared by The Littlejohn Group - 704-377-2262 – www.thelittlejohngroup.com
4
Study Area The primary NoDa study area is defined as the area bounded by Matheson Avenue/30th Street to the south, The
Plaza to the east, Eastway Drive to the north and the NCRR corridor to the west. In this study we are also
referring to the greater NoDa area that encompasses the immediate fringes and the East Charlotte residential
and commercial submarkets.
NoDa Neighborhood Housing Background The NoDa area is Charlotte’s main arts district. NoDa is located north of Center City Charlotte and is centered at
the intersection of Davidson and 36th Street. A variety of housing options including town homes, condominiums,
rental apartments and single family homes are available and the area also includes commercial and industrial
uses. The community has undergone major redevelopment but has succeeded in keeping the areas unique
artistic environment. NoDa’s well established walkable restaurant and entertainment district is appealing, as is
the convenient commute to downtown and planned future light rail service.

Prepared by The Littlejohn Group - 704-377-2262 – www.thelittlejohngroup.com
5
Condominium and town house development in the area focuses on more affordable projects. Gateway Homes
was one of the first major developers of product in the area and has focused on delivering a very affordable
priced town house product at prices well below market. There have been some “loft” style projects such as Fat
City that have pushed pricing higher and offer a location in the areas main business district. Steel Gardens offers
more product that falls between suburban style homes and unique product and has hit upon a strong niche,
offering attractive, livable spaces in what is regarded by buyers as a fun location. Less successful projects have
included Royal Truss and NoDa 18, which offer less traditional product that does not reflect buyer preferences.
Product performance, as indicated above, has been driven by product and pricing. As with the Plaza Midwood
area, buyers are wary of less traditional design. Buyers are more willing to invest in more traditional styles of
product and less “trendy” modern design, even in the “arts district”. Contract retention has not been a major
issue for projects in NoDa. Inventory units being slow to sell has not been a problem at most projects in the
greater NoDa area.
Buyers in NoDa include young professionals and investors. The Gateway Homes project offered great value and
allowed those with lower income to buy into a pricier area. Since 2012, there have been six new apartment
developments in NoDa. This is partly due to buyer/millennial demand for rental, in addition to a number of
developers’ hoping to mimic the Transit-Oriented Developments the Blue Line has experienced along South
Boulevard. The success of the NoDa area is spurring development further out in neighborhoods such as Optimist
Park, Belmont and North Tryon. These locations will likely experience affordably priced condominium and town
house project development.
North Davidson (NoDa) Residential Market Analysis NoDa is a popular area for young homebuyers looking for a location close to Center City with walkable
entertainment and restaurant options. It is anticipated that the area will to grow more popular when the
Northeast Corridor transit line is completed because of the significant amenity this option represents to potential
residents.
Older single family homes have seen 13% appreciation in the value. Prices for the older homes range from under
$100,000 for a fixer upper to over $300,000 for a fully renovated home. Several developers have recognized the
appeal of the older homes and are building new homes in infill spots throughout the neighborhood. These
homes are designed to fit in with the architecture in the area and sell from $250,000 to $300,000.
The other option for homebuyers is the assortment of new constriction condominiums and town homes. Most of
the new products are priced under $200,000 and ranges from traditional town house style product to industrial
loft style condominiums.

Prepared by The Littlejohn Group - 704-377-2262 – www.thelittlejohngroup.com
6
The NoDa neighborhood began to attract new residents and development about 15 years ago. The affordable
houses and retail space attracted artists and young residents who in turn attracted more affluent residents and
entrepreneurs. Today, refurbished mill homes sell in the high $200’s to mid $400’s. Below is a representative
sample of current home listings in the NoDa neighborhood:
Address Sold Price Sq. Ft. PPSF
621 Charles Avenue, Charlotte, NC 28205 $430,000 2340.00 $183.76
2909 McDowell Street, Charlotte, NC 28205 $385,000 1942.00 $198.25
1913 Umstead Street, Charlotte, NC 28205 $419,000 2400.00 $174.58
715 35th Street, Charlotte, NC 28205 $508,500 2880.00 $176.56
3600 Oakwood Avenue, Charlotte, NC 28205 $329,000 1638.00 $200.85
2312 Lynhaven Street, Charlotte, NC 28205 $249,999 1061.00 $235.63
1631 Academy Street, Charlotte, NC 28205 $87,150 950.00 $91.74
1715 Matheson Avenue, Charlotte, NC 28205 $302,000 1891.00 $159.70
3700 The Plaza Road, Charlotte, NC 28205 $195,000 1778.00 $109.67
2200 Shamrock Drive, Charlotte, NC 28205 $110,000 1123.00 $97.95
3125 Maywood Drive, Charlotte, NC 28205 $253,900 1736.00 $146.26
900 Essex Street, Charlotte, NC 28205 $409,000 2286.00 $178.92
1914 Academy Street, Charlotte, NC 28205 $129,900 910.00 $142.75
2717 Duncan Avenue, Charlotte, NC 28205 $421,000 2400.00 $175.42
904 Academy Street, Charlotte, NC 28205 $172,000 960.00 $179.17
1234 35th Street, Charlotte, NC 28205 $380,000 1344.00 $282.74
3221 McDowell Street, Charlotte, NC 28205 $406,000 2356.00 $172.33
2208 Stratford Avenue, Charlotte, NC 28205 $375,000 1925.00 $194.81
3334 Spencer Street, Charlotte, NC 28205 $445,000 2865.00 $155.32
2804 Myers Street, Charlotte, NC 28205 $353,000 1728.00 $204.28
2809 Virginia Avenue, Charlotte, NC 28205 $210,000 1129.00 $186.01
2930 Wesley Avenue, Charlotte, NC 28205 $390,000 2252.00 $173.18
1900 Matheson Avenue, Charlotte, NC 28205 $350,000 1779.00 $196.74
2845 Virginia Avenue, Charlotte, NC 28205 $205,000 825.00 $248.48
2618 Mason Circle, Charlotte, NC 28205 $157,000 1153.00 $136.17
1001 Drummond Avenue, Charlotte, NC 28205 $392,000 2100.00 $186.67
3407 Benard Avenue, Charlotte, NC 28206 $253,000 1330.00 $190.23
905 Essex Street, Charlotte, NC 28205 $345,000 1919.00 $179.78
1316 Downs Avenue, Charlotte, NC 28205 $299,500 1927.00 $155.42
3017 Clemson Avenue, Charlotte, NC 28205 $270,000 1297.00 $208.17
1403 Downs Avenue, Charlotte, NC 28205 $231,500 1430.00 $161.89
1900 Union Street, Charlotte, NC 28205 $134,900 828.00 $162.92
1425 Shamrock Drive, Charlotte, NC 28205 $155,000 1787.00 $86.74 1601 Shamrock Drive, Charlotte, NC 28205 $195,000 1131.00 $172.41
1614 Anderson Street, Charlotte, NC 28205 $181,000 1115.00 $162.33
1001 Woodside Avenue, Charlotte, NC 28205 $269,900 1400.00 $192.79
904 Matheson Avenue, Charlotte, NC 28205 $135,000 725.00 $186.21
1314 Charles Avenue, Charlotte, NC 28205 $410,900 2252.00 $182.46
2427 Elkwood Circle, Charlotte, NC 28205 $167,888 1002.00 $167.55
1609 Anderson Street, Charlotte, NC 28205 $115,000 965.00 $119.17
2631 Palm Avenue, Charlotte, NC 28205 $114,000 1051.00 $108.47
3032 Georgia Avenue, Charlotte, NC 28205 $265,500 1065.00 $249.30
1411 Matheson Avenue, Charlotte, NC 28205 $370,000 2440.00 $151.64 2848 Georgia Avenue, Charlotte, NC 28205 $424,990 2650.00 $160.37
1216 Meadow Lane, Charlotte, NC 28205 $130,000 1080.00 $120.37 Average: $278,501 1625.44 $171.25
The NoDa neighborhood is convenient to Center City and the University area by car or bus. The drive time to
Center City is less than 5 minutes. The extension of the light rail blue line is currently under construction and will
link the neighborhood by light rail to both areas by 2017. The NoDa area has evolved into an established
residential area, with a mix of single family homes, condominiums and rental projects. A number of planned
condominium projects were cancelled due to the economic recession. It should be noted that some projects in

Prepared by The Littlejohn Group - 704-377-2262 – www.thelittlejohngroup.com
7
the area did not succeed due to price point. NoDa is more price sensitive than comparable neighborhoods in and
around the light rail in South End from Center City to Scaleybark.
NoDa’s housing market has a price ceiling barrier. Delivering product unique to the NoDa area and priced below
the greater market rates yields successful for sale product that effectively pulls buyers from other markets. In
short, this is an opportunity to fill a gap in the greater market for product that falls between townhouse offerings
and smaller condominium options in size and price point.
In addition, Charlotte has seen a boom in apartment growth along the light rail corridor in the last three years.
Almost 2,500 new TOD rental units are planned in the near future. The light rail has been a tremendous success
and will only serve to further connect the NoDa neighborhood with uptown Charlotte. We have already begun to
see developers grabbing land in NoDa for rental construction.

Prepared by The Littlejohn Group - 704-377-2262 – www.thelittlejohngroup.com
8
Planned and Proposed
Developer Project Location Proposed
Zoning Description
Southern Apartment
Group
Unnamed-Pending Approval
3.63 acres east side of North Davidson Street & bounded by E. 27th St, Yadkin Ave, E 26th St, and N Davidson St
TOD-M Development Area A up to 250 residential dwelling units and up to 7,500 square feet of gross floor area of non-residential uses as permitted by right and under prescribed conditions -Covered parking
Crescent Communities
Crescent-NoDa
6.98 acres located on the west side of East 36th Street between Cullman Avenue and North Davidson Street.
TOD-M Rollerton Road will be connected thru site. multi-family, mixed-use development that would have both commercial and residential aspects
DAMBCA enterprises
Matheson 1.43 acres located on the east side of Matheson Ave between N. Brevard St and N Davidson St
TOD-M 147 multi-family apartments, 8400 SF retail
Wellman Family Ltd.
NA 9.07 ac. located on the west side of N. Davidson St and bounded by N. Brevard St, Charles Ave, Matheson Ave, Jordan Pl, and N. Davidson St
TOD-M N/A

Prepared by The Littlejohn Group - 704-377-2262 – www.thelittlejohngroup.com
9
NoDa Attached Sales There is no currently active new construction condominium product available in the NoDa area. There are several
town house and single family infill options available to buyers and Steel Gardens is in the process of a rezoning to
allow for expansion of the community, which will include only town house style product. A review of closings
found an average price of $131,500 retail price, with a price per square foot of $149. We would expect a well-
designed new project to perform above that market average, in line with Steel Gardens ($121,500 and $209 per
square foot). The averages are skewed by the large number of sales at 28th Ro, which was considerably
discounted to accelerate sales pace.
Sales volume in the NoDa neighborhood remains steady for both resale and new sales. Fat City is the most
recently marketed offering with new units. Seven (7) have closed this year and there are several pending which
will complete the project. The current listings include 2 units priced between $199 and $209 per square foot. As
previously noted, parking is limited and no covered is included.
New Home Sales
Project
Units Closed 2011
Units Closed 2012
Units Closed 2013
Units Closed 2014
Av. Price 2011
Av. Price 2012
Av. Price 2013
Av. Price 2014
28 Ro 12 33 0 0 $126,667.00 $134,258.00 NA NA
35th/McDowell 0 0 0 1 NA NA NA $357,000.00
Alexander Park 6 9 4 4 $96,167.00 $98,667.00 $103,500.00 $121,500.00
Brightwalk 0 14 57 50 NA $196,964.00 $203,658.00 $247,480.00
NoDa Lofts 0 0 3 0 NA NA $200,000.00 NA
Steel Gardens 23 21 17 8 $173,435.00 $207,071.00 $181,118.00 $221,063.00
Resales
Project
Units Closed 2011
Units Closed 2012
Units Closed 2013
Units Closed 2014
Av. Price 2011
Av. Price 2012
Av. Price 2013
Av. Price 2014
28th Ro 0 0 1 3 NA NA $186,000.00 $143,833.00
Fat City 0 0 6 25 NA NA $160,583.00 $197,200.00
STEEL Gardens 0 6 13 14 NA $203,692.00 $223,286.00 $231,890.00
Villa Heights 5 2 13 21 $101,800.00 $133,250.00 $170,346.00 $194,762.00
Villages at Rosedale 2 6 16 14 $200,000.00 $146,200.00 $169,409.00 $224,138.00

Prepared by The Littlejohn Group - 704-377-2262 – www.thelittlejohngroup.com
10

Prepared by The Littlejohn Group - 704-377-2262 – www.thelittlejohngroup.com
11
Steel Garden is an infill community located in NoDa includes
condominium, town house and single family product. The second
phase is in the end of construction stage that includes additional
town house product. Homes featured unique plans including roof top
terraces. The project is built by Bonterra Builders and has performed
well, even throughout the market downturn. The mix of product was
well received and well designed to appeal to the market at well
targeted price points below $225,000. Most of the condominiums
were priced under $200,000 and represented a lower priced
alternative to competitors in the market at the time.
The condominium plans ranged from 609 to 1184 square feet. Only a
limited number of plans included usable outdoor space, but this was
not a barrier to sales. Finishes were similar to the market with hardwood floors in living areas, ceramic tiles in
baths, granite counters and 42” maple cabinets in kitchens. The finishes and appearance of the project did not
seek to skew too modern which likely enhanced the marketability of the project. There are limited amenities at
Steel Garden including some open spaces and landscaping.
Royal Truss is an adaptive reuse of an old warehouse space adjacent
to Steel Gardens. The unique loft style units did not sell quickly.
Recent sales of units at Royal Truss have been at an average of
$157,000, a significant discount from the initial offering price of
$227,000. The units are unique with loft style spaces; roll up doors and
a unique steel truss roof. Finishes included concrete floors, stainless
appliances, granite counters and a modern Aya cabinet system.
Issues with the marketability of Royal Truss included timing (the
project was ready to close as the housing market slowed. The project
lacked visibility and is difficult to find. Additionally, the unique loft
style units appealed to a limited market segment unlike the broadly
appealing offering at Steel Gardens.

Prepared by The Littlejohn Group - 704-377-2262 – www.thelittlejohngroup.com
12
Renaissance is a wood frame condominium and town house
community built by Gateway Homes. Gateway Homes specialized in
building inexpensive housing and unfortunately, their product has not
aged well and there are many complaints about the quality. An
extensive renovation project has been completed by the HOA. The
homes were built with fairly low specification levels that are reflected
in the pricing. The low prices seen on recent resales in the community
are more a reflection of the lack of quality of the homes versus the
location.
28th Ro was a well-received project that fell victim to poor timing. The
community is located outside of the central NoDa area, near the
Amelie’s bakery. The condominiums were initially priced at $211 per
square foot, and had strong presales. When the economic downturn
hit, buyers did not close and the project was sold to an investor who
quickly sold the units at the beginning of 2011 at pricing averaging
$141 per square foot. Buyers embraced the reduced pricing and 33
units were closed in 3 months.
The building is well designed with large terraces for all units and
interior finishes such as granite counters, hardwood floors, 12’ ceilings and 42” cabinetry. Community amenities
include rooftop terraces, a dog walk area and fire pits. The project is surface parked.
Galleries NoDa The newest for-sale condominium project in the
NoDa neighborhood was launched in December and will feature
one- and two-bedroom units priced from $179,000 to $325,000
and will range in size from 675 square feet to 1,325 square feet.
Construction is expected to start in mid-2015. This project will
include 1,100 square feet of retail space on the ground floor at the
intersection of North Davidson and Anderson streets.

Prepared by The Littlejohn Group - 704-377-2262 – www.thelittlejohngroup.com
13
Area Mixed Income Communities Seigle Point Just outside of uptown Charlotte, the Piedmont Courts public housing project was torn down. A mixed income project including market rate for sale housing, affordable for sale housing and affordable rental is planned for the site. The first phase of the redevelopment will be the Townhomes at Seigle Point by Grubb Properties. This project features 50 units, 20 of which were offered to buyers seeking affordable housing. Sales at the project were very strong, with most of the market rate units going to contract by the second day of sales. Sales ended up averaging $175 per square foot, $210,000 for the 1100 square foot units. The success of the project was driven by convenient location, the area’s long term improvement plan, an increased acceptance of buyers to live in locations with diverse income levels and the well-designed floor plans that offered amenities such as garages, 3 bedroom, 3 bath options and open living spaces. At this time, resales are not yet available.
Target Buyer- Young Singles and Childless Couples, for affordable units, single mothers with children
Key Features- One Car Garage, third bedroom with full bath, location, competitive price
Sales Pace – Sold out Market Rate units in two days
Sycamore Green Sycamore Green is in Charlotte’s Third Ward neighborhood. Featuring 22 town homes, the project shares a site with 190 rental apartments and creates a mixed use community close to the city. Sycamore Green’s town homes were launched in May of 2002 and by September 2003 had sold out. Initial price points for the units ranged from $164,900 for 1155 square feet to $219,900 for 1385 square feet. Today, resales range from $284,900 to $300,000 in the community. The units offered attractive exteriors, two car garages and large decks and patios.
Target Buyer- 50% single age 20-30, 50% two income couples
Key Features- Garages, location, competitive price
Sales Pace – 1.5 units per month

Prepared by The Littlejohn Group - 704-377-2262 – www.thelittlejohngroup.com
14
Charlotte Housing Market 2015
The market for new construction housing in the intown Charlotte market remains strong, but very limited due to
a lack of product in the market place. Multiple sites are in planning stages, but new product in any significant
quantity has yet to come to market. However, the price points being achieved in infill locations. While home
closings and average home prices have generally increased, rental product has dominated the market in the last
five years.
Infill construction continues to occur in all intown neighborhoods with one or two home projects by custom
builders. Pricing is based according to neighborhood. Most intown neighborhoods have one or two homes on the
market that are under construction. The inventory of these homes is fairly limited and the lot supply for builders
is also limited with heavy competition for available lots.
Housing Supply The following chart and graphic compares the number of annual housing permits by type, compared to
employment and population growth. The chart shows clearly the drop off in building permits from 2008 to 2012
which fell to 15 year lows.
Column1 2005 2006 2007 2008 2009 2010 2011 2012 2013 2014
Single Family Permits 8,473 9,287 6,857 2,496 1,315 1,869 1,949 3,200 4,554 3413
Multi Family Permits 2,265 4,213 4,430 4,281 1,607 555 986 4,660 3,863 11698 Other (Duplexes, Triplexes) 90 176 130 73 32 248 159 152 141 79
Total 10,828 13,676 11,417 6,850 2,954 2,672 3,094 8,012 8,558 15,191
Condominiums 86 1,815 1,414 1,020 498 62 88 185 72 23
For Rent 2,179 2,398 3,016 3,261 1,109 493 898 4,475 3,791 11,698
% Multifamily 21% 31% 39% 62% 54% 21% 32% 58% 45% 77%
% Single Family 20% 18% 26% 48% 38% 18% 29% 56% 44% 5%
% Condominium 1% 13% 12% 15% 17% 2% 3% 2% 1% 1%
% Rental 20% 18% 26% 48% 38% 18% 29% 56% 44% 5%
Employment 408619 428021 434383 439235 416319 422062 432165 448863 582,402 608345
Employment Growth
19402 6362 4852 -22916 5743 10103 16698 133,539 25,943
Population 791473 815218 842674 869954 893892 919628 945378 971848 990,977 1 Mil. +
Population Growth
23745 27456 27280 23938 25736 25750 26470 19,129 76,936
New Households
9498 10982 10912 9575.2 10294 10300 10588 7651.6 NA Permits to Employment
0.7 1.79 1.41 -0.13 0.47 0.31 0.48 0.06 0.5856
Permits: New Households 1.44 1.04 0.63 0.31 0.26 0.3 0.76 1.12

Prepared by The Littlejohn Group - 704-377-2262 – www.thelittlejohngroup.com
15
Notably, while this fall off in housing construction occurred, employment also dropped, however, the number of
households moving into the county stayed stable. This lag in construction has allowed rental complexes to lease
up, and unsold home inventory to be absorbed. However, the county is now faced with a housing shortfall.
Builders are gearing up to meet the demand, particularly on the rental side. By all accounts and estimates,
Mecklenburg County will continue to experience a high level of growth over the next ten years.
• One tempering factor to the recovery is that home pricing and rent increases will be somewhat contained
by stagnant wage growth and changes in lending.
• There are currently 11,000 planned and proposed rental units in Mecklenburg County. This is a large
number considering the 15 year average of 2500 new rental units per year. However, from 2009-2011,
less than 2500 units made it to market. We would anticipate a three to four year timeline to see all of the
planned and proposed units completed and delivered and would additionally anticipate some
cancellations and conversions. The influx of new units will likely place downward pressure on rents in
some areas now seeing unjustified premium rental rates. We do not expect to see this downward
pressure in the NoDa market.
• The for-sale market is facing shortages in key areas and price points. Builders are struggling to find lots in
locations close to Center City, South Charlotte and in the northern towns of Cornelius, Huntersville and
Davidson. Concurrently, builders have had to raise home prices to accommodate lot price and materials
increases.
• In summary, the market for housing in Mecklenburg County is underserved, but product needs to be
correctly positioned and located to succeed.
-25,000-22,500-20,000-17,500-15,000-12,500-10,000
-7,500-5,000-2,500
02,5005,0007,500
10,00012,50015,00017,50020,00022,50025,00027,50030,000
Permits by Type, Mecklenburg County 1997-2014
Other (Duplexes,Triplexes)
For Rent
Condominiums
Single FamilyPermits
EmploymentGrowth
New Households

Prepared by The Littlejohn Group - 704-377-2262 – www.thelittlejohngroup.com
16
Single-Family Permits
Date Number of Dwelling Units Average Value per Dwelling Unit Units Percent Change Value ($) Percent Change
1999 19,677 - $111,100 -
2000 18,172 -7.6 $127,000 14.3
2001 18,647 2.6 $127,600 0.5
2002 19,199 3 $130,500 2.3
2003 19,052 -0.8 $138,400 6.1
2004 21,311 11.9 $148,000 6.9
2005 23,094 8.4 $152,000 2.7
2006 23,992 3.9 $169,900 11.8
2007 20,520 -14.5 $183,100 7.8
2008 10,016 -51.2 $187,300 2.3
2009 5,480 -45.3 $196,200 4.8
2010 5,154 -5.9 $194,400 -0.9
2011 5,570 8.1 $199,600 2.7
2012 7,586 36.2 $203,500 2
2013 11,074 46 $223,700 9.9
2014 11,306 $232,200
Total/Av. 228,544 -0.37 $166,153 5.23
Multifamily Units Built
Date Number of Dwelling Units Average Value per Dwelling Unit Units Percent Change Value ($) Percent Change
1999 6,858 - $44,800 -
2000 7,647 11.5 $49,100 9.6
2001 5,548 -27.4 $59,100 20.4
2002 3,501 -36.9 $56,100 -5.1
2003 3,194 -8.8 $63,300 12.8
2004 4,105 28.5 $62,600 -1.1
2005 3,288 -19.9 $74,000 18.2
2006 5,111 55.4 $88,900 20.1
2007 5,635 10.3 $95,700 7.6
2008 4,779 -15.2 $92,000 -3.9
2009 2,593 -45.7 $79,000 -14.1
2010 698 -73.1 $76,800 -2.8
2011 1,362 95.1 $88,000 14.6
2012 5,409 297.1 $79,000 -10.2
2013 5,570 3 $77,700 -1.6
2014 7,100 $84,000
Total/Av. 65,298 19.56 $72,407 4.61

Prepared by The Littlejohn Group - 704-377-2262 – www.thelittlejohngroup.com
17
Central Submarket Housing Market
Charlotte’s Central submarket consists of two main areas, the Center City (inside I-277), and the area located just
outside I-277 consisting of neighborhoods like NoDa, Cherry, Dilworth and South End. The Central submarket is
one of Charlotte’s strongest markets for both attached and detached product and the strongest market for
product priced over $300,000.The downtown area is the main employment center in the region but for many
years was not a major residential location. A variety of buyer profiles can be found in this market, depending on
the project. Young professionals, empty nesters and second home buyers all find the area appealing.
Demand for housing product in Charlotte’s Central submarket continues to outpace supply and buyers continue
to be faced with a lack of product. This has bolstered the rental market as in many cases buyers are electing to
rent rather than purchase a home in an alternate location.
Townhome development in the central submarket has been robust after a stagnant couple of years regionally we
are beginning to see a number of smaller infill townhome products come on-line in addition to larger master-
townhome communities like Bryant Park and CityPark by Ryan Homes. We predict strong townhome sales as new
projects and pads are being developed region-wide. Pent-up demand for townhome product has already begun
to show. The Central submarket has seen an uptick in new townhome projects with several launching in the next
6 months from national homebuilders in the Dilworth and Myers Park neighborhoods. We predict the demand
for townhome product to grow as new Charlotteans settle in the city and phase from renting to buying. Due to
the high demand, the resale townhome market has stayed strong and pricing remains stable despite the inferior
and aging product.
Product varies greatly and is driven by the values and character of the surrounding neighborhoods. Product
ranges from condominiums in the low $100’s located in East Charlotte on the fringe of Plaza Midwood to million
dollar custom homes and smaller-infill condominium and townhouse projects in Myers Park. Recently
condominiums and townhouse product has been very limited. Single family infill projects can also be found in
most neighborhoods. The markets vary per neighborhood. Some, like Dilworth, are very strong with a lot of buyer
interest, while others like NoDa have been slower. Matching the right product with the right location and price
point is critical to the success of projects in these areas and most struggling projects are either priced too high for
the area or very poorly designed.
Town house projects often struggle in the Central submarket. Projects such as Laurel Ridge and The Grove
struggle to sell product. Much of the problem lies with product design with layouts that don’t work for buyers.
Ordermore 8 and Steel Gardens have fared better. Ordermore 8 offers a desirable location and Steel Gardens
offers a high quality product at a low price point for the area.
There are many projects planned for the Central submarket, with activity planned in all areas. Notable is the push
to develop projects to the west of Center City driven by land costs, access and the redevelopment of Wilkinson
Boulevard. Other key areas include the South End, where the most projects are planned and NoDa where a new

Prepared by The Littlejohn Group - 704-377-2262 – www.thelittlejohngroup.com
18
round of development is set to occur in anticipation of light rail. Buyers continue to embrace the urban
environment of the Central neighborhoods and continue to be willing to pay a premium for the lifestyle the area
offers.
Closings Data-Attached Product The following series of charts looks at closings in Mecklenburg County’s Central submarket for new construction
attached product. A map of the submarkets is included in this report. The charts include the last four years.
The first chart compares closing volume and price trends for attached (condominium and town house product) in
the Central submarket while the second represents closings in Mecklenburg County. The last 12 months has seen
a decrease volume in both the Central submarket and the county. Overall, new attached closings in the central
submarket are down 15.94% % over the last four years but saw on increase of 5.61% from 2013-2014. There has
also been a 9.59% decrease in attached product closings in the County over the last four years and a
6.63%decrease from 2013-2014. Resale closings have increased 30.10%% in the county although the county
experienced a 4.41% decrease in resale closings from 2013-2014, mainly due to lack of product. The Central
submarket has seen a 36.20% increase in resale closings the last four years but has similarly experienced a 6.01%
decrease in closings from 2013-2014. The price point for attached product continues to increase for both
markets; a trend that is expected to continue as construction costs increase and buyers continue to demand
more premium product.
On average, the central submarket has accounted for 23.75% of new attached product sales in Mecklenburg
County and 31.35% of County resales.
2011 2012 2013 2014
New Homes Av. Price $293,129.00 $253,210.00 $307,860.00 $295,460.00
Resales Av. Price $226,898.00 $249,532.00 $237,120.00 $247,304.00
New Homes Homes Sold 214 198 107 113
Resales Homes Sold 343 523 848 797
0100200300400500600700800900
$0.00
$50,000.00
$100,000.00
$150,000.00
$200,000.00
$250,000.00
$300,000.00
$350,000.00
Central Submarket Attached Sales

Prepared by The Littlejohn Group - 704-377-2262 – www.thelittlejohngroup.com
19
Closing Data-Single Family Detached Single Family performance in the central submarket represent the lowest share of all new home closings in the
county, this is mainly due to lack of land and higher price points for new development.
We foresee pricing reaming relatively stable as consumer seeks options in new and resale product with the
majority under $350,000 County-wide. Although construction costs are putting the pressure on pricing, many are
turning toward small or attached product within this price range. The greatest demand is for product under
$300,000.
New and resale single homes intown are fairly limited, with the majority priced over $300,000 in areas like
Dilworth, Midwood and Elizabeth. There are very few options priced below that in the better established
communities. The other alternative includes homes in the more distressed areas, and these are generally in need
of renovation and priced well below $100,000. However, the neighborhoods often have reputations for crime
and there is uncertainty about purchasing homes and future values. This leaves a hole in the market for buyers
who are not speculative or interested in renovation, yet can’t afford a pricier home.
Opportunities for homebuyers in the in-town market for new construction product are very limited at this time.
Only 5% of new home sales in Mecklenburg County occurred in the in-town market in 2014. This was mainly
driven by a lack of product. Recently we have begun to see tear-down and gentrification trends in Cherry, Plaza
Midwood and Wesley Heights emerging as popular options for buyers. Of note are the communities of Bryant
Park by Ryan Homes, Saussy Burbank’s development in the Cherry Neighborhood and Grandfather Homes’
Josephine Court in Plaza Midwood. New single family product sales in and around Dilworth and Scaleybark areas
has been robust and generally the homes are being built on lots where homes are torn down. Of note are the 20
plus homes under construction by Saussy Burbank in this area with pricing that ranges from the mid $400’s to the
$800’s.
Note that foreclosures have been an issue market-wide in Mecklenburg County post compression. This is
expected to be an ongoing issue in the market, as well as a supply of lower priced housing for buyers.
Foreclosures tend to compete more with resales but many buyers and agents are discouraged by the process of
obtaining these homes, making them more appealing to investors.

Prepared by The Littlejohn Group - 704-377-2262 – www.thelittlejohngroup.com
20
The first chart compares closing volume and price trends for single family detached product in the Central
submarket while the second represents single family detached closings in Mecklenburg County. The last 12
months has seen an increase in volume in both the Central submarket and the county. Overall, new attached
closings in the central submarket are up 37.29% over the last four years and saw on increase of 9.22% from 2013-
2014. There has also been a 17.27% decrease in detached product closings in the County over the last four years
and a 1.19%decrease from 2013-2014. Resale closings have increased 23.27% in the county from 2011-2014
although the county experienced a .93% decrease in resale closings from 2013-2014. The Central submarket has
seen a28.58% increase in resale closings the last four years but has similarly experienced a 3.35% decrease in
closings from 2013-2014. The price point for detached product continues to increase for both markets; a trend
that is expected to continue as construction costs increase and buyers continue to demand more premium
product.
On average, the central submarket has accounted for less than 1% of new detached product sales in Mecklenburg
County and 6.29% of County resales.
2011 2012 2013 2014
Mecklenburg County CompositeNew Homes Av. Price
$226,601.00 $243,351.00 $253,516.00 $267,820.00
Mecklenburg County CompositeResales Av. Price
$261,146.00 $273,975.00 $280,819.00 $286,895.00
Mecklenburg County CompositeNew Homes Homes Sold
1736 2087 2771 2738
Mecklenburg County CompositeResales Homes Sold
6310 7799 11475 11368
0
2000
4000
6000
8000
10000
12000
14000
$0.00
$50,000.00
$100,000.00
$150,000.00
$200,000.00
$250,000.00
$300,000.00
$350,000.00
Mecklenburg County Composite Single Family Detatched Sales 2011-2014

Prepared by The Littlejohn Group - 704-377-2262 – www.thelittlejohngroup.com
21
2011 2012 2013 2014
Central New Homes Av. Price $295,651.00 $264,025.00 $330,514.00 $358,773.00
Central Resales Av. Price $349,100.00 $378,643.00 $375,157.00 $394,094.00
Central New Homes Homes Sold 63 81 141 154
Central Resales Homes Sold 783 995 1612 1558
020040060080010001200140016001800
$0.00$50,000.00
$100,000.00$150,000.00$200,000.00$250,000.00$300,000.00$350,000.00$400,000.00$450,000.00
Single Family Detached Sales -Central Submarket 2011-2014

Prepared by The Littlejohn Group - 704-377-2262 – www.thelittlejohngroup.com
22
Greater Charlotte Region Rental Market Conditions The rental market is performing very well at this time in the Charlotte region. Vacancy rates are down in all areas,
with slowly increasing rent. Vacancy rates are the lowest they have been in 10 years, while at the same time;
rents have reached a historic high, market wide. Growth in demand is at 3.1%, while the supply is only growing
at 1.6%. In short, this is a good time to own rental product. The greater Charlotte region is shown in the map
below and includes Mecklenburg, Gaston, York, Iredell, Union and Cabarrus Counties.
Charlotte’s rental market is currently very robust with low vacancy rates and consistent rent growth market wide.
New product is being readily absorbed with some properties leasing up in under 12 months. However, with
10,429 units under construction market wide and another 9,402 proposed there could be some downward
pressure on rents. Additionally, the housing market is recovering and growing rents could push more affluent
renters into homeownership.
The majority of rental housing in the Charlotte market is found in the city’s numerous market rate apartment
complexes. These complexes are open to tenants of all ages, and offer a variety of unit types and amenities.
At this time, the Charlotte market is undergoing acceleration in the development of rental apartments.
Developers are actively seeking sites in certain corridors. While the East submarket portion of the county has a
large number of multifamily units, many are outdated and/or below market.
Area Existing % of
Market Under
Construction % of Under
Construction Proposed
% of Proposed
Units Northeast 18,237 20% 729 8% 859 12% East 23,171 25% 1335 14% 1502 21% North 6,964 8% 988 11% 1,144 16% Northwest 3,487 4% 314 3% 748 10% Southeast 22,750 25% 4,270 46% 1,963 27% Southwest 13,919 15% 273 3% 138 2% Downtown 2,458 3% 1464 16% 842 12% Mecklenburg Total 90,986 - 9,373 - 7,196 - Cabarrus 4740 - 412 - 344 - Gaston 3041 - 278 - 292 - Iredell 4725 - 232 - 540 - Union 1197 - 0 - 0 - York 7854 - 144 - 1030 - Total (all) 112,543 - 10,439 - 9,402 -
The project study area is located in the east submarket for multifamily development in Charlotte. This submarket
accounts for 25% of the Mecklenburg county submarket although 82% are what we consider “aged out” that is
apartments over 16 years of age. The East submarket accounts for 30% of all of the “aged out” communities in
Mecklenburg County.

Prepared by The Littlejohn Group - 704-377-2262 – www.thelittlejohngroup.com
23
Overall Market East 1
Units 111683 8623
Vacancy 5% 6%
Avg. Rent $919.00 $770.87
Avg. Rent/SF $0.96 $0.87
Avg. SF 958 882
Absorption 3879 317
Supply Change 3299 197
Units U/C 10429 1335
The improvement in the market crosses all ages of rental product including more dated communities. As
expected, the average rent at a new community is higher at $1.09 per square foot versus $.71 per square foot at
communities 30 years and over in age. In terms of vacancy rates, newer product has better vacancy rates at 3.8%
for both product 1 to 5 years in age and product 6-15 years age. Older communities are still seeing good
vacancies at 7.7% for communities over 30 years of age.
The Charlotte market is defined as Mecklenburg County and divided into 14 submarkets. Submarket boundaries
for both residential and commercial statistics as discussed in this report are generally determined by area roads
and municipal boundaries. The Chamber of Commerce submarket map follows.
0
1000
2000
3000
4000
5000
Au
g-1
0
Oct
-10
De
c-1
0
Feb
-11
Ap
r-1
1
Jun
-11
Au
g-1
1
Oct
-11
De
c-1
1
Feb
-12
Ap
r-1
2
Jun
-12
Au
g-1
2
Oct
-12
De
c-1
2
Feb
-13
Ap
r-1
3
Jun
-13
Au
g-1
3
Oct
-13
De
c-1
3
Feb
-14
Ap
r-1
4
Jun
-14
Au
g-1
4
Un
its
Aug-10 Feb-11 Aug-11 Feb-12 Aug-12 Feb-13 Aug-13 Feb-14 Aug-14
Absorption 4416 2659 2261 729 2490 401 3157 269 3879
Change in supply 1800 558 435 104 1608 1060 2172 1420 3299
East 1 Absorption versus Supply

Prepared by The Littlejohn Group - 704-377-2262 – www.thelittlejohngroup.com
24
Below is a chart of some rental market indicators, in a variety of geographies with maps shown in chart one.
Overall, for all geographies surveyed, vacancy rates are very low. In all, in the past 6 months, the market has
absorbed close to 2500 apartments. The overall East 1 submarket is performing below the overall market;
however the East 1 submarket includes some extremely date communities in undesirable locations. When the
Prepared by The Littlejohn Group - 704-377-2262 – www.thelittlejohngroup.com
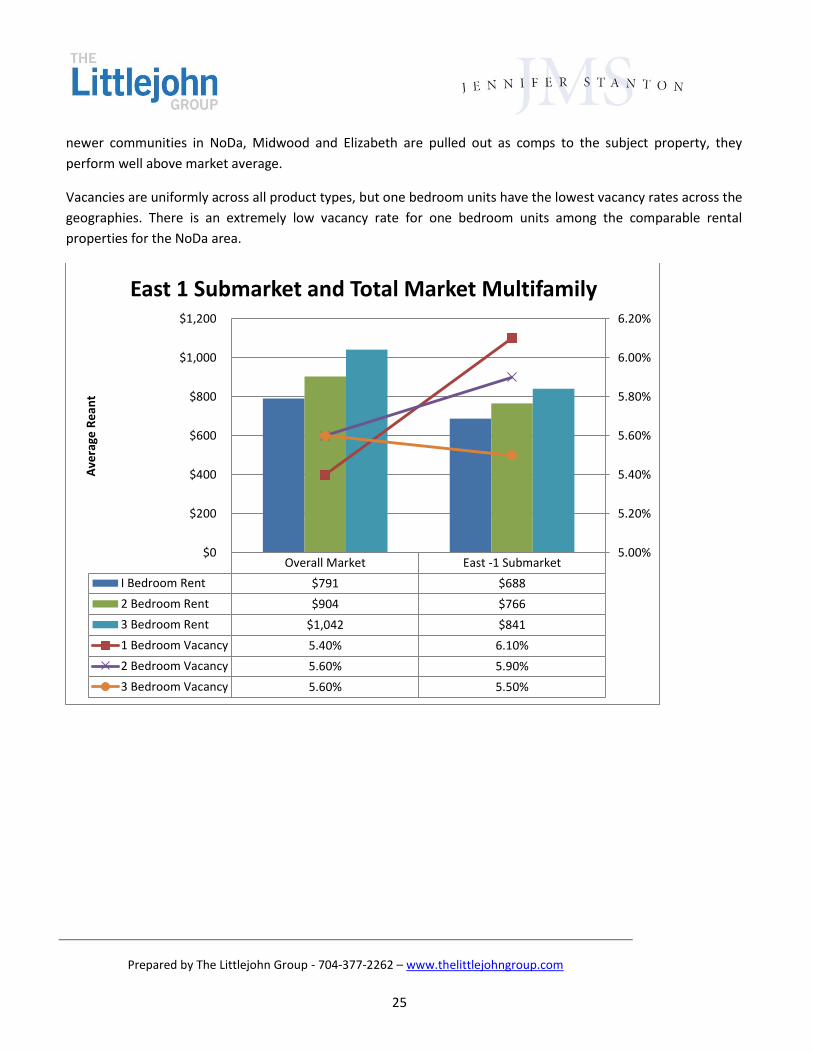
25
newer communities in NoDa, Midwood and Elizabeth are pulled out as comps to the subject property, they
perform well above market average.
Vacancies are uniformly across all product types, but one bedroom units have the lowest vacancy rates across the
geographies. There is an extremely low vacancy rate for one bedroom units among the comparable rental
properties for the NoDa area.
Overall Market East -1 Submarket
I Bedroom Rent $791 $688
2 Bedroom Rent $904 $766
3 Bedroom Rent $1,042 $841
1 Bedroom Vacancy 5.40% 6.10%
2 Bedroom Vacancy 5.60% 5.90%
3 Bedroom Vacancy 5.60% 5.50%
5.00%
5.20%
5.40%
5.60%
5.80%
6.00%
6.20%
$0
$200
$400
$600
$800
$1,000
$1,200
Ave
rage
Re
ant
East 1 Submarket and Total Market Multifamily

Prepared by The Littlejohn Group - 704-377-2262 – www.thelittlejohngroup.com
26
There are a limited number of rental complexes in the NoDa neighborhood. Alpha Mill, Elizabeth Square and
Metro 808 are all located outside of the NoDa community but represent Class A properties in similar areas. The
two main currently active options include Fat City and Highland Mill. A number of smaller buildings are also in the
market place including the Arden and the Davy which offer fewer than 20 apartments each. At this time, projects
are well leased. None of them are equal in quality to Class A apartments in terms of quality and amenities, and
they garner in lower rents than new Class A projects in similar areas.
Fat City Lofts was originally envisioned as a for sale project. With
sales prices above $250 per square foot, the units were never
able to close despite strong presales interest. The 26 units have
leased well, at $1.20 per square foot, and a lease up in under 6
months. There are no community amenities like a pool or club
room. The building is to a higher specification than standard
wood frame rental units and is in the heart of NoDa. Parking is
problematic for the building with a limited number of spaces.
Additionally, there have been issues with keeping the ground
floor retail space leased up. At this time, Fat City Lofts is
converting to for sale condominiums.
Highland Mill is a renovated mill close to the heart of NoDa. The
units have high ceilings and a unique, spare “loft” feel to them.
The spaces are very open with ample natural light. Although they
are attractive homes, they have a very spare feel to them that
may lack appeal for all renters. The product is a good match for
the NoDa area, but lacks the comfort and luxury of some of the
newer Class A offerings. Amenities include a pool, fitness center
and a dog park area. Currently the average rental rate for leased
units is only $.95 per square foot, but advertised are running $.95
per square foot to $1.40 per square foot.

Prepared by The Littlejohn Group - 704-377-2262 – www.thelittlejohngroup.com
27
The Davy and the Arden have enjoyed low vacancy rates and
offer a more intimate community for renters. The two infill
buildings fit the fabric of the neighborhood well and achieve
above market rents with limited availability. Amenities are limited
but include a vegetable garden at the Arden, grilling areas, high
speed internet and security. Currently, two units are available for
rent, a 970 sf 2 bedroom for $1495 ($1.54 per square foot), and
an 875 square foot unit for $1160 ($1.32 per square foot).
Yards at NoDa Gvest partners plans to build eight four-story
buildings and surface parking at the site, which totals just over 10
acres and sits on the west side of North Brevard Street, between
the Matheson Avenue bridge and East 36th Street. Gateway
Homes rezoned the property in 2007, and a company controlled
by Gateway's Doug Levin sold the land to an affiliate of Gvest early
in 2012 for $4 million.
The project will feature studio, one, two and three-bedroom
apartment units. Two of the buildings will be townhome rentals.
Amenities will include a resort-style pool, fitness center, and
clubhouse and dog park. To-date, the first 182 unit phase has been
completed.
Mercury NoDa The project is a mixed use project containing retail,
a green grocer, art lofts, 234 rental units, and both cast in place
and precast parking structures. The architecture is cued by a mix
of traditional retail forms in this central business district,
neighboring warehouse buildings, and an infusion of bold colors
and massing inspired by the local arts scene. The final product will
include art installations from community artist

Prepared by The Littlejohn Group - 704-377-2262 – www.thelittlejohngroup.com
28
The Lofts at NoDa Mills-Mecklenburg Mill
The Lofts at NoDa Mills are an attempt by The Community
Builders to rehabilitate a former historic mill to rental housing
similar to its predecessors in the neighborhood, the Alpha Mill
and Highland Mill. In phase I, the Mecklenburg Mill will be turned
into 48 individual units of affordable housing. The apartments will
range in size from 428 square feet for the smallest studio; to
1,216 square feet for the larger two bedroom units. The
developer has needed the assistance from the city for funds from
the Community Development Block Grant Program to complete the project. Rents will start around $500 for
studios and go up to approximately $775 for two bedrooms.

Prepared by The Littlejohn Group - 704-377-2262 – www.thelittlejohngroup.com
29
Commercial Market Review
Executive Summary
This study concurs with the preliminary market presentations and the residential market analysis that the rail
alignment will have a significant impact on the economic development potential of commercial uses in the NoDa
study area. The greatest impetus for the impact is the increase in density of potential customers as a result of
the improved access and convenience of rail. The alternative trajectories of the alignment do not change the
impact of the potential as long as the route does not impede and is within walking, bus and bike distance of the
existing commercial attractions.
The greatest contribution to the current commercial vitality of NoDa has been the influx and establishment of
three award winning breweries all on North Davidson St (NoDa, Heist and Birdsong). These facilities revitalized
the entertainment scene as the loss of art galleries that were an integral part of the backbone art crawl tradition
(Center of the Earth, Lark & Key). NODA continues to be a mecca for entrepreneurial specialty restaurants and
shops, while also successfully retaining locally owned unique concepts such as Evening Muse, Smelly Cat and
Cabo Fish Taco for over a decade.
The greatest opportunity for insuring the continued prosperity of the commercial market is for the rail alignment
to enable the least distance and greatest access to commercial frontage on North Davidson and 36th Streets, the
equivalent of “Main & Broadway”. Because of the nature of the commercial product in the area, frontage on
the established streets is critical for its success. Connectivity to stations, including sidewalks, bike baths, and bus
routes will be enhanced by the improvements and elimination of the rail crossing intersections.
There is no large grocery, drug store or big box user in the study area although due diligence for these uses has
repeatedly been done. Proximity to greater parking, commuter flow and higher income residents on Central
Avenue at Pecan has insured the dominant market share of Harris Teeter at that location among NoDa residents.
Likewise, until the immediate trade area has a critical mass of residents with no overlap to this adjacent
commercial area, the NoDa commercial district will retain its identity as a pedestrian friendly entertainment and
arts district.
Given the momentum of the residential demand and the increased density expected to result from the proximity
of the light rail station, it is likely that the neighborhood will attract additional grocery anchored commercial
development. The demographics indicate that the area is already at the point where smaller footprint amenities
could be supported with adequate parking. The critical recommendation is to encourage further commercial
development where it is compatible with the existing organic streetscape and accessible to the greater inflow
demand the alignment and the light rail station will generate.

Prepared by The Littlejohn Group - 704-377-2262 – www.thelittlejohngroup.com
30
Population growth, inflow traffic and income growth attract retail interest and commercial development. The
study area is poised for increased growth and density because of the TOD development potential and current
momentum. Household income levels are diverse and rising. Though there is no current density of high income
residents, income levels will likely close the gap to match the City’s median by 2020 if high amenity for sale
residential development succeeds.
Demographic Overview Population Density
The estimated population within the immediate study area is 4,103, with an overall growth rate in the
neighborhood at approximately 1.3% annually. The following demographic maps illustrates that the population
growth in the Census tracts surrounding the commercial on North Davidson Street between Matheson and Herrin
Avenues are the fastest growing in the vicinity. This area southwest of the 36th station is growing at a rate
between 6% and 7% annually. The other areas in the immediate study are also growing at or above 5% annually.

Prepared by The Littlejohn Group - 704-377-2262 – www.thelittlejohngroup.com
31

Prepared by The Littlejohn Group - 704-377-2262 – www.thelittlejohngroup.com
32
Income
The following maps show the median household income, the five year projected household
income and the percent change in the median household income by Census tract. Again the
beneficial impact of proximity to the walkable retail amenities on North Davidson and 36 Streets
is apparent in the higher income and income growth projected on the southeast side of the rail.
It is important to note that the rail is the dividing line between demographic growth and income
trends, not North Tryon Street. This further supports the expectation that improvements to the
rail crossings and the rail stations will impact economic development in the area by extending
the relative prosperity of NoDa to adjacent Census tracts and neighborhoods.
The average household income in the study area is $51,121 and the median is $43,349. This is
overall lower than the City of Charlotte, which has a 2014 median income of $53,046. However,
the area has a greater concentration of renters and younger residents. The income distribution
in this area is extremely diverse, though less than 5% of residents earn $150,000 or greater, the
majority of residents earn greater than $35,000 annually, 52%. The area southwest of the rail
has a median household income between $45,000 and $60,000, while the area north, including
beyond North Tryon has a median household income of $30,000 or less.
By 2020, the area southwest of the Sugar Creek Light Rail Station is expected to reach projected
median income levels of $60,000 to $75,000. The entire study area is forecast to experience
income growth of 5% or more, with the greatest growth in residential income being in the area
southwest of the 36th Street and Sugar Creek Road Stations.

Prepared by The Littlejohn Group - 704-377-2262 – www.thelittlejohngroup.com
33

Prepared by The Littlejohn Group - 704-377-2262 – www.thelittlejohngroup.com
34

Prepared by The Littlejohn Group - 704-377-2262 – www.thelittlejohngroup.com
35

Prepared by The Littlejohn Group - 704-377-2262 – www.thelittlejohngroup.com
36
Lifestyle Characteristics The immediate neighborhood surrounding the study area has an equal percentage of white and African
American residents and smaller percentage of Hispanics, 16.2 percent. The median age is skewed
young, 31.9 years. There are more children younger than 5 years old, 7.3% of residents, than there are
over 65, 6.8%. A quarter of all residents are between 25 and 35 years old, 24.6%, and the
overwhelming majority of residents are single, 74.7%. This is the most dominant age bracket for
commercial demand.
Commercial Market Conditions The study area is included within the northeast submarket of the greater Charlotte market that includes
the University area, but borders the Center City at I-277, and the inner East submarket that includes
Central Avenue. Because as yet there are no large scale commercial developments in the study area,
this product has either been considered as part of a larger mixed use residential development if it fronts
North Davidson or 36th Streets, or it has been entrepreneurial retrofit of existing buildings by specialty
restaurants, retailers or entertainment and alcohol driven businesses such as the breweries and bars.
Overall, conditions for economic development are promising because of the longevity of the existing
regional and local retailers and increasing interest among the hottest concepts to locate in the NoDa
area, especially in proximity to North Davidson and 36th Street accessible to the light rail line. The area
is known for its distinct restaurants, music venues and bars, but does not have a critical mass of retail.
The residential growth, in combination with the increased visitor inflow traffic resulting from better
access, will create an opportunity for anchored neighborhood retail, and possibly destination retail, such
as Amelie’s has become.
Charlotte’s rent, vacancy and absorption levels are healthy compared to the region and the US, though
the Northeast Submarket which includes the study area is challenged by the highest vacancy rate in the
market, 14.4%, because of the spike in vacancy in the University City area where seven big box anchors
relocated to new construction. There is no comparable product to what the study area has to offer in
the Northeast Submarket, although the adjacent East Submarket is highly competitive with NoDa.

Prepared by The Littlejohn Group - 704-377-2262 – www.thelittlejohngroup.com
37
Source: Reis Reports, 2015
There is very little turn over or vacancy in the study area other than properties in transition for
redevelopment. This suppresses rent in the short term, but rising rents in the Plaza Midwood area are
an indicator of the increasing value commercial space can command in the study area. A greater
indicator of the economic development potential in the study area is the pattern of development and
rent growth realized along South Boulevard as a result of the increased density and walkability created
by the light rail. The NoDa area starts with the advantage of an already established walkable community
with a strong sense of community and experienced operators in unique anchor establishments.

Prepared by The Littlejohn Group - 704-377-2262 – www.thelittlejohngroup.com
38
Source: Karnes Reports
Source: Reis Reports

Prepared by The Littlejohn Group - 704-377-2262 – www.thelittlejohngroup.com
39
There are no identified commercial developments planned within the study area. The greatest
development activity throughout the Charlotte market is the proliferation of apartments. Other than
ground floor specialty space as required by zoning, retail development is being anchored by Publix and
Walmart Neighborhood driven sites. These two retailers are among the grocery anchors who have and
will consider opportunities in the study area when the light rail project and additional residential is
complete.
Source: Reis Reports

Prepared by The Littlejohn Group - 704-377-2262 – www.thelittlejohngroup.com
40
Summary 1. What are the potential benefits to NoDa resulting from the rail relocation?
Both residential and commercial development opportunities are strengthened by improvements that
increase visibility, infrastructure and connectivity to the established commercial core at 36th and
Davidson Streets. Realignment potentially opens up larger tracts of land, which in turn may enable
greater density development and options for public parking to serve the greater commercial
entertainment district and transit. Removing at grade crossings eases noise and traffic congestion,
improving the desirability of residential and commercial development.
The relocation also allows for a clear, more efficient, development pattern to emerge. In the long term
the relocation creates greater inflow of visitors and residents if it increases the likelihood for multimodal
transportation aligned with commuter rail. The immediate benefit is improved conditions for high
density residential and greater frontage commercial emanating from the light rail stations.
Improved transportation infrastructure, critical mass of density and variety of residential development,
commercial development that complements and preserves the character and certainty of the timing and
details of plans will spur development between NoDa and the Plaza Midwood, between NoDa and
Center City and between NoDa and the University area.
2. Is there any reason the realignment could jeopardize economic development potential?
The only potential risk of the realignment is if the construction disrupts the established vehicular traffic
for so long as to damage the existing vitality of the neighborhood. There is no identified down side to
the realignment itself. Uncertainty of plans and timing can jeopardize economic development potential.
Development interest precedes actual construction of scheduled projects and announced improvements
can spur investment if the intended changes are anticipated to improve access to existing thriving
neighborhoods and commercial establishments. It is the team’s assessment that the proposed
realignment will realize potential benefits and increase the economic development potential of the
greater NoDa area.
3. Does the proposed land use sync with economic development potential?
The results of this study are consistent with the 2012 Noell Group Report’s recommended land use plan.
Flexibility and adaptability are recommended given the pace of development that could occur once the
light rail is complete. For example, although there is projected strong likelihood and demand for high
density housing, there is will also likely be an unmet demand for affordable for sale product as a

Prepared by The Littlejohn Group - 704-377-2262 – www.thelittlejohngroup.com
41
segment of the young single population transitions. The small format mill style homes consistent with
the character of the neighborhood are the traditional product the majority of home buyers are seeking.
In addition, although the industrial uses in the area are waning, the influx of breweries represent a
manufacturing potential that can coexist with both residential and retail. There may be uses that are
not anticipated, but for now the land use plan is in sync.
Given the absence of open space and the market demand for higher density near the rail stations and
existing successful residential and commercial development, the possibility of identifying linear space
for urban trails and connections to existing parks and greenway access points may be a step that
improves the economic development potential long term.