Embed Size (px)
Citation preview
AD-A258 433 . ..USACERL Technical Report FM-92/01
July 1992Design Concepts Using Advanced Materials
US Army Corpsof EngineersConstruction EngineeringResearch Laboratoi y N1DC
Evaluation of Test Methods To Determinethe Impact Resistance of ExteriorInsulation and Finish Systems (EIFS)
byRichard G. LampoJonathan C. Trovillion
The use of exterior insulation and finish systems (EIFS) on Armyfacilities has increased substantially over the past 10 years. Theimportance of impact resistance in maintaining system integrity toprevent moisture infiltration (a leading cause of system failure), isparamount. Army architect/engineers need to know the relativeimpact resistance of systems so they can specify the correct sys-tem for a given use at the lowest cost. Industry-wide standardimpact test methods are not available; values reported by EIFSmanufacturers cannot be compared throughout the industry.
The objective of this study was to evaluate test methods forimpact resistance currently being used in industry and determinetheir validity for use with EIFS on Army facilities.
Researchers tested 23 EIFS using the two most common labora-tory impact test methods and one field test method. Researcherscompared the test results with performance assumptions basedon the systems' chemical and physical properties to conclude thatthe falling ball test is the best of the methods evaluated forassessing the overall impact resistance of EIFS. --"The results of this research were used to develop a draft standard I(fIiIWIIi ll! IIlIIIlIIitest method that was presented to the American Society of Test-ing and Materials.
Approved for public release; distribution is unlimited. 92 12 22 019
The contents of this report are not to be used for advertising, publication, orpromotional purposes. Citation of trade names does not constitute an officialendorsement or approval of the use of such commercial products. Thefindings of this report are not to be construed as an official Department ofthe Army position, unless so designated by other authorized documents.
DESTROY THIS REPORT WHEN IT IS NO LONGER NEEDEDDO NOT RETURN IT TO THE ORIGINATOR
REPORT DOCUMENTATION PAGE Form ApprovedI OMB No. 0704-0188
Public reporting burden for this collection of information is estimated to average 1 hour per response, including the time for reviewing instructions. seardhing existing data sources.gathering and maintaining the data needed, and completing and reviewing the collection of information. Send comments regarding this burden estimate or any other aspect of thiscollection of information, including suggestions for reducing this burden, to Washington Headquarters Services, Directorate for infornmtion Operations and Reports, 1215 JeffersonDavis Highway. Suite 1204, Arlington, VA 2202-4302. and to the Office of Management and Budget. Paperwork Reduction Prooect (0704-0188). Washington, DC 20503.
1. AGENCY USE ONLY (Leave Blank) 2. REPORT DATE 3. REPORT TYPE AND DATES COVEREDI July 1992 Final
4. TITLE AND SUBTITLE 5. FUNDING NUMBERS
Evaluation of Test Methods To Determine the Impact Resistance of ExteriorInsulation and Finish Systems (EIFS) PE 4A16278
6. AUTHOR(S) PR AT41TA MA
Richard G. Lampo and Jonathan C. Trovillion WU CR1
7. PERFORMING ORGANIZATION NAME(S) AND ADDRESS(ES) 8. PERFORMING ORGANIZATION
REPORT NUMBER
U.S. Army Construction Engineering Research Laboratory (USACERL) T FM-92/01PO Box 9005Champaign, IL 61826-9005
9. SPONSORING/MONITORING AGENCY NAME(S) AND ADDRESS(ES) 10. SPONSORING/MONITORINGAGENCY REPORT NUMBER
Headquarters, U.S. Army Corps of EngineersATTN: CEMP-ES20 Massachusetts Avenue, NW.Washington, DC 20314-1000
11. SUPPLEMENTARY NOTES
Copies are available from the National Technical Information Service, 5285 Port Royal Road,Springfield, VA 22161
12a. DISTRIBUTIONIAVAILABILITY STATEMENT 12b. DISTRIBUTION CODE
Approved for public release; distribution is unlimited.
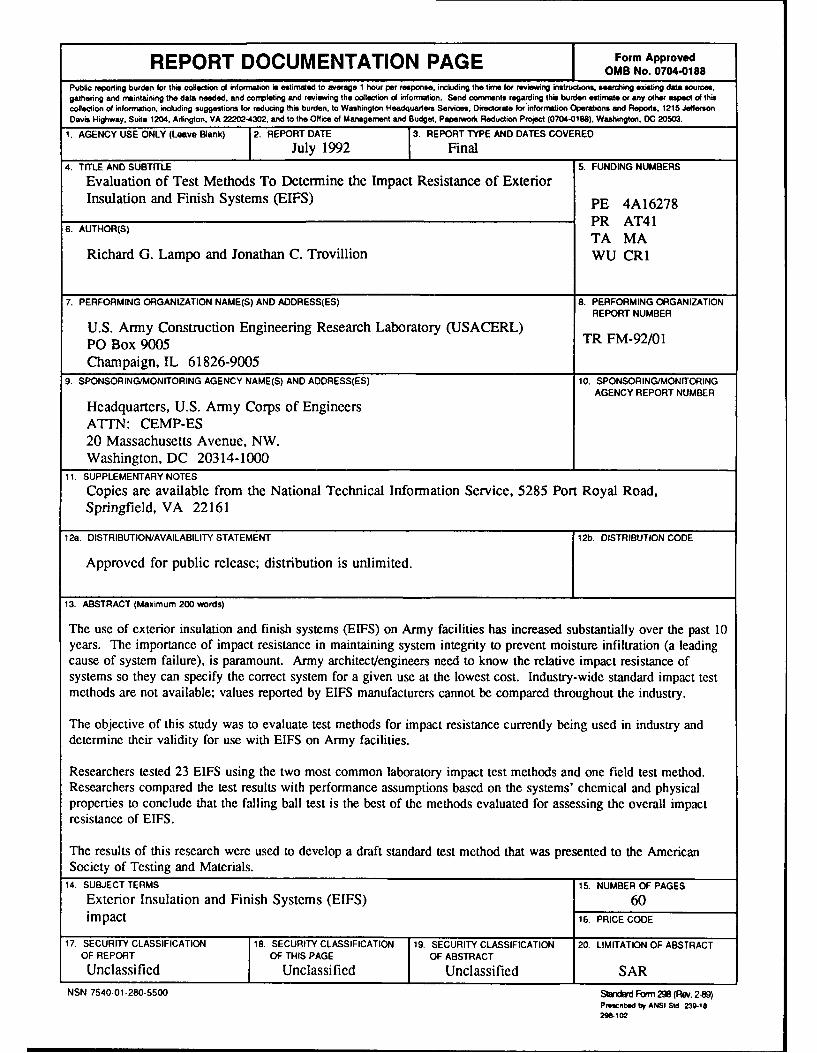
13. ABSTRACT (Maximum 200 words)
The use of exterior insulation and finish systems (EIFS) on Army facilities has increased substantially over the past 10years. The importance of impact resistance in maintaining system integrity to prevent moisture infiltration (a leadingcause of system failure), is paramount. Army architectlengineers need to know the relative impact resistance ofsystems so they can specify the correct system for a given use at the lowest cost. Industry-wide standard impact testmethods are not available; values reported by EIFS manufacturers cannot be compared throughout the industry.
The objective of this study was to evaluate test methods for impact resistance currently being used in industry anddetermine their validity for use with EIFS on Army facilities.
Researchers tested 23 EIFS using the two most common laboratory impact test methods and one field test method.Researchers compared the test results with performance assumptions based on the systems' chemical and physicalproperties to conclude that the falling ball test is the best of the methods evaluated for assessing the overall impactresistance of EIFS.
The results of this research were used to develop a draft standard test method that was presented to the AmericanSociety of Testing and Materials.
14. SUBJECT TERMS 15. NUMBER OF PAGES
Exterior Insulation and Finish Systems (EIFS) 60impact 16. PRICE CODE
17. SECURITY CLASSIFICATION 18. SECURITY CLASSIFICATION 19. SECURITY CLASSIFICATION 20. LIMITATION OF ABSTRACTOF REPORT OF THIS PAGE OF ABSTRACT
Unclassified Unclassified Unclassified SARNSN 7540-01-280-5500 SdM Form 298 (Rev. 2-89)
Preocnbd by ANSI Std 239-18
29a-102
FOREWORD
This work was performed for the Directorate of Military Programs, Headquarters, U.S. Army Corpsof Engineers (HQUSACE), under Project 4AlI2784AT41, "Military Facilities Engineering Technology";Task MA; Work Unit CR1, "Design Concepts Using Advanced Materials." The HQUSACE technicalmonitor was Rodger Seeman, CEMP-ES.
This work was completed by the Engineering and Materials Division (FM) of the InfrastructureLaboratory (FL) of the U.S. Army Construction Engineering Research Laboratories (USACERL). TheUSACERL principal investigator was Mr. Richard G. Lampo; Jonathan C. Trovillion was the associateinvestigator. Dr. Paul A. Howdyshell is Division Chief, CECER-FM and Dr. Michael J. O'Connor isLaboratory Chief, CECER-FL. Mr. Robert E. Muncy was the contractor to perform the falling ball andfalling weight tests. Mr. Mark F. Williams of Kenney, Williams and Williams was the contractor toperform the Perfotest. The USACERL technical editor was Gloria J. Wienke, Information ManagementOffice.
COL Daniel Waldo, Jr., is Commander and Director of USACERL and Dr. L.R. Shaffer is TechnicalDirector.
2
CONTENTS
PageSF298 1FOREWORD 2LIST OF TABLES AND FIGURES 4
INTRODUCTION ................................................... 7Background 7Objective 7Approach 7Mode of Technology Transfer 8
2 EIFS CHARACTERISTICS ............................................ 9Class PB Systems 9Class PM Systems 10System Assemblage 10System Advantages 10Considerations for System Use 11
3 TEST PROGRAM .................................................. 12Specimen Preparation 12Tests Performed 12Data Reduction 15Falling Weight Test 17Falling Ball Test 23European Perfotest 27
4 DISCUSSION ...................................................... 34Gardner, 2- and 4-lb 35Falling Ball, 2- and 4-lb 39Perfotest 43Methods Comparison 47
5 CONCLUSIONS AND RECOMMENDATIONS ............................ 4"
METRIC CONVERSION TABLE 50
REFERENCES 50
APPENDIX A: Draft ASTM Test Method AceG4Si= For 51APPENDIX B: Sample Calculations -3NT! S 55
DISTRIBUTION
r • , 'C t] L ii 4 L3P E C T E D 2 __ i t r •b u t i o .n /DTCQ.1!11PAv.V 11ty Codes
N'Avi and/or
;Dist S .-'c lai
3I
TABLES
Number Page
1 Information on the Polymer-Based Systems 13
2 Information on the Polymer-Modified Systems 14
3 Results of 2-lb Gardner Test on PB Systems 19
4 Results of 2-lb Gardner Test on PM System 20
5 Results of 4-lb Gardner Test on PB Systems 21
6 Results of 4-lb Gardner Test on PM Systems 22
7 Results of 2-lb Falling Ball Test on PB Systems 25
8 Results of 2-lb Falling Ball Test on PM Systems 26
9 Results of 4-lb Falling Ball Test on PB Systems 28
10 Perfotest Data for Both Standard and Refusal Failure Criteria on PB Systems 30
11 Perfotest Data for Both Standard and Refusal Failure Criteria on PM Systems 31
12 Relative Ranking by Test Method 48
FIGURES
Number Page
I Test Frame for EIFS Application 14
2 Test Apparatus for the Falling Weight Test 17
3 MFEs for 2-lb Gardner Test on Class PB EIFS 19
4 MFEs for 2-lb Gardner Test on Class PM EIFS 20
5 MFEs for 4-lb Gardner Test on Class PB EIFS 21
6 MFEs for 4-lb Gardner Test on Class PM EIFS 22
7 Diagram of the Falling Ball Apparatus 24
8 Front View of the Support for the Falling Ball Test 24
9 Back View of the Support for the Falling Ball Test 25
4
FIGURES (Cont'd)
Number Page
10 MFEs for 2-lb Falling Ball Test on Class PB EIFS 26
11 MFEs for 2-lb Falling Ball Test on Class PM EIFS 27
12 MFEs for 4-lb Falling Ball Test on Class PB EIFS 28
13 The Perfotest Apparatus 28
14 Failure-Head-Numbers for the European Perfotest on Class PBand Class PM EIFS 31
15 Failure-Head-Numbers for the European Perfotest Using StandardFailure Criterion on Class PB EIFS 32
16 Failure-Head-Numbers for the European Perfotest Using StandardFailure Criterion on Class PM EIFS 32
17 Failure-Head-Numbers for the European Perfotest Using RefusalFailure Criterion on Class PB EIFS 33
18 Failure-Head-Numbers for the European Perfotest Using Refusal
Failure Criterion on Class PM EIFS 33
19 MFEs for the 2-lb and 4-lb Gardner Test 36
20 MFEs for the 4-lb Gardner Test on Class PB EIFS Showing Typeof Reinforcement 36
21 MFE vs Base Coat Thickness for the 4-lb Gardner Test on Class PM EIFS 37
22 MFEs for the 4-lb Gardner Test on Class PB and Class PM EIFS 37
23 MFE vs Base Coat Thickness for the 4-lb Gardner Test on Class PB andClass PM EIFS 38
24 MFEs for the 2-lb Falling Ball Test on Class PB EIFS Showing Type ofReinforcement 40
25 MFE vs Base Coat Thickness for the 2-lb Falling Ball Test on Class PM EIFS 40
26 MFE vs Base Coat Thickness for the 2-lb and 4-lb Falling Ball Test on ClassPB EIFS 41
27 MFE vs Base Coat Thickness for the 2-lb and 4-lb Falling Ball Test on Class PBand Class PM EIFS 41
28 MFEs for the 2-lb and 4-lb Falling Ball Test on Class PB and Class PM EIFS 42
5
FIGURES (Cont'd)
Number Page
29 Failure-Head-Numbers for the European Perfotest on Class PB EIFS ShowingReinforcement Type 44
30 Failure-Head-Numbers for the European Perfotest on Class PB and Class PM EIFS 44
31 Energy per Unit Area for the European Perfotest on Class PB and Class PM EIFS 45
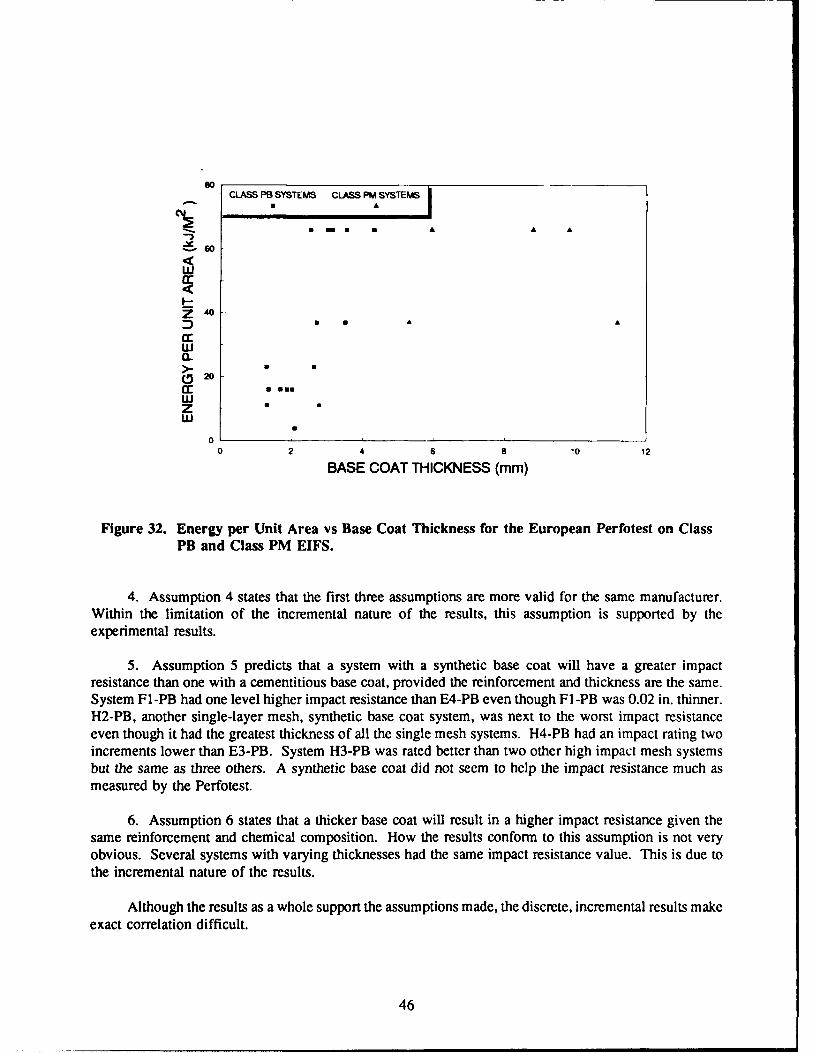
32 Energy per Unit Area vs Base Coat Thickness for the European Perfotest on ClassPB and Class PM EIFS 46
6
EVALUATION OF TEST METHODS TO DETERMINE THE IMPACT RESISTANCEOF EXTERIOR INSULATION AND FINISH SYSTEMS (EIFS)
1 INTRODUCTION
Background
The use of exterior insulation and finish systems on Army facilities has increased substantially overthe past 10 years, largely because they offer cost effectiveness, insulation efficiency, and a low-maintenance, aesthetically pleasing stucco-like finish. However, EIFS have not always performed asexpected. Major failures and system deficiencies have been observed on Army facilities in recent years.1A leading cause of system failure or degradation is moisture infiltration into the system. Water can enterthe system in many different ways, including cracks or punctures penetrating the outer lamina. Many ofthese cracks or punctures are caused by impacts to the system from various s6urces. For this reason, theimpact resistance of EIFS is an extremely important property in maintaining long term system performanceand appearance. It is also important to know the impact resistance of a given system relative to othersystems so an architect/engineer can specify the correct system for a given use (fitness of purpose) at thelowest cost. Currently there are no industry-wide standard impact test methods used by all EIFSmanufacturers. Most manufacturers state results from a given impact test method in their product litera-ture; but since different test methods or variances of a given test method are used, these values cannot becompared throughout the industry. Also, many of these test methods were adapted from other materialstests and may not be applicable for use with EIFS.
Objective
The objective of this study was to evaluate test methods for impact resistance being used in industryand determine their validity for use with EIFS on Army facilities.
Approach
Researchers contacted selected EIFS manufacturers requesting systems for testing; 23 EIFS from8 manufacturers were received. Three separate impact tests were performed on all 23 systems: a fallingweight test, a falling ball test, and the European Perfotest. Based on the chemical and physical propertiesof the systems, researchers defined six assumptions about the relative impact resistance of polymer-basedsystems and one assumption about the impact resistance of polymer-modified systems. Researchers thencompared the test results with the assumptions to draw conclusions and make recommendations.
R.G. Lampo and J.C. Trovillion, Exterior Insulation and Finish Systems (EIFS) on U.S. Army Facilities: Lessons Learned,Technical Report M-91/02/ADA228572 (U.S. Army Construction Engineering Research Laboratory [USACERL], October1990).
7
Mode of Technology Transfer
The results of this research were used to develop a draft standard test method presented to theASTM Committee E-06.55, Performance of Building Constructions, Exterior Walls, in the fall of 1990for possible adoption as a standard test method for determining the impact resistance of exterior insulationand finish systems (See Appendix A). Any test method adopted by ASTM should be incorporated intofuture updates of Corps of Engineers Guide Specification CEGS-07240. 2
2 CEGS-07240, Exterior Insulation and Finish Systems (Headquarters. U.S. Army Corps of Engineers [HQUSACE], December
1988).
8
2 EIFS CHARACTERISTICS
EIFS are nonload-bearing exterior wall cladding systems that can be used effectively in newconstruction or retrofit applications. These systems usually contain:
1. Molded expanded polystyrene insulation board (MEPS), commonly referred to as "bead board,"or extruded expanded polystyrene insulation board (XEPS), commonly referred to as "blue board."
2. An adhesive or mechanical attachment of the insulation board to the substrate or both mechanicaland adhesive attachments
3. A fabric-reinforced, or a fabric and chopped fiber-reinforced base coat
4. An acrylic stucco type or aggregate finish coat.
These systems are traditionally separated into the following two classes:
1. Polymer-based (PB) systems and2. Polymer-modified (PM) systems.
Occasionally, the term "hard coat" is uscd to describe PM systems and "soft coat" to describe PBsystems. However, these terms imply inaccuracies about the systems' mechanical properties, which aremainly dictated by the properties of the reinforced base coat. By virtue of the thick cementitious basecoat, PM systems are hard. PB systems, on the other hand, vary in their properties depending on theirbase coat composition. For some PB systems, cement is added to the base coat mixture before application.These PB systems will be harder and more brittle than PB systems without cement. To avoid confusion,the industry discourages the use of the hard coat or soft coat terms.
The Exterior Insulation Manufacturers Association (EIMA), has established classifications for thedifferent types of EIFS; they use "class PB" for the traditionally polymer-based EIFS and "class PM" forthe traditionally polymer-modified EIFS. This report follows the current indusiry nomenclature.
Class PB Systems
The class PB systems are most commonly applied over MEPS insulation board that is adhesivelyattached, or adhesively and mechanically attached to the substrate.
The class PB system base coat may be a polymer-cement mix or all polymer-based (commonlyreferred to as synthetic). The thickness of the base coat varies depending on the number of layers appliedand the type of reinforcing fabric used. The thickness of the base coat ranges from about 1/16 to 1/4 in.*The reinforcement is typically a polymer-coated glass fiber mesh that is embedded into the base coat atthe time of installation.
The finish coats for class PB systems are available in a wide variety of textures and colors.
A metric conversion table is on page 50.
9
Class PM Systems
The class PM systems are most commonly applied over XEPS insulation board that is mechanicallyattached to the substrate.
The class PM system base coat is generally a polymer-modified cementitious mixture. The thicknessof the base coat ranges from 1/4 to 3/8 in. The reinforcing fabric is generally a polymer-coated glass fibermesh that is mechanically attached to the insulation board before the base coat is applied. This meshserves not only to reinforce the base coat but also to aid in adhering the base coat to the insulation board.The base coat may also be additionally reinforced with chopped glass fibers.
As with the class PB systems, the finish coat in class PM systems is applied over the base coat andis available in a variety of colors, textures, or aggregate finishes.
System Assemblage
Although panelized systems (where factory-made EIFS panel sections are attached to the wall viamechanical tracks) are available, such systems are used less frequently because they cost more than on-siteconstructed systems. The majority of EIFS are constructed in the field directly on the building wall. Thebasic construction sequence is as follows:
1. Foam insulation boards of the appropriate thickness are attached to the substrate wall. For classPM systems, the boards are usually attached using mechanical fasteners. For class PB systems, the boardsare typically attached adhesively, although mechanical fasteners or a combination of mechanical fastenersand adhesives may be used where desired or needed.
2. After appropriate adhesive curing, the system base coat is applied over the attached insulationboards. For class PB systems, the specified reinforcing mesh is then worked into the wet base coat. Forclass PM systems, the reinforcing mesh is mechanically attached in the same operation as attaching theinsulation boards. If more than one layer of mesh is specified, the procedure is repeated after allowingthe previous layer to cure.
3. When the base coat layer has appropriately cured, the system finish coat is applied.
System Advantages
One advantage of EIFS is that they offer very good insulating properties. Because these systemsare applied to the exterior of a building, they eliminate thermal bridging to the outside caused by floorsor ceilings. They also greatly decrease the thermal shock, or temperature range, that the structural load-bearing wall experiences, which helps to prolong the lifetime and reduce maintenance to the wall.
Another advantage of EIFS is that they can be cost efficient; depending on geographic location, localenergy costs, building design, HVAC system type, etc, an EIFS installation can pay for itself over time,Life cycle costs are low because the systems require little maintenance, such as periodic painting. Also,since they are applied to the exterior of a building, normal operations within the building need not bestopped or altered during the system installation. EIFS can also improve the appearance of buildings.The wide range of finish coats available gives the designer/architect ample freedom in choosing colors anddesigns to enhance the building architecture.
10
EIFS are easily applied and can be installed in a relatively short time. They can also be installedover a wide range of substrates, which greatly increases their versatility.
Considerations for System Use
All components of EIFS function together to provide insulation, weather/moisture protection,durability, and an aesthetically pleasing appearance. EIFS are designed to be a moisture barrier, however,if water enters the system, its integrity can be affected. Therefore, deficiencies that allow water topenetrate the system are of major concern. For this reason, the impact resistance of EIFS is a veryimportant property to ensure overall system integrity and performance.
EIFS were introduced into the U.S. market about 15 years ago, and therefore represent a relativelynew technology. Industry-wide standard specifications and test methods have not been fully developedand/or uniformly adopted. The impact resistance of these systems varies widely according to the typesand number of layers of reinforcing fabric, the composition and thickness of the base coat, differencesbetween the formulations of different manufacturers, and the application methods used. The informationin this report was obtained to increase the knowledge of how EIFS respond to impact loadings. The intentof gathering this information was to speed up the process of developing a standard impact test method tobe used throughout the EIFS industry. With this information, selection criteria could be developed thatwould allow better decisions to be made when specifying EIFS in retrofit or new construction applications.
11
3 TEST PROGRAM
Specimen Preparation
Twenty-three different systems from 8 manufacturers were tested; 17 were polymer-based (class PB)and 6 were polymer-modified (class PM) systems. To protect proprietary information, each system wasidentified only by an alphanumeric code composed of a letter to designate the manufacturer, a number todesignate a given system, and PB or PM to designate the system class. Table I lists the codes and genericinformation about the class PB systems. Table 2 lists the codes and generic information about the classPM systems.
The EIFS were applied over 4 ft by 8 ft frames made from standard 2 in. by 4 in. lumber with a16 in. center-to-center stud spacing parallel to the 4 ft dimension. The fasteners used for the lumber weresixteenpenny nails. A 4 ft by 8 ft by 1/2 in. sheet of gypsum sheathing board was attached using 1-5/8in. drywall screws (Figure 1). The EIFS were applied over the gypsum sheathing by representatives fromeach manufacturer according to individual installation procedures. Four 4 ft by 8 ft panels of each systemwere required for the tests. After applying the EIFS, the panels were allowed to cure for at least 28 daysbefore testing.
Tests Performed
Three tests were performed on samples of each of the 23 systems: a falling weight test, a fallingball test, and the European Perfotest. The first two tests were selected for evaluation because they are thetests most commonly used by industry; the Perfotest was selected because it can be used in the field asa quality assurance tool.
Because EIFS represent a relatively new construction technology, specifications and test methodsfor these systems have not been fully developed. When it became apparent that the impact resistance ofthese systems was a concern, most manufacturers adopted industry accepted impact test methods developedfor other materials. These tests had to be modified for EIFS to accommodate the material differences.Because these modifications were manufacturer specific, comparisons based on impact resistance betweenmanufacturers were virtually impossible. Another problem was that a wide variety of tests were used bythe many EIFS manufacturers. Through all this confusion, two tests became used in some way by mostof the manufacturers: a falling weight (indentation) test and a falling ball test.
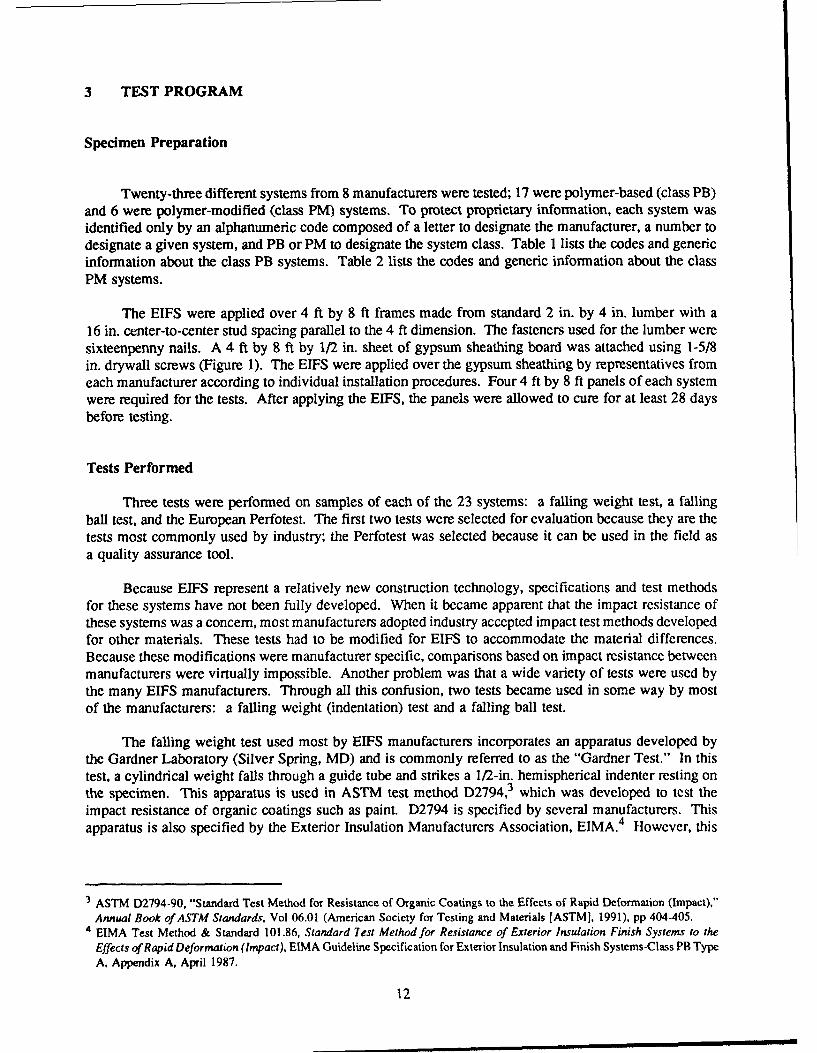
The falling weight test used most by EIFS manufacturers incorporates an apparatus developed bythe Gardner Laboratory (Silver Spring, MD) and is commonly referred to as the "Gardner Test." In thistest, a cylindrical weight falls through a guide tube and strikes a 1/2-in. hemispherical indenter resting onthe specimen. This apparatus is used in ASTM test method D2794,3 which was developed to test theimpact resistance of organic coatings such as paint. D2794 is specified by several manufacturers. Thisapparatus is also specified by the Exterior Insulation Manufacturers Association, EIMA. 4 However, this
3 ASTM D2794-90, "Standard Test Method for Resistance of Organic Coatings to the Effects of Rapid Deformation (Impact),"Annual Book of ASTM Standards, Vol 06.01 (American Society for Testing and Materials [ASTMI, 1991), pp 404-405.
4 EIMA Test Method & Standard 101.86, Standard Test Method for Resistance of Exterior Insulation Finish Systems to theEffects of Rapid Deformation (Impact), EIMA Guideline Specification for Exterior Insulation and Finish Systems-Class PB Type
A, Appendix A, April 1987.
12
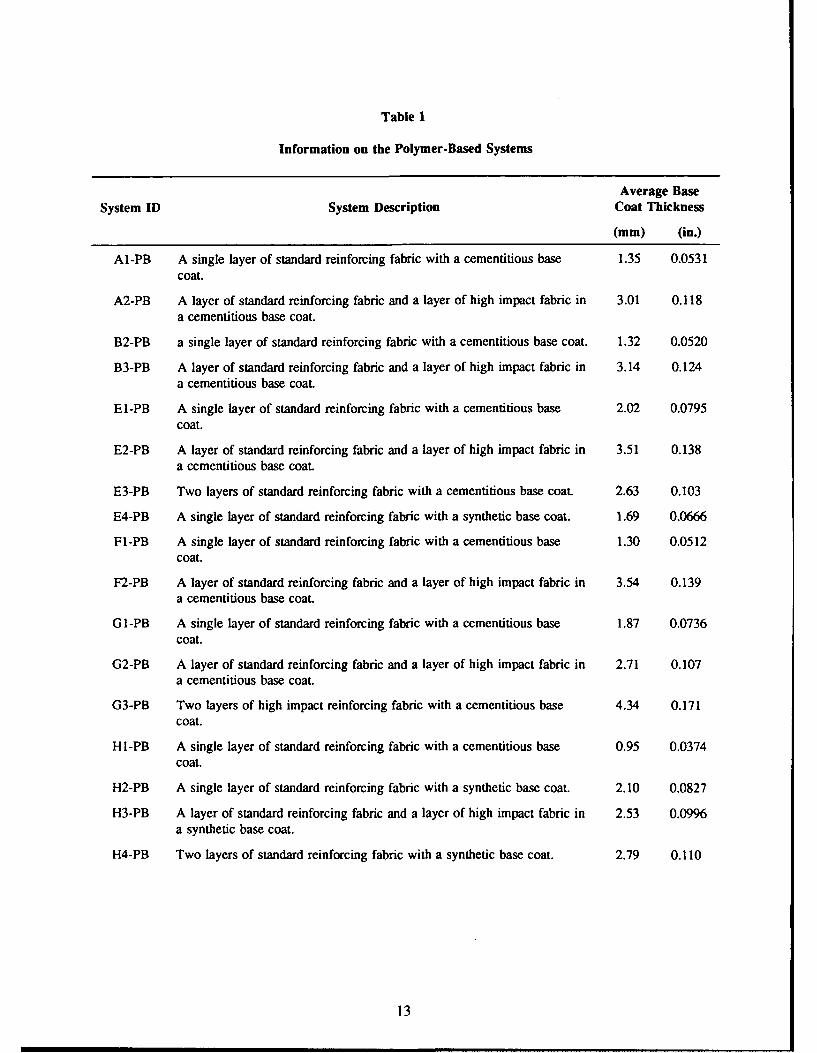
Table 1
Information on the Polymer-Based Systems
Average Base
System ID System Description Coat Thickness
(mm) (in.)
Al-PB A single layer of standard reinforcing fabric with a cementitious base 1.35 0.0531coat.
A2-PB A layer of standard reinforcing fabric and a layer of high impact fabric in 3.01 0.118a cementitious base coat.
B2-PB a single layer of standard reinforcing fabric with a cementitious base coat. 1.32 0.0520
B3-PB A layer of standard reinforcing fabric and a layer of high impact fabric in 3.14 0.124a cementitious base coat.
E1-PB A single layer of standard reinforcing fabric with a cementitious base 2.02 0.0795coat.
E2-PB A layer of standard reinforcing fabric and a layer of high impact fabric in 3.51 0.138a cementitious base coat.
E3-PB Two layers of standard reinforcing fabric with a cementitious base coat. 2.63 0.103
E4-PB A single layer of standard reinforcing fabric with a synthetic base coat. 1.69 0.0666
Fl-PB A single layer of standard reinforcing fabric with a cementitious base 1.30 0.0512coat.
F2-PB A layer of standard reinforcing fabric and a layer of high impact fabric in 3.54 0.139a cementitious base coat.
G1-PB A single layer of standard reinforcing fabric with a cementitious base 1.87 0.0736coat.
G2-PB A layer of standard reinforcing fabric and a layer of high impact fabric in 2.71 0.107a cementitious base coat.
G3-PB Two layers of high impact reinforcing fabric with a cementitious base 4.34 0.171coat.
HI-PB A single layer of standard reinforcing fabric with a cementitious base 0.95 0.0374coat.
H2-PB A single layer of standard reinforcing fabric with a synthetic base coat. 2.10 0.0827
H3-PB A layer of standard reinforcing fabric and a layer of high impact fabric in 2.53 0.0996a synthetic base coat.
H4-PB Two layers of standard reinforcing fabric with a synthetic base coat. 2.79 0.110
13
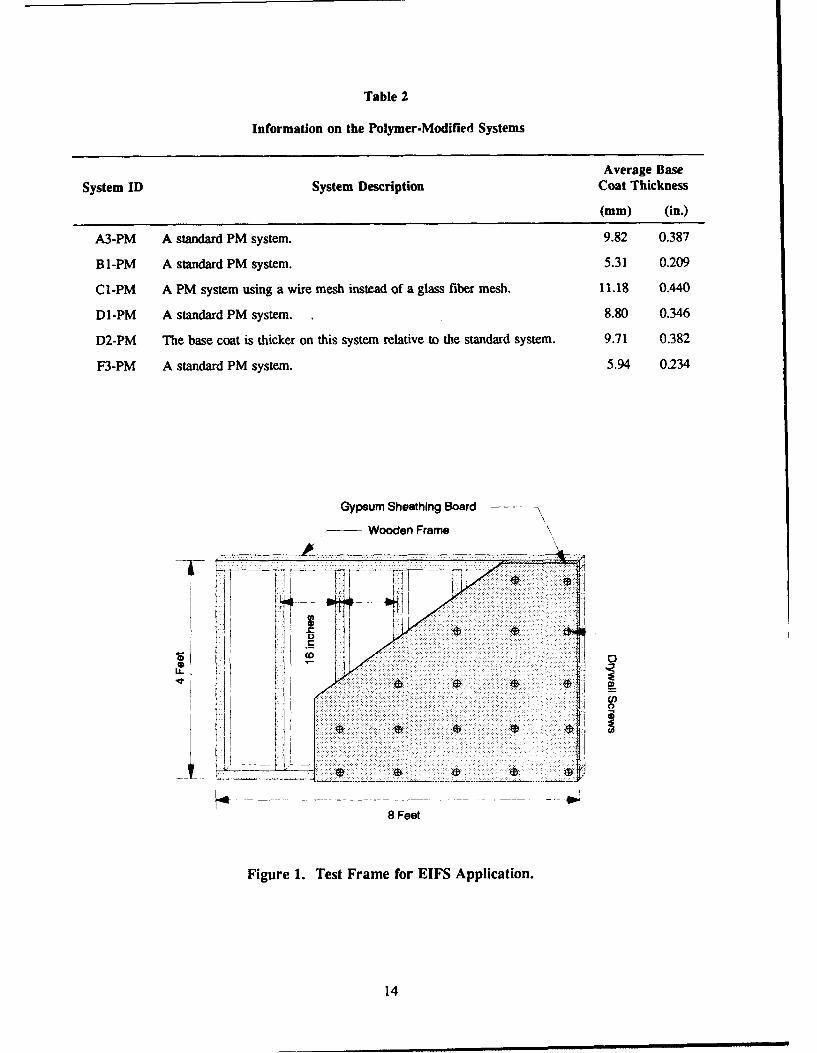
Table 2
Information on the Polymer-Modified Systems
Average BaseSystem ID System Description Coat Thickness
(mm) (in.)
A3-PM A standard PM system. 9.82 0.387
B1-PM A standard PM system. 5.31 0.209
Cl-PM A PM system using a wire mesh instead of a glass fiber mesh. 11.18 0.440
DI-PM A standard PM system. 8.80 0.346
D2-PM The base coat is thicker on this system relative to the standard system. 9.71 0.382
F3-PM A standard PM system. 5.94 0.234
Gypsum Sheathing Board
S- Wooden Frame
: I
8 Feet
Figure 1. Test Frame for EIFS Application.
14
test has not been universally accepted by EIFS manufacturers and is not specific enough to eliminatevariability between manufacturers conducting the test.
A falling ball test has been specified and conducted by a large percentage of manufacturers. In thistest, a steel ball of some given size and weight is allowed to fall onto the specimen from a given height.This can be accomplished by either a vertical drop or by using a pendulum. The problem is that theweight and diameter of the ball and the mechanism for attaching the specimen are seldom the samebetween manufacturers, even when they cite the same test method. The falling ball test most commonlyspecified by EIFS manufacturers is ASTM test method D1037.5 This method contains several tests devel-oped to evaluate the properties of particle board. In the falling ball test, the ball would have to drop over50 ft to cause failure in some systems. This is not feasible for most testing facilities, especially whentrying to hit an 8-in. by 8-in. sample as specified in the test method. To overcome this, the most commonmodification to this method is to increase the size and weight of the ball. This makes comparison betweenmanufacturers meaningless even when the same test is specified. Other variables encountered includesample size, sample preparation, and attachment to the test fixture base.
Since the goal of the current research was to determine whether the commonly used tests wereapplicable to EIFS, researchers also modified the two tests to fit testing needs and capabilities. This wasperceived as a first step in the process of developing a specific industry standard test method that wouldbe used by all EIFS manufacturers.
A standard test widely used in Europe is the Perfotest.6 Unlike the falling weight and falling balltests, which incorporate a constant indentor size and a variable force, the Perfotest uses a constant forceand variable indenter size. This device is hand held and can be used in the laboratory or in the field asa quality assurance tool.
Data Reduction
For both the falling weight test and the falling ball test, a mean-failure-energy was determined usingmethods outlined in ASTM D3029.7 The first step in calculating a mean-failure-energy is to calculatea mean-failure-height. The mean-failure-height is calculated using the following formula:
h = ho + dh(A/N ± 0.5) [Eq 11
where: h = the mean-failure-height,ho = the lowest height at which an event occurred,dh = the increment in drop height,N = the total number of failures or nonfailures, whichever is smaller (whatever is
used, either failures or nonfailures, is called an event), andA = is given by the expression,
5 ASTM D1037-89, "Standard Test Methods of Evaluating the Properties of Wood-Base Fiber and Particle Panel Materials,"Annual Book of ASTM Standards, Vol 04.09 (ASTM, 1991), pp 169-198.
6 European Union for Technical Agreement in Construction, UF.Atc Directives for the Assessment of External Insulation S~stev
for Walls (Expanded Polystyrene Insulation Faced with a Thin Rendering), M.O.A.T. n 22, June 1988.7 ASTM D3029-90. "Standard Test Methods for Impact Resistance of Flat, Rigid Plastic Specimens by Means of a Tup (Fa!ling
Weight)," Annual Book of ASTM Standards, Vol 08.02 (ASTM, 1991), pp 517-528.
15
kA=E ini, [Eq 2]
i=O
where: i = 0,l,2....k (a counting index starting at ho),ni = the number of events that occurred at hN, and h, is given by the expression,
hi = h. + idh [Eq 31
In calculating the mean-failure-height, the negative sign is used when the events are failures and thepositive sign is used when the events are nonfailures.
The estimated standard deviation of the sample is calculated using the following formula,
Sh = 1.62dh[B/N_(A/N)2] + 0.047dh [Eq 4]
where: B is given by the expression,
kBE i 2n| Eq5)
i=O
This formula is valid only if [B/N-(A/N) 2] > 0.3.
The estimated standard deviation of the sample mean-failure-height is given by:
Shbar - G*Sh/-Nf " [Eq 6]
where: Shbar = the estimated standard deviation of the mean-failure-height,G = a function of Sh/dh.8
The mean-failure-energy, MFE, can be calculated using the following formula:
MFE = h * w [Eq 7]
Weaver, O.R., "Using Attributes to Measure a Continuous Variable in Impact Testing Plastic Bottles," Materials Research andStandards, Vol 6, No. 6 (June 1966), pp 285-291.
16
where: h = the mean-failure-height,w = the constant drop weight used in testing.
The estimated standard deviation of the MFE is given:
SMFE -- Shbar * W [F_,q 8]
Sample calculations using these formulas are given in Appendix B.
Falling Weight Test
Apparatus
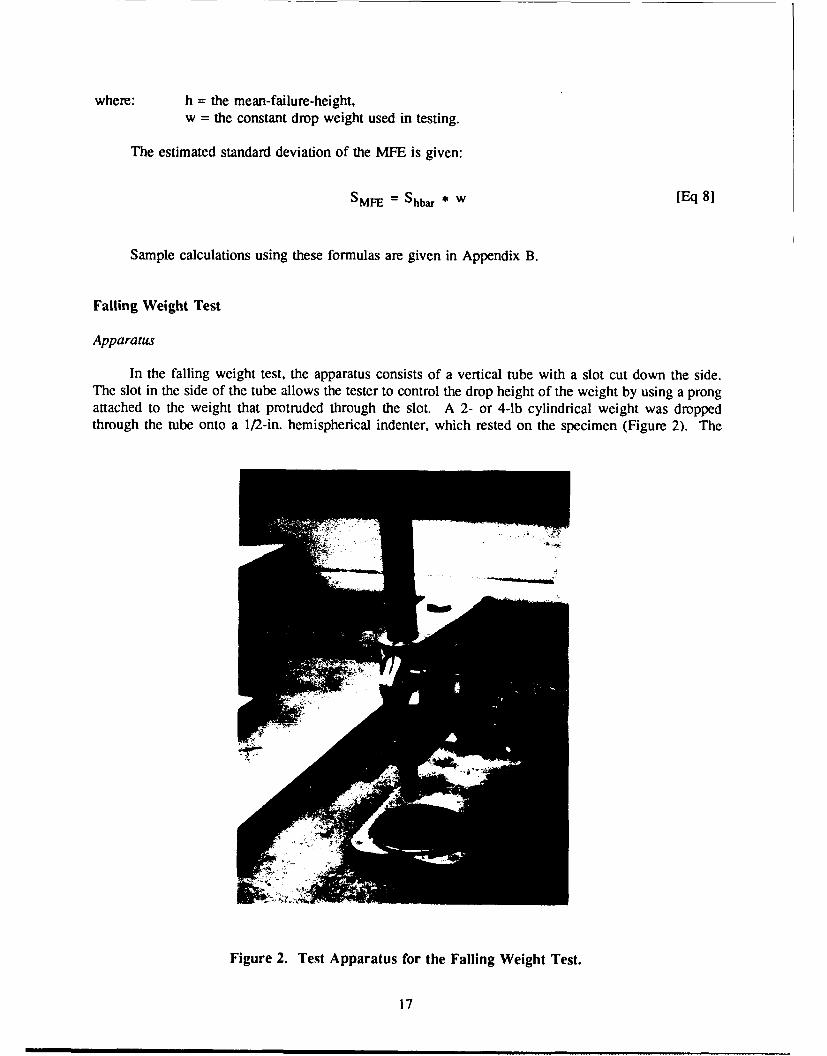
In the falling weight test, the apparatus consists of a vertical tube with a slot cut down the side.The slot in the side of the tube allows the tester to control the drop height of the weight by using a prongattached to the weight that protruded through the slot. A 2- or 4-1b cylindrical weight was droppedthrough the tube onto a 1/2-in. hemispherical indenter, which rested on the specimen (Figure 2). The
Figure 2. Test Apparatus for the Falling Weight Test.
17
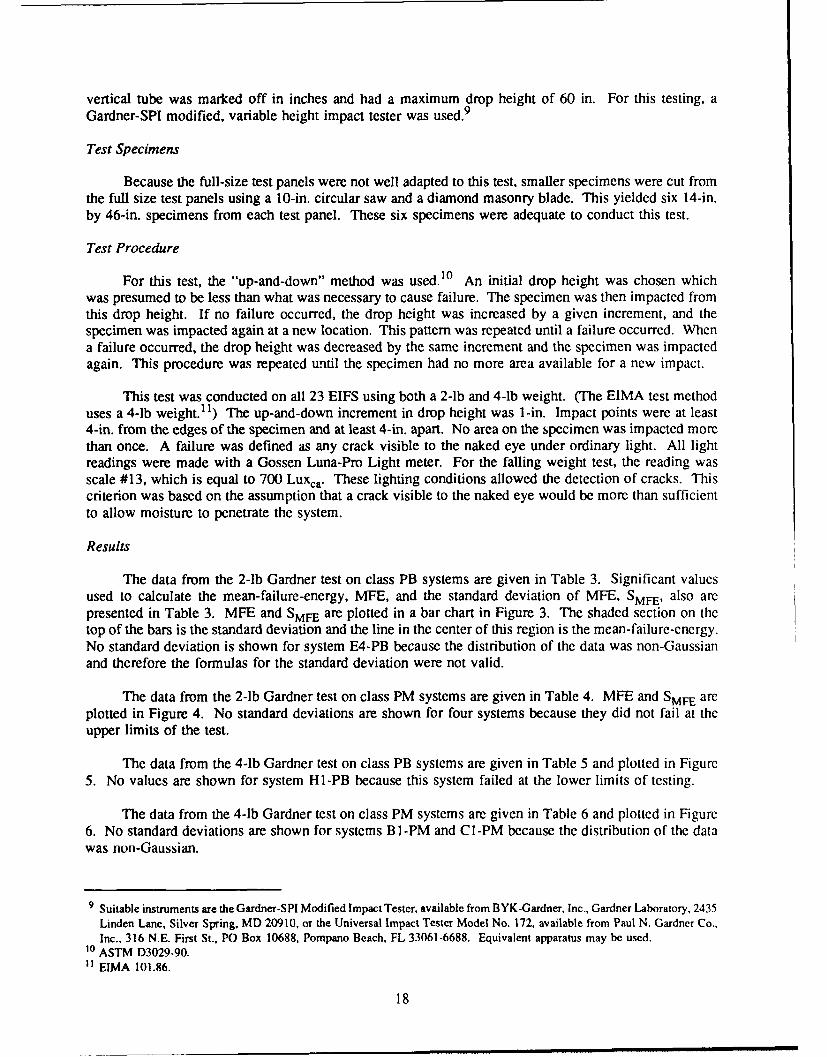
vertical tube was marked off in inches and had a maximum drop height of 60 in. For this testing, a
Gardner-SPI modified, variable height impact tester was used.9
Test Specimens
Because the full-size test panels were not well adapted to this test, smaller specimens were cut fromthe full size test panels using a 10-in. circular saw and a diamond masonry blade. This yielded six 14-in.by 46-in. specimens from each test panel. These six specimens were adequate to conduct this test.
Test Procedure
For this test, the "up-and-down" method was used. 10 An initial drop height was chosen whichwas presumed to be less than what was necessary to cause failure. The specimen was then impacted fromthis drop height. If no failure occurred, the drop height was increased by a given increment, and thespecimen was impacted again at a new location. This pattern was repeated until a failure occurred. Whena failure occurred, the drop height was decreased by the same increment and the specimen was impactedagain. This procedure was repeated until the specimen had no more area available for a new impact.
This test was conducted on all 23 EIFS using both a 2-lb and 4-lb weight. (The EIMA test methoduses a 4-lb weight.1 1) The up-and-down increment in drop height was I-in. Impact points were at least4-in. from the edges of the specimen and at least 4-in. apart. No area on the specimen was impacted morethan once. A failure was defined as any crack visible to the naked eye under ordinary light. All lightreadings were made with a Gossen Luna-Pro Light meter. For the falling weight test, the reading wasscale #13, which is equal to 700 Luxca. These lighting conditions allowed the detection of cracks. Thiscriterion was based on the assumption that a crack visible to the naked eye would be more than sufficientto allow moisture to penetrate the system.
Results
The data from the 2-lb Gardner test on class PB systems are given in Table 3. Significant valuesused to calculate the mean-failure-energy, MFE, and the standard deviation of MFE, SMFE, also arcpresented in Table 3. MFE and SMFE are plotted in a bar chart in Figure 3. The shaded section on thetop of the bars is the standard deviation and the line in the center of this region is the mean-failure-energy.No standard deviation is shown for system E4-PB because the distribution of the data was non-Gaussianand therefore the formulas for the standard deviation were not valid.
The data from the 2-lb Gardner test on class PM systems are given in Table 4. MFE and SMFE areplotted in Figure 4. No standard deviations are shown for four systems because they did not fail at theupper limits of the test.
The data from the 4-lb Gardner test on class PB systems are given in Table 5 and plotted in Figure5. No values are shown for system HI-PB because this system failed at the lower limits of testing.
The data from the 4-lb Gardner test on class PM systems are given in Table 6 and plotted in Figure6. No standard deviations are shown for systems B I-PM and Cl-PM because the distribution of the datawas non-Gaussian.
9 Suitable instruments are the Gardner-SPI Modified Impact Tester, available from BYK-Gardner, Inc., Gardner Laboratory, 2435Linden Lane, Silver Spring, MD 20910, or the Universal Impact Tester Model No. 172, available from Paul N. Gardncr Co.,Inc., 316 N.E. First St., PO Box 10688, Pompano Beach, FL 33061-6688. Equivalent apparatus may be used.
10 ASTM D3029-90." ETIMA 101.86.
18
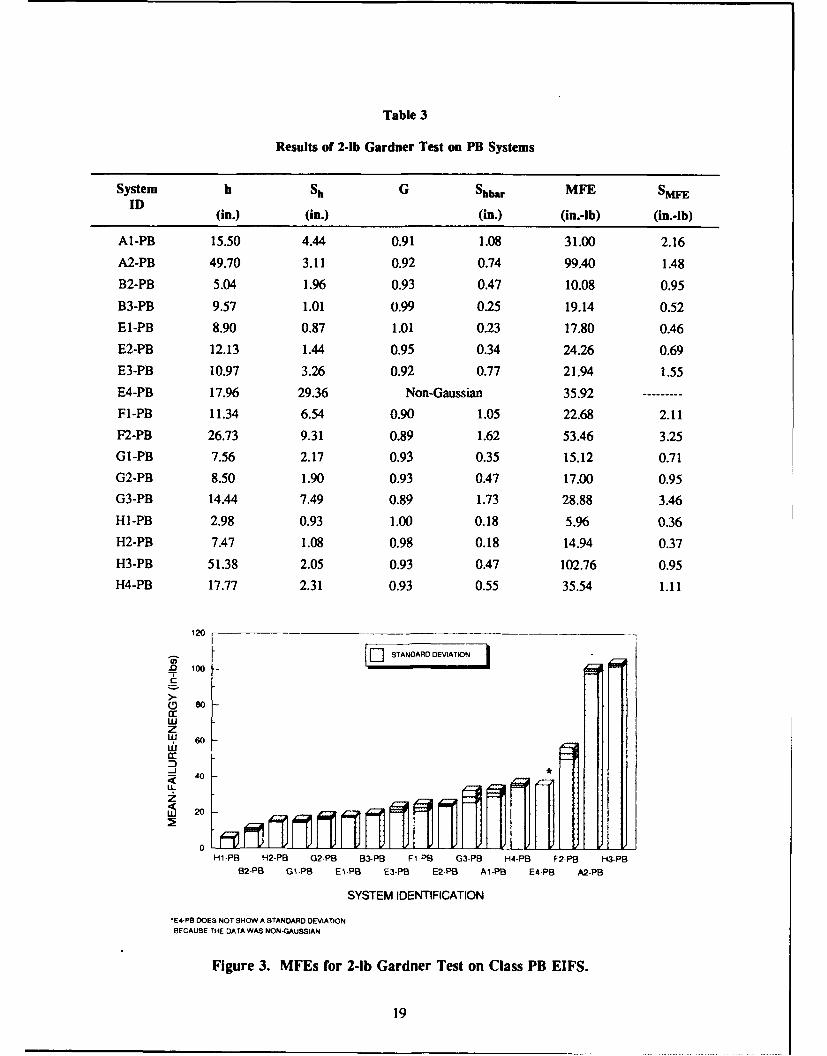
Table 3
Results of 2-lb Gardner Test on PB Systems
System h Sh G Shbar MFE SMFEID (in.) (in.) (in.) (in.-Ib) (in.-ib)
A1-PB 15.50 4.44 0.91 1.08 31.00 2.16
A2-PB 49.70 3.11 0.92 0.74 99.40 1.48
B2-PB 5.04 1.96 0.93 0.47 10.08 0.95
B3-PB 9.57 1.01 0.99 0.25 19.14 0.52
El-PB 8.90 0.87 1.01 0.23 17.80 0.46
E2-PB 12.13 1.44 0.95 0.34 24.26 0.69
E3-PB 10.97 3.26 0.92 0.77 21.94 1.55
E4-PB 17.96 29.36 Non-Gaussian 35.92 ---------
Fl-PB 11.34 6.54 0.90 1.05 22.68 2.11
F2-PB 26.73 9.31 0.89 1.62 53.46 3.25
GI-PB 7.56 2.17 0.93 0.35 15.12 0.71
G2-PB 8.50 1.90 0.93 0.47 17.00 0.95
G3-PB 14.44 7.49 0.89 1.73 28.88 3.46
Hi-PB 2.98 0.93 1.00 0.18 5.96 0.36
H2-PB 7.47 1.08 0.98 0.18 14.94 0.37
H3-PB 51.38 2.05 0.93 0.47 102.76 0.95
H4-PB 17.77 2.31 0.93 0.55 35.54 1.11
120 --
DDARD DEVIATION
n0 100
00cc
zW 60
Hi-PB H2-PB G2-PB B3-PB F1l-PB G3-PB H4-PB F2-PB H3-PB
B2-PB GI-PB El-PB E3-PB E2-PB Al-PB E4-PB A2-PB
SYSTEM IDENTIFICATION
"E4-PS DOES NOT SHOW A STANDARD DEVIATION
BECAUSE THE DATA WAS NON-OAUSSIAN
Figure 3. MFEs for 2-lb Gardner Test on Class PB EIFS.
19
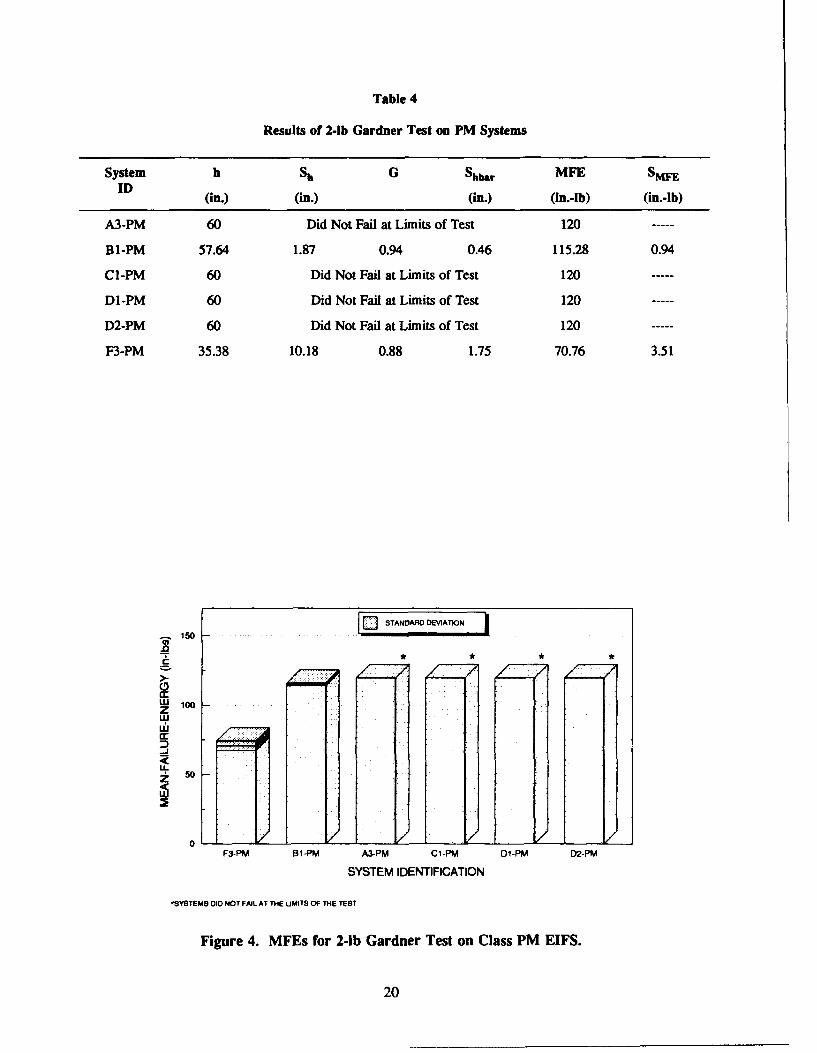
Table 4
Results of 2-lb Gardner Test on PM Systems
System h Sh G Shbar MFE SMFEID (in.) (in.) (in.) (in.-Ib) (in.-ib)
A3-PM 60 Did Not Fail at Limits of Test 120 -----
BI-PM 57.64 1.87 0.94 0.46 115.28 0.94
Cl-PM 60 Did Not Fail at Limits of Test 120 -----
D1-PM 60 Did Not Fail at Limits of Test 120 -----
D2-PM 60 Did Not Fail at Limits of Test 120 -----
F3-PM 35.38 10.18 0.88 1.75 70.76 3.51
10 STANDARD DE"VIATN
0izLU
-J
~50
0 :v__ - ___ _ __ - _ _
F3-PM B1-PM A3-PM Cl-PM DI-PM D2-PM
SYSTEM IDENTIFICATION
-SYSTEMS DID NOT FAIL AT THE uMITS OF THE TEST
Figure 4. MFEs for 2-lb Gardner Test on Class PM EIFS.
20
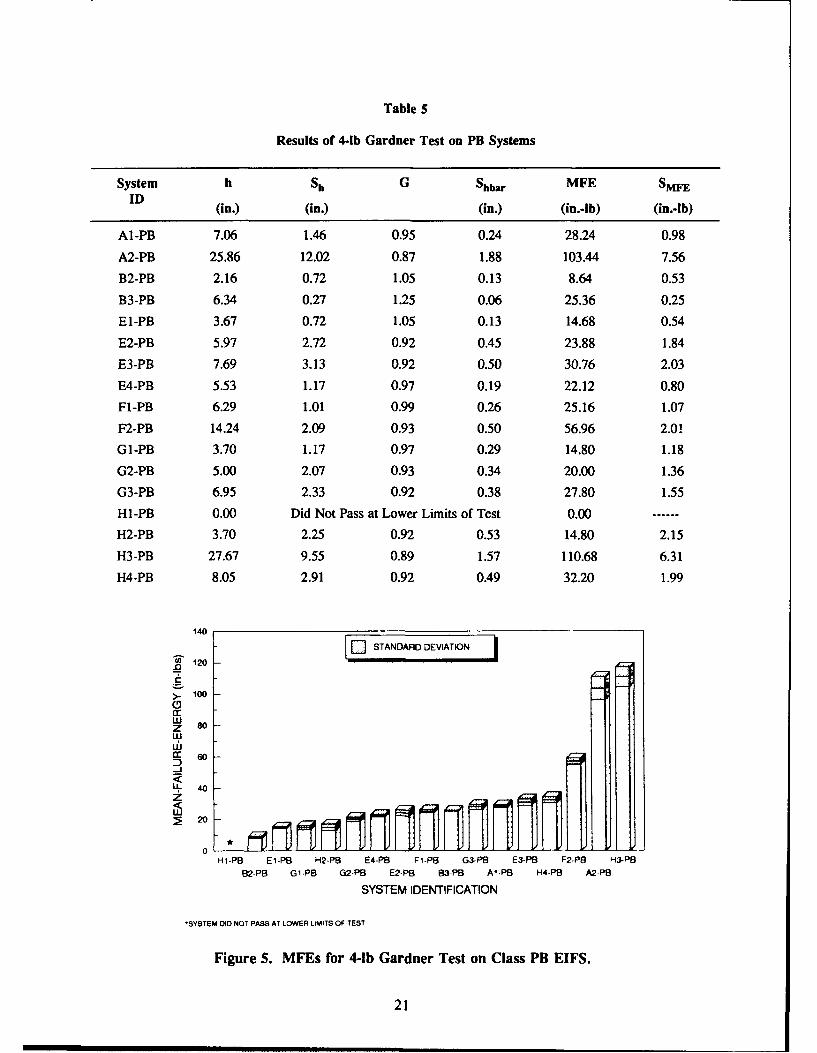
Table 5
Results of 4-lb Gardner Test on PB Systems
System h Sh G Shbar MFE SMFEID (in.) (in.) (in.) (in.-lb) (in.-lb)
Al-PB 7.06 1.46 0.95 0.24 28.24 0.98
A2-PB 25.86 12.02 0.87 1.88 103.44 7.56
B2-PB 2.16 0.72 1.05 0.13 8.64 0.53
B3-PB 6.34 0.27 1.25 0.06 25.36 0.25
El-PB 3.67 0.72 1.05 0.13 14.68 0.54
E2-PB 5.97 2.72 0.92 0.45 23.88 1.84
E3-PB 7.69 3.13 0.92 0.50 30.76 2.03
E4-PB 5.53 1.17 0.97 0.19 22.12 0.80
Fl-PB 6.29 1.01 0.99 0.26 25.16 1.07
F2-PB 14.24 2.09 0.93 0.50 56.96 2.01
G1-PB 3.70 1.17 0.97 0.29 14.80 1.18
G2-PB 5.00 2.07 0.93 0.34 20.00 1.36
G3-PB 6.95 2.33 0.92 0.38 27.80 1.55
HI-PB 0.00 Did Not Pass at Lower Limits of Test 0.00
H2-PB 3.70 2.25 0.92 0.53 14.80 2.15
H3-PB 27.67 9.55 0.89 1.57 110.68 6.31
H4-PB 8.05 2.91 0.92 0.49 32.20 1.99
140
STANDARDDIATN
" 100
crwz 80
L. 40z
~20 *
H1-PB E1-PB H2-PB E4-PB F1-PB G3-PF E3-PB F2-PB H3-PB
B2-PB G1-PB G2-PB E2-PB 83-PB AI-PB H4-PB A2-PB
SYSTEM IDENTIFICATION
"DID NOT PASS AT LOWER LIMITS OF TEST
Figure 5. MFEs for 4-lb Gardner Test on Class PB EIFS.
21
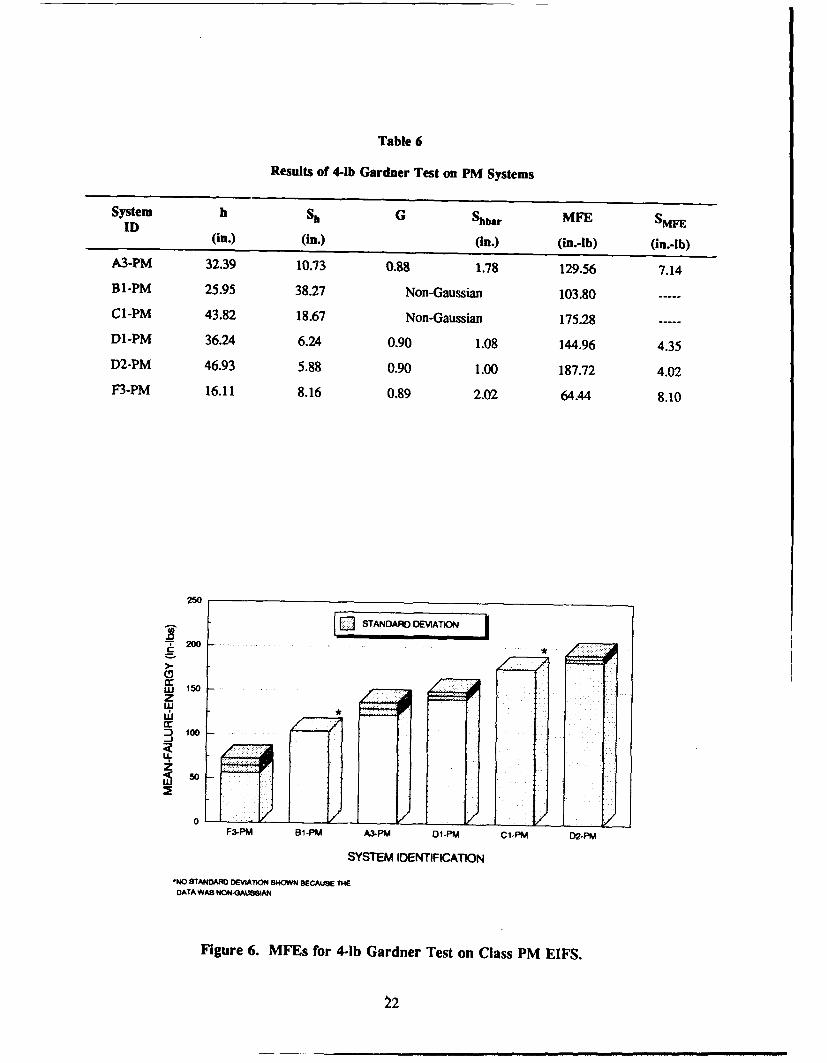
Table 6
Results of 4-lb Gardner Test on PM Systems
System h Sh G Shbar MFE SMFEID (in.) (in.) (in.) (in.-lb) (in.-lb)
A3-PM 32.39 10.73 0.88 1.78 129.56 7.14B 1-PM 25.95 38.27 Non-Gaussian 103.80 -----
Cl-PM 43.82 18.67 Non-Gaussian 175.28 -----DI-PM 36.24 6.24 0.90 1.08 144.96 4.35D2-PM 46.93 5.88 0.90 1.00 187.72 4.02F3-PM 16.11 8.16 0.89 2.02 64.44 8.10
250
EJSTANDARDJ DEV1ATION
2W0
S150zwIII
0 V_F3-PM B1 -PM A3--PM 01-PM Cl-PM D2-PM
SYSTEM IDENTIFICATION
"*NO STANDARM DIEV•TSOWN BECAUSE THE
DATA WAS NON-GAUSSIAN
Figure 6. MFEs for 4-1b Gardner Test on Class PM EIFS.
22
Falling Ball Test
Apparatus
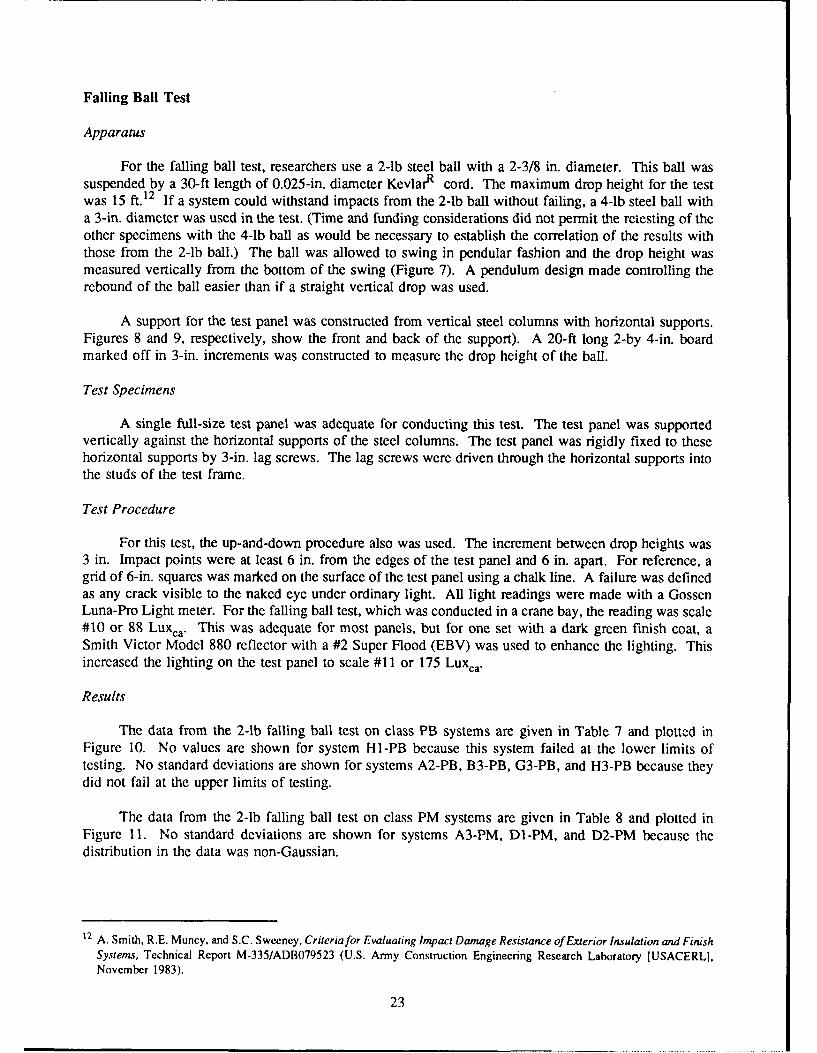
For the falling ball test, researchers use a 2-lb steel ball with a 2-3/8 in. diameter. This ball wassuspended by a 30-ft length of 0.025-in. diameter KevlarR cord. The maximum drop height for the testwas 15 ft. 12 If a system could withstand impacts from the 2-lb ball without failing, a 4-lb steel ball witha 3-in. diameter was used in the test. (Time and funding considerations did not permit the retesting of theother specimens with the 4-lb ball as would be necessary to establish the correlation of the results withthose from the 2-lb ball.) The ball was allowed to swing in pendular fashion and the drop height wasmeasured vertically from the bottom of the swing (Figure 7). A pendulum design made controlling therebound of the ball easier than if a straight vertical drop was used.
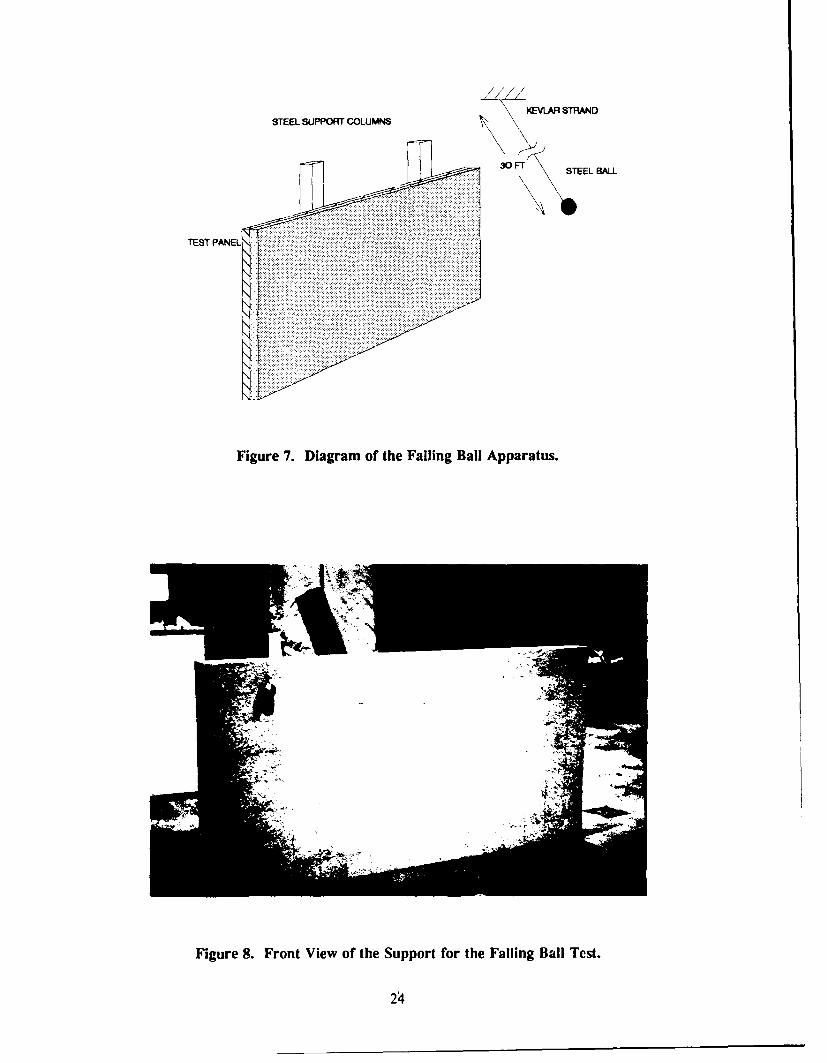
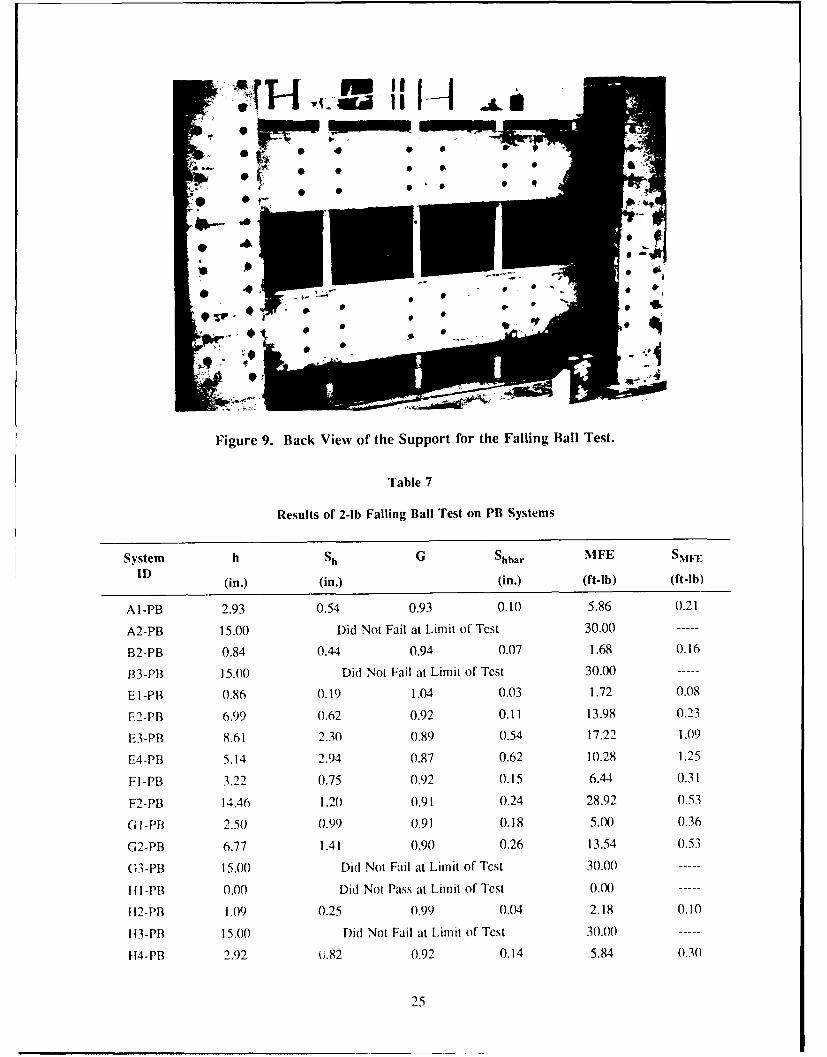
A support for the test panel was constructed from vertical steel columns with horizontal supports.Figures 8 and 9, respectively, show the front and back of the support). A 20-ft long 2-by 4-in. boardmarked off in 3-in. increments was constructed to measure the drop height of the ball.
Test Specimens
A single full-size test panel was adequate for conducting this test. The test panel was supportedvertically against the horizontal supports of the steel columns. The test panel was rigidly fixed to thesehorizontal supports by 3-in. lag screws. The lag screws were driven through the horizontal supports intothe studs of the test frame.
Test Procedure
For this test, the up-and-down procedure also was used. The increment between drop heights was3 in. Impact points were at least 6 in. from the edges of the test panel and 6 in. apart. For reference, agrid of 6-in. squares was marked on the surface of the test panel using a chalk line. A failure was definedas any crack visible to the naked eye under ordinary light. All light readings were made with a GossenLuna-Pro Light meter. For the falling ball test, which was conducted in a crane bay, the reading was scale#10 or 88 Luxca. This was adequate for most panels, but for one set with a dark green finish coat, aSmith Victor Model 880 reflector with a #2 Super Flood (EBV) was used to enhance the lighting. Thisincreased the lighting on the test panel to scale #11 or 175 Luxca.
Results
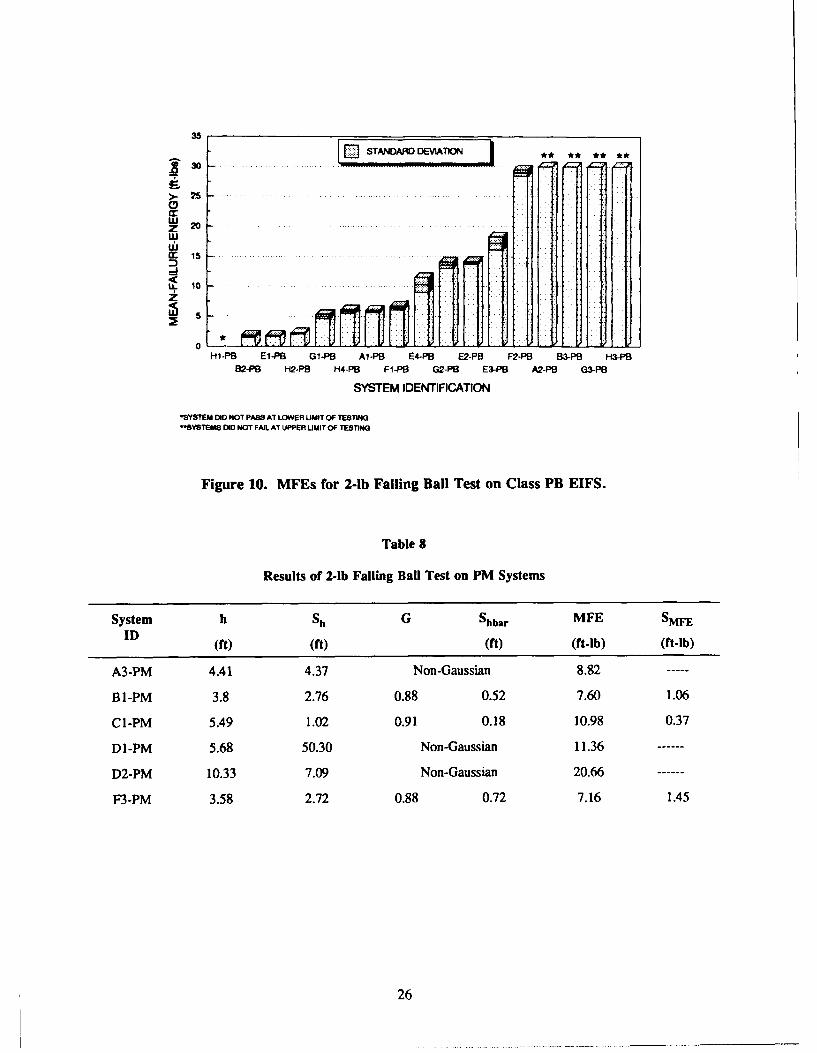
The data from the 2-lb falling ball test on class PB systems are given in Table 7 and plotted inFigure 10. No values are shown for system HI-PB because this system failed at the lower limits oftesting. No standard deviations are shown for systems A2-PB, B3-PB, G3-PB, and H3-PB because theydid not fail at the upper limits of testing.
The data from the 2-lb falling ball test on class PM systems are given in Table 8 and plotted inFigure 11. No standard deviations are shown for systems A3-PM, DI -PM, and D2-PM because thedistribution in the data was non-Gaussian.
12 A. Smith, R.E. Muncy, and S.C. Sweeney, Criteria for Evaluating Impact Damage Resistance of Exterior Insulation and Finish
Systems, Technical Report M-335/ADB079523 (U.S. Army Construction Engineering Research Laboratory [USACERLI,November 1983).
23
KEVLAR STRIANDSTEEL SUPPORT COLUMNS
30 FT STEEL BALL
Figure 7. Diagram of the Falling Ball Apparatus.
Figure 8. Front View of the Support for the Falling Ball Test.
24
Results of 2-lb Falling Ball Test on PB Systems
System h Sh G Shbar MFE SWEID
(in.) (in.) (in.) (ft-lb) (ft-lb)
AI-PB 2.93 0.54 0.93 0.10 5.86 0.21
A2-PB 15.00 Did Not Fail at Limit of Test 30.00 -----
B2-PB 0.84 0.44 0.94 0.07 1.68 0.16
B3-PB 15.00 Did Not Fail at Limit of Test 30.00 -----
E1-PB 0.86 0.19 1.04 0.03 1.72 0.08
E2-PB 6.99 0.62 0.92 0.11 13.98 0.23
E3-PB 8.61 2.30 0.89 0.54 17.22 1.09
E4-PB 5.14 2.94 0.87 0.62 10.28 1.25
FI-PB 3.22 0.75 0.92 0.15 6.44 0.31
F2-PB 14.46 1.20 0.91 0.24 28.92 0.53
G I -PB 2.50 0.99 0.91 0.18 5.00 0.36
G2-PB 6.77 1.41 0.90 0.26 13.54 0.53
G3-PB 15.00 Did Not Fail at Limit of Test 30.00 -----
tII-PB 0.00 Did Not Pass at Limit of Test 0.00X) ---
H2-PB 1.09 0.25 0.99 0.04 2.18 0.10
113-PB 15.00 Did Not Fail at Limit of Test 30.00
1t4-PB 2.92 ji.82 0.92 0.14 5.84 0.30
25
35
STANDARD DEVLAT1ON ** * *
~30
wZ 2 0
w
U.10
0 *
B2-PB H2-PB 1-4-PB Fl-PB3 02-PB 6XB A2P 3-PB
SYSTEM IDENflFICA11ON
'SYSTEM DID NOT PASS AT LOWER UMIT OF TESTMN-SYSTEMS DID NOT FAIL AT UPPER UMIT OF: TESTING
Figure 10. MFEs for 2-lb Falling Ball Test on Class PB EIFS.
Table 8
Results of 2-lb Failing Ball Test on PM Systems
System b Sh G Shbar MFE SFID (ft) (ft) (ft) (ft-lb) (ft-lb)
A3-PM 4.41 4.37 Non-Gaussian 8.82---
B1-PM 3.8 2.76 0.88 0.52 7.60 1.06
Cl-PM 5.49 1.02 0.91 0.18 10.98 0.37
D1-PM 5.68 50.30 Non-Gaussian 11.36 ---
D2-PM 10.33 7.09 Non-Gaussian 20.66 ---
P3-PM 3.58 2.72 0.88 0.72 7.16 1.45
26
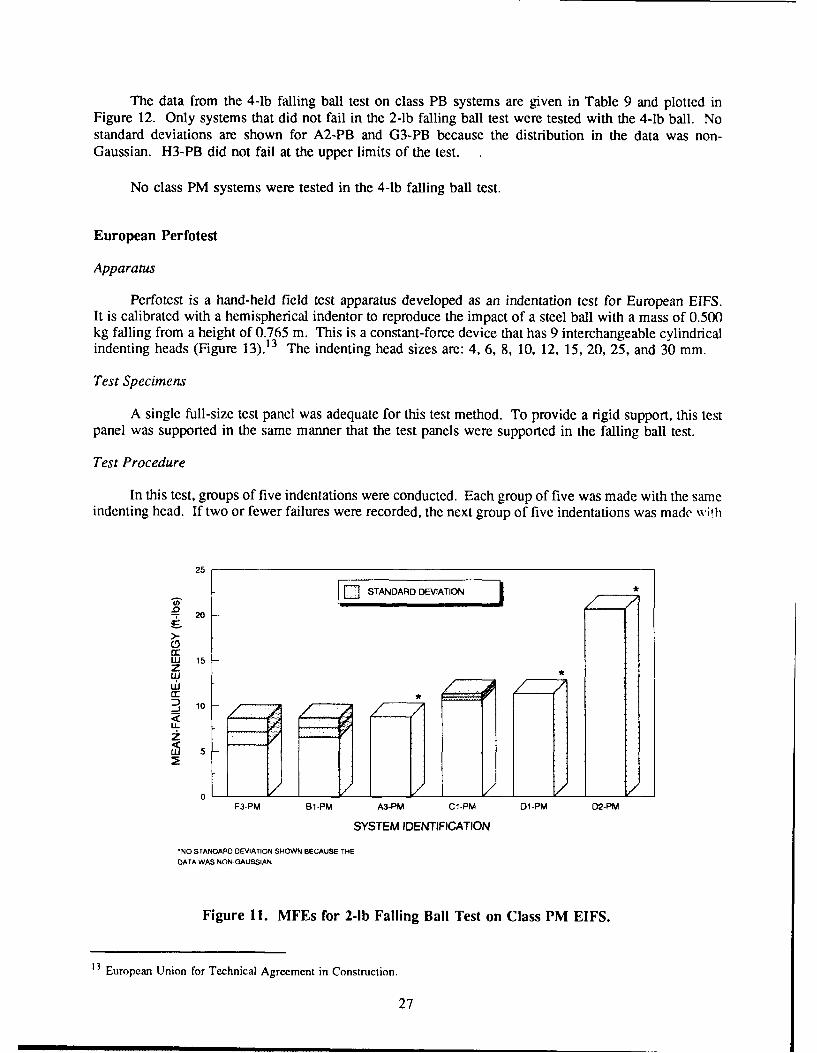
The data from the 4-lb falling ball test on class PB systems are given in Table 9 and plotted inFigure 12. Only systems that did not fail in the 2-lb falling ball test were tested with the 4-lb ball. Nostandard deviations are shown for A2-PB and G3-PB because the distribution in the data was non-Gaussian. H3-PB did not fail at the upper limits of the test.
No class PM systems were tested in the 4-lb falling ball test.
European Perfotest
Apparatus
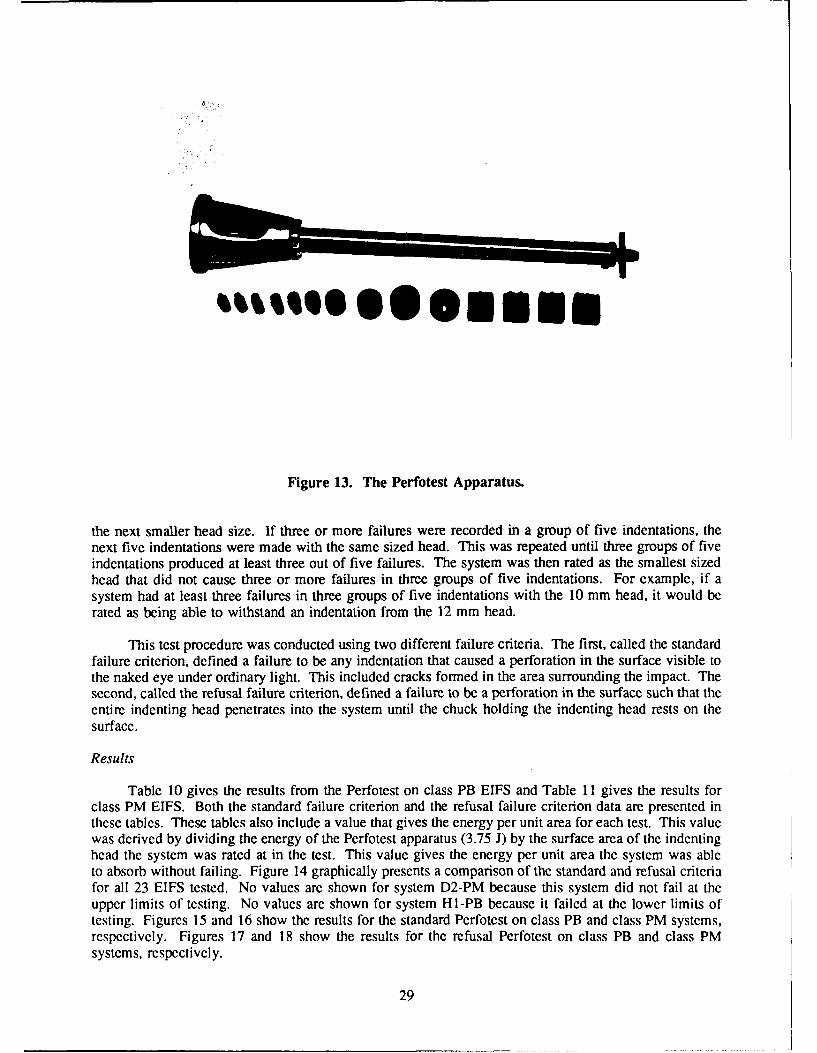
Perfotest is a hand-held field test apparatus developed as an indentation test for European EIFS.It is calibrated with a hemispherical indentor to reproduce the impact of a steel ball with a mass of 0.500kg falling from a height of 0.765 m. This is a constant-force device that has 9 interchangeable cylindricalindenting heads (Figure 13).13 The indenting head sizes are: 4, 6, 8, 10, 12, 15, 20, 25, and 30 mm.
Test Specimens
A single full-size test panel was adequate for this test method. To provide a rigid support, this testpanel was supported in the same manner that the test panels were supported in the falling ball test.
Test Procedure
In this test, groups of five indentations were conducted. Each group of five was made with the sameindenting head. If two or fewer failures were recorded, the next group of five indentations was made with
25
FE1 STANDARD DEVIATION *
.0.20
UW 15z*
S10
L-
F3-PM B1-PM A3-PM Cl-PM D1-PM D2-PM
SYSTEM IDENTIFICATION
"NO STANDARD DEVIATION SHOWN BECAUSE THE
DATA WAS NON-GAUSSIAN
Figure 11. MFEs for 2-1b Falling Ball Test on Class PM EIFS.
13 European Union for Technical Agreement in Construction.
27
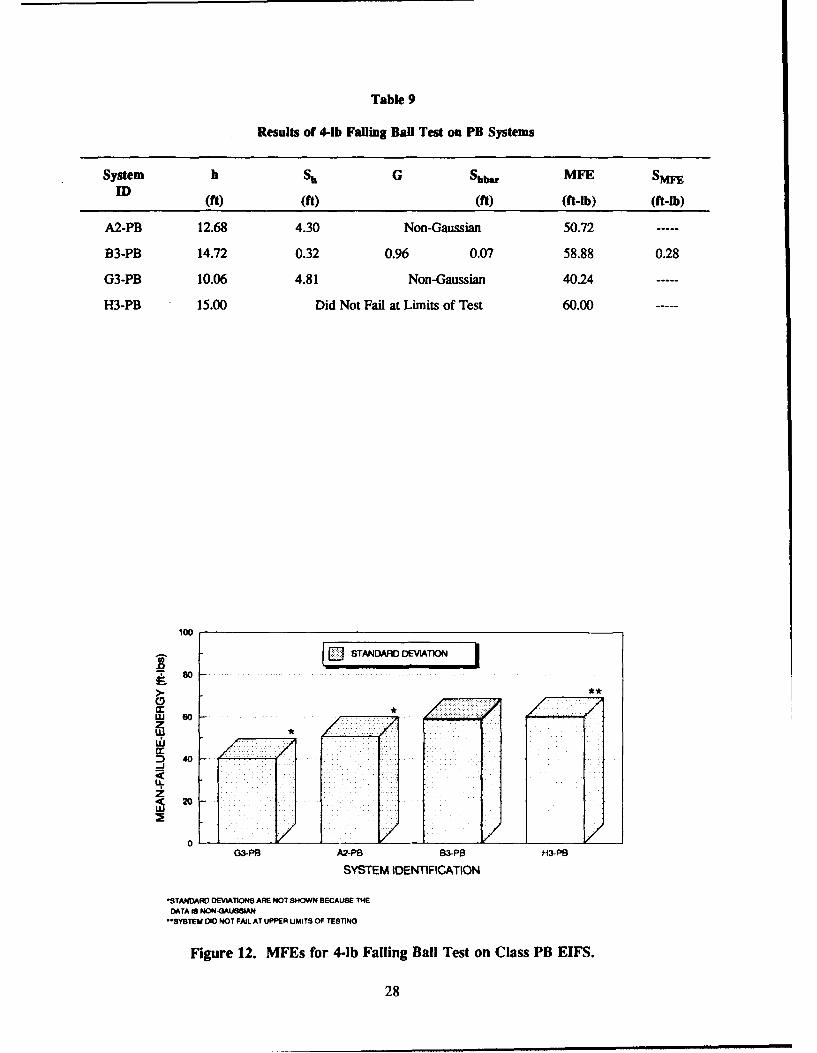
Table 9
Results of 4-lb Falling Ball Test on PB Systems
System h Sh G Shbar MFE SMFED (ft) (ft) (ft) (ft-lb) (ft-lb)
A2-PB 12.68 4.30 Non-Gaussian 50.72 -----
B3-PB 14.72 0.32 0.96 0.07 58.88 0.28
G3-PB 10.06 4.81 Non-Gaussian 40.24 -----
H3-PB 15.00 Did Not Fail at Limits of Test 60.00
100
El STANDARID DEVIA1TIO- .8I
80
W 60z
Z 4"
G3-PB A2-PB 83-PB H3-PB
SYSTEM IDENTIFICATION
"*STANDARD DEVIATIONS ARE NOT SHOWN BECAUSE THEDATA IS NON-GAUSS"AN
SYSTEM DI0 NOT FAIL AT UPPER UMITS OF TESTING
Figure 12. MFEs for 4-lb Falling Ball Test on Class PB EIFS.
28
Q'me **** Mae
Figure 13. The Perfotest Apparatus.
the next smaller head size. If three or more failures were recorded in a group of five indentations, thenext five indentations were made with the same sized head. This was repeated until three groups of fiveindentations produced at least three out of five failures. The system was then rated as the smallest sizedhead that did not cause three or more failures in three groups of five indentations. For example, if asystem had at least three failures in three groups of five indentations with the 10 mm head, it would berated as being able to withstand an indentation from the 12 mm head.
This test procedure was conducted using two different failure criteria. The first, called the standardfailure criterion, defined a failure to be any indentation that caused a perforation in the surface visible tothe naked eye under ordinary light. This included cracks formed in the area surrounding the impact. Thesecond, called the refusal failure criterion, defined a failure to be a perforation in the surface such that theentire indenting head penetrates into the system until the chuck holding the indenting head rests on thesurface.
Results
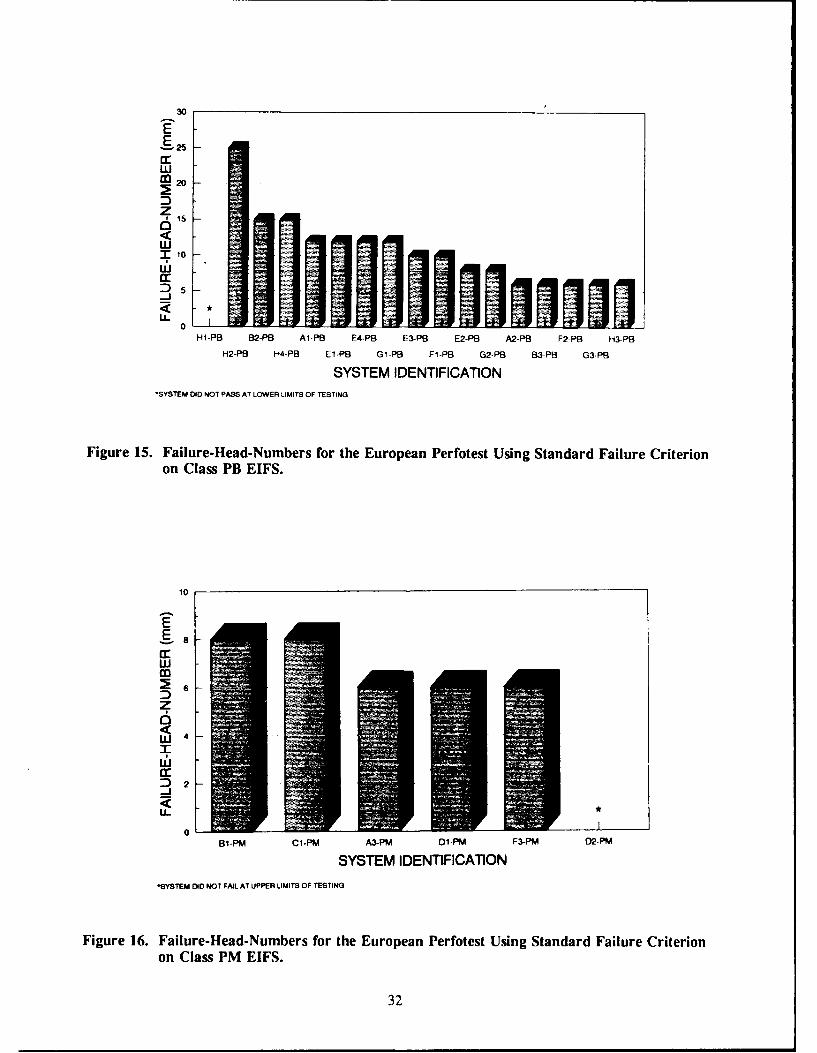
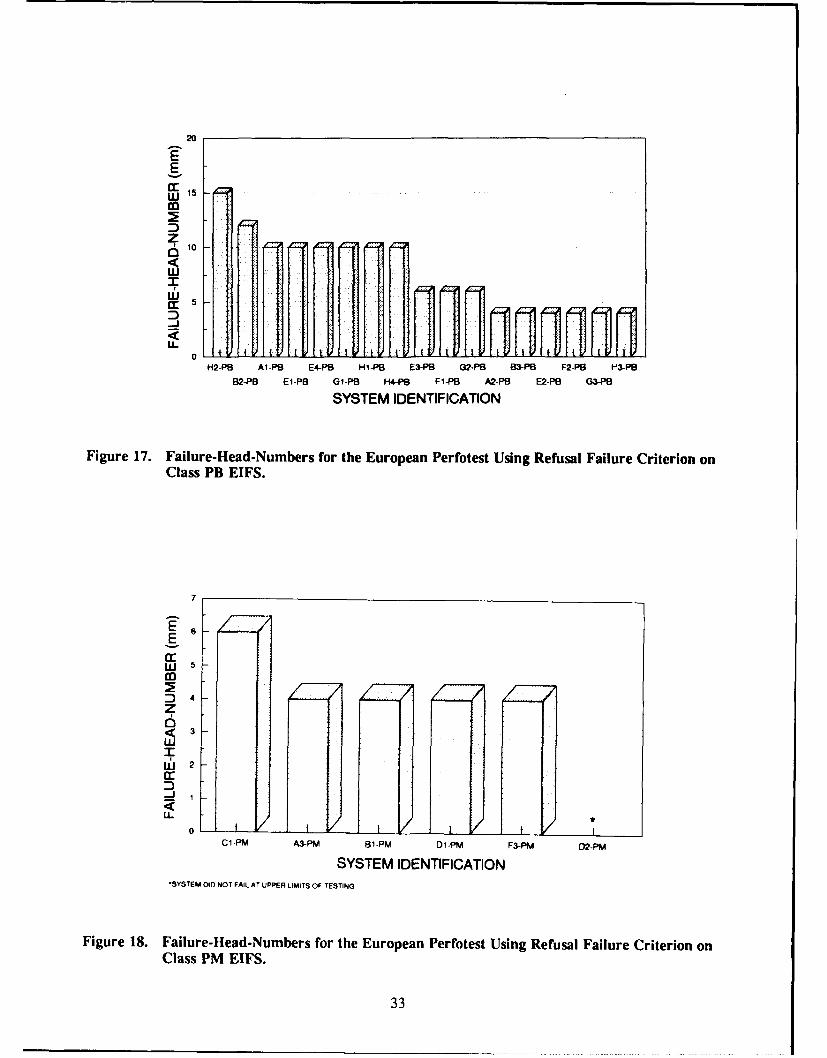
Table 10 gives the results from the Perfotest on class PB EIFS and Table II gives the results forclass PM EIFS. Both the standard failure criterion and the refusal failure criterion data are presented inthese tables. These tables also include a value that gives the energy per unit area for each test. This valuewas derived by dividing the energy of the Perfotest apparatus (3.75 J) by the surface area of the indentinghead the system was rated at in the test. This value gives the energy per unit area the system was ableto absorb without failing. Figure 14 graphically presents a comparison of the standard and refusal criteriafor all 23 EIFS tested. No values are shown for system D2-PM because this system did not fail at theupper limits of testing. No values are shown for system HI-PB because it failed at the lower limits oftesting. Figures 15 and 16 show the results for the standard Perfotest on class PB and class PM systems,respectively. Figures 17 and 18 show the results for the refusal Perfotest on class PB and class PMsystems, respectively.
29
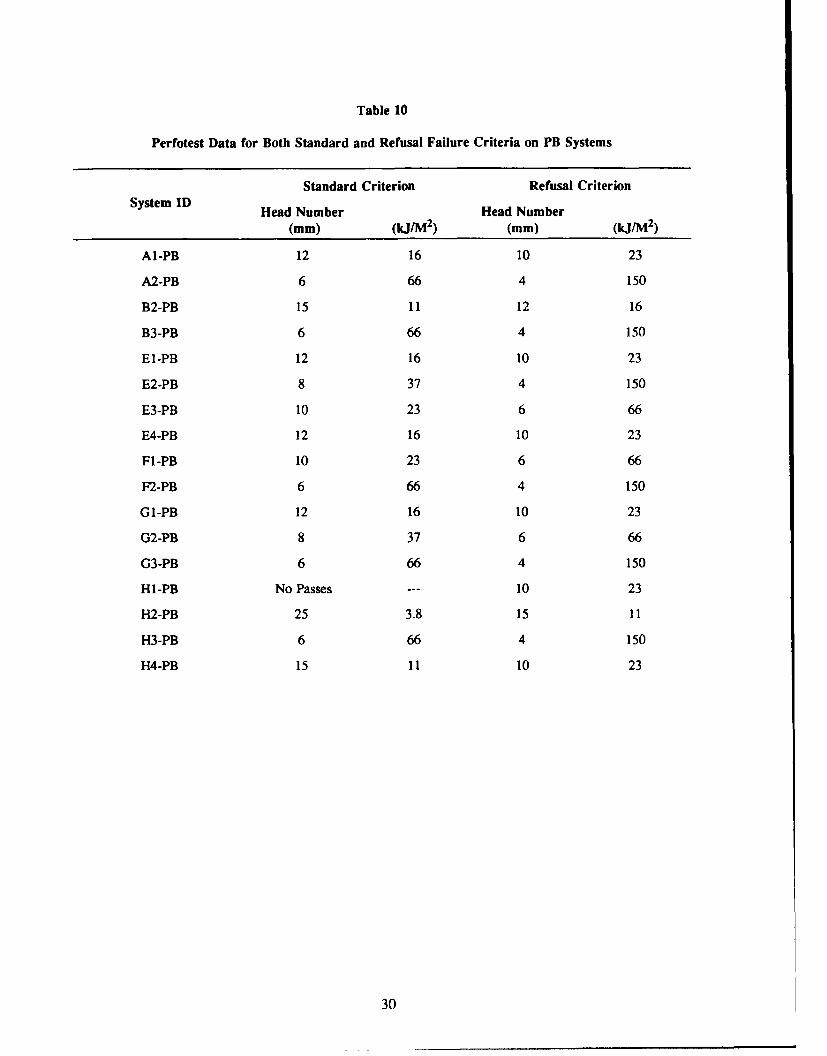
Table 10
Perfotest Data for Both Standard and Refusal Failure Criteria on PB Systems
Standard Criterion Refusal CriterionSystem ID Head Number Head Number
(mm) (kJ/M2 ) (mm) (kJ/M 2 )
Al-PB 12 16 10 23
A2-PB 6 66 4 150
B2-PB 15 11 12 16
B3-PB 6 66 4 150
El-PB 12 16 10 23
E2-PB 8 37 4 150
E3-PB 10 23 6 66
E4-PB 12 16 10 23
Fl-PB 10 23 6 66
F2-PB 6 66 4 150
G1-PB 12 16 10 23
G2-PB 8 37 6 66
G3-PB 6 66 4 150
Hi-PB No Passes --- 10 23
H2-PB 25 3.8 15 11
H3-PB 6 66 4 150
H4-PB 15 11 10 23
30
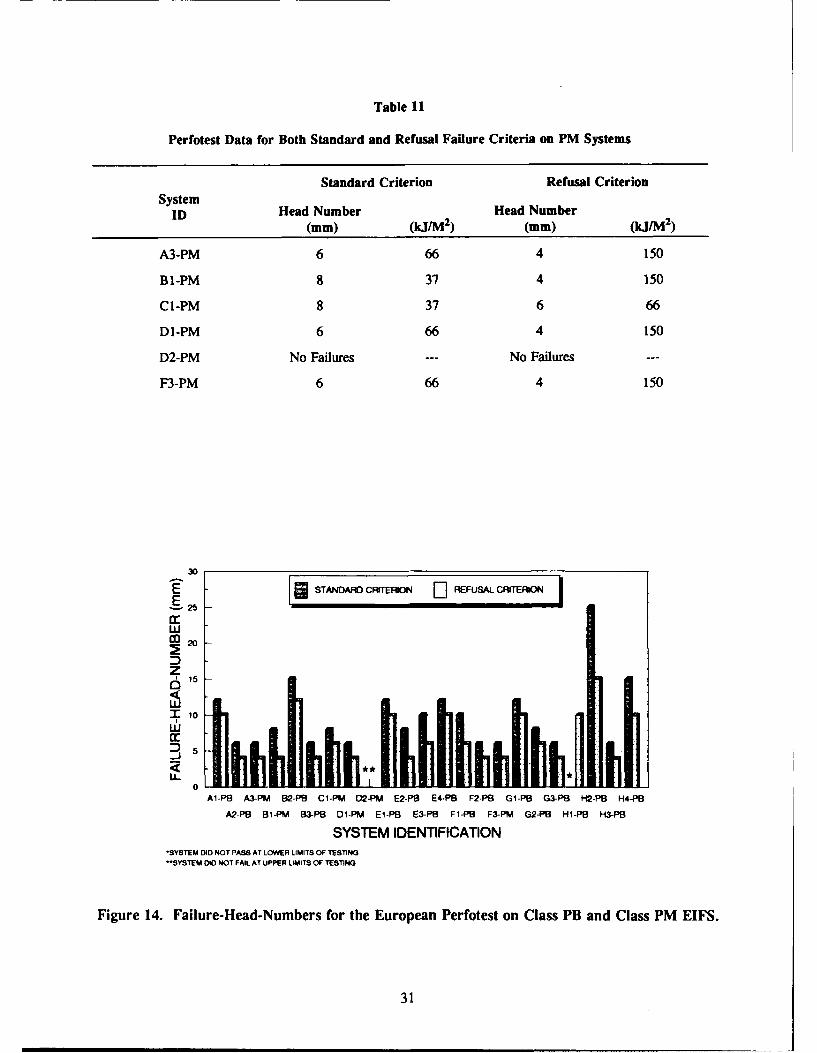
Table 11
Perfotest Data for Both Standard and Refusal Failure Criteria on PM Systems
Standard Criterion Refusal CriterionSystem
ID Head Number Head Number(mm) (kJ/M2 ) (mm) (kJ/M2)
A3-PM 6 66 4 150
B1-PM 8 37 4 150
Cl-PM 8 37 6 66
DI-PM 6 66 4 150
D2-PM No Failures --- No Failures ---
F3-PM 6 66 4 150
30 I _ _ _ _I
E STANDARD CFVTEP40N ElREFUSAL CRITERIO
'I
w
z15
~10
cc
Al-PB A3-PM B2-PB C1-PM D2-PM E2-PB E4-PB F2-PB G1-PB G3-PB H2-PB H4-PB
A2-PB 81-PM B3-PB D1-PM El-PB E3-PB Fl-PB F3-PM G2-PB Hi-PB H3-PB
SYSTEM IDENTIFICATION"SYSTEM DID NOT PASS AT LOWER LIMITS OF TESTING**SYSTEM 0D0 NOT FAIL AT UPPER LIMITS OF TESTINO
Figure 14. Failure-Head-Numbers for the European Perfotest on Class PB and Class PM EIFS.
31
30E
trw
rz20
z15
X 0w -
U-0U
Hi-PB 82-PB Al-PB E4-PB E3-PB E2-PB A2-PB F2-PB H3-PB
H2-PB H4-PB El-PB G1-P9 Fl-PB G2.PB Ba-PB G3-PB
SYSTEM IDENTIFICATIONDITE OD NOT PASS AT LOWER LIMITS OF TESTING
Figure 15. Fail ure-Head-Numbers for the European Perfotest Using Standard Failure Criterionon Class PB EIFS.
10
cc:w
MI.D
6 -
z
4-J
LL0 2--J
U-
0H1-PM Cl-PM A3-PM D -PM F3-PM 02-PM
SYSTEM IDENTIFICATION
-SYSTEM DID NOT FAIL AT UPPER LIMITS OF TESTING
Figure 16. Failure-Head-Numbers for the European Perfotest Using Standard Failure Criterionon Class PM EIFS.
32
20EEcc
z
10
H2-PB A1-PB E4-PB HI-PB E3-PB G2-PB B3-PB F2-PB "3-PB
B2-PB El-PB G1-PB H4-PB F1-PB A2-PB E2-PB GI-PB
SYSTEM IDENTIFICATION
Figure 17. Failure-Head-Numbers for the European Perfotest Using Refusal Failure Criterion onClass PB EIFS.
E 6
Ecc
w4
z6w
o
Wj 2
0Cl -PM A3-PM 81-PM W1)-PM F3-PM 02-PM
SYSTEM IDENTIFICATION°SYSTEM DID NOT FAIL AT UPPER LIMITS OF TESTING
Figure 18. Failure-Head-Numbers for the European Perfotest Using Refusal Failure Criterion onClass PM EIFS.
33
4 DISCUSSION
The purpose in conducting these impact tests on EIFS was to determine the validity of each test foruse with the systems. To do this, it is necessary to use common knowledge of these systems and makesome intelligent assumptions.
EIFS are composite systems that rely on several components working together to achieve optimumperformance. In terms of system strength, or impact resistance, the base coat is the component thatdetermines this property. To make assumptions about the impact resistance of a given EIFS, you mustlook at how the individual components of the base coat combine. The makeup of the components in thebase coat can reveal clues about the strength and impact resistance of the base coat.
In class PB EIFS, two factors make a difference in the impact resistance: (1) the type ofreinforcement and (2) the chemical composition (cementitious or synthetic) of the base coat. Of the classPB systems tested, four different combinations of reinforcing fabric were used (the makeup of each classPB is given in Table 1). They are as follows:
1. One layer of standard mesh,2. Two layers of standard mesh,3. One layer of standard mesh and one layer of high impact mesh, and4. Two layers of high impact mesh.
The chemical composition of the base coat is either cementitious or synthetic (all polymer).
From this information, some assumptions about the relative impact resistance of class PB systemscan be made. These assumptions are as follows:
1. A class PB system with two layers of standard reinforcing mesh has a greater impact resistancethan one with a single layer of reinforcing mesh.
2. A class PB system with one layer of standard reinforcing mesh and one layer of high impactreinforcing mesh has a greater impact resistance than one with either one or two layers of standardreinforcing fabric.
3. A class PB system with two layers of high impact reinforcing mesh has a greater impactresistance than the other three combinations listed above.
4. Assumptions 1-3 are more valid when comparing class PB systems within a single manufacturerthan when comparing class PB systems between different manufacturers.
5. A class PB system with a synthetic base coat will have a greater impact resistance than one witha cementitious base coat, provided the reinforcement and thickness are the same.
6. A class PB system with a thicker base coat will have a greater impact resistance than one witha thinner base coat, provided the reinforcement and chemical composition are the same.
Class PM EIFS have fewer variables controlling the properties of the base coat than class PBsystems. The reinforcement mesh in class PM systems serves more to key the base coat to the insulationthan to reinforce the base coat. Also, while the base coat of the different class PM systems may havechemical composition differences, they all are cementitious. This makes differences between the systerms
34
harder to quantify; the only quantifiable difference is the base coat thickness. Therefore, the mainassumption one can make with class PM EIFS is that a thicker base coat increases the impact resistance.
Using the above assumptions, researchers compared the experimental results to what would beexpected for each of the different test methods. This analysis was to help determine the most validmethod(s) for EIFS.
Gardner, 2- and 4-lb
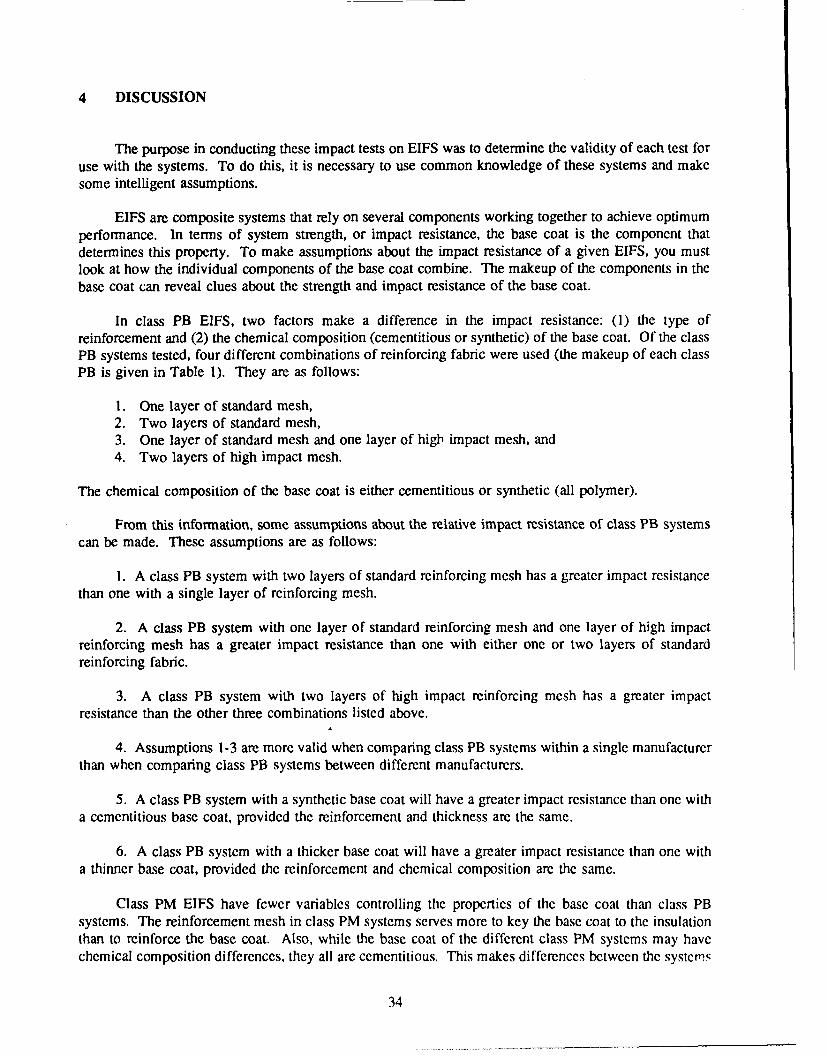
The first concern in using the Gardner impact test is the difference between using the 2-lb and 4-lbweight. For many materials, the rate of loading in an impact test can make a difference in the results.Therefore, the difference in the rate of loading for the 2-lb and 4-lb weights were examined. For a givenimpact energy, the drop height for the 2-lb weight would need to be twice as high as the drop height forthe 4-lb weight. While the impact energy would be the same, the 2-lb weight would be falling 1.44 timesfaster than the 4-lb weight upon impact. To determine if the rate of loading was a factor between thesetests, the MFEs for the 2-lb test were plotted against the MFEs for the 4-lb test as shown in Figure 19.The dotted line in this graph shows the theoretical one-to-one relationship that would be expected betweenthe two tests if rate-of-loading were not a factor. The data points correlate very closely to the theoreticalline. Therefore, it appears to make little difference whether the 2-lb or the 4-lb weight is used for the test.The 4-lb weight is preferred since the 2-lb weight did not provide enough energy to cause failure in allthe systems.
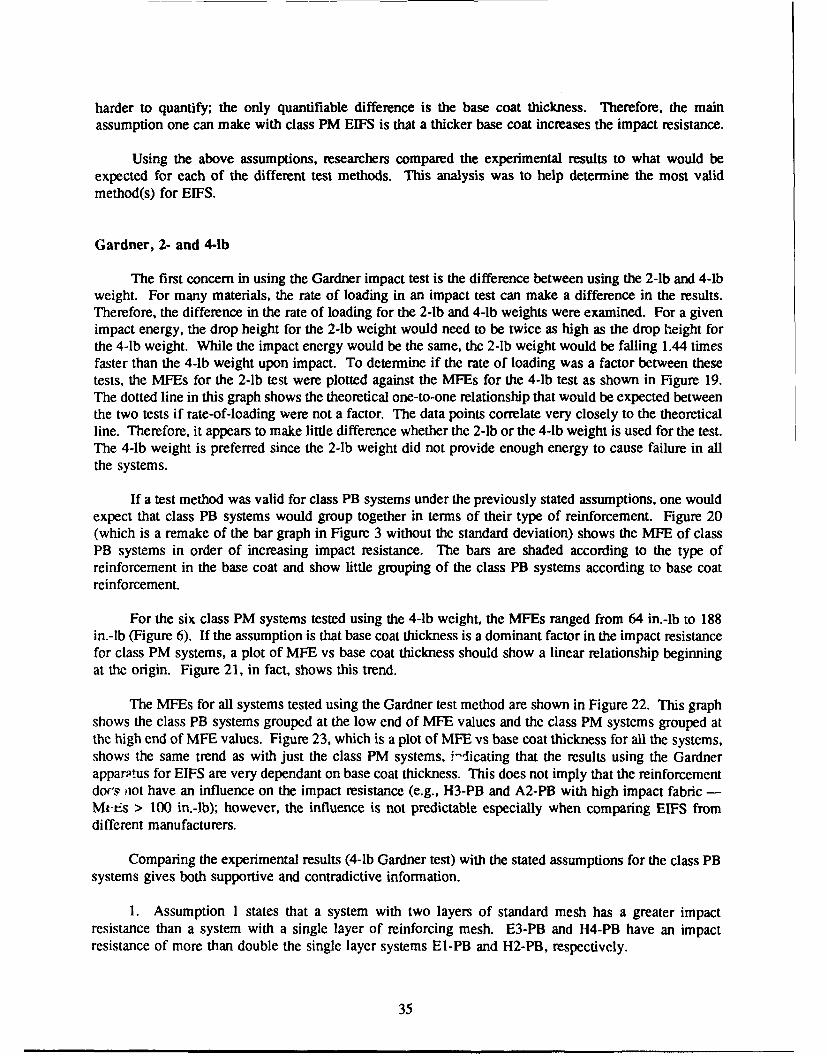
If a test method was valid for class PB systems under the previously stated assumptions, one wouldexpect that class PB systems would group together in terms of their type of reinforcement. Figure 20(which is a remake of the bar graph in Figure 3 without the standard deviation) shows the MFE of classPB systems in order of increasing impact resistance. The bars are shaded according to the type ofreinforcement in the base coat and show little grouping of the class PB systems according to base coatreinforcement.
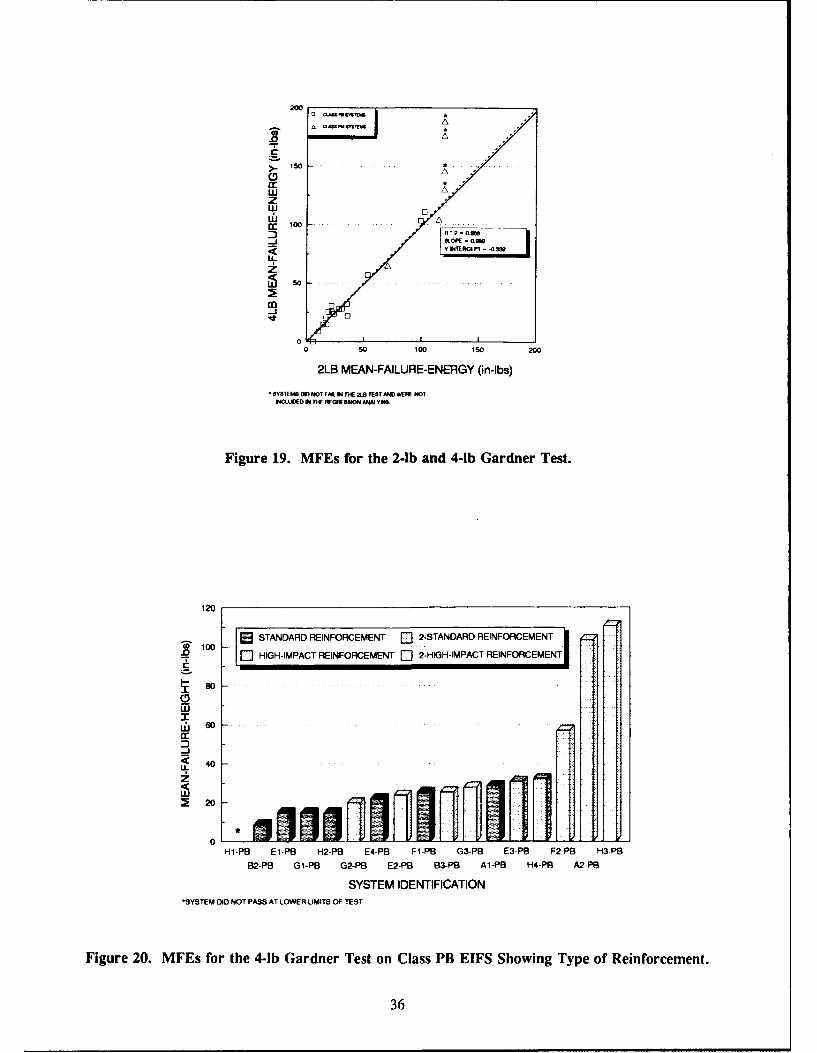
For the six class PM systems tested using the 4-lb weight, the MFEs ranged from 64 in.-lb to 188in.-lb (Figure 6). If the assumption is that base coat thickness is a dominant factor in the impact resistancefor class PM systems, a plot of MFE vs base coat thickness should show a linear relationship beginningat the origin. Figure 21, in fact, shows this trend.
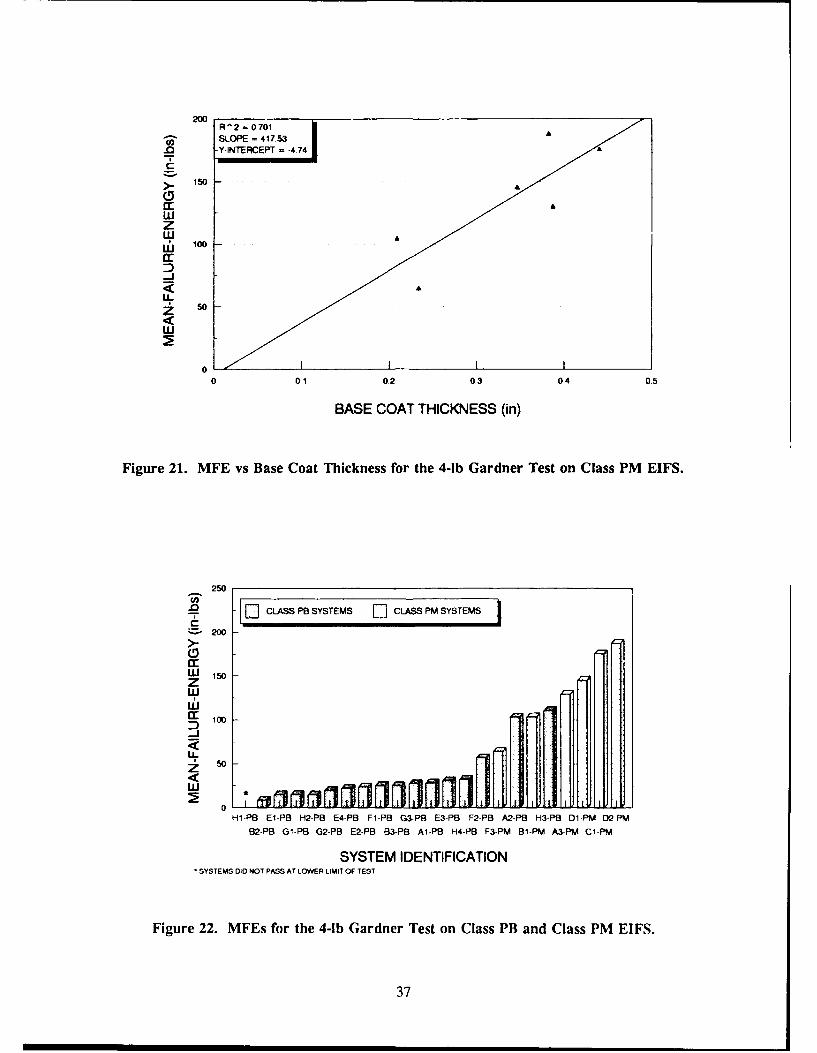
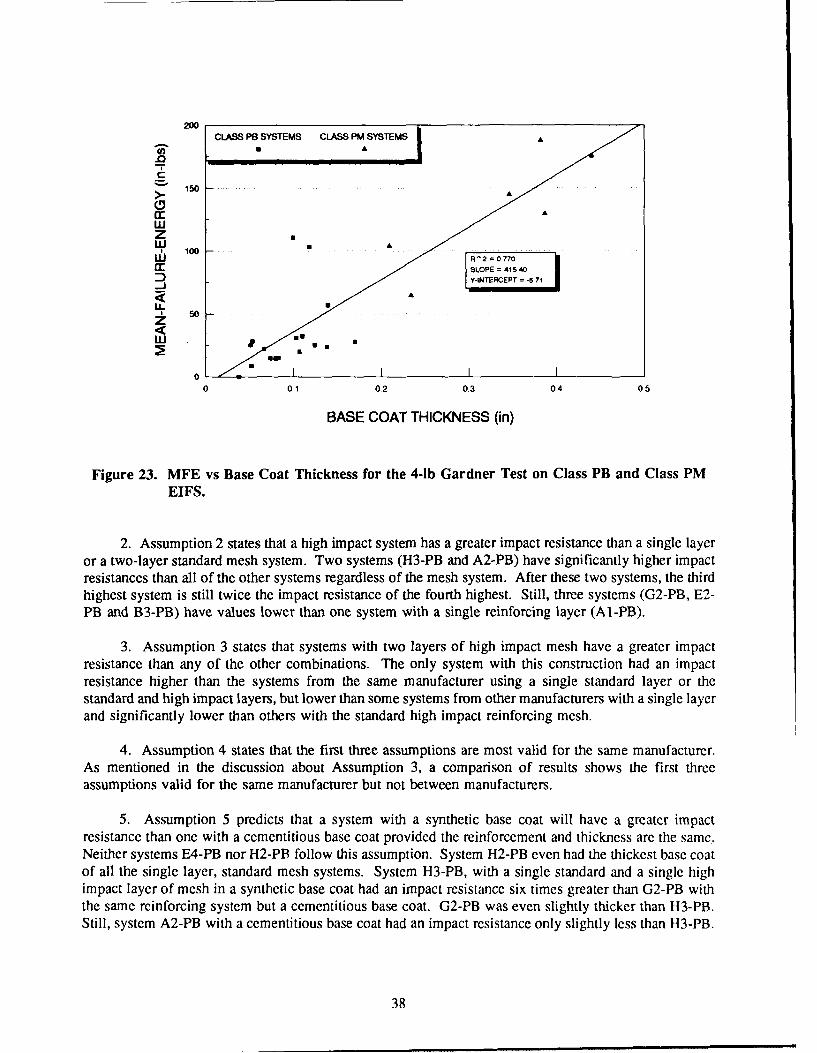
The MFEs for all systems tested using the Gardner test method are shown in Figure 22. This graphshows the class PB systems grouped at the low end of MFE values and the class PM systems grouped atthe high end of MFE values. Figure 23, which is a plot of MFE vs base coat thickness for all the systems,shows the same trend as with just the class PM systems, i-licating that the results using the Gardnerapparqtus for EIFS are very dependant on base coat thickness. This does not imply that the reinforcementdorl not have an influence on the impact resistance (e.g., H3-PB and A2-PB with high impact fabric -Mitts > 100 in.-lb); however, the influence is not predictable especially when comparing EIFS fromdifferent manufacturers.
Comparing the experimental results (4-lb Gardner test) with the stated assumptions for the class PBsystems gives both supportive and contradictive information.
1. Assumption 1 states that a system with two layers of standard mesh has a greater impactresistance than a system with a single layer of reinforcing mesh. E3-PB and H4-PB have an impactresistance of more than double the single layer systems El-PB and H2-PB, respectively.
35
WAC 0
z
wo 0
Rm-n
0
-J
0 50 100 150 200
2LB MEAN-FAILURE-ENERGY (in-lbs)
SSYSeTEM DOD NOT FAIL IN THE 2LB TST AM) WERE NOTIdLW . IN TWE IWOWSSIIN ~A 61Y6,
Figure 19. MFEs for the 2-lb and 4-lb Gardner Test.
120
Sf STANDARD REINFORCEMENT E 2-STANDARD REINFORCEMENT
E3 HIGH-IMPACT REINFORCEMENT • 2-HIGH-MPACTR
80 .
wi 60
_J
< 40
z
~20
H1-PB El-PB H2-PB E4-PB Fl-PB G3-PB E3-PB F2-PB H3-PB
B2-PB G1-PB G2-PB E2-PB B3-PB A1-PB H4-PB A2-PB
SYSTEM IDENTIFICATION"*SYSTEM DID NOT PASS AT LOWER LIMITS OF TEST
Figure 20. MFEs for the 4-lb Gardner Test on Class PB EIFS Showing Type of Reinforcement.
36
200-oR2 = 0.701 ISLOPE = 417.53
ml Y-INTERCEPT =-4.74AC
150
0A
wzw S100
UJ
~50
00 0.1 0.2 0.3 04 05
BASE COAT THICKNESS (in)
Figure 21. MFE vs Base Coat Thickness for the 4-lb Gardner Test on Class PM EIFS.
250
Io CLASS PB SYSTEMS [] CLASS PM SYSTEMSC
S200C,crW 150zLU
LL50
LJ
0HI-PB El-PB H2-PB E4-PB F1-PB G3-PB E3-PB F2-PB A2-PB H3-PB Dl-PM D2-PM
B2-PB GI-PB G2-PB E2-PB B3-PB A1-PB H4-PB F3-PM BI-PM A3-PM Cl-PM
SYSTEM IDENTIFICATION- SYSTEMS DID NOT PASS AT LOWER LIMIT OF TEST
Figure 22. MFEs for the 4-lb Gardner Test on Class PB and Class PM EIFS.
37
20CLASS PB SYSTEMS CLASS PM SYSTEMS
• 150
0An-C!,
WA
z*.100 0:: / ISLOPE = 415 40
s ,
Uj a
00 0o1 0.2 0.3 0.4 05
BASE COAT THICKNESS (in)
Figure 23. MFE vs Base Coat Thickness for the 4-lb Gardner Test on Class PB and Class PMEIFS.
2. Assumption 2 states that a high impact system has a greater impact resistance than a single layeror a two-layer standard mesh system. Two systems (H3-PB and A2-PB) have significantly higher impactresistances than all of the other systems regardless of the mesh system. After these two systems, the thirdhighest system is still twice the impact resistance of the fourth highest. Still, three systems (G2-PB, E2-PB and B3-PB) have values lower than one system with a single reinforcing layer (Al-PB).
3. Assumption 3 states that systems with two layers of high impact mesh have a greater impactresistance than any of the other combinations. The only system with this construction had an impactresistance higher than the systems from the same manufacturer using a single standard layer or thestandard and high impact layers, but lower than some systems from other manufacturers with a single layerand significantly lower than others with the standard high impact reinforcing mesh.
4. Assumption 4 states that the first three assumptions are most valid for the same manufacturer.As mentioned in the discussion about Assumption 3, a comparison of results shows the first threeassumptions valid for the same manufacturer but not between manufacturers.
5. Assumption 5 predicts that a system with a synthetic base coat will have a greater impactresistance than one with a cementitious base coat provided the reinforcement and thickness are the same.Neither systems E4-PB nor H2-PB follow this assumption. System H2-PB even had the thickest base coatof all the single layer, standard mesh systems. System H3-PB, with a single standard and a single highimpact layer of mesh in a synthetic base coat had an impact resistance six times greater than G2-PB withthe same reinforcing system but a cementitious base coat. G2-PB was even slightly thicker than 113-PB.Still, system A2-PB with a cementitious base coat had an impact resistance only slightly less than H3-PB.
38
6. Assumption 6 states that a thicker base coat will result in a higher impact resistance given thesame reinforcement and chemical composition. Although analysis of the data shows a general trend tosupport this assumption, several exceptions are noted. System A2-PB has almost twice the impact resis-tance of F2-PB while only 0.02 in. thinner than F2-PB. Fl-PB and Al-PB recorded greater impact resis-tances than the other single layer mesh, cementitious base coat systems, yet they have significantly thinnerbase coats. H I-PB with a base coat thickness of 0.037 in. was obviously below some lower limit for anykind of acceptable properties.
The above discussion indicates that the variables controlling the impact resistance of class PB EIFSsystems relative to the Gardner impact test method are not independent of each other. This interdepend-ence makes the interpretation of the results difficult.
Given all the above considerations, the Gardner test method does not appear to be a very goodmethod for predicting the impact resistance of both class PB and PM EIFS. Its generally poor correlationwith system properties other than possibly thickness (most acceptable for class PM systems), limit theusefulness of the test method in predicting long-term system performance under various, real-world impactsituations. However, the method can provide a relative ranking of the systems with regards to the veryspecific type of impact as used in the test (i.e., a puncture/penetration type impact).
Falling Ball, 2-and 4-lb
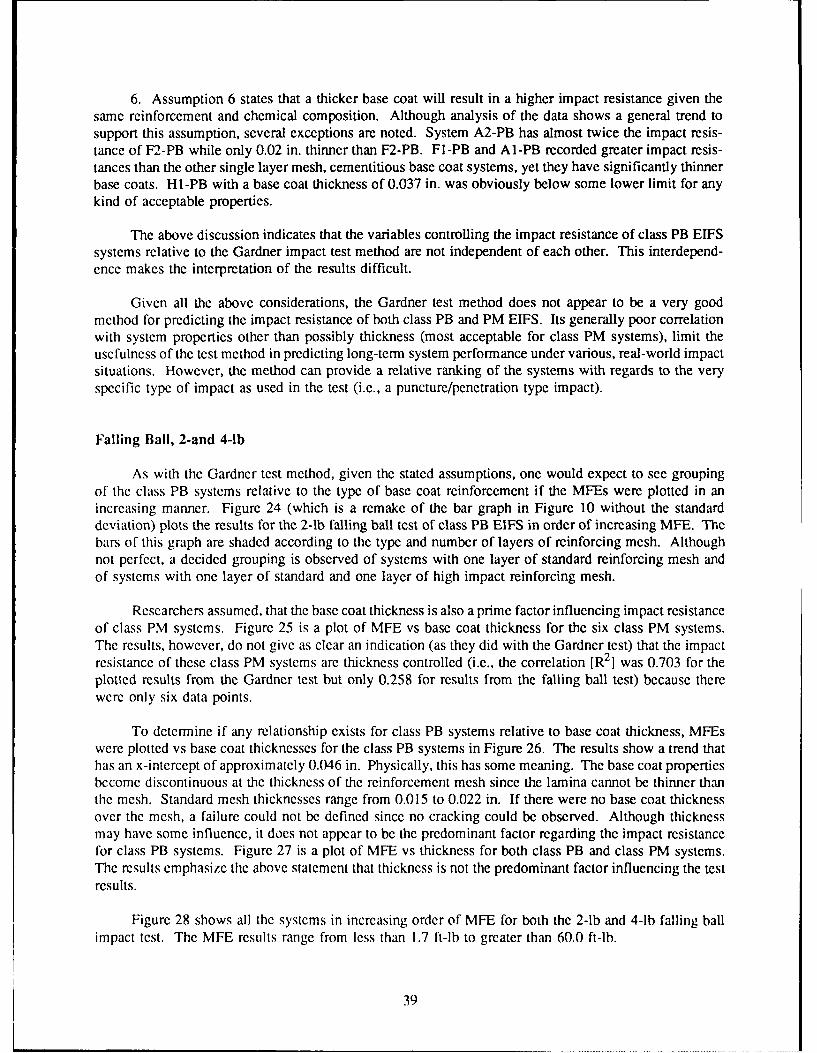
As with the Gardner test method, given the stated assumptions, one would expect to see groupingof the class PB systems relative to the type of base coat reinforcement if the MFEs were plotted in anincreasing manner. Figure 24 (which is a remake of the bar graph in Figure 10 without the standarddeviation) plots the results for the 2-lb falling ball test of class PB EIFS in order of increasing MFE. Thebars of this graph are shaded according to the type and number of layers of reinforcing mesh. Althoughnot perfect, a decided grouping is observed of systems with one layer of standard reinforcing mesh andof systems with one layer of standard and one layer of high impact reinforcing mesh.
Researchers assumed, that the base coat thickness is also a prime factor influencing impact resistanceof class PM systems. Figure 25 is a plot of MFE vs base coat thickness for the six class PM systems.The results, however, do not give as clear an indication (as they did with the Gardner test) that the impactresistance of these class PM systems are thickness controlled (i.e., the correlation [R2] was 0.703 for theplotted results from the Gardner test but only 0.258 for results from the falling ball test) because therewere only six data points.
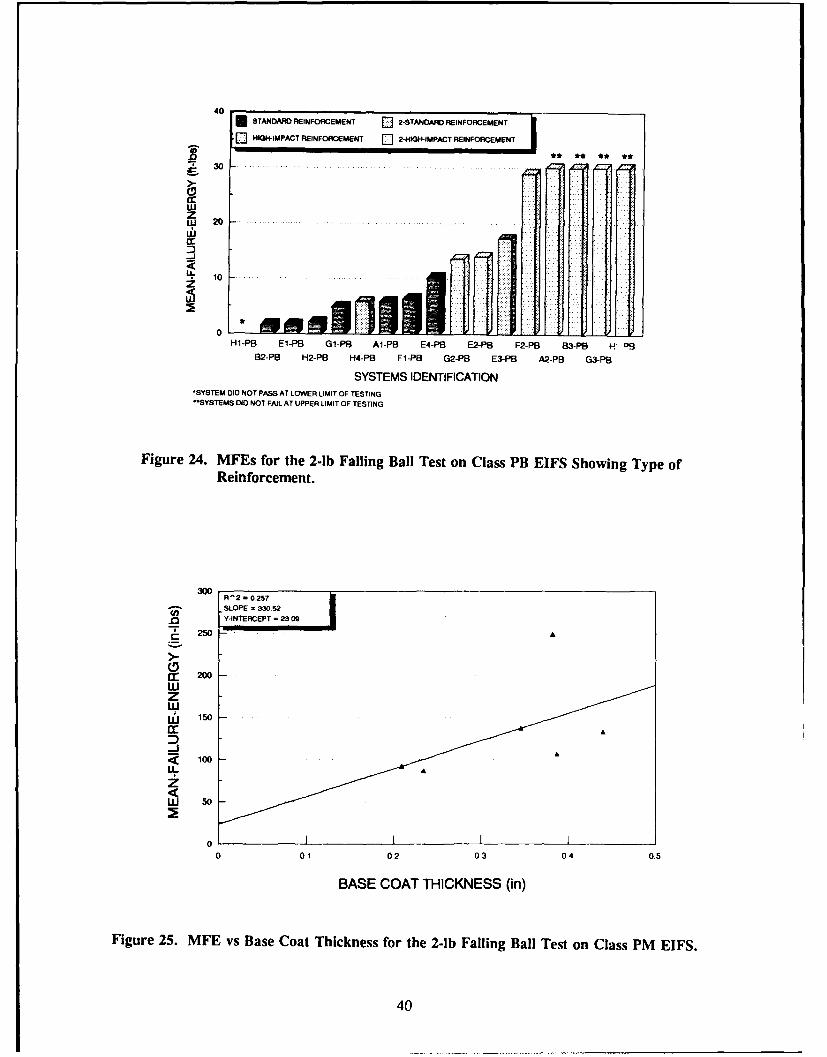
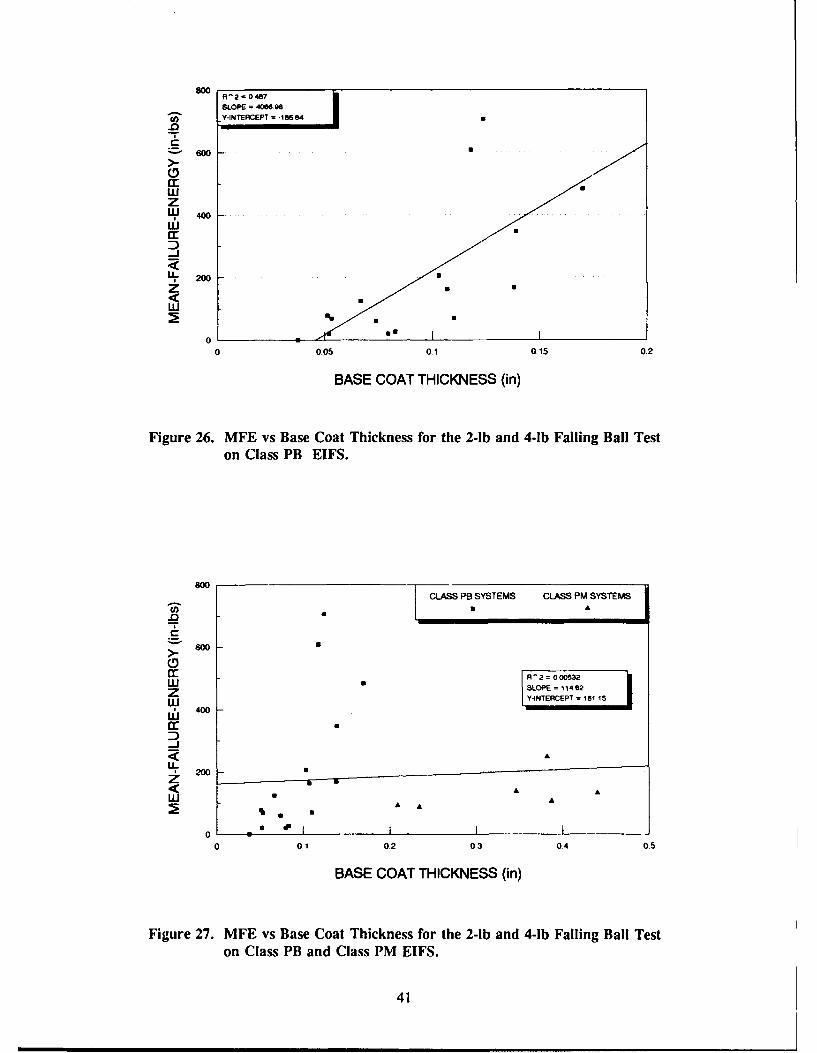
To determine if any relationship exists for class PB systems relative to base coat thickness, MFEswere plotted vs base coat thicknesses for the class PB systems in Figure 26. The results show a trend thathas an x-intercept of approximately 0.046 in. Physically, this has some meaning. The base coat propertiesbecome discontinuous at the thickness of the reinforcement mesh since the lamina cannot be thinner thanthe mesh. Standard mesh thicknesses range from 0.015 to 0.022 in. If there were no base coat thicknessover the mesh, a failure could not be defined since no cracking could be observed. Although thicknessmay have some influence, it does not appear to be the predominant factor regarding the impact resistancefor class PB systems. Figure 27 is a plot of MFE vs thickness for both class PB and class PM systems.The results emphasize the above statement that thickness is not the predominant factor influencing the testresults.
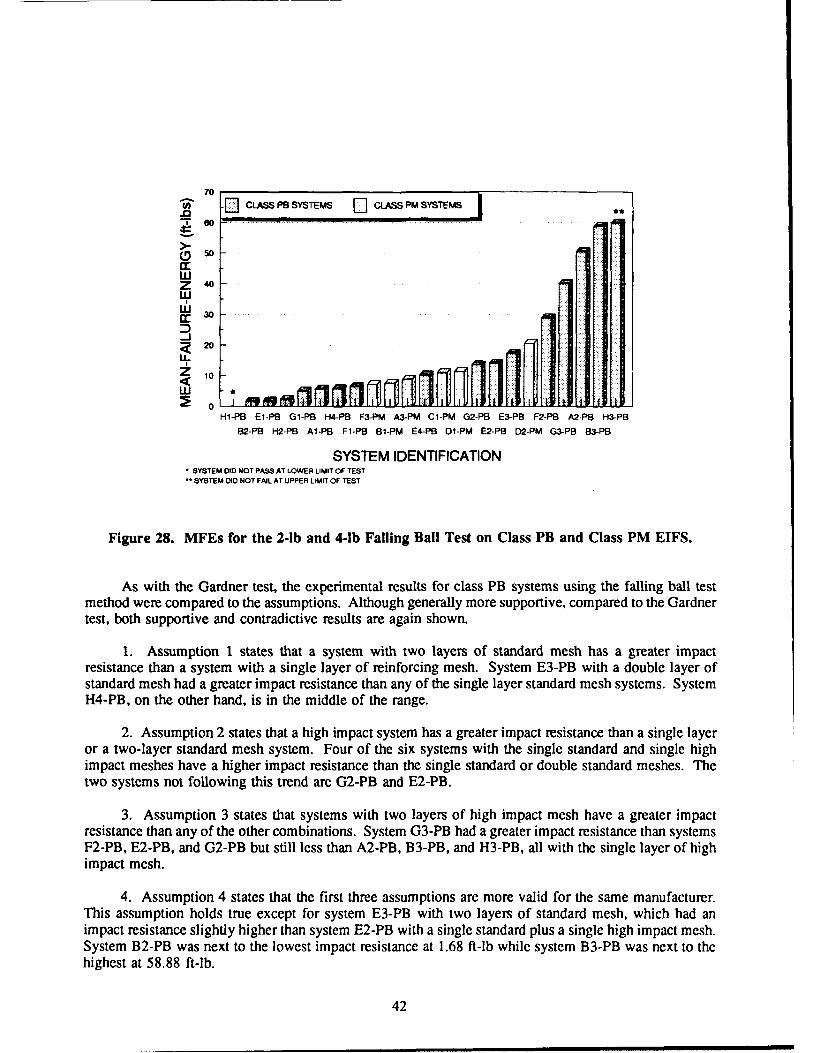
Figure 28 shows all the systems in increasing order of MFE for both the 2-lb and 4-lb falling ballimpact test. The MFE results range from less than 1.7 ft-lb to greater than 60.0 ft-lb.
39
40 a STANDARD REINFORCEMENT Q 2-STANDARD REINFORCEMENT
S[3N3--IMPACT REINFORCEMENT [3 2-HIGH-MPACT REINFORCEMENT
30
wzwu 20
UL..10 ..z
0Hi-PB El-PB 01-PB Al-PB E4-PB E2-PB F2-PB Ba-PBI H' PS
82-PB H2-PB H4-PB Fl-PB 02-PB E3-PB A2-PB 03-PB
SYSTEMS IDENTrIFICATION'SYSTEM DID NOT PASS AT LOWER LIMIT OF TESTING-SYSTEMS DID NOT FAIL AT UPPER UIMIT OF TESTING
Figure 24. MFEs for the 2-lb Falling Ball Test on Class PB EIFS Showing Type ofReinforcement.
30R^2 = 0257-SLOPE = 330 52
250 ~P =3
.:200wz
III ii
w 150
a:
5100
0 . I0 01 02 03 04 05
BASE COAT THICKNESS (in)
Figure 25. MFE vs Base Coat Thickness for the 2-lb Falling Ball Test on Class PM EIFS.
40
R-2 = 0487
SLOPE = 4066.98.Y-INTERCEPT = -185,84
c.
wz
wa:a
-JzUw
%U
0 ** I
0 0.05 0.1 0.15 0.2
BASE COAT THICKNESS (in)
Figure 26. MFE vs Base Coat Thickness for the 2-lb and 4-lb Falling Ball Teston Class PB EIFS.
80080CLASS PB SYSTEMS CLASS PM SYSTEMS
Ui
.0
UjIT 40 R^- O~?W * ILOPE = 14822
z Y4NTERCEPTl= 11 1
cJ
<Iur, o0 •
LL200 -<w A A
U " ' I I ,0 I
0 0.1 0,2 03 04 05
BASE COAT THICKNESS (in)
Figure 27. MFE vs Base Coat Thickness for the 2-lb and 4-lb Falling Ball Teston Class PB and Class PM EIFS.
41
70
-E]I CLASS PB SYSrEms [] cLASS PM SYSrEMS00
•'-
0 so
wZ 40wwa: 30
~20
10
w 1H1-PB El-PB G1-PB H4-PB F3-PM A3-PM Cl-PM G2-PB E3-PB F2-PB A2-PB H3-PB
B2-PB H2-PB Al-PB Fl-PB BI-PM E4-PB DI-PM E2-PB D2-PM G3-PB B3-PB
SYSTEM IDENTIFICATIONSYSTEM DID NOT PASS AT LOWER LIMIT OF TESTSYSTEM DID NOT FAIL AT UPPER LIMIT OF TEST
Figure 28. MFEs for the 2-lb and 4-lb Falling Ball Test on Class PB and Class PM EIFS.
As with the Gardner test, the experimental results for class PB systems using the falling ball testmethod were compared to the assumptions. Although generally more supportive, compared to the Gardnertest, both supportive and contradictive results are again shown.
1. Assumption 1 states that a system with two layers of standard mesh has a greater impactresistance than a system with a single layer of reinforcing mesh. System E3-PB with a double layer ofstandard mesh had a greater impact resistance than any of the single layer standard mesh systems. SystemH4-PB, on the other hand, is in the middle of the range.
2. Assumption 2 states that a high impact system has a greater impact resistance than a single layeror a two-layer standard mesh system. Four of the six systems with the single standard and single highimpact meshes have a higher impact resistance than the single standard or double standard meshes. Thetwo systems not following this trend are G2-PB and E2-PB.
3. Assumption 3 states that systems with two layers of high impact mesh have a greater impactresistance than any of the other combinations. System G3-PB had a greater impact resistance than systemsF2-PB, E2-PB, and G2-PB but still less than A2-PB, B3-PB, and H3-PB, all with the single layer of highimpact mesh.
4. Assumption 4 states that the first three assumptions are more valid for the same manufacturer."This assumption holds true except for system E3-PB with two layers of standard mesh, which had animpact resistance slightly higher than system E2-PB with a single standard plus a single high impact mesh.System B2-PB was next to the lowest impact resistance at 1.68 ft-lb while system B3-PB was next to thehighest at 58.88 ft-lb.
42
5. Assumption 5 predicts that a system with a synthetic base coat will have a greater impactresistance than one with a cementitious base coat, provided the reinforcement and thickness are the same.For the single standard mesh systems, system E4-PB with a synthetic base coat had the highest impactresistance. Its thickness was only slightly greater than half of the systems tested. H2-PB, also a syntheticbase coat system, had an impact resistance significantly lower than E4-PB even though H2-PB had thegreatest thickness of all the single standard mesh systems.
6. Assumption 6 states that a thicker base coat will result in a higher impact resistance given thesame reinforcement and chemical composition. Although analysis of the data shows a general trend tosupport this assumption, as with the Gardner test, exceptions are noted. Systems A2-PB and F2-PB hadalmost the same impact resistance even though A2-PB was 0.02 in. thinner. System H 1-PB with a basecoat thickness of 0.037 in. was obviously below some lower limit for any kind of acceptable properties.
The above discussion again indicates that the variables controlling the impact resistance of class PBEIFS systems as determined by the falling ball test are not completely independent of each other. Still,the assumptions predict the falling ball results closer than they do for the Gardner test.
The test results from the falling ball method generally reflect the postulated controlling factors ofclass PB systems. Although the correlation of the results to system composition for class PM systems isnot as good as desired, the falling ball method simulates the geometry and forces of many real-worldimpacts (e.g, baseball or large rock). Therefore, the falling ball test is considered a practical method formeasuring impact resistance for all EIFS.
Perfotest
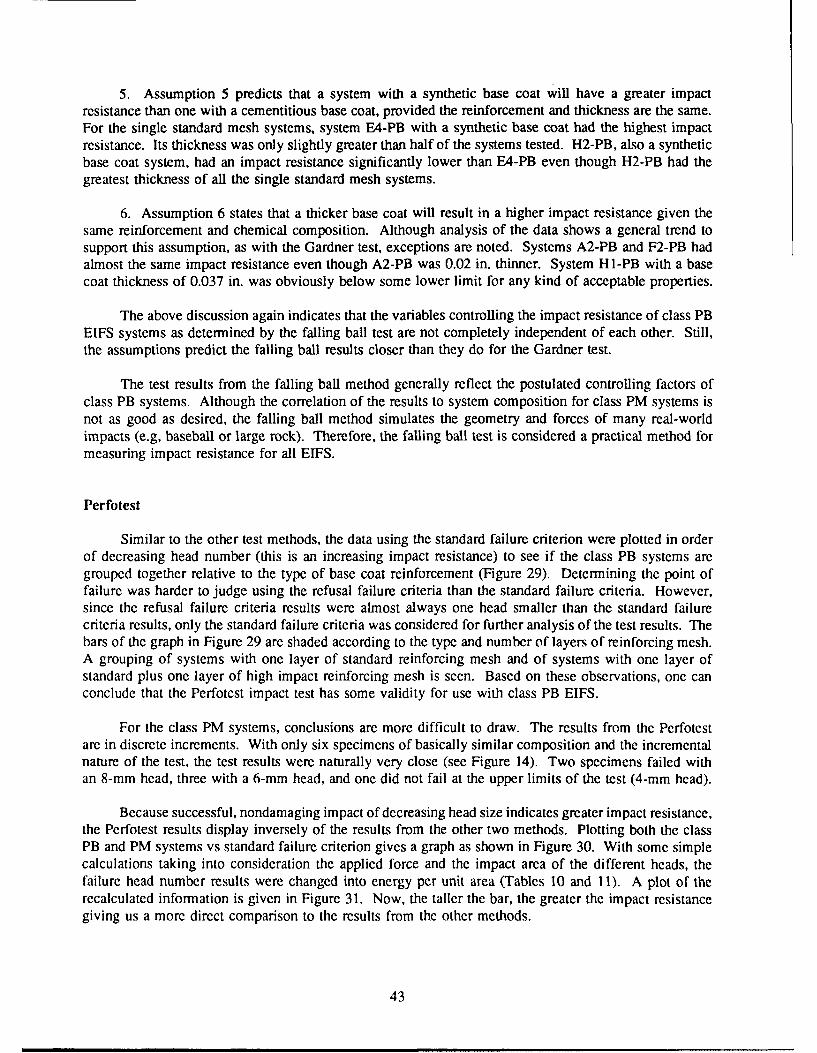
Similar to the other test methods, the data using the standard failure criterion were plotted in orderof decreasing head number (this is an increasing impact resistance) to see if the class PB systems aregrouped together relative to the type of base coat reinforcement (Figure 29). Determining the point offailure was harder to judge using the refusal failure criteria than the standard failure criteria. However,since the refusal failure criteria results were almost always one head smaller than the standard failurecriteria results, only the standard failure criteria was considered for further analysis of the test results. Thebars of the graph in Figure 29 are shaded according to the type and number of layers of reinforcing mesh.A grouping of systems with one layer of standard reinforcing mesh and of systems with one layer ofstandard plus one layer of high impact reinforcing mesh is seen. Based on these observations, one canconclude that the Perfotest impact test has some validity for use with class PB EIFS.
For the class PM systems, conclusions are more difficult to draw. The results from the Perfotestare in discrete increments. With only six specimens of basically similar composition and the incrementalnature of the test, the test results were naturally very close (see Figure 14). Two specimens failed withan 8-mm head, three with a 6-mm head, and one did not fail at the upper limits of the test (4-mm head).
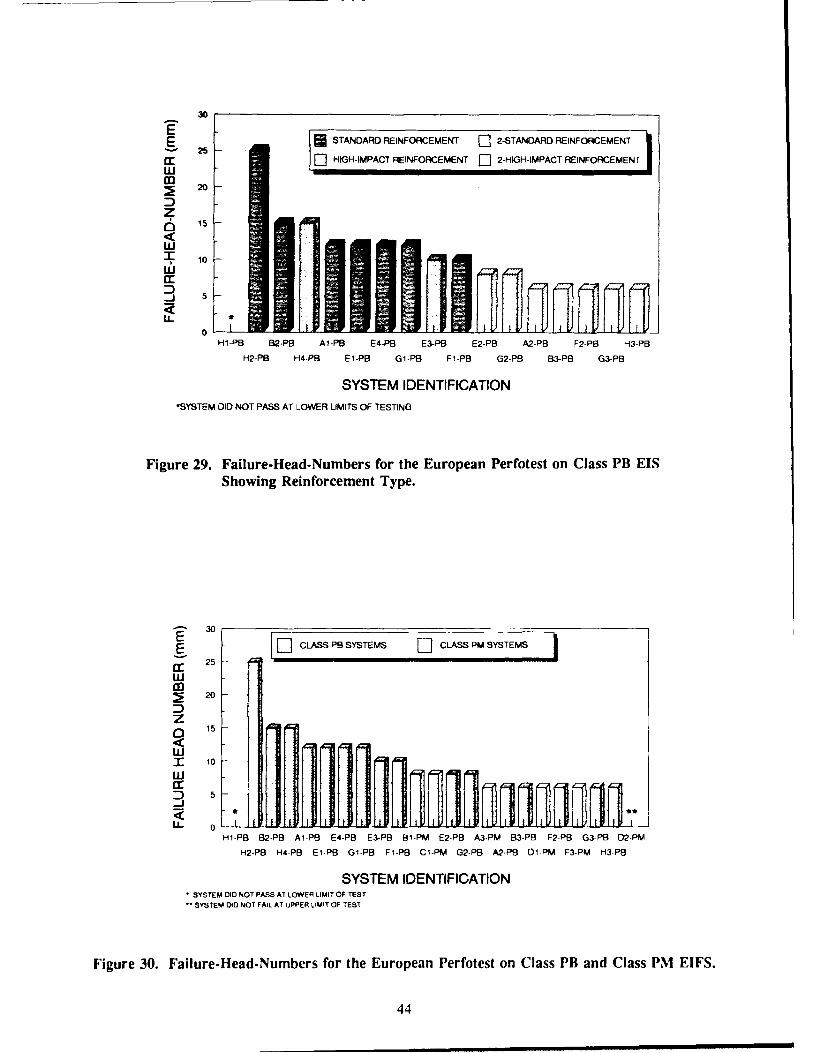
Because successful, nondamaging impact of decreasing head size indicates greater impact resistance,the Perfotest results display inversely of the results from the other two methods. Plotting both the classPB and PM systems vs standard failure criterion gives a graph as shown in Figure 30. With some simplecalculations taking into consideration the applied force and the impact area of the different heads, thefailure head number results were changed into energy per unit area (Tables 10 and 11). A plot of therecalculated information is given in Figure 31. Now, the taller the bar, the greater the impact resistancegiving us a more direct comparison to the results from the other methods.
43
30
E *5 STANDARD REINFORCEMENT C] 2-STANDARD REINFORCEMENT
Er HIGH-IMPACT REINFORCEMENT []2-HIGH-IMPACT REINFORCEMENT
20
z15
0Hi-PB B2-PE3 Al-PB E4-PB E3-PB E2-PB A2-PB F2-PB H3-PB
H2-PB H4-PB3 El-PB Gi-PB Fl-P`B G2-PB 83-PB G3-PB
SYSTEM IDENTIFICATION*SYSTEM DID NOT PASS AT LOWER LIMITS OF TESTING
Figure 29. Failure-Head- Numbers for the European Perf'otest on Class PB ETSShowing Reinforcement Type.
30 _ _ _ _
E CLASS PB SYSTEMS []CLASS PM SYSTEMSE 25 F
20
z0)15 -
S 10
ccZ) 5-j
LL 0 B1II 1 ,Hi-PB B2-PB A1-PB E4-PB E3-PB Bl-PM E2-PB A3-PM Ba-PB P2-PB G3-PB D2-PM
H2-PB H4-PB El PB G1-PB Fl-P`B Cl-PM G2-PB A2-PB D1-PM F3-PM H3-PB
SYSTEM IDENTIFICATION*SYSTEM DID NOT PASS AT LOWER LIMIT OF TEST
SYSTEM DID NOT FAIL AT UPPER LIMIT OF TEST
Figure 30. Fail ure-Head-Numbers for the European Perfotest on Class PB and Class PM EIFS.
44
-- 804J [E] CLASS PB SYSTEMS [] CLASS PM SYSTEMS
60
cc 40
Z 0W H1-PB B2-PB Al-PB E4-PB E3-PB B1-PM E2-PB A3-PM B3-PB F2-PB G3-PB D2-PM
H2-PB H4-PB El -PB G1 -PB F1-PB C1-PM G2-PB A2-PB D1 -PM F3-PM H3-PB
SYSTEM IDENTIFICATIONSYSTEM DID NOT PASS AT LOWER LIMIT OF TESTSYSTEM DID NOT FAIL AT UPPER LIMfT OF TEST
Figure 31. Energy per Unit Area for the European Perfotest on Class PB andClass PM EIFS.
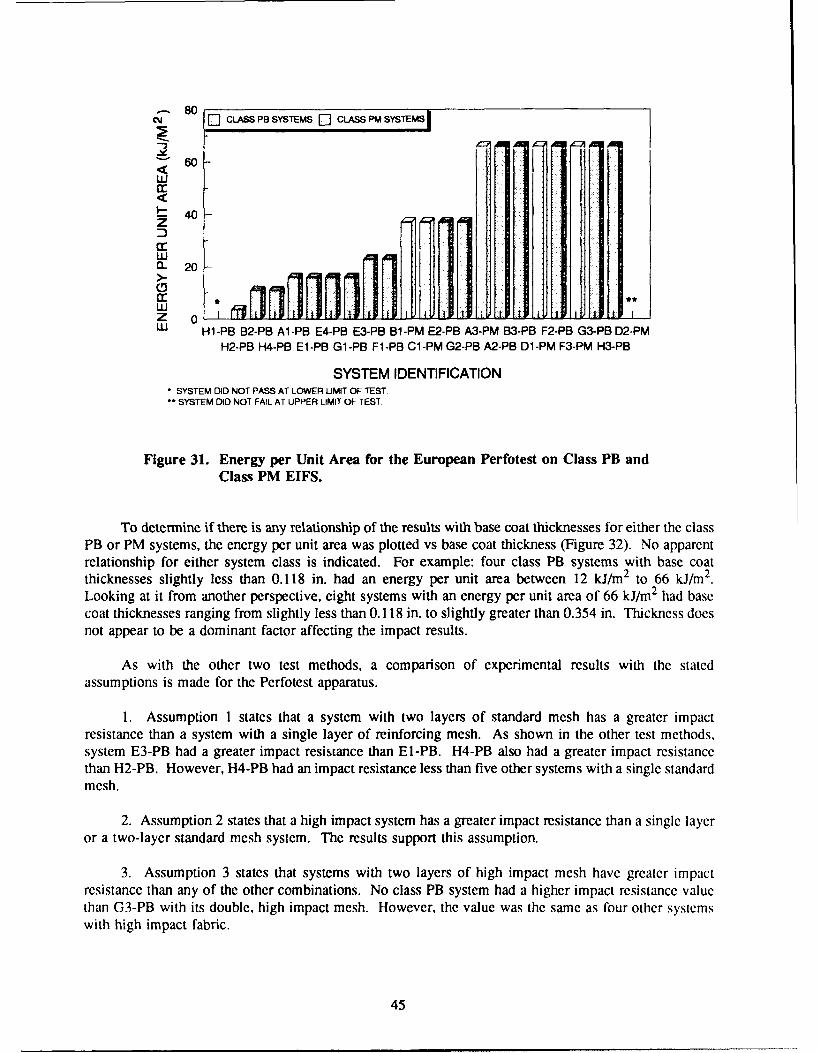
To determine if there is any relationship of the results with base coat thicknesses for either the classPB or PM systems, the energy per unit area was plotted vs base coat thickness (Figure 32). No apparcntrelationship for either system class is indicated. For example: four class PB systems with base coatthicknesses slightly less than 0.118 in. had an energy per unit area between 12 kJ/m 2 to 66 kJ/m 2.Looking at it from another perspective, eight systems with an energy per unit area of 66 kJ/m 2 had basecoat thicknesses ranging from slightly less than 0.118 in. to slightly greater than 0.354 in. Thickness doesnot appear to be a dominant factor affecting the impact results.
As with the other two test methods, a comparison of experimental results with the statedassumptions is made for the Perfotest apparatus.
1. Assumption I states that a system with two layers of standard mesh has a greater impactresistance than a system with a single layer of reinforcing mesh. As shown in the other test methods,system E3-PB had a greater impact resistance than El-PB. H4-PB also had a greater impact resistancethan H2-PB. However, H4-PB had an impact resistance less than five other systems with a single standardmesh.
2. Assumption 2 states that a high impact system has a greater impact resistance than a single layeror a two-layer standard mesh system. The results support this assumption.
3. Assumption 3 states that systems with two layers of high impact mesh have greater impactresistance than any of the other combinations. No class PB system had a higher impact resistance valuethan G3-PB with its double, high impact mesh. However, the value was the same as four other systemswith high impact fabric.
45
60 CLASS PB SYSTEMS CLASS PM SYSTEMSAU mu * AA A
Wwq:
Z 4 0
ccw
(~20
wzU
w0
0 2 4 6 8 10 12
BASE COAT THICKNESS (mm)
Figure 32. Energy per Unit Area vs Base Coat Thickness for the European Perfotest on ClassPB and Class PM EIFS.
4. Assumption 4 states that the first three assumptions are more valid for the same manufacturer.Within the limitation of the incremental nature of the results, this assumption is supported by theexperimental results.
5. Assumption 5 predicts that a system with a synthetic base coat will have a greater impactresistance than one with a cementitious base coat, provided the reinforcement and thickness are the same.System F1-PB had one level higher impact resistance than E4-PB even though Fl-PB was 0.02 in. thinner.H2-PB, another single-layer mesh, synthetic base coat system, was next to the worst impact resistanceeven though it had the greatest thickness of all the single mesh systems. H4-PB had an impact rating twoincrements lower than E3-PB. System H3-PB was rated better than two other high impact mesh systemsbut the same as three others. A synthetic base coat did not seem to help the impact resistance much asmeasured by the Perfotest.
6. Assumption 6 states that a thicker base coat will result in a higher impact resistance given thesame reinforcement and chemical composition. How the results conform to this assumption is not veryobvious. Several systems with varying thicknesses had the same impact resistance value. This is due tothe incremental nature of the results.
Although the results as a whole support the assumptions made, the discrete, incremental results makeexact correlation difficult.
46
Based on the previous discussion, the Perfotest appears to give logical results based on systemcomposition and expected properties. Its validity is limited by the incremental nature of the results.
Methods Comparison
After evaluating each method separately it is important to see how the methods compare to eachother. Table 12 is a tabulation of the systems showing their relative ranking based on impact resistanceas determined by each test method; #1 equals the highest impact resistance and #23 the lowest impactresistance. The Perfotest results are grouped together to account for the incremental results of the method.For the most part, the 2-lb and 4-lb Gardner test results gave a similar ranking. However, the rankingsfrom the Gardner test method do not correlate very well with the rankings from the falling ball method.As best as can be expected due to the incremental nature of the test results, the Perfotest rankings showsome correlation with the falling ball test rankings. Actually, each test method identified the worstsystems and ranked them nearly the same. System HI-PB ranked #23 by every method; system B2-PBranked #22. At the other end of the spectrum, system D2-PM was ranked #1 by three different methods(including the I to 4 ranking by the 2-lb Gardner-no failure using the 2-lb weight at the maximum dropheight of the apparatus) and #6 by the falling ball. In other cases, correlation between test methods is notalways obvious especially since the Perfotest rankings are grouped. The falling ball method tends to rankthe class PM systems lower than the Gardner or Perfotest methods.
Looking at the methods from an operational viewpoint, the Perfotest is the simplest and easiest toperform, the Gardner the next, and the falling ball the most involved to perform. Even though thePerfotest is so easy to use, the incremental results are not considered precise enough for a laboratory test.As a screening device or a quality control/assurance tool, the Perfotest is adequate; it is not for researchor product development. Besides the incremental results, another criticism of the Perfotest is the variablearea of the striker. By nature of the device, the energy of impact is the same but the energy per unit areais changed by increasing or decreasing the size of the impacting head. The full ramifications of thisgeometry change are not known; however, the change in area does raise some concerns. A set geometryfor the indentor probably yields more accurate results by eliminating a variable that may behave differentlywith different system reinforcing meshes and chemical compositions.
The Gardner test, although relatively simple and easy to use, does not provide true impact resistancevalues for the system but rather puncture/penetration resistance values. The thicker, harder systems willperform better with this method. Its poor correlation with the overall system properties limit its usefulnessas a method for predicting long-term impact resistance for EIFS as a whole (combined class PB and PMsystems).
The falling ball test method is by far the most troublesome of the tests to perform. A high ceiling,open area is needed to provide the drop height distances and clearance for the swinging ball. A sturdyframe or wall for specimen attachment is also needed. Even with these drawbacks, the falling ball methodis considered the best of the methods evaluated to determine true impact resistance of EIFS. Thegeometry of the test comes clorcr to simulating the action of a baseball or large rock being hurled at thewall, a suitcase bumping against the wall, or even someone kicking the wall.
47
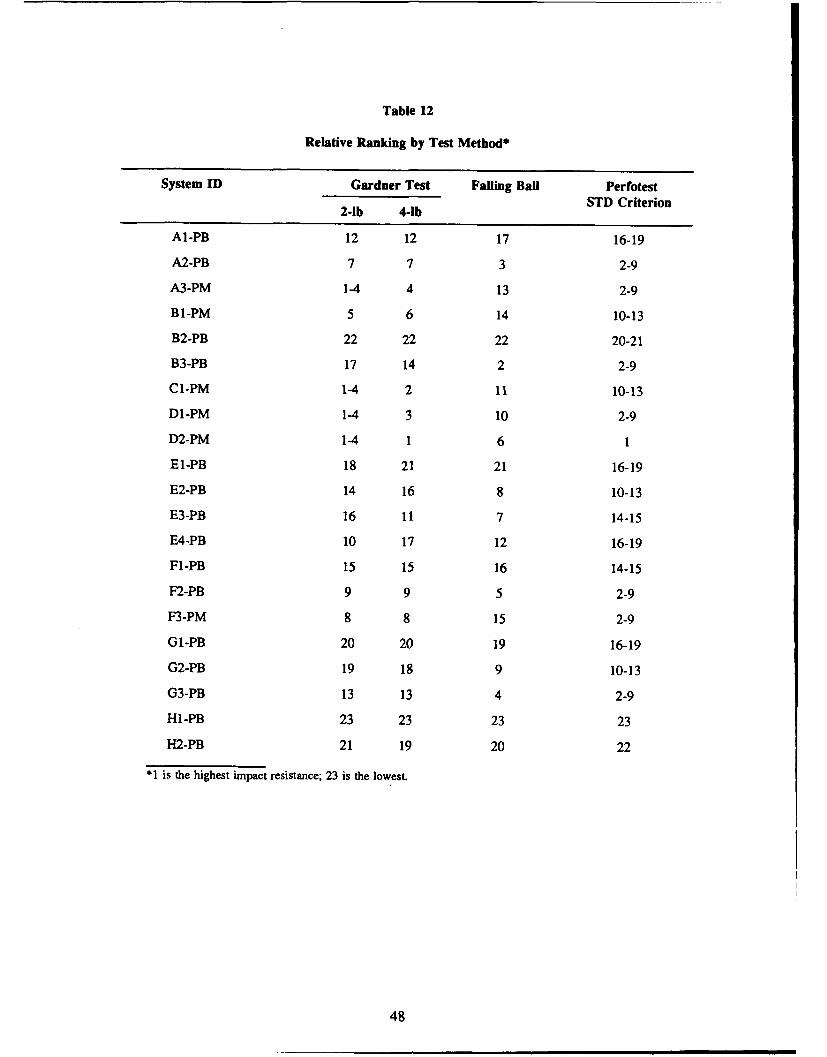
Table 12
Relative Ranking by Test Method*
System ID Gardner Test Falling Bail PerfotestSTD Criterion
2-lb 4-lb
Al-PB 12 12 17 16-19
A2-PB 7 7 3 2-9
A3-PM 1-4 4 13 2-9
B1-PM 5 6 14 10-13
B2-PB 22 22 22 20-21
B3-PB 17 14 2 2-9
Cl-PM 1-4 2 11 10-13
D1-PM 1-4 3 10 2-9
D2-PM 1-4 1 6 1
El-PB 18 21 21 16-19
E2-PB 14 16 8 10-13
E3-PB 16 11 7 14-15
E4-PB 10 17 12 16-19
Fl-PB 15 15 16 14-15
F2-PB 9 9 5 2-9
F3-PM 8 8 15 2-9
G1-PB 20 20 19 16-19
G2-PB 19 18 9 10-13
G3-PB 13 13 4 2-9
HI-PB 23 23 23 23
H2-PB 21 19 20 22
*1 is the highest impact resistance; 23 is the lowest.
48
5 CONCLUSIONS AND RECOMMENDATIONS
Of the three test methods for impact resistance evaluated in this research (falling weight, falling ball,and Perfotest), the falling ball method is the best for assessing the overall impact resistance of EIFS. Thisconclusion is drawn from a comparison of the test results and postulated properties for each system basedon the physical and chemical composition.
Each of 23 different EIFS systems were tested using the three different test methods. Selectedvariances in the test methods were also examined (2-lb and 4-lb falling weight). The test results indicatethe falling weight or Gardner test did not give very good correlation of results with system propertiesdesigned to increase impact resistance. The Gardner test method is better for testing the puncture resis-tance of systems rather than the impact resistance. The Perfotest method is a good field test method, butdue to the incremental nature of the results, the method is not well suited for laboratory use. The fallingball test method, although more troublesome than the other two, is the best of the methods evaluated forassessing the overall impact resistance of EIFS.
1. A falling ball test method should be adopted by ASTM to determine the impact resistance ofEIFS.
a. A draft test method, "Resistance of Exterior Insulation and Finish Systems (EIFS) to RapidDeformation (Impact) by Means of a Falling Ball", was submitted to ASTM Committee E-06.55 on Per-formance of Building Constructions, Exterior Walls in the fall of 1990 for further development andpossible adoption by ASTM as a standard test method. A copy of this draft method is included inAppendix A.
b. Several questions remain to be answered or agreed upon: specimen design, specimen sup-port, lighting requirements, definition of failure and reproducibility of results (especially between differentlaboratories. It is anticipated that the ASTM Committee will help answer some of these questions andget a meaningful impact test method for EIFS in place.
2. Besides an impact test method, a puncture test method for EIFS is also needed. Even thoughthe Gardner test method is not considered a good impact resistance test method for EIFS, it appears to bean excellent puncture resistance test method for EIFS and should be adopted as such by ASTM.
3. The Perfotest should also be adopted by ASTM as a field screening method, at least until a betterfield portable method is developed. Much work is envisioned establishing uniform procedures for fieldtesting and correlation to any adopted impact and puncture resistance test methods.
4. As these methods are adopted, performance standards for the different classes of EIFS will needto be established. EIFS systems should be rated for both impact and puncture resistance. Performancerequirements will be needed to differentiate between standard and high impact and puncture resistantsystems as needed depending on the application and location.
5. Test methods and performance standards adopted by ASTM should be incorporated into futureupdates of Corps of Engineers Guide Specification CEGS-07240, Exterior Insulation and Finish Systems.
49
METRIC CONVERSION TABLE
lin. = 25.4 mmI ft z 0.305 m1 lb = 0.453 kg
REFERENCES
ASTM D1037-89, "Standard Test Methods of Evaluating the Properties of Wood-Base Fiber and Particle Panel Materials," AnnualBook of ASTM Standards, Vol 04.09 (American Society for Testing and Materials [ASTM], 1991), pp 169-198.
ASTM D2794-90, "Standard Test Method for Resistance of Organic Coatings to the Effects of Rapid Deformation (Impact),"Annual Book of ASTM Standards, Vol 06.01 (ASTM, 1991), pp 404-405.
ASTM D3029-90, "Standard Test Methods for Impact Resistance of Flat, Rigid Plastic Specimens by Means of a Tup (FallingWeight)," Annual Book of ASTM Standards, Vol 08.02 (ASTM, 1991), pp 517-528.
CEGS-07240, Exterior Insulation and Finish Systems (Headquarters, U.S. Army Corps of Engineers [HQUSACE], December1988.)
EIMA Test Method & Standard 101.86, Standard Test Method for Resistance of Exterior Insulation Finish Systems to the Effectsof Rapid Deformation (Impact), EIMA Guideline Specification for Exterior Insulation and Finish Systems-Class PB Type A,Appendix A, April 1987.
European Union for Technical Agreement in Construction, UEAtc Directives for the Assessment of External Insulation Systemsfor Walls (Expanded Polystyrene Insulation Faced with a Thin Rendering), M.OA.T, n 22, June 1988.
Lampo, R.G., and J.C. Trovillion, Exterior Insulation and Finish Systems (EIFS) on U.S. Army Facilities: Lessons Learned,Technical Report M-91/02/ADA228572 (U.S. Army Construction Engineering Research Laboratory [USACERL], October 1990).
Smith, A., R.E. Muncy, and S.C. Sweeney, Criteria for Evaluating Impact Damage Resistance of Exterior Insulation and FinishSystems, Technical Report M-335/ADBO79523 (U.S. Army Construction Engineering Research Laboratory [USACERL],November 1983).
Weaver, O.R., "Using Attributes to Measure a Continuous Variable in Impact Testing Plastic Bottles," Materials Research andStandards, Vol 6, No. 6 (June 1966), pp 285-291.
50
APPENDIX A: Draft ASTM Test Method
DRAFT TEST METHODASTM EIFS COORDINATING COMMITTEE
ASTM DESIGNATION: P ----
Standard Test Method forRESISTANCE OF EXTERIOR INSULATION AND FINISHSYSTEMS (EIFS) TO RAPID DEFORMATION (IMPACT)BY MEANS OF A FALLING BALL
1. Scope
1.1 This test method covers a procedure for rapidly deforming by impact from a falling ball,Exterior Insulation and Finish Systems (EIFS). This test method was developed to test both of the twomain classes of EIFS; polymer based (Class PB) systems and polymer modified (Class PM) systems.
1.2 This test method should be used to determine the impact resistance of both Class PB and
Class PM EIFS.
1.3 The values stated in inch-pound units are to be regarded as the standard.
1.4 This standard may involve hazardous materials, operations, and equipment. This standarddoes not purport to address all of the safety problems associated with its use. It is the responsibility ofwhoever uses this standard to consult and establish appropriate safety and health practices and determinethe applicability of regulatory limitations prior to use.
2. Referenced Documents
2.1 ASTM Standards:D3029 Methods for Impact Resistance of Rigid PlasticSheeting or Parts by Means of a Tup (Falling Weight)1
3. Summary of Test Method
3.1 The EIFS to be tested are applied to test frames designed to imitate common constructionpractices and substrates. After the EIFS have cured, they are rigidly attached vertically to a fixed supportsystem. Each EIFS is then impacted by a falling steel ball in a stair-step fashion. The test data areanalyzed to determine a mean-failure-energy. The resistance to impact of the EIFS can then be classifiedaccording to specified performance criteria.
Annual Book of ASTM Standards, ASTM D3029-90, "Standard Test Methods for Impact Resistance of Flat, Rigid PlasticSpecimens by Means of a Tup (Falling Weight)" Vol 08.02 (American Society of Testing and Materials [ASTMJ, 1991).
51
4. Significance and Use
4.1 This test method covers the determination of the resistance to impact of EIFS by a fallingball. This information should be useful for the following:
4.1.1 Aiding manufacturers in the development of EIFS with improved resistance to impact.
4.1.2 Aiding architects/engineers in specifying EIFS which meet performance criteria necessaryfor long term building integrity.
5. Apparatus
5.1 The falling ball apparatus employs a 2 lb steel ball with a 2-3/8 inch diameter. This ballis suspended by a 30 ft length of KevlarR cord. The support for the steel ball and cord must be able tomove up-and-down, side-to-side, and front-to-back. The mass of the support must be sufficient to act asa stationary point for the pendulum. Vertical steel columns with horizontal supports shall be set up belowwhere the ball and KevlarR cord are supported. The test panel is to be rigidly secured to these columns.The support for the steel ball shall be moved so that the ball will strike the test panel at the bottom of itsswing.
6. Test Specimens
6.1 The EIFS shall be applied over 4 ft. by 8 ft. test frames. These frames should be madefrom standard 2x4 lumber or steel studs with a 16 inch center-to-center stud spacing. This frame shouldbe covered with a 4 ft. by 8 ft. sheet of 1/2 inch gypsum sheathing board. The EIFS shall be applied overthis panel per each manufacturers installation requirements.
6.2 The EIFS shall be applied over 1 inch thick insulation board which is common to thatsystem. The specimens shall be allowed to cure for at least 28 days at 73.4F+/-3 and 50 +/- 5% relativehumidity.
7. Procedures
7.1 The test frame with the EIFS applied to it must be rigidly attached to the steel columns ofthe test apparatus. This can be accomplished by screwing the frame tightly against the steel columns usinglag screws.
7.1.2 In order to be able to see where the panel should be impacted, a grid should be placed onthe surface of the EIFS. This can be accomplished using a chalk line. The grid should be made up of6 inch squares.
7.1.3 Strike the panel with the steel ball from a height lower than that which is expected to causefailure. If no failure occurs, raise the height by 3 inches and impact the panel again at a new impact site.Continue increasing the drop height on successive impacts until a failure occurs. When a failure occursdecrease the drop height by 3 inches on the successive impact. Continue this up-and-downprocedure,increasing the drop height after passes and decreasing the drop height after failures, until at least25 impacts have been recorded starting with the first failure. Impact points must be at least 6 inches apartand 6 inches from the edges of the panel.
52
7.1.4 A failure is defined as any crack visible to the naked eye under ordinary lighting.
8. Calculations
8.1 A mean-failure-energy is determined using methods outlined in ASTM D 3029. The first stepin calculating a mean-failure-energy is to calculate a mean-failure-height. The mean-failure-height iscalculated using the following formula:
h = ho + dh (A/N ± 0.5)
where:
h = is the mean-failure-height,ho = is the lowest height at which an event occurred,dh = is the increment in drop height,N = is the total number of failures or non-failures, whichever is smaller (Whatever is used,
either failure or non-failure is called an event.),A = is given by the expression,
kA=E ini,
i=O
where:
i = 0,1,2....k (a counting index starting at ho),ni = is the number of events that occurred at hl, andhi = is given by the expression,
hi = h, + idh.
In calculating the mean-failure-height, h, the negative sign is used when the events are failures and thepositive sign is used when the events are non-failures.
8.1.2 The estimated standard deviation of the sample is calculated using the following formula,
Sh = 1.62dh[B/N-(A/N)21 + 0.04 7dh.
where:
B = is given by the expression,
53
kB -- i 2ni
i=o
This formula is valid only if [B/N-(A/N) 2] > 0.3.
8.1.3 The estimated standard deviation of the sample mean failure height is given by thefollowing expression,
Shbar = G*Sh/VNi'
where:
Shr = is the estimated standard deviation of the mean failure height,G = is a function of Sh/dh. (Values for G can be found in D3029)
8.1.4 The mean-failure-energy, MFE, can be calculated using the following formula,
MFE = h*w
where:
MFE = is the mean-failure-energy,h = s the mean-failure-height,w = is the constant drop weight used in testing.
8.1.5 The estimated standard deviation of the mean-failure-energy is given by the followingformula,
SMFE = Shbar*W.
9. Precision and Bias
9.1 No statement is made on the precision or bias of this test method since no data are availableat this time based on the use of this test method.
54
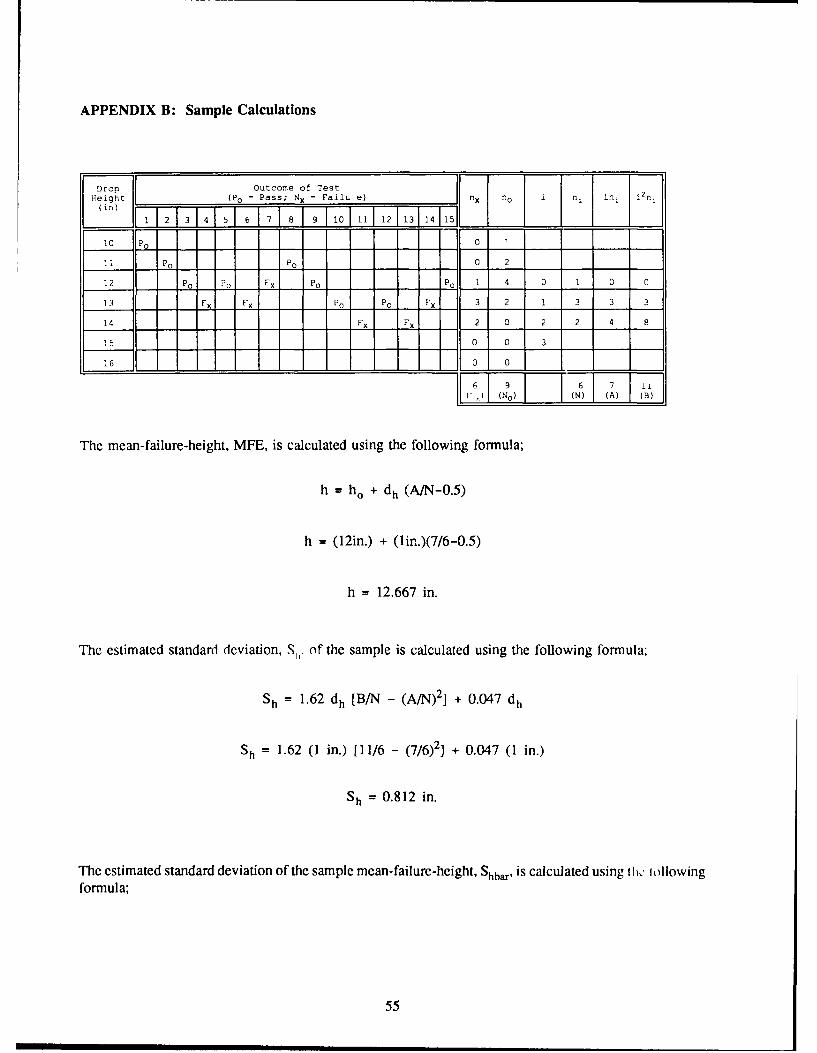
APPENDIX B: Sample Calculations
Drop Outcome of TestHeight (Po = Pass; Nx = Failu e) nx no i n, in, i2ný
(in)r r1 2 3 4 5 6 7 8 19 10 10 1il 12113114115
I0 P0 0
1 io _ PO 0 2
12 P0 P0 Fx Po Po 1 4 0 1 0 0
13 Fxj Fx Po PO Fx 3 2 1 3 3 3
14 Fx Fx 2 0 2 2 4 8
15 0 0 3
16 0 0
(6 [ NO_] (7) 1( )]
The mean-failure-height, MFE, is calculated using the following formula;
h = ho + dh (A/N-0.5)
h = (12in.) + (lin.)(7/6-0.5)
h = 12.667 in.
The estimated standard deviation, Sir of the sample is calculated using the following formula;
Sh = 1.62 dh [B/N - (A/N) 2] + 0.047 dh
Sh 1.62 (1 in.) [11/6 - (7/6)2J + 0.047 (1 in.)
Sh ; 0.812 in.
The estimated standard deviation of the sample mean-failure-height, Shbar, is calculated using 0l1,. iollowingformula;
55
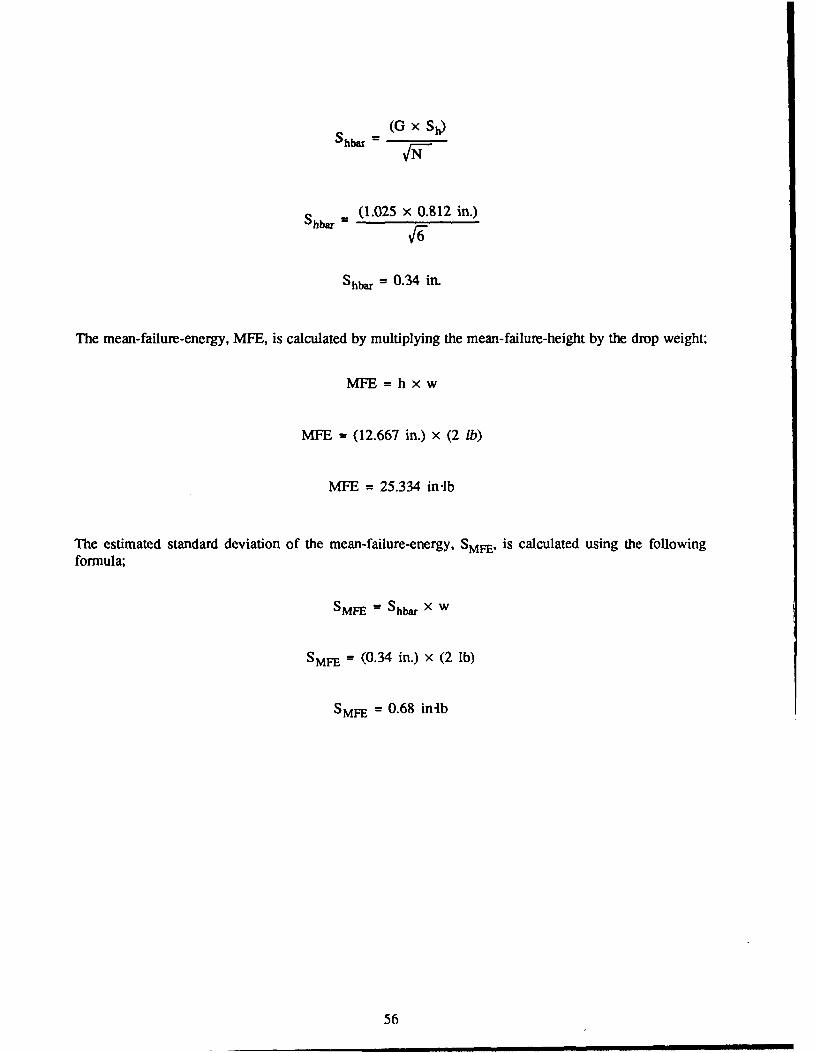
= (G x Sh)
Shbar = (1.025 x 0.812 in.)
Shba = 0.34 in.
The mean-failure-energy, MFE, is calculated by multiplying the mean-failure-height by the drop weight;
MFE = h x w
MFE = (12.667 in.) x (2 lb)
MFE = 25.334 inilb
The estimated standard deviation of the mean-failure-energy, SMFE, is calculated using the followingformula;
SMFE = Shbar X w
SMFE = (0.34 in.) x (2 Ib)
SMFE = 0.68 in-lb
56
USACERL DISTRIBUTION
Clod' of Eogteee HQ XVMI &,boraee cowp 2807 Fotm B.1-a~ 2206 Engr So-me L~braryATTN: CEHEC-I34-LH (2) ATTN. APZA-D2H-EE ATTN: CETEC-IM.-T ATTN. Aoq-idioe 10017ATTN. CEHEC-IM-LP (2) ATTN. CECC-R 22060ATrN: CE(XI 4th Infanty Div (MECH) ATTN. Exar Soojopo Studies Coi Delaza Nuctlear AgrecyATTN. CERLD-M ATTN: APZC-PE ATTN: Wante Resources Spa Cor ATrN: NADS 20305ATrN. CECC-P ATTN. Atusuoliaze Lasc. OfficeATTN. CERD-L Fan Pidisax 23824 Defns Lolpatot AlpancyATTN. CECW-P ATTN. APZA-PP-E USA Natik RDAE CGnnt 01760 ATTN. DLA-Wl 22304ATTN: CECW-PR ATrNr STRNC-DTATTN: CEMP-E Toboybsen Amy Depot 18466 ATTN. DRDNA-F Wahor Read Amy Medical Co, 20307ATTN: CEMP-ES ATTN. SDSTO-EHATTN. CEMP-C 7VhADOC US Military Acadmay 10986ATTN: CECW-O US Army Mitatio Com..d (AMC) ATTN: 0214 (13) ATTN. MAEN-AAT*TN. CECW R.tdinna Ameeld 35809 Foot M-o 23651 ATTN: Facilties. EngineerATTN. CERM ATTN. OESMI*ICLP ATTN A730-0 ATTN. Uoogrosiy A Eavr EngrATTN: CEMP Jefferon Proving Gtotund 47250 Carislec Barraks 17013ATTN: CERD-C ATTN. SIEJ-LD-F/IIEH ATTN: ATZE-DIS 416th Eoupoir Cotomod 60623AT'N: CEMP-M Lettorloany Amy Dopot FanEustisg 23604 ATTN. Gib-m USAR CarATTN: CEMP-R ATTN: SDSLE-ENN 17201 ATTN: DEHATTN. CERD-ZA Puetblo Amy Depot 01006 Fort (Idlfe. 72905 USA Japan (USARI)ATTN. DA1EN-ZCM ATTN. SI3STE-PUI-F ATTN: ATZ7t-7F ATTN: APAJ-EN-ES 96343ATTN. OAEN-ZCE Degeny Proving Ground 84022 Poon Sill 73503 ATTN: HONSHU 96343ATrN. DAEN-ZCI ATTN: STEDP-EN ATTN: ATZR-E ATTN: DEH-Okinono 96376
Too.). Amy Depot 8407CEHSC ATTN. SDSTE-ELF US Amy Materials Took Lob Naval Facilities Engr CatontundATTN.: CEIISC-F 22060 Ywoon Proving Grouned 85365 ATTN: SLCMT-DEH 02172 ATTN: Facilities Engr Counnucod (8)ATrN. CEHSC-Tr 22060 ATTN. STEYP-EH-E ATTN. Div.ietnOfro. (11)ATTN: CEHSC-ZC 22060 Toby)m-- A yo Depot 18466 WESCOM 96858 ATTN: Pubio Work. Center (8)ATrN. BET M1 79906 ATTN. SOSTIO-EH ATTN: 0214 ATTN-. Naval Cuense Raooieoo Car 93043
Sensics Amy Depot 14541 ATTrN. APEN-A ATTN. Navel Clvil Engr Laboraoroy (3) 93043US Amy lingr Di.tict ATTN: SDSSE-HE
ATTN. Library (40) A- Iee Proving CIrowod SHAPE 09,705 8th US Amy KostuATTN. STEAP-02H 21005 ATTN. Ildraosrutto Branch LANDA ATTN. DEH (12)
US Army Eogr Division Sharop Amy Depot 95331ATTN. Littay, (13) ATTN. 13SDSS-E Ass. Enguper. AEDC-Amn Office, US Amy HSC
Font Motontojh 07703 Arnod Air Force Station. TN 37389 Poon Swo Hortons 78234US Avey Europe ATTN: SELFM-EH-E ATTN: HSLO-FATTN. AEAEN-EH 09014 Savanna Amy Depot 61074 HQ USEUCOM 09128 Fitraoiroot Amy Medical CarATTN: AEAEN-ODCS 09014 ATT*N. SDSLE-VAE ATTN. ECJ4-LIE ATTN. HSHG-0E14 8005V corpe Rock 1-ood Arsena
ATTN. DEl) (8) ATT7N.- SMCRI EH4 AMMRC 02172 Tyndall AFB 32403VII Corps ATTN. SMCRI-TL ATTN: DRXNIR-AF ATTN: APESC Progreo Of.:
ATT-N. DEH (11) Witotoliet Arsencil 12199 ATTN. I3RXMR-WE ATTN: Eugrg & Sty Lob29th Area Support Groupr ATTN: SMCWV-EH
ATTN: AERAS PA 09054 Red River Amy Depot 76102 CEWES 39190 Clainuse AFB 61868100th Support Group ATTN. SDSRRG ATTN: Lilotry ATTN. 3345 CESiDE
ATTN: AETr-EN-DEl) 09114 Harry Duu-ndoo Lab222d Base lieuolion ATTN. Library 2W783 CECRL 03755 USA TSARCOM 63120
ATTN. AETV-BH[R-E 09034 While Sands Missile Rulet 880012 ATTN. Littery ATTN. STSAS P235h Iaso,. Support Batotalion ATTN. Lbituoy,
ATTN. Unit 28614 Aoabach 09177 Coop.. Q3tiso Anmy Depot USA AMCOM American Public Works Assc. 60637293d B-. Support Eootlicin ATTN: SDSCC ECD 78419 ATTN. Factlities Eogr 21719
ATTN. AEUSG-MA AST-WO E 09066 ATTN: AMSMC-IR 61299 US Amty Euvr Hyguewo Agency409th Support Bottlio (Hoo) PORSCOM ATTN. Facilities Eog (3) 85613 ATrN: 145118ME 21010
ATTN: AETTG DEH 092114 ATTN: Facilities Engr (12)412th Baoe Support Bettilooe 09650 Fort Bragg 28307 USAARMC 40121 US Gov't Printing Ofro. 20401
ATTN: Unit 31401 ATTN. AFZA.02 ATTN: ATZIC-214A ATTN. Rot Sec/fleposit So. (2)Frankfurt Bas., Sopport Rcoolion Foot Campbell 42223
ATTN. Unit 25727 09242 ATTN: AFZB-DEH Military Traffic Mgmt Coneoteaud Nat'l Institue of Standards & TookCMTC Holoolol. 09173 Foot M.Coy 54656 ATTN: MTEA-Gll EHP 07002 ATTN: Lubrory, 20899
ATTN. AEIT7IDEH ATTN: AFZR-DE ATTN: MT-LOF 20315Mom- Germany 09105 Fort Sotewar 31314 ATTN: M1-SU.PE 28461 Defense Took lob Cwwo 22204
ATTN. HSB MZ E ATTN: AP7P-DEF ATTN. MTrW-IE ATTN: OTIC-FAB (2)21st Support Cove-ntod Ft Buchaioen 00934
ATTN: DEN4 (10) ATTN: Eevv Office Poot Looreard Wood 65473 303US Army Berlin Ft Divanos 01433 ATTN. ATSE-DAC-LD (3) 07/92
ATTN: AEBA 214 09235 ATTrN: AFZD-DE ATTN: ATZA-TE-SWATTN: AEBA EN 09235 Fort 0mme 13602 ATTN-. ATSEGCLO
SETAF ATTN. APZS-E14.E ATTN. ATSE-DAC-PLATTN: AESE-EN-D 09613 Fort Imene 92310ATTN. AESE-EN 09630 ATTN. AFZI-EH Military Dait of WASH
Suiotroe Allied Co*eueod Fort Hood 76544 Feet McNairATTN: ACSGER 09703 ATTN. AFZP-02-AES E.gr ATTN. ANEN 20319ATTN: SHII2B/ENGR 09703 Pont Meode 20F755
ATTN. AFKA-ZIEH-A USA Engr Activity, Capital AmeINSCOM ATTN. Lbrhoy 22211
ATTN. IALOGI1 22060 6th Infantry Division, (Lrjo)ATTN. IAV 02H 22186 ATTN. APVR 0E 99505 Norton AFB 92409
ATTN. APVR WF-DE 99703 ATTN. LittotyUSA TACOM 48090
ATTN: AMSTA XE National Guard Buroeau 20310 US Army ARDEC 07806ATTN. Installatons Div ATTN. SMCAR ISE
Defortee Distribosite Regione EasotATTN. DIRE WI 27070 Charles E Kelly Slit Activity
ATTN. DEH 15071
This publication was reproduced on recycled paper.