Embed Size (px)
Citation preview
BEST AVAILABLE COPY
AD-A266 337 f
DOT/FAAIAM-93/7 Variations of Time-to-Incapacitation
and Caiboxyhemoglobin Values inOffice of Aviation Medicine Rats Exposed to Two CarbonWashington, D.C. 20591 Monoxide Concentrations
Donald C. SandersBoyd R. EndecottRoxane M. RitterArvind K. Chaturvedi
Civil Aeromedical InstituteFederal Aviation AdministrationOklahoma City, Oklahoma 73125
May 1993 D ISELECTEDsiJUL 0 I!11933
Final Report E
This document is available to the publicthrough the National Technical InformationService, Springfield, Virginia 22161.
US. Departmentof TransportationFederal Aviation•...,A v.,0.9 3-14 97 2Administration 93-14972
BEST AVNLABLE COPY
NOTICE
This document is disseminated under the sponsorship of the U. S. Department ofTransportation in the interest of information exchange. The United States Government
assumes no liability for the contents or use thereof.
The use of animals for this study was approved by the Institutional LaboratoryAnimal Use Review Committee under the U. S. Department of Agriculture AnimalWelfare Act. The animals were cared for and humanely used in accordance with the
National Institutes of Health (NIH) Guide for the Care and Use of LaboratoryAnimals, PHS Publication (NIH) No. 86-23, revised 1985.
Accesion For
NTIS CRA&M
DTIC TABUnannouncedJustification
By ....... ...........Distfibutlol 1
Availability Codes
Avail and I orDist Special
•elPI ,
Technical Report Documentation Page1. Reoo,t orV . 2. Go.,e-mewt Ace#%*.*. No. 3. R•evoi,e*nt 0 Catalog No.
DOT/FAA/AM- 93/7
4. T,,Io and 5•bt'lo .... . .... 5. R~ot,iOat* . ..
VARIATIONS OF TIME-TO-INCAPACITATION AND May 1993CARBOXYHEMOGLOBIN VALUES IN RATS EXPOSED TO TWO . , ,o,.,, .,,. Cod.
CARBON MONOXIDE CONCENTRATIONS
7. A.,ho,,i) Donald C. Sanders, Boyd R. Endecott, Roxane M.Ritter, and Arvind K. Chaturvedi
9. P4,1400..m 1g Olgen,20. N.,. e-.4 Add,.,S 10. Wool Unt No. (TRAIS)
FAA Civil Aeromedical InstituteP. 0. Box 25082 I. C.on.t.ra of.,O .. .. ...Oklahoma City, OK 73125-5066
13, Tyoa ao ... a P..,,.d C. ... ., eem Agency. Home.ns, Ads.Office of Aviation MedicineFederal Aviation Administration800 Independence Avenue, SW 14. S000,A9 Agency Ced.
Washington, DC 20591IS. Sujplemete,,y N.ote
This work was performed under task AM-B-92-TOX-60.
P6. Abs,,ocl It has been suggested that passenger protective breathing equipment protectaircraft passengers from smoke for 5 min during an evacuation phase and for 35 minduring an in-flight-plus-evacuation phase. Carbon monoxide (CO) is one of the mostabundant smoke components and is the major threat in most fire atmospheres. Time-to-incapacitation (t,) is an end-point related to escape from a fire, and variations inti measurements at specific CO concentrations have not been statistically documented.Therefore, variance in t, at two CO concentrations that produce 5- and 35-mmn t, ½nrats were determined; blood carboxyhemoglobin (COHb) saturation at t, was measured.Fifty male Sprague-Dawley rats were individually exposed to each CO concentration ina chamber equipped with a rotating cage, and ti was recorded as the time frominsertion of the animal into the cage until it could no longer walk. In another setof experiments, blood COHb saturation was determined in rats exposed to these COconcentrations at stepwise intervals less than t,. At incapacitation and at the endof each exposure interval, rats were quickly removed from the cage and killed forblood collection and COHb quantitation. Values (mean i SD) for measured parame'erswere: For the 5-min tt study, CO - 5706 a 178 ppm, ti - 5.0 a 0.36 min, and Crtib -80.8 t 1.3%; for the 35-min t, study, CO - 1902 1 33 ppm, tt - 34 G 1 6.8 min, andCOHb - 71.2 t 1.0%. CO~b levels tended to plateau prior to incapacitation.Coefficients of variation for t, were 7.2% and 19.5% for the 5- and 35-min study,respectively. The significant difference in the two COHb levels and the approach ofCOHb to a maximal level before incapacitation suggest that blood CO1b saturationlevels may not necessarily be indicative of the onset of incdpacitation.
17. Key ,Of,4Is $#ali-t.,,• s o"#w,,•
Inhalation toxicology; combustion gas/ Document is available to the publiccarbon monoxide; time-to-incapacitation through the National Technicalcarboxyhemoglobin; carbon monoxide Information Service, Springfield,uptake; animal exposure system VA 22161
It. S vr.ty Cl06,,6. (01 * 00. 0 20, sevw.,y Clas,#. (of .... edge). 2,. . 0 P Je.. 22. P....
Unclassified Unclassified 19
Fotm DOT F t700.7 ý,-72ý R.predut,, .1o c...i .,pI.d Pag, ov, ie#,,od

VARIATIONS OF TIME-TO-INCAPACITATION ANDCARBOXYHEMOGLOBIN VALUES IN RATS EXPOSED TO TWO
CARBON MONOXIDE CONCENTRATIONS
INTRODUCTION
Inhalation of carbon monoxide (CO) is recognized as a not totally defined, but models do exist for CO uptakeprimary cause of deaths in aircraft fire accidents. Viable in non-human primates and humans (Peterson andescape options during in-flight fires do not exist for 20 to Stewart, 1972; Kaplan and Hartzell, 1984).30 min before the aircraft can land (Crane, 1984), andsurvival scenarios usually span a shorter period of time in This study was designed to determine variations in t,postcrash fires. Both government and industry have among the laboratory rats exposed to the CO concentra-initiated rhedevelopment ofpassenger protective breath- tions that would incapacitate the subjects at 5 and 35
ing equipment (PPBE) to increase survivability in fires min, representing durations of fire exposure in typical(McFadden, et al., 1967; Higgins, 1987). Specific per- aircraft accidents; blood COHb saturation levels wereformance criteria for the evaluation of such devices have determined at incapacitation. Uptakes of CO at the 2only recently been defined by the European Organiza- concentrations, measured as increases in the COHbtion for Civil Aviation Equipment (EUROCAE, 199 1); levels as a function of exposure time, were included totoxic gases and their concentrations generally present in establish whether CO exposure concentration, t,, andaircraft fires and PPBE maximum pass limits that would COHb parameters are interrelated. Information fromprovide the wearer a sufficient time to escape from a fire this study may be useful in interpreting postmortemwere considered. In general, it is viewed that PPBE at COHb levels in fire victims.least protect individuals for 5 min duringevacuation and
for 25 min (20 min + 5 min) during in-flight-plus- MATERIALS AND METHODSevacuation. However, an in-flight period of 30 mirt maybe necessary in certain fire scenarios. Animals
Male rats of Sprague-Dawley origin were obtained fromAn individual incapacitated from combustion gases the Charles River Breeding Laboratories, Wilmington,
has a minimal chance to escape from a fire, and onst of MA. in a 100 to 125 gweight range. They %ere inspectedincapacitation may vary among subjects. Therefore, by a veterinarian upon arrival and held in isolation for 8variations in the onset of this response at specific fixed days prior to use. Animals were allowed food and water
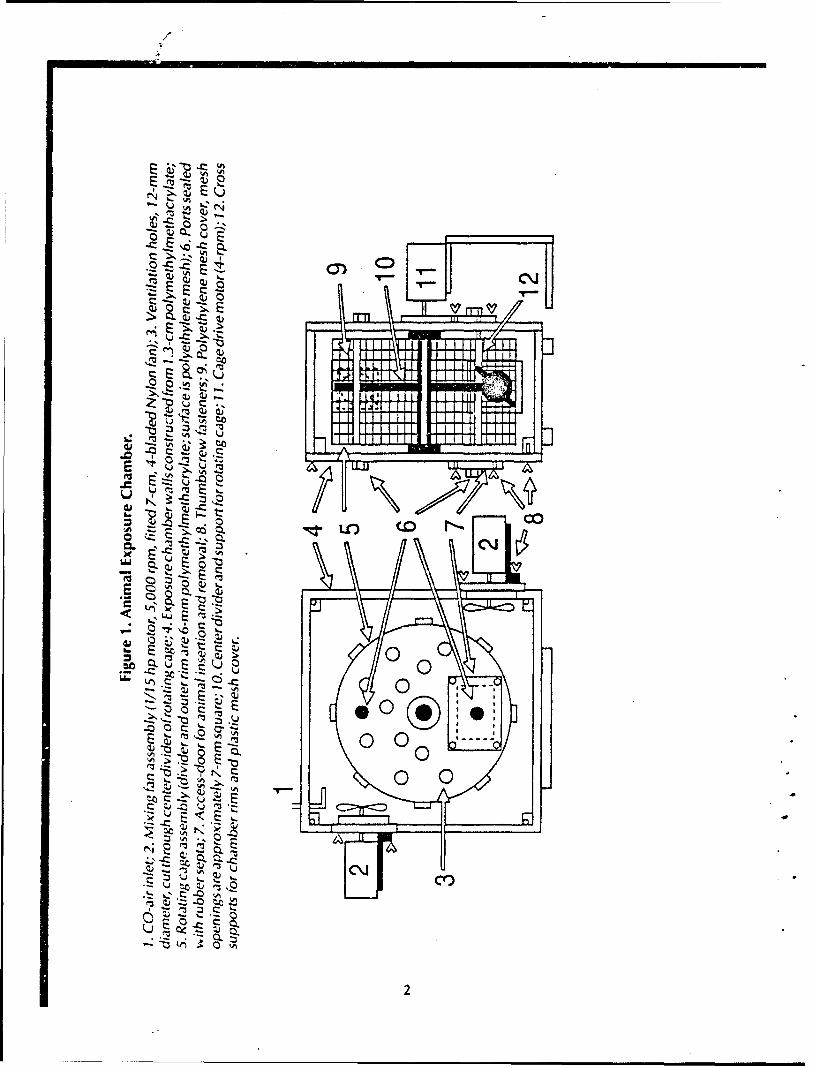
concentrations of toxic combustion gases for the evacu- ad libitum during, and following, the isolation period.atior, periods should bt evaluated. Concentrations of All animals were fasted overnight before the CO expo-combustion gases in bloomd also ne,'d to be quantitated to sure experiments. Rats (4 to 6 per cage) were housed incorrelate with the response. CO is generated in poten- stainlesssteelcages(61 cm LX45 cm WX27cm H)withtinlly lethal amounts during fires and can produce inca- mesh-wire floors in the Institute's centrali7ed animalpacitation (Crane, et al., 1 989; Il, artiell. 1989; Gad, care facility maintained at 22 to 24'C with a relative109t). Time-to-incapacitation (t,) is an applicable end- humidity of 40 to 60% and a 12-hr on/off fluorescentpoint for predicting escape time from a fire environment light cycle (lights on 7 a.m. to 7 p.m.).(Crane. et al., 1P)77; Spurgeon, et al.. 1979: Sanders, etal., 199 1), and blood C.01 lb saturation levels are rou- Animal Exposire Chambertinelv measured in CO poisonings to establish the sever- The animal exposure chamber used in the study wasity of CO exposure. Relationship of the COM lb levels constructed from 1.3-cm polymethylmethacrylatesheets;with CO exposure concentrations and exposure times is its internal dimensions were: 50.8 cm 1. X 26.6 cm W X
I
*zE rE-
Q) -Cn-
-0.4~
Q);
Zr~l
t -,;;
~ 2 u
oc
Eu 2
<n
*4,a
Qu,
Q; U
t o - '
- z to~
50.6 cm H (Figure 1). In the chamber, there was a rat exposures by the nominal 4-L/min flow of CO-aircylindrical cage (40.5 cm diameter; 25.0 cm W) divided mixtures through the chamber. Consequently, 02 wasvertically into 2 equal compartments, each 12.5-cm wide not monitored during subsequent animal exposure ex-
and rotated horizontally by a 4-rpm geaed motor to periments.provide a circumferential velocity of 8.5 cm/sec. Thefront compartment of the cage was used for the animal Prior to exposure experiments, a volume of pure COtests. A gasketed access-door (10.4 cm X 10.4 cm) on the slightly less than that required to bring the chamberfront panel of the chamber at the cage floor level allowed atmosphere to the desired concentration was injectedrapid animal insertion into, and removal from, the cage. into the closed chamber. With fans and rotating cageThere were 2 fans, I on each side of the chamber; I fan activated, theCO-airmixturewasallowedto flowthroughwas at the upper part and the other at the lower part of the chamber, while sampling, until the stable CO con-
the chamber. These fans were for homogereous mixing centration correspondingto thedesired levelwas reached.and circulation ofthe gas-air mixture in the flow-through The fans and cage motor were turned off, sampling timerchamber atmosphere. Also, there were 2 ports sealed was set to zero, and retaining screws in the chamberwith rubber septa on the front side of the chamber. access-door were removed. In rapid sequence, the door
was opened, a rat was inserted, the door was closed, and
Compressed CO (99.5%) and breathing air, pur- the timer, cage motor, and fans were activated.chased locally in cylinders, were mixed by passing througha baffled cylindrical mixing tube before entering the The t, was recorded as the time from insertion of theanimal chamber. CO and air flow rates were regulated rat until it could no longer walk (i.e., when it began toautomatically using Scott model 5850E mass flow con- tumble or slide) in the rotating cage, as subjectively
trollers attached to a Scott model 5878A power supply/ determined by 2 individuals. Fifty rats were individuallycontrol unit (Scott Environmental Technology, Inc., exposed to CO at each of the 2 flow rates to determinePlumsteadville, PA). The gas-air mixture input was variations oft, and of COHb at incapacitation. Addi-through a port in the top of the chamber, and an exhaust tional rats were exposed at each flow rate and removed atport was located on the rear panel. The entire chamber intervals (3 rats/interval) less than t, to determine the ratewas installed in a fume hood into which the chamber of increase in blood COHb saturation at each CO level;
exhaust was vented. exposure intervals were 1, 2. 3, and 4 min for the 5-minexperiments, while they were 2.5. 5, 10, 15, and 25 min
Experimental Protocol for the 35-min tests.Preliminary CO concentrations for producing incapaci-tation at 5- and 35-min exposure times were determined COffb Determinationfrom the concentration-t, curve defined in a previous At incapacitation or at the end ofeach exposure interval,study (Crane, et al., 1989). To refine the CO concentra- rats were removed f:im the chamber and killed bytions, 37 rats were exposed to CO over a range from 4658 cervical dislocation. The bodycavity was quickly opened,to 6151 ppm that would result in incapacitation at 5 min and blood was drawn into a 2.5-cc heparinized syringeand 19 rats to concentrations from 1298 to 2249 ppm to from the vena cava at the point where it enters the rightproduce incapacitation at 35 min. Cnncentrations pro- atrium. Without air contact, blood was immediatelyduced by flow rates of(25 mL.CO +4 Lair)/minand (8.5 aspirated from the syringe by the sampling probe of aml, CO + 4 1. air)/min were selected for the 5- and 35- model I11 282 CO-Oximeter (Instrumentation Labora-min t, study, respectively; these flows correspond to tories, Inc., Lexington. MA). The instrument was modi-theoretical CO concentrations of 62 11 and 2120 ppm. fled for use with rat blood; it determines COI-b by
The dynamic gas-airmixtureflowsthrough thecham- measuring the absorbance of diluted blood samples at 4her prevented changes in CO concentrations during wavelengthsinthevisiblespectrum. Reagentsandchemi-animal insertion, exposure, or ,emoval. Initial tests indi- cals used in the analysis were obtained from the CO-cared that ambient 0, levels were maintained for single Oximecer manufacturer. Each sample was analyzed in
3
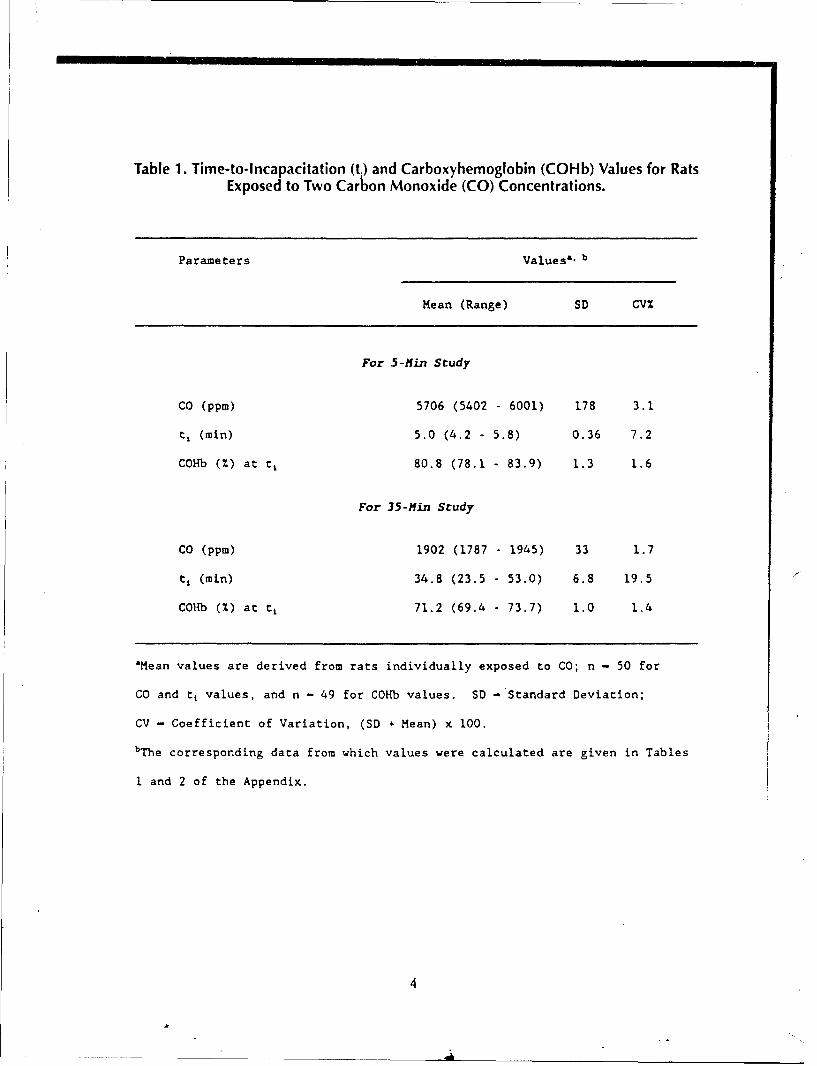
Table 1. Time-to-Incapacitation (t.) and Carboxyhemoglobin (COHb) Values for RatsExposed to Two Carion Monoxide (CO) Concentrations.
Parameters Valuesa, b
Mean (Range) SD CV%
For 5-Min Study
CO (ppm) 5706 (5402 - 6001) 178 3.1
tj (min) 5.0 (4.2 - 5.8) 0.36 7.2
COHb (%) at t, 80.8 (78.1 - 83.9) 1.3 1.6
For 35-Min Study
CO (ppm) 1902 (1787 - 1945) 33 1.7
t1 (min) 34.8 (23.5 - 53.0) 6.8 19.5
COHb (%) at tj 71.2 (69.4 - 73.7) 1.0 1.4
"Mean values are derived from rats individually exposed to CO; n - 50 for
CO and t, values, and n - 49 for COHb values. SD - Standard Deviation:
CV - Coefficient of Variation, (SD + Mean) x 100.
bThe corresponding data from which values were calculated are given in Tables
I and 2 of the Appendix.
4
triplicate; results were expressed as an average percent of Statisticsblood COHb saturation for the 3 replicate analyses. T'Ae normality of distribution of measurements was
determined by performing the Kolmogorov-SmirnovChamber CO Concentration Measurement one-sample test at a - 0.05 (Miller and Miller, 1988;Prior to and during the exposure, the chamber CO Wilkinson, 1989). Where possible, datawereanaly7,.cdatconcentration was monitored by a Carle series 100 gas a - 0.05 using theanalysis ofvariance and Tukey's HSDchromatograph (GC) equipped with 3.2-mm (i.d.) multiple comparison test for statistical pairwise differ-packedcolumnsandathermistordetector.Acontinuous ences between the groups (Wilkinson, 1989). Other-flow of chamber atmosphere (55 mL/min) was pumped wise, the significance of differences between means wasfrom the port on the access-door by a ceramic-piston checked by the Student's t-test (SigmaPlot, 1991). Apump (FMI model RRP, Fluid Metering, Inc., Oyster difference between means was considered significant atBay, NY), through the GC sample loop, rt, ,n back to the p % 0.05. Values are presented as the mean ± SD.chamber. Sample injections onto to the GC were con-
trolled by activation of an injector valve by an interval RESULTS
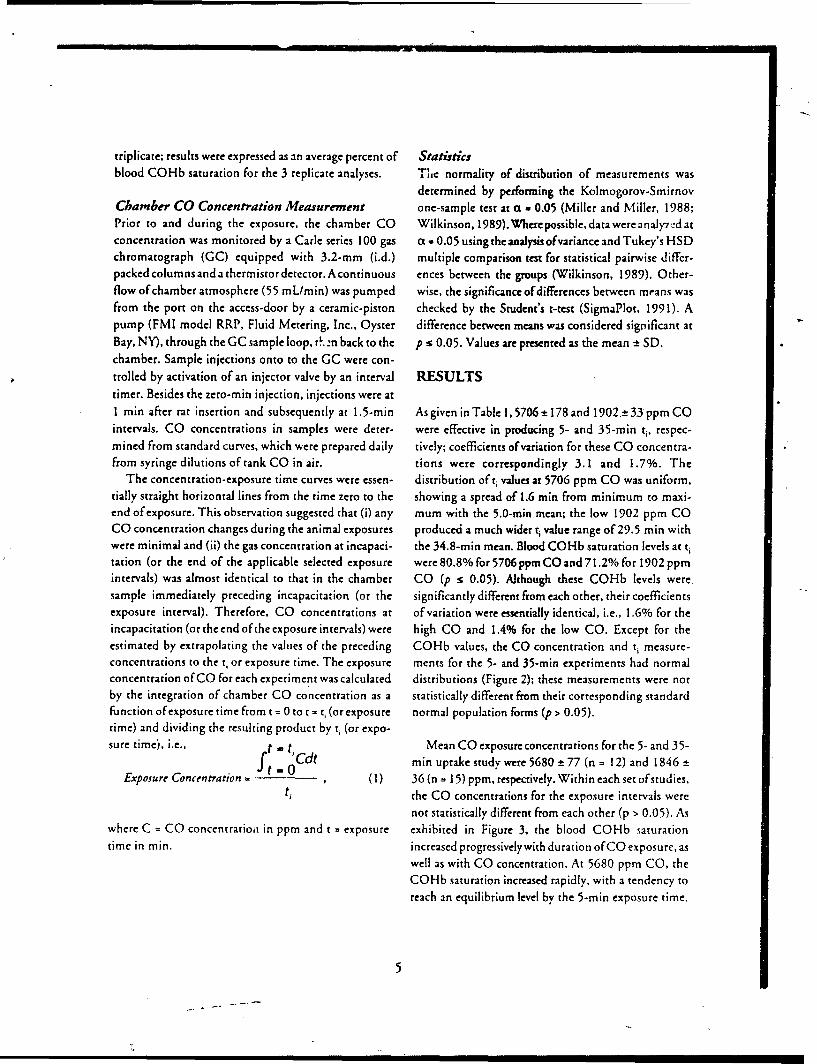
timer. Besides the zero-min injection, injections were atI min after rat insertion and subsequently at 1.5-min As given in Table 1,5706 ±178 and 1902.±33 ppm COintervals. CO concentrations in samples were deter- were effective in producing 5- and 35-min ti, respec-
mined from standard curves, which were prepared daily tively; coefficients of variation for these CO concentra-from syringe dilutions of tank CO in air. tions were correspondingly 3.1 and 1.7%. The
The concentration-exposure time curves were essen- distribution of t, values at 5706 ppm CO was uniform,tially straight horizontal lines from the time zero to the showing a spread of 1.6 min from minimum to maxi-end of exposure. This observation suggested that (i) any mum with the 5.0-min mean; the low 1902 ppm COCO concentration changes during the animal exposures produced a much wider t% value range of 29.5 min withwere minimal and (ii) the gas concentration at incapaci- the 34.8-min mean. Blood COHb saturation levels at titation (or the end of the applicable selected exposure were80.8% for 5706 ppm CO and 71.2% for 1902ppmintervals) was almost identical to that in the chamber CO (p ; 0.05). Although these COHb levels weresample immediately preceding incapacitation (or the significantly different from each other, their coefficientsexposure interval). Therefore, CO concentrations at of variation were essentially identical, i.e., 1.6% for theincapacitation (or the end of the exposure intervals) were high CO and 1.4% for the low CO. Except for theestimated by extrapolating the values of the preceding COHb values, the CO concentration and ti measure-concentrations to the to or exposure time. The exposure ments for the 5- and 35-min experiments had normalconcentration of CO for each experiment was calculated distributions (Figure 2); these measurements were notby the integration of chamber CO concentration as a statistically different from their corresponding standardfunction of exposure time from t = 0 to t = t (or exposure normal population forms (p > 0.05).time) and dividing the resulting product by ti (or expo-sure time), i.e., t . t Mean CO exposure concentrations for the 5- and 35-
Cdt min uptake study were 5680 ± 77 (n - 12) and 1846 ±
Exposure Concentration- , (1) 36 (n- 15) ppm, respectively. Within each set ofstudies,ti the CO concentrations for the exposure intervals were
not statistically different from each other (p > 0.05). Aswhere C = CO concentration in ppm and t = exposure exhibited in Figure 3. the blood COHb saturation
time in min. increased progressivelywith duration of CO exposure, as
well as with CO concentration. At 5680 ppm CO, theCOHb saturation increased rapidly, with a tendency toreach an equilibrium level by the 5-min exposure time.
5
Figure 2. Distribution of CO Exposure Concentrations, t, Values, and COHb Levels forthe 5- and 35-Min Study.
The frequency distributions were based on the measurements derived from 50 rat experiments forCO concentration and t, and from 49 rat experiments for COHb for each of the 2 studies. Thenormality of distribution of measurements was established by the Kolmogorov-Smirnov one-sample test at a = 0.05. Details are given in the text.
5-Min Study 35-Min Studya
12
* 10
u UC " S
*L6~
2 20.0_5250 5500 5730 6000 $250 1700 1800 1200 2000 2100
CO (PPM) Co (ppm)
110100
CO (pmi) CO (pmi,)
¶' 0 >.
*- i- 6
u.. 4L-
7 4 87 10 20 30 40 70 60
tj (mi) tj (mi)
is. 10
10 U
U 0 4
2
0' 075 78 81 84 87 66 68 70 72 74 76
COHb ()COHb (%)
6
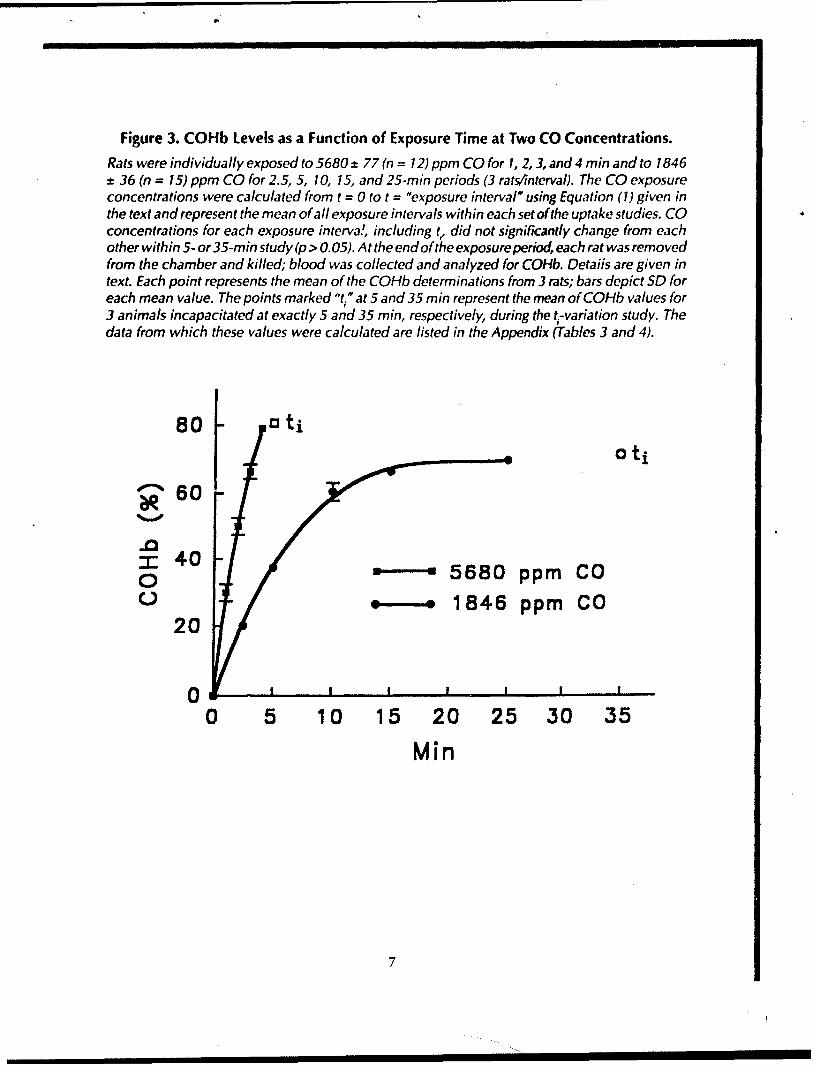
Figure 3. COHb Levels as a Function of Exposure Time at Two CO Concentrations.
Rats were individually exposed to 5680 ± 77 (n = 12) ppm CO for 1, 2,3, and 4 min and to 1846± 36 (n = 15) ppm CO for 2.5, 5, 10, 15, and 25-rnin periods (3 rats/interval). The CO exposureconcentrations were calculated from t = 0 to t = "exposure interval' using Equation (1) given inthe text and represent the mean of all exposure intervals within each set of the uptake studies. COconcentrations for each exposure interva.!, including t, did not significantly change from eachother within 5- or 35-min study (p > 0. 05). At the end of the exposure period, each rat was removedfrom the chamber and killed; blood was collected and analyzed for COHb. Detaiis are given intext. Each point represents the mean of the COHb determinations from 3 rats; bars depict SD foreach mean value. The points marked ""t "at 5 and 35 min represent the mean of COHb values for3 animals incapacitated at exactly 5 and 35 min, respectively, during the t-variation study. Thedata from which these values were calculated are listed in the Appendix (Tables 3 and 4).
80 ,1ti
oti
•'60 0
r0 40 5680 ppm CO00 . -. 1846 ppm CO
20
0 I I I!
0 5 10 15 20 25 30 35
Min
7
The CO~lb saturation increase was also observed at product within certain gas concentration and exposure1846 ppm CO. but the increase was at a slower rate than time ranges is a constant (Packham and Hartzell, 1981).
that noted at the high CO concentration; the COlib Atlowgasconcentrations.therulelosesapplicabilityand
saturation started reaching the steady state by approxi- variations in the incapacitation response become more
mately 15 min. For the high CO concentration, the pronounced (C'ane, et al., 1989). The acc•...iulated C-t
COHb values at the 4-min exposure time and at the 5- dose of 285A0 ppm'min for 5706 ppm CO and the 5
min t, were not different from each other (p > 0.05), but min t, was in reasonable agreement with the doses
these COHb values were different from 1-, 2-, or 3-min reported for incapacitation in humans (35000-45000
exposure time COHb value. Similar comparisons of ppm.min), juvenile baboons (34250 ppmomin), and
COHb data points from the low CO exposure showed active cynomolgus monkeys (21000-30000 ppmomin)
no difference between the 15- and 25-min COHb value (Kaplan and Hartzell, 1984). and in tats (30000-40000)
or between the 25-min and 35-min-t, COHb value; (Kaplan and Hartzell, 1984; Kaplan, 1988; Gad, 1990).
however, the difference between the COHb levels at the The higher C-t value of66190 ppmemin for the 35-min
15- and 35-min time point was significant (p ! 0.05). t, might be a reflection of the inapplicability of Haber's
rule and could be associated with the tolerability of lower
DISCUSSION CO concentrations by the animals, but this value was
considerably lower than the C-t values that cause lethal-
The CO exposure concentrations of 5706 and 1902 it, in the rats (Kaplan, 1988; Gad, 1990). The COHb
ppm were determined to produce nominal 5- and 35- level was significantly higher at the high CO concentra-
min ti, respectively. The modest variations in the CO tion (low C-t value) than the low CO concentration
concentrations suggested that the fluctuations observed (high Cot value).in t, values were primarily associated with the individual
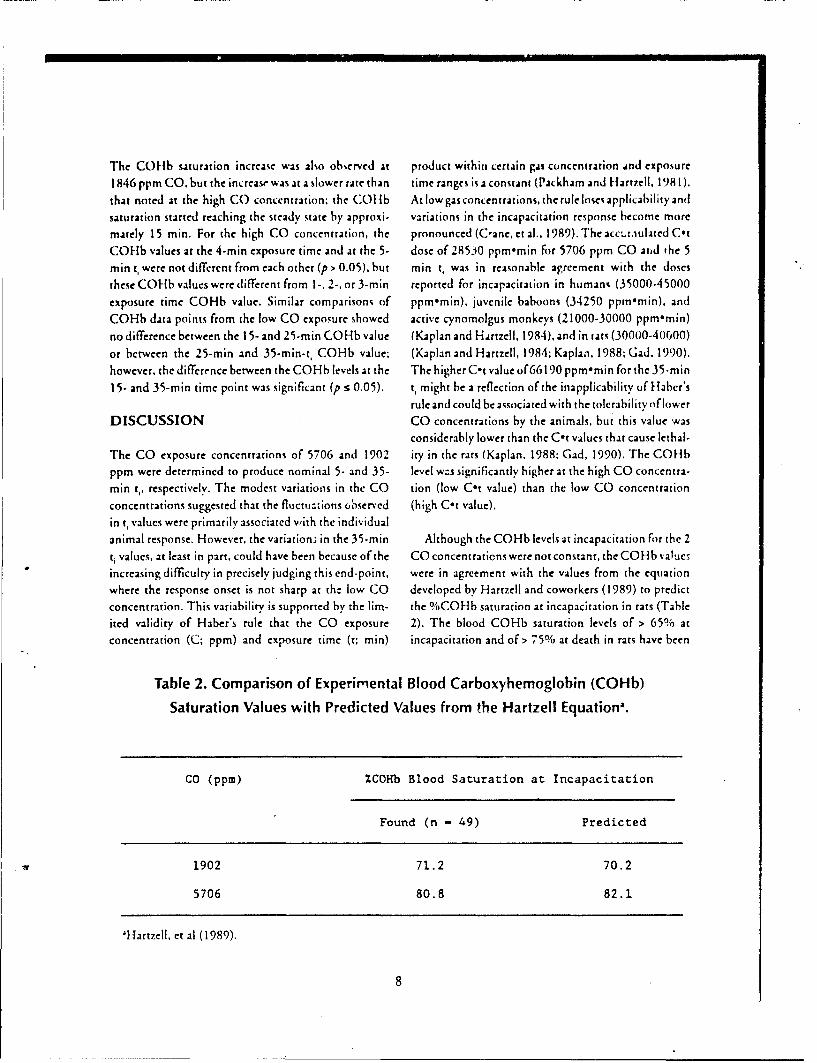
animal response. However, the variation3 in the 35-min Although the COHb levels at incapacitation for the 2
ti values, at least in part. could have been because of the CO concentrations were not constant, the COHb valuer
increasing difficulty in precisely judging this end-point, were in agreement with the values from the equation
where the response onset is not sharp at the low CO developed by Hartzell and coworkers (1989) to predict
concentration. This variability is supported by the lim- the %COHb saturation at incapacitation in rats (Table
ited validity of Haber's rule that the CO exposure 2). The blood COHb saturation levels of > 65% at
concentration (C; ppm) and exposure time (t; min) incapacitation and of> 75% at death in rats have been
Table 2. Comparison of Experimental Blood Carboxyhemoglobin (COHb)
Saturation Values with Predicted Values from the Hartzell Equation".
CO (ppm) XCOHb Blood Saturation at Incapacitation
Found (n - 49) Predicted
1902 71.2 70.2
5706 80.8 82.1
'Hartzell, et al (1989).
8
documented by Kaplan (1988). Sokal (1975) has indi- 65%; it was concluded that the presence of elevatedcated that rats showed only faint reaction to mechanical concentrations of COlib does not cause symptoms ofstimuli at a COHb level of 50-5 1% after exposure to CO toxicity and that the more probable mechanism was thatin adynamic-tlow metabolicchamber. Purser and Berrill dissolved CO, in pl.sma, competes at the cellular level(1983) found that sedentary monkeys reached 40% with 02 for cytochrome a. The blood COtib level isCOtib levels before clear indications of incapacitation indeed an indication ofseverityofCO exposure. but maywerenoted,but that active monkeys were severely intoxi- not be directly linked to the onset of incapacitation.cated at 33% COHb levels; it was also indicated in the Other parameters, such as plasma CO, could be directlystudy that a sedentary human with a COHb level of 30% related to incapacitation. Therefore, the onset of inca-might become rapidly incapacitated upon initiatior of pacitation might be more associated with the plasma COsudden physical activity in a fire situation. Gettler and concentration than the blood COHb saturation. What.Freimuth (1940) have questioned whether postmortem ever the actual mechanism, incapacitation, in our study,COHbfindingscoulddefineifapersonwasaliveordead was defined as the simple loss of ability to continuewhen first coming in contact with a fire and cited fatal walking in a motor-driven,rotatingcage. where enforced
CO poisonings with 30-40% COHb. The average blood physical activity was continuous from insertion to inca-COHb saturation levels of 40% (Mayes, 1991) and 45% pacitation; the more complex issues of visual and judg-(Veronneau, et al., 1992) have been reported in victims mental impairment were not addressed. However, theof 2 aircraft fire accidents. The possible contribution of observation that the animals were capable of apparentlyother combustion products (e.g., hydrogen cyanide) in normal physicalac:iviry for aconsiderable time after 66.causing fatalities, however, cannot be ruled out in indi- 70% COHb levels were reached is significant.viduals succumbing to smoke exposures.
SUMMARY AND CONCLUSIONSThe COHb levels in the uptake study were nearly
identical to those predicted by an equation developed by The CO exposure concentrations that produced inca-Hartzell, et al. (1989) for modeling COHb loadings pacitation at 5 and 35 mnn were correspondingly 5706versusCOconcentrations.ThepatternsofCOuptakeby and 1902 ppm; coefficients of variation in these COthe blood were clearly consistent with the computer- concentrations were 3.1 and 1.7%, respectively. Fiftyconstructed curves from their equation, showing that laboratory rats exposed to the high CO concentrationCOHb reaches a steady state that is proportional to the showed an overall response (t) variation of 7.2%, and anCO exposure concentration. At 1902 ppm CO, post- additional 50 rats exposed to the low CO concentrationMorte'm COHb analysis for any animal killed after 15 responded with an overall variation of 19.5%. BWoodmin would have indicated an incapacitating (or lethal) COHb saturation levelsat incapacitation varied with thelevel of COHb, when, in fact, the animal was neither CO concentration to which the animal was exposed,incapacitated nor dead. The very small changes in COH b reaching 80.8% saturation at 5706 ppm and only 71.2%between the time the "plateau" (steady-state) level is at 1902 ppm: these COHb levels were significantlyreached and incapacitation occurs, and the significant different from each other (p s 0.05).difference between the 5- and 35-mmn t, COHb level,require that we consider the recurrent question: "Do No specific COHb level could be linked to the onsetblood COHb levels correlate with the degree of CO of incapacitation, as the blood COHb level reached aintoxication?" and its corollary. "Can postmortem COHb plateau before incapacitation occurred at both CO con-levels reliably indicate antemortem incapacitation?" centrations. For example, at the lower CO concentra-Goldbaum (1976) has shown that dogs bled to an tion, theCOHblevelreachedanequilibrium level by 15anemicstateand, thei. infusedwithCO-saturatede ryth- min that remained essentially unchanged. when therocytes to obtain a COHb saturation of about 60% animals were incapacitated at approximately 35 min.showed no symptoms of CO toxicity, but other dogs Thus, it would appearthat postmortem COHb concen-breathing CO died with COHb saturations averaging trations may not be reliable indicators of antemorteni
9
incapacitation from CO inhalation and that appropriate Goldbaum LR (1976). Is carboxyhemoglobin concen-caveats should be applied when making judgments on tration the indicator of carbon monoxide toxicity?
the basis of COHb analyses only. In: Legal Medicine Annual, CH Wecht, ed., pp165-70.-A ppleton-Century-Crofts, New York, NY.
REFERENCES Hartzell GE (1989). Understanding of hazards tn hu-mans. In: Advances in Combustion Toxicology,
Crane CR, Sanders DC, Endecott BR, Abbott JK, Vol. 1, GE Hartzell, ed., pp 19-37. TechnomicSmith PW (1977). Inhalation toxicology: I. De- Publishing Co., Inc., Lancaster, PA.sign of a small-animal test system. 11. Determina-tio oftherdtiv toc azads f 5 arcrft Hartzell GE, Stacy HW, Switzer WG, Priest DN,tion of the relative tox~c hazards of 75 aircraft P c h m S 1 8 ) o ei g o o i o o i aPackhams SC (1989). Modeling of toxicologicalcabin materials. Department of Transportation/ effects of fire gases: IV. Intoxication of rats byFederal Aviation Administration, Washington, carbon monoxide in the presence ofan irritant. In:DC. Publication No. FAA-AM-77-9. Available Advances in Combustion Toxicology, Vol. 2, GEfrom National Technical Information Service, Hartzell, ed., pp 1-17. Technomic Publishing Co.,Springfield, VA 22161. Order No. ADA043646/ Inc.. Lancaster, PA.9G1.
Crane CR (1984). Inflight aircraft fires: Toxicological Higgins EA (1987). Summary report of the history and
aspects. Panel presentation at the Aerospace Medi- eve :s pertinent to the Civil Aeromedical Institute'scal Association Scientific Meeting, May 7, 1984, evaluation of providing smoke/fume protectivecal Dbreathing equipment for airline passenger use.San Diego, CA. Department of Transportation/Federal Aviation
Crane CR, Sanders DC, Endecott BR ('989). Inhala- Administration, Washington, DC. Publication No.tion toxicology: IX. Times-to-incapacitation for DOT/FAA/AM-87/5. Available from Nationalrats exposed to carbon monoxide alone, to hydro- Technical Information Service, Springfield. VAgen cyanide alone, and to mixtures of carbon 221!1. Order No. ADA184499.monoxide and hydrogen cyanide. Department of Kaplan i-1, Hartzell GE (1984). Modeling of toxico-
TrnprainFdrlAviation Administration, Kpa L atelG 18) oeigo oioTransportation/Federal Alogical effects of fire gases: 1. Incapacitating effectsWashington, DC. Publication No. DOT/FAA/ of narcotic fire gases. J. Fire Sci., 2, 286-305.AM-89/4. Available from National Technical In-formation Service, Springfield, VA 22161. Order Kaplan HL (1988). Evaluating the biological hazards ofNo. ADA208195. combustion products. In: Product Safety Evalua-
EUROCAE 991) Minimum operational performance tion Handbook, SC Gad, ed., pp. 409-70. Marcel
specification for passenger protective breathing Dekker, Inc., New York, NY.
equipment. EUROCAE Document No. ED-65. Mayes RW (1991). The toxicological examination ofThe European Organisation for Civil Aviat'on the victims of British Air Tours Boeing 737 acci-Equipment, Paris, France. dent at Manchester in 1985. J. Forensic Sci., 36,
Gad SC (1990). The toxicity oftsmoke and combustion 179-84.
gases. In: Combustion Toxicology. SC Gad ard McFadden EB, Reynolds HI, FunkhouserGE (1967). ARC Anderson, eds., pp 63-80. CRC Press, Boca protective passenger smoke hood. Department ofRaton, FL. Transportation/Federal Aviation Administration,
Washington, DC. Publication No. AM 67-4. Avail-Gettlcr AO, Freimuth HC (1940). The carbon monox- able from National Technical Information Set-
ide content of the blood under various conditions. vice Sr ing l V a 22161. O erNAm. . Cin.Patol.,11,60316.vice. Springfield, VA 22161. Order No.Am. J. Clin. Pathol., 11, 603-16.AD546
AD657436.
10
Miller JC, Miller IN (1988). Statistics for Analytical SigmaPlot (1991). SigmaPIot®&: Scientific GraphingChemistry, 2nd edition. Ellis Horwood Limited, Software. Jandel Scientific, Corte Madera, CA.Chichester, West Sussex, England. Sokal JA (1975). Lack of the correlation between bio-
Packham SC, Hartzell GE (1981). Fundamentals of chemical effects on rats and bloodcombustion toxicology in fire hazard assessment. carboxyhemoglobin concentrations in various con-J. Testing and Evaluation (JTEVA), 9, 341-7. ditions of single acute exposure to carbon monox-
Peterson JE, Stewart RD (1972). Human absorption of ide. Arch. Toxicol, 34,331-6.carbon monoxide from high concentrations in air. Spurgeon JC, Filipczak RA, Feher RE, Sternik SJ (1979).Amer. Ind. Hyg. Assoc. J., 33, 293-7. A procedure for electronically monitoring animal
Purser DA, Berrill KR (1983). Effects of carbon monox- response parameters using the rotating wheel. J.ide on behavior in monkeys in relation to human Combustion Toxicol., 6, 198-207.fire hazard. Arch. Environ. Health, 38, 308-15. Veronneau S. Ribe JK, Sathyavagiswaran L Lewis 1. Muto
Sanders DC, Endecott BR, Chaturvedi AK (1991). J (1992). Lessons learned from the 1991 USAir/Inhalation toxicology: XII. Comparison of toxic- SkyWest collision at LAX, presented at the 44thity rankings of six polymers by lethality and by Annwd Meetingofthe American Academy of Foren-incapacitation in rats. Department of Transporta- sic Sciences, NewOdeam, LA, February 17-22,1992.tion/Federal Aviation Administration, Washing- Wilkinson L (1989). SYSTAT: The System for Statistics.ton, DC. Publication No. DOT/FAA/AM-91/17. SYSTAT. Inc., Evanston. ILAvailable from National Technical InformationService, Springfield, VA 22161.
11
"APPENDIX
TIME-TO-INCAPACITATION (t) VALUES ANDCARBOXYHEMOGLOBIN (COHb) LEVELS
AT INCAPACITATION FOR RATS EXPOSED TOCARBON MONOXIDE (CO)
Al
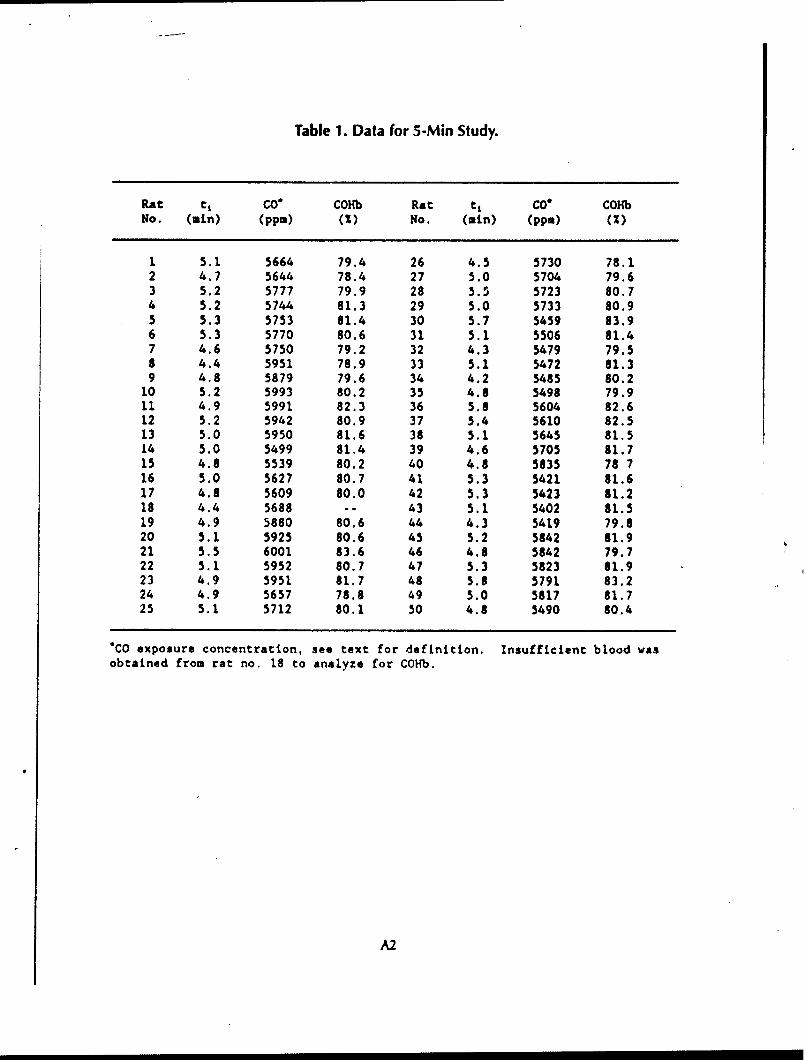
Table 1. Data for 5-Min Study.
Rat te COO COHb Rat tC CO* COHbNo. (min) (ppm) (M) No. (min) (ppm) (M)
1 5.1 5664 79.4 26 4.5 5730 78.12 4.7 5644 78.4 27 5.0 5704 79.63 5.2 5777 79.9 28 5.5 5723 80.74 5.2 5744 81.3 29 5.0 5733 80.95 5.3 5753 81.4 30 5.7 5459 83.96 5.3 5770 80.6 31 5.1 5506 81.47 4.6 5750 79.2 32 4.3 5479 79.58 4.4 5951 78.9 33 5.1 5472 81.39 4.8 5879 79.6 34 4.2 5485 80.2
10 5.2 5993 80.2 35 4.8 5498 79.911 4.9 5991 82.3 36 5.8 5604 82.612 5.2 5942 80.9 37 5.4 5610 82.513 5.0 5950 81.6 38 5.1 5645 81.514 5.0 5499 81.4 39 4.6 5705 81.715 4.8 5539 80.2 40 4.8 5835 78 716 5.0 5627 80.7 41 5.3 5421 81.617 4.8 5609 80.0 42 5.3 5423 81.218 4.4 5688 43 5.1 5402 81.519 4.9 5880 80.6 44 4.3 5419 79.820 5.1 5925 80.6 45 5.2 5842 81.921 5.5 6001 83.6 46 4.8 5842 79.722 5.1 5952 80.7 47 5.3 5823 81.923 4.9 5951 81.7 48 5.8 5791 83.224 4.9 5657 78.8 49 5.0 5817 81.725 5.1 5712 80.1 50 4.8 5490 80.4
*CO exposure concentration, see text for definition. Insufficient blood wasobtained from rat no. 18 to analyze for COHb.
A2
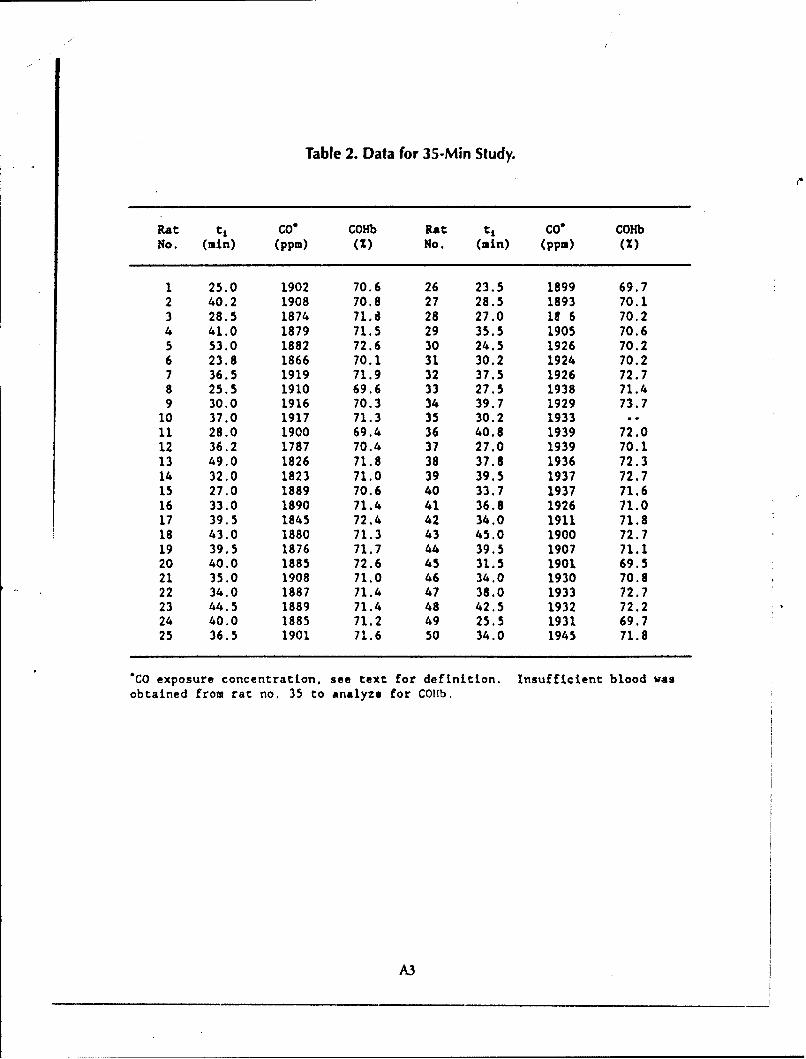
Table 2. Data for 35-Min Study.
Rat tt CO* COHb Rat tj CO* COHbNo. (min) (ppm) (M) No. (min) (ppm) (M)
1 25.0 1902 70.6 26 23.5 1899 69.72 40.2 1908 70.8 27 28.5 1893 70.13 28.5 1874 71.8 28 27.0 1s 6 70.24 41.0 1879 71.5 29 35.5 1905 70.65 53.0 1882 72.6 30 24.5 1926 70.26 23.8 1866 70.1 31 30.2 1924 70.27 36.5 1919 71.9 32 37.5 1926 72.78 25.5 1910 69.6 33 27.5 1938 71.49 30.0 1916 70.3 34 39.7 1929 73.7
10 37.0 1917 71.3 35 30.2 1933 --
11 28.0 1900 69.4 36 40.8 1939 72.012 36.2 1787 70.4 37 27.0 1939 70.113 49.0 1826 71.8 38 37.8 1936 72.314 32.0 1823 71.0 39 39.5 1937 72.715 27.0 1889 70.6 40 33.7 1937 71.616 33.0 1890 71.4 41 36.8 1926 71.017 39.5 1845 72.4 42 34.0 1911 71.818 43.0 1880 71.3 43 45.0 1900 72.719 39.5 1876 71.7 44 39.5 1907 71.120 40.0 1885 72.6 45 31.5 1901 69.521 35.0 1908 71.0 46 34.0 1930 70.822 34.0 1887 71.4 47 38.0 1933 72.723 44.5 1889 71.4 48 42.5 1932 72.224 40.0 1885 71.2 49 25.5 1931 69.725 36.5 1901 71.6 50 34.0 1945 71.8
"CO exposure concentration, see text for definition. Insufficient blood wasobtained from rat no, 35 to analyze for COib.
A3
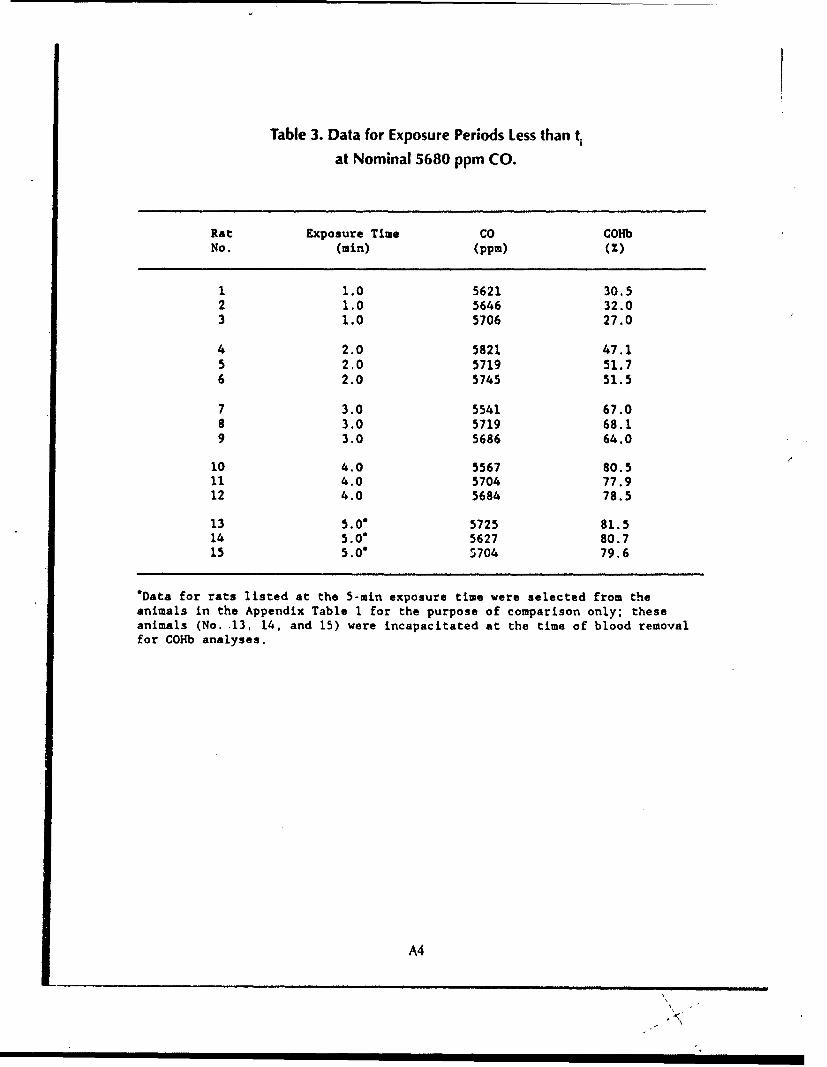
Table 3. Data for Exposure Periods Less than t,
at Nominal 5680 ppm CO.
Rat Exposure Time CO COHbNo. (min) (ppm) (M)
1 1.0 5621 30.52 1.0 5646 32.03 1.0 5706 27.0
4 2.0 5821 47.15 2.0 5719 51.76 2.0 5745 51.5
7 3.0 5541 67.08 3.0 5719 68.19 3.0 5686 64.0
10 4.0 5567 80.511 4.0 5704 77.912 4.0 5684 78.5
13 5.0" 5725 81.514 5.0' 5627 80.715 5.00 5704 79.6
"Data for rats listed at the 5-min exposure time were selected from theanimals in the Appendix Table 1 for the purpose of comparison only; theseanimals (No. 13, 14, and 15) were incapacitated at the time of blood removalfor COHb analyses.
A4
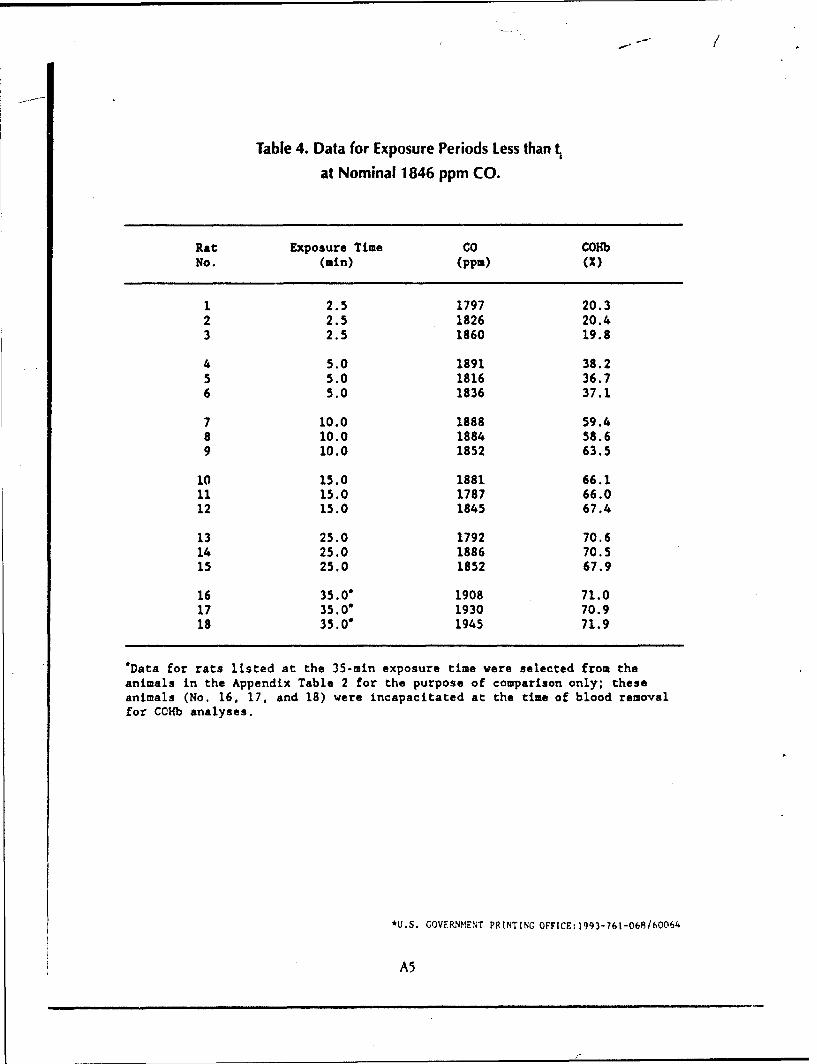
Table 4. Data for Exposure Periods Less than
at Nominal 1846 ppm CO.
Rat Exposure Time CO COlibNo. (min) (ppm) (M)
1 2.5 1797 20.32 2.5 1826 20.43 2.5 1860 19.8
4 5.0 1891 38.25 5.0 1816 36.76 5.0 1836 37.1
7 10.0 1888 59.48 10.0 1884 58.69 10.0 1852 63.5
10 15.0 1881 66.111 15.0 1787 66.012 15.0 1845 67.4
13 25.0 1792 70.614 25.0 1886 70.515 25.0 1852 67.9
16 35.0" 1908 71.017 35.0" 1930 70.918 35.0" 1945 71.9
"Data for rats listed at the 35-min exposure time were selected from theanimals in the Appendix Table 2 for the purpose of comparison only; theseanimals (No. 16, 17, and 18) were incapacitated at the time of blood removalfor CCHb analyses.
*U.S. GOVERNMENT PRINTING OFFICE:1993-761-068/60064
A5


![THE DEATH PENALTY AS INCAPACITATION · 2018-10-23 · 2018] The Death Penalty As Incapacitation 1125 deterrence; the Connecticut Supreme Court recently proclaimed that “[i]t is](https://img.pdfslide.net/doc/110x75/5e49e9941a3d017c6709d249/the-death-penalty-as-2018-10-23-2018-the-death-penalty-as-incapacitation-1125.jpg)