Embed Size (px)
Citation preview

AD-Ai74 33 A DESCRIPTION OF THE FAILURE DISTRIBUTIONS OF SELECTED i/IMINUTEMAN III GUID U) AIR FORCE INST OF TECHU RIGHT-PATTERSON AFB OH SCHOOL OF SYST A E SISK
UNCLR55IFIED SEP 86 RFIT/GLM/LSH/86S-76 F/G 16/2 U
EEEEEEEEEEEEEEEEEEEEEEIIEEEEIIIEEIIIEEIIEEElElhllEEEIIEEEllllEEEEEE~lE
1.01 1.____ .3IjM 2 _5_
1.2.8
ROCOPY RESOLUTION TEST CHARTNATIONAL BUREAU OF STANDARDS-1q3A
%
lam,- ---- --
DTI CE LECTE
NOV 2 50
DISTRIBUTIONS OF SELECTED MINUTEMAN IIIITGUIDANCE SYSTEM ELECTRONIC CARDSD RUI'lTHESIS
Albert E. SiskCaptain, USAF
AFIT/GLM/LSM/86S-7 6
f.. Pb] r-:-:o(id lxie; itsCi-ti.Jutor is uninnied
LA- DEPARTMENT OF THE AIR FOR-CE
AIR UNIVERSITY
AIR FORCE INSTITUTE OF TECHNOLOGY
Wrght-Patterson Air Force Base, Ohio
86 2501
AFIT/GLM/LSM/86
A DESCRIPTION OF THE FAILUREDISTRIBUTIONS OF SELECTED MINUTEMAN III
GUIDANCE SYSTEM ELECTRONIC CARDS
THESIS
Albert E. SiskCaptain, USAF
AFIT/GLM/LSM/86S-76
Approved for public release; distribution unlimited

The contents of the document are technically accurate, and nosensitive items, detrimental ideas, or deleterious information iscontained therein. Furthermore, the views expressed in thedocument are those of the author and do not necessarily reflectthe views of the School of Systems and Logistics, the AirUniversity, the United States Air Force, or the Department ofDefense.
I Accesion ForaNTIS CRA&4 -
DTIC TAB
By t
- -- a bnyCod

AFIT/GLM/LSM/86S-76
A DESCRIPTION OF THE FAILURE
DISTRIBUTIONS OF SELECTED MINUTEMAN III
GUIDANCE SYSTEM ELECTRONIC CARDS
THESIS
Presented to the Faculty of the School of Systems and Logistics
of the Air Force Institute of Technology
Air University
In Partial Fulfillment of the
Requirements for the Degree of
Master of Science in Logistics Management
Albert E. Sisk, B.S.
Captain, USAF
September 1986
Approved for public release; distribution unlimited

Acknowledgements
The author wishes to express his thanks and
appreciation to the many individuals who assisted in this
effort and provided guidance and motivation throughout its
preparation.
Major Phillip E. Miller provided the necessary sense
of purpose, motivation, and, most importantly, sense of
humor to guide this effort. Without him, there would be
no report.
Lt Col Carlos Talbott provided much technical
assistance and background for the processes used in this
research.
Equally important is a very close friend, Captain
Judyann L. Munley. She listened to all of the complaints,
worries, and frustrations, and always provided a look at
the positive side - this research would eventually be
finished.
Mr. Bob Wallin and Mr. Aksel Aydoner, OOALC/MMEAS, who
provided the data used in this research and any background
information that I could have possibly dreamed up.
My wife Janet, whose understanding, patience, and love
saw us through this difficult year.
ii

Table of Contents
Page
Acknowledgements ...................... ii
List of Figures ...................... v
List of Tables ....................... vi
Abstract. ........................ vii
I. Introduction. .................... 1
Background. ................... 1General Issue .................. 2Specific Problem. ................ 3Research objectives ............... 4
Ii. Literature Review .................. 6
Hazard Functions. ................ 6Hazard Plots. .................. 7Bathtub Curve .................. 8Total Time on Test Plot ............. 9Failure Distributions. ............ 14Exponential Failure Distribution. ........ 15Weibull Failure Distribution. .......... 17Reliability......................18Maintainability Strategis..........20Summary.....................22
III. Methodology.....................24
Particular Method. .............. 24Data Description .. .............. 25Data Selection .. .. .. .. .. .. .. .. 26Summary.....................32
IV. Results.......................33
BQE Card Type Results. ............ 33BQQ Card Type Results ............. 37BTJ Card Type Results. ............ 41SUQ Card Type Results .......... . . . 45SYL Card Type Results. ............ 49Summurary . . .. .. .. .. .. ... .. .. 53
iii

Page
V. Conclusions and Recommendations .. ........ .. 55
Research Objectives ... ............ .. 55Conclusions ..... ................ .. 55Recommendations for Further Research .... 58Summary ...... .................. .. 59
Appendix A: Original Data and Format ........... ... 61
Appendix B: Fortran Programs ... ............ .. 62
Appendix C: Table of Random Units ... .......... .. 63
Appendix D: Total Time on Test Program . ....... . 64
Appendix E: GRAFTALK Command Structure . ....... .. 66
Bibliography ........ ..................... .. 67
Vita .......... ......................... . 69
iv
4
List of Figures
Figure Page
1. Halley's Mortality Table Hazard Function . . . 7
2. Bathtub Curve......................8
3. Sample TTT Plot Using Calculationsfrom Table I...................12
4. Weibull Probability Densities. .......... 19
5. Weibull Hazard Functions.............19
6. Sample GRAFTALK Plot................31
7. BQE 1st Lifetime Plot ................. 34
8. BQE 2nd Lifetime Plot ............... 35
4.9. BQE 3rd Lifetime Plot ................. 36
10. BQQ 1st Lifetime Plot ............... 38
11. BQQ 2nd Lifetime Plot ................. 39
12. BQQ 3rd Lifetime Plot ................. 40
13. BTJ 1st Lifetime Plot ................. 42
14. BTJ 2nd Lifetime Plot ................. 43
15. BTJ 3rd Lifetime Plot ................. 44
16. SUQ 1st Lifetime Plot ................. 46
17. StJQ 2nd Lifetime Plot ................. 47
18. SUQ 3rd Lifetime Plot ............... 48
19. SYL 1st Lifetime Plot ................. 50
20. SYL 2nd Lifetime Plot ............... 51
21. SYL 3rd Lifetime Plot ............... 52
I
List of Tables
Table Page
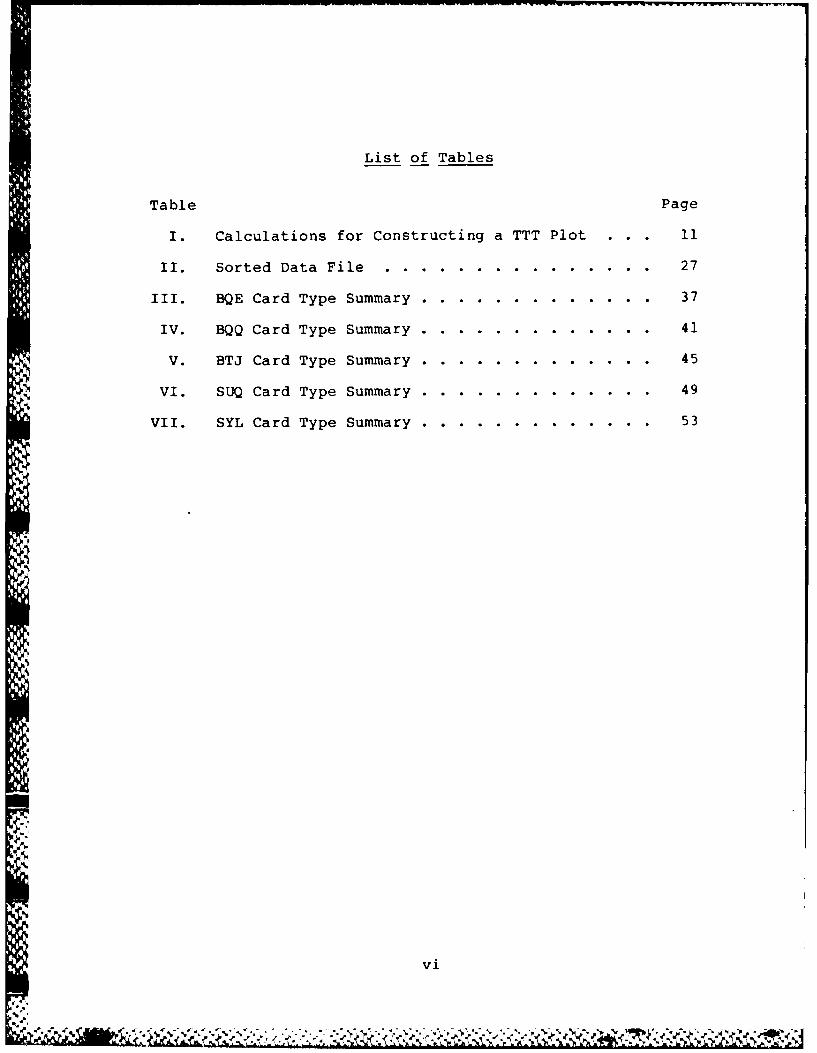
I. Calculations for Constructing a TTT Plot . . 11
II. Sorted Data File .... ............... 27
III. BQE Card Type Summary ... ............. . 37
IV. BQQ Card Type Summary ... ............. . 41
V. BTJ Card Type Summary ... ............. . 45
VI. SUQ Card Type Summary ... ............. . 49
VII. SYL Card Type Summary ... ............. . 53
vi
' * .% ,, ,<% %-% . .+ .-. ,. - . . % . - -. .-.- - - .- . " " " " " " .. " " ""

AFIT/GLM/LSM/86S-76
Abstract
This research described the failure distributions
of selected Minuteman III guidance system electronic cards
and was the first attempt to use the Total Time on Test
graphical technique to detect failure patterns. The data
analysis was performed by using a Zenith 100 computer
program that performed the Total Time on Test calculations
and the Reliability Data Acquisition and Analysis
Techniques software package.
The objectives of the research were to 1) describe the
failure distributions of selected Minuteman III electronic
*.:° cards, 2) determine if the corresponding hazard function
demonstrated infant mortality, useful life, or wearout, and
3) suggest management strategies to deal with wearout or
infant mortality.
Five individual cards were selected and the first
three lifetimes of each card were examined. Nine of the
fifteen cards indicated an exponential failure distri-
bution, the other six were identified as either a Weibull
or a normal failure distribution.
The results of this research indicate that some of
A the lifetimes did show signs of wearout; however, it was
determined that no management actions were required because
of the large mean lifetimes of the cards affected.
vii

A DESCRIPTION OF THE FAILURE
DISTRIBUTIONS OF SELECTED MINUTEMAN III
GUIDANCE SYSTEM ELECTRONIC CARDS
I. Introduction
Background
The reliability of military systems after long periods
of dormancy has been a major concern throughout military
history. A system which is taken out of storage is
expected to complete its mission without performance
degrading malfunctions. As military systems continue to
become more complex, their expected response time has also
shortened. To meet these requirements, reliability must
increase. Newer missile systems are being developed, as
much as possible, to be deployed as "wooden rounds." In
other words, the system would require very minimal field
level maintenance. Any corrective maintenance would be
accomplished at depot level. This concept would deliver
the missile to the operational unit as an "all up round"
(totally assembled) and would require no installation of
any parts, components, or subsystems. This concept applies
to the missile only, not to any launch support system or
launch platform (19:7).
1
..." .... 0.. . -.. .,..,- :. -.. .-.....- ... .. -. -.-.-,..K - -. ... , .. : .. --. - ,*.. • ... .. ..

The Minuteman Intercontinental Ballistic Missile
(ICBM) weapon system has been deployed in its role of
strategic nuclear deterrence since the early 1960s. When
it was first deployed as the Minuteman I, its guidance
system had a typical lifetime (mean time between failure
[MTBF]) of approximately 600 hours (15:122). Since that
time the Minuteman II and the Minuteman III versions of
the weapon system have been deployed. The Minuteman III
version now has a MTBF on the guidance system in excess of
10,000 hours (11:124). In other words, the Minuteman
guidance system reliability improvement has gone from more
than one failure per month per site to one failure every
fifteen months per site. The Minuteman II system is
currently undergoing a major modification that will allow
it to meet or exceed the MTBF standard established by the
Minuteman III. These improved MTBF standards are being
established by a weapon system that was designed during
the 1950s and was expected to function for only ten years.
However, Minuteman has been deployed for more than 20 years
and is currently scheduled to be on alert through the year
2000. This is indicative of what a reliability and
maintainability enhancement program can achieve if given
sufficient funds and management attention.
General Issue
The problem for this research is detecting if infant
mortality, wearout, or useful life exists in electronic
2
'ZIr
components and its effect on the reliability and
maintainability (R & M) of Air Force weapon systems.
The emphasis on R & M is increasing because of the
impact of R & M on weapon system readiness, as well as
on operational and support costs. Many factors influence
R & M; however, this research effort will focus on a method
for detection of failure distributions in electronic cards
of the Minuteman III guidance system. This is important
because infant mortality increases maintainability costs
and reduces reliability because of increased failures early
in a system's life. Wearout, on the other hand, may limit
readiness due to increased failures in a system's life.
Specific Problem
The research question is defined as detecting which
failure distribution exists in specific Minuteman III
guidance system electronic cards. The specific problem for
this research is the identification of infant mortality,
wearout, or useful life in Minuteman III guidance system
electronic cards. Infant mortality is characterized, by a
decreasing rate of failure early in the life of a component
or system. Wearout occurs when there is an increasing rate
of failure late in the life of a component or system.
Useful life is characterized by a constant rate of failure.
The reliability of an item is the probability of that item
being able to perform its function for a specific period
of time in its environment. Stated simply, reliability is
3

the chance the item will work when it is supposed to. If
failure rates are high, as in infant mortality, the chances
of the item working when required are reduced. Traditional
measures of reliability such as mean time between failures
cannot signal infant mortality or wearout. For this
reason, we need new methods of detecting these problems.
There has been much research done on methods of detecting
various failure modes and the one that this research effort
will use is the Total on Test (TTT) graphical technique.
Research Objectives
The objectives of this research effort are to:
1. Describe the failure distributions of electronic
cards in the Minuteman III guidance system.
2. Determine if the corresponding hazard function
demonstrates infant mortality, wearout, or useful
life.
3. Suggest management strategies for reducing any
infant mortality in the Minuteman III guidance
system, and if evidence of wearout exists, suggest
preventive maintenance strategies for management
consideration.
This portion of the thesis introduced the subjects
4of reliability, maintainability, infant mortality, wearout
and useful life. Methods for detecting infant mortality,
wearout, and useful life were identified. We have also
discussed the specific problem for this research -
4
A- ,,, .. . ., . : .-. . . .. . . . . , . ,. , . . .
detecting infant mortality, wearout, or useful life in
certain electronic cards in the Minuteman III guidance
system. The next portion of the thesis will discuss some
of the pertinent literature available on these topics.
5

II. Literature Review
This portion of the thesis will examine some of the
literature on the types of failure characteristics and
their impact on weapon system readiness. We focus on the
reliability topics of decreasing, constant, and increasing
hazard functions, as well as the total times on test
transform technique which is a useful graphical represen-
tation of the hazard function. Our interest in the hazard
functions is motivated by a recognition that management
policy can offset the negative effects of infant mortality
or wearout without resorting to expensive redesign.
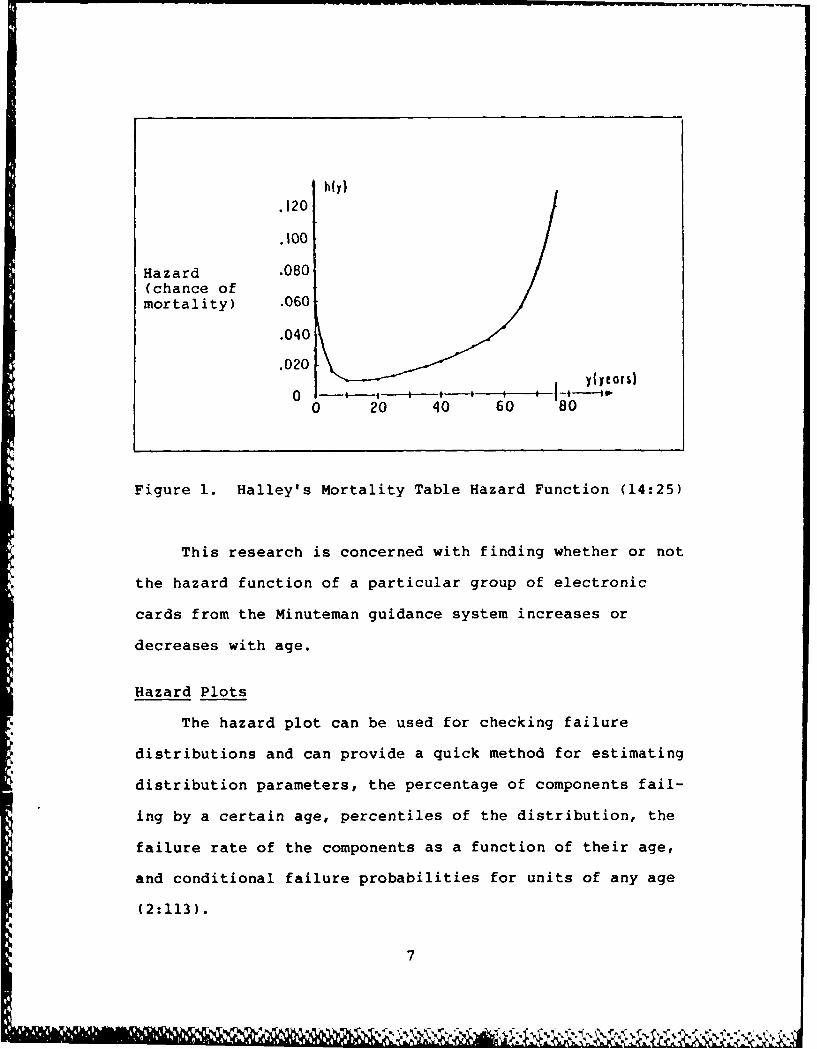
Hazard Functions
The hazard function is defined as the probability
of failure in a finite interval of time. It is the
instantaneous failure rate at age t. The hazard function
is a measure of proneness to failure as a function of age
and is used by life insurance companies to forecast human
mortality (14:25). Halley's mortality table is illustrated
in Figure 1 as an example of a hazard function and
demonstrates that as age initially increases, the hazard
function decreases. Then as age increases, so does the
hazard function (14:25).
6
hmy).120
.100
Hazard .080(chance ofmortality) .060
.040
.020
0 20 40 60 80
Figure 1. Halley's Mortality Table Hazard Function (14:25)
This research is concerned with finding whether or not
the hazard function of a particular group of electronic
cards from the Minuteman guidance system increases or
decreases with age.
Hazard Plots
The hazard plot can be used for checking failure
distributions and can provide a quick method for estimating
distribution parameters, the percentage of components fail-
ing by a certain age, percentiles of the distribution, the
failure rate of the components as a function of their age,
and conditional failure probabilities for units of any age
(2:113).
7
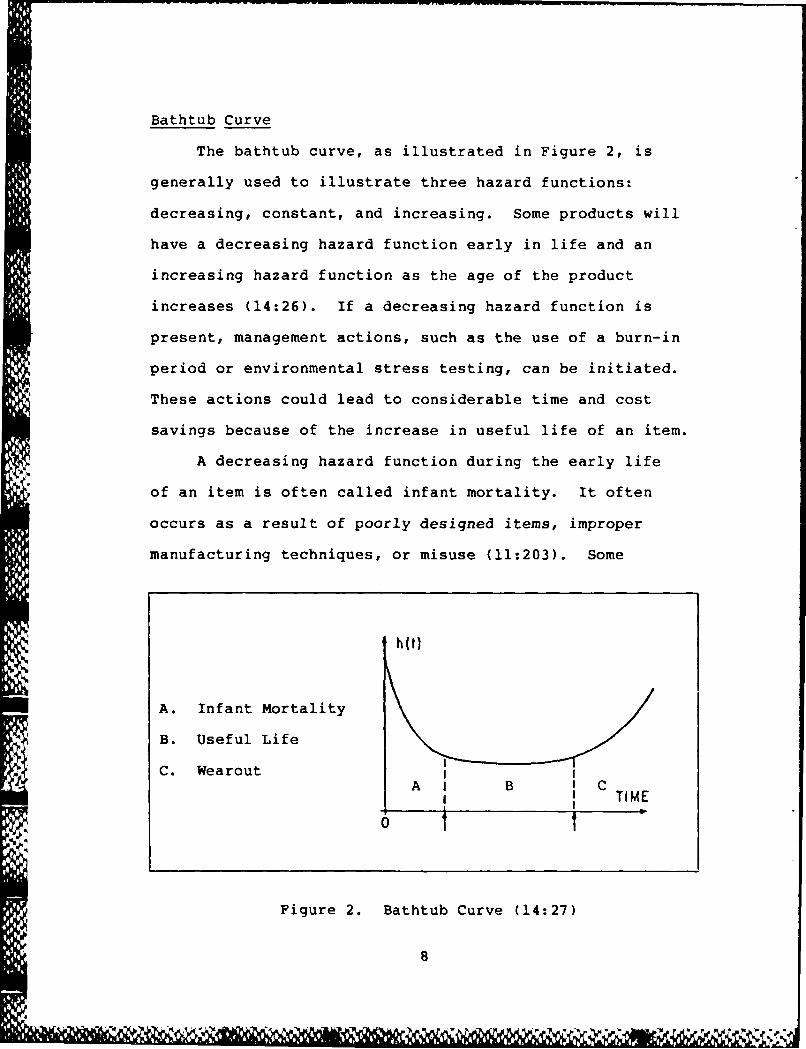
Bathtub Curve
The bathtub curve, as illustrated in Figure 2, is
generally used to illustrate three hazard functions:
decreasing, constant, and increasing. Some products will
have a decreasing hazard function early in life and an
increasing hazard function as the age of the product
increases (14:26). If a decreasing hazard function is
present, management actions, such as the use of a burn-in
period or environmental stress testing, can be initiated.
These actions could lead to considerable time and cost
savings because of the increase in useful life of an item.
A decreasing hazard function during the early life
of an item is often called infant mortality. It often
occurs as a result of poorly designed items, improper
manufacturing techniques, or misuse (11:203). Some
h t)
A. Infant Mortality
B. Useful Life
4 C. Wearout. A I B C
TIME
Figure 2. Bathtub Curve (14:27)
8
electronic components are subjected to a burn-in process
to reduce infant mortality effects prior to being put into
service. When this burn-in is accomplished, the components
ideally enter service in the lowest portion of the hazard
function and the reliability of the components is increased
(14:26). This portion of a component's life is also
referred to as useful life (9:26). During the component's
useful life, the hazard function is essentially constant
and the exponential distribution can be used to describe
its life.
An increasing hazard function during the component's
life can be said to correspond to wear-out failure. Such
hazard functions often indicate that failures are due to
the product wearing out (14:26). If wearout is indicated,
preventive maintenance strategies may be considered by
management to improve reliability.
Total Time on Test Plot
% The failure of a component may, in many situations,
be costly and possibly even dangerous. In the case of the
components being examined, a failure is obviously costly in
terms of weapon system readiness, as well as the manhours
required to repair the component. If this research is able
to determine that used units are more prone to failure than
newer ones, perhaps it may be to our benefit to replace a
used component after a certain period of time (7:467).
9

Barlow and Campo developed a method that aids in the
determination of the failure distribution of an item using
observed data (4:451-481). Their technique is called the
Total Time on Test Plot (TTT) and graphically represents a
transform of the empirical failure distribution for the
item being examined. The data is ranked from shortest to
longest lifetime and the total time on test statistic is
calculated as
T(X (i ) = (n-l+j) (X - X(jI ) (2.1)
j=l
where
i = 1,2,...n
n = the sample size
T(X(0)) 0
T(X(i)) = the total time on test statistic, and
XCi) = the ith ordered lifetime.
Use of TTT plots allows easy identification of
increasing failure rate (IFR) and decreasing failure rate
(DFR) distributions. A constant failure rate distribution,
or exponential distribution, is represented by a 45 degree
line commencing at the origin and proceeding up and to the
right. If the TTT plot identifies an IFR, the plot would
be distinguished by its convex shape. In other words, the
plot would bow away from the horizontal axis (i/n). The
DFR is represented by a concave plot that bows toward the
10
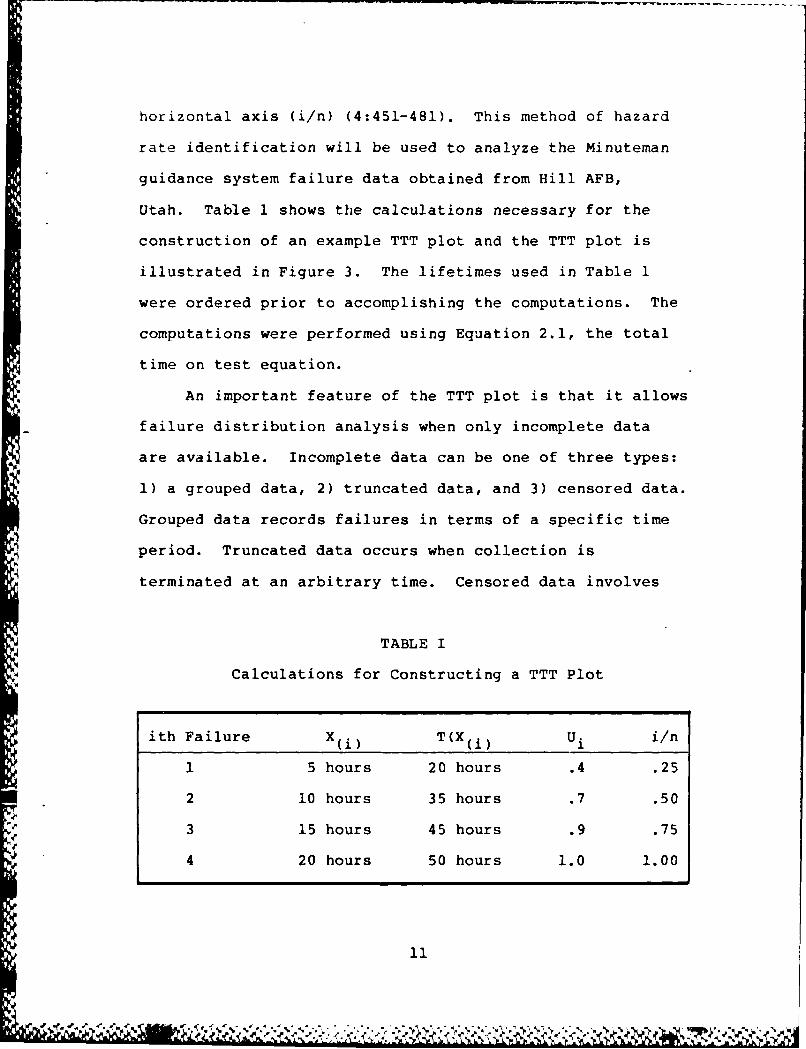
horizontal axis (i/n) (4:451-481). This method of hazard
rate identification will be used to analyze the Minuteman
guidance system failure data obtained from Hill AFB,
Utah. Table 1 shows the calculations necessary for the
construction of an example TTT plot and the TTT plot is
illustrated in Figure 3. The lifetimes used in Table 1
were ordered prior to accomplishing the computations. The
computations were performed using Equation 2.1, the total
time on test equation.
An important feature of the TTT plot is that it allows
failure distribution analysis when only incomplete data
are available. Incomplete data can be one of three types:
1) a grouped data, 2) truncated data, and 3) censored data.
Grouped data records failures in terms of a specific time
period. Truncated data occurs when collection is
terminated at an arbitrary time. Censored data involves
TABLE I
Calculations for Constructing a TTT Plot
ith Failure X(i ) T(X(i ) Ui i/n
1 5 hours 20 hours .4 .25
2 10 hours 35 hours .7 .50
3 15 hours 45 hours .9 .75
4 20 hours 50 hours 1.0 1.00
11
' _ -t~l' t, .% '..%- % .-,- .. %..-/., -; ;%. %, % .-G,,. - , , ,,_..,-j. %I,

1.0
.8
.6
U. .4
.2
.2 .4 .6 .8 1.0
i/n
Figure 3. Sample TTT Plot Using Calculations from Table I
the termination of collection after a specific number of
failures. Each of these types of data can be analyzed
by modifying the TTT plot through the total time on test
equation, Equation 2.1. However, the technique does
have limitations. When actual data is used, sample size,
removal of unfailed parts (withdrawal), and truncation can
affect the results (4:451).
Barlow and Proschan identify tests that can be used
to help identify the particular failure distribution when
truncated data is used. An exponential distribution can be
identified by a "crossings test"; how many times the plot
crosses the 45 degree line (4:456). If th' failure rate is
12
,..

exponential and n is the number of failures, the probability
of the TTT plot being entirely above or below the 45 degree
line is 1/n. Another test is the total area between the
TTT plot and the 45 degree line that is compared to a
tabulated statistic (4:470). Barlow and Proschan also
show that the TTT plot from a truncated sample will always
be farther away from the 45 degree line than plots of the
same size that come from complete data (4:472).
Truncations and withdrawals can also be dealt with
by graphic estimation of a distribution and plotting of
the TTT transform for the full sample size. Barlow and
Proschan provide a review of failure processes and the
normal, lognormal, gamma, and Weibull distributions
(5:9-44).
Another tool used in this research to determine
failure distributions is the Reliability Data Acquisition
and Analysis Techniques (RDAAT) software package that is
available for the Zenith 100 computer. The program was
written for the Air Force by the BDM Corporation. The
basic purpose of RDAAT is to establish a more accurate
approach to reliability analysis using state-of-the-art
statistical techniques. These techniques will provide
more accurate reliability estimates of systems and line
replaceable units (LRUs) by determining more accurate life
predictions and providing insight into forecasting and
manpower requirements (16:1,2).
13
)-,VIA i, .i,

Statistical inferences are made by identifying the
best fit for the failure distribution of the data. The
RDAAT program does this by applying goodness-of-fit test
statistics and hazard plotting techniques to the data
(16:5). The software will check the goodness-of-fit for
the Weibull, normal, lognormal, exponential, exponential
power, logistic, and extreme value distribution functions.
The basic tests used to check the fit of the curves
generated are the Smith-Bain and Tiku goodness-of-fit tests
that are in the RDAAT software package. Both of these
tests are considered to be more powerful statistics than
either the Chi-square or Kolmogorov-Smirnov goodness-of-
fit tests when incomplete data is used (16:5; 18:261).
Failure Distributions
Failure distributions are attempts to describe
mathematically the length of life of a material, structure,
or a component. The modes of possible failure for the
item in question will affect the form of the failure
distribution (5:9).
A variety of distributions have been used to describe
the life length of electronic and mechanical components.
Here, we discuss the exponential and the Weibull distri-
butions because of their applicability to this research.
The exponential distribution is often used to describe
useful life and the Weibull distribution is often used to
describe infant mortality or wearout (14:27).
14
a '... , .. . . , ,.. .. . - - . . - , .. - -,4 k, . . . ' ,

Exponential Failure Distribution
A characteristic of the exponential distribution is
that it has an instantaneous failure rate that is constant
. over time. For example, the chance of failure for an old
item that has not failed over a specified period of time
is the same as that for an unfailed new item over the same
length of time (14:26). While the exponential distribution
has a number of desirable mathematical properties, its
uses are limited because of the following property: it
can be proven that if the life length of an item has the
exponential distribution, previous use does not affect its
* 'future life length. The exponential distribution is the
S only distribution with this property (5:15).
The exponential distribution has been used as a model
for the life of many components because this distribution
describes components subject to chance failures. In other
words, the probability of failure of an item is the same at
any point in age. The exponential distribution may be used
to describe the time between failures for items that can be
repaired and is also used to describe produce life after
units have gone through a burn-in up to the time they start
to wear out (14:18). The exponential distribution consists
of outcomes t > 0 and the probability density function
(pdf)
f(t) = (1/8) exp(-t/E)), t>0, (2.2)
15
_... A '_1%

w the parameter e (theta) is called the distribution
, and must be positive. e is expressed in the same
units as t, such as hours, cycles, years, etc. (14:18).
The mean of the exponential distribution is
CO
E(X) = Jexp(-x/9)dx = e (2.3)
0
This shows why the parameter e is called the mean time to
failure (MTTF). In terms of the failure rate \, E(X)=l/X.
When e is called the MTBF, it is being used to describe
repairable equipment with exponentially distributed time
between failures.
The reliability function R(x) for a life distribution
is00
R(x)=P(X>x} = f(x)dx. (2.4)
x
This is the probability of a component surviving beyond
age x. It is also called the survivorship function.
Statisticians and actuaries have long worked with
cumulative distributions for the fraction failing, but
public relations minded engineers have turned them around
and called them reliability functions (14:21).
The mathematical representation of the hazard function
is
h(t) = f(t)/R(t) (2.5)
16
?..'.. 4 % *~ 4 ~ 4 " ~ .

and is the instantaneous failure rate at age t. It is also
the ratio of the probability density function at time t to
the probability of survival through the interval (O,t).
The hazard function is also called the hazard rate,
mortality rate, and the force of mortality (14:25).
Weibull Failure Distribution
The Weibull distribution has been found to be useful
in a wide variety of applications, especially those that
apply to product life. One of the reasons that this
distribution has proved so popular is that it has a large
number of shapes that make it very flexible in fitting data
(14:36).
'The literature sugg-sts that this distribution may be
used to describe single components that will cause a system
failure (14:36). For example, the failure characteristics
of a "weakest link" type of component could be described by
the Weibull distribution. The electronic cards in the
Minuteman III guidance system are a "weakest link" type of
component. The failure of one of the electronic cards in
the Minuteman III guidance system will cause a system
failure.
The Weibull probability density function is
f(x) = (8/)x x-lexp[-(x/c)8], x>O. (2.6)
The parameter a (beta) is called the shape parameter and is
positive. The parameter at (alpha) is called the scale
17
'1

parameter and is also positive. Alpha is in the same units
as age x and beta is a dimensionless pure number (14:36).
For the special case of B = 1, the Weibull
distribution is the exponential distribution. Figure 4
shows examples of Weibull probability densities with
various shape parameters.
Figure 5 shows Weibull hazard functions. Note that
the hazard function for 8 = 1 (the exponential distri-
bution) is a constant failure rate, the hazard function
for 8 = .5 is decreasing, and the hazard function for
B = 2 is increasing. This ability to describe the various
failure rates are why the Weibull distribution is popular
for describing the lifetimes of data (14:39).
Reliability
Just as the tensions of the cold war continue to be a
fact of life, weapon and space systems reliability has
become a factor that influences the bargaining position of
nations. If a war should start, weapon system reliability
will help determine a nation's chance of survival.
Electronics reliability is at the heart of the question
because few weapons or space systems can reach their
targets or objectives without reliable systems or
subsystems (13:1). When reliability is considered from an
economic viewpoint, high reliability is desired to reduce
overall operations and support costs (1:3).
18

f (y4
2
0 aa3a
Figure 4. Weibull Probability Densities (14:37)
00=
0 a 2a 3a
Figure 5. Weibull Hazard Functions (14:39)
19

A widely accepted definition of reliability is "the
probability of a device performing its purpose adequately
for the period of time intended under the operating
conditions encountered." "This definition implies that
reliability is the probability that the device will not fail
to perform as required for a certain length of time" (6:22).
In short, reliability is adequate performance over time;
i.e., it is a measure of how long an item will operate
before it fails. It is a straightforward concept that
encompasses the ability to depend on something and is a
necessary requirement for any operational equipment (12:24).
Maintainability Strategies
Like reliability, maintainability is an engineering
discipline. It was developed to provide designers with a
source of specialized skills and knowledge related to
supporting and maintaining systems. The requirement came
from the increasing complexity, size, and number of items
that make up a system. As systems become more complex,
they also become more costly to support and maintain (9:1).
The primary push for maintainability comes from the
DOD and its military programs. However, general industry
is also taking steps to advance this concept in support of
their products and to help combat rising costs. The basic
principles of the military specifications and standards of
private industry are the same; they differ only in the
particular needs of each user (9:4).
20
The objective of maintainability should be to design
and develop complete systems that can be serviced in the
least amount of time, cost, and with a minimum expenditure
of support resources without affecting the performance or
safety of the system (9:1). However, if there is evidence
of wearout, then some preventive maintenance program may
enhance the reliability and maintainability of a deployed
system.
The study of reliability and maintainability has
resulted in several methods for determining optimum preven-
tive maintenance strategies for many types of components.
Talbott (17:1-2) covers four strategies of preventive
maintenance which are based on age and condition. The
first strategy is age replacement. Age replacement is
used when the age and condition of the system is known and
is the replacement or repair of the item to an "as new"
condition. This method replaces the item(s) of interest at
failure and at a predetermined point in time without regard
to the age of the item(s). Block replacement requires
information about the item's condition, but not its age.
These two conditions have the uncertainty of not knowing
the item's lifetime. If failure cannot be detected except
by inspection, then the item's condition is also unknown
between inspections. The third maintenance strategy,
called maintenance inspection, involves periodic inspection
of the items at specific time intervals and replaces only
21

items that have failed. Talbott's last strategy is called
blind replacement. This method replaces items without
regard to their condition at a predetermined time interval
and does not require inspection of the items between the
time intervals. This method is practical if the cost of
replacement is less than the cost of inspection. Talbott
points out that a failed unit is not replaced at time of
failure when using the last two methods and that these
strategies should be considered for use only when failure
of the item of interest is not fatal to the entire system
(17:1-2).
In order for any of these strategies to be effective,
the serviceability of the system should not be a factor.
For example, a critical part that would be cheap to replace
at specific time intervals should not be buried deep in the
center of the system and take an excessive amount of time
to replace.
Summary
This review examined the literature on reliability,
maintainability, hazard functions, failure rates, and the
total time on test method of graphically representing a
hazard function. Planned maintenance strategies were also
discussed. The strategies presented provide managers with
four options to use in improving the reliability and
maintainability of deployed systems.
22

The literature authored by Talbott, Barlow and
Proschan, Barlow and Campo, and Bergman provided much of
the direction for this research effort. Each author has
provided substantial insight to the areas of reliability,
maintainability, hazard functions and rates, and failure
rate distributions. However, the total time on test
statistic, introduced by Barlow and Campo and modified by
Bergman, is used extensively in this research effort.
23
9
-V V.~

III. Methodology
This chapter describes the methods used to determine
the failure distributions and corresponding hazard
functions of the Minuteman III guidance system electronic
cards that were selected for this research. Here we also
describe the data used in this research, how the data was
segregated by card type, the sampling plans used, and the
computer program used to analyze the data. We also
describe the particular location within the Minuteman III
guidance system of the individual electronic cards selected
for this research.
Particular Method
The general method of detecting infant mortality,
wearout, or useful life in the electronic cards of the
Minuteman III guidance system was done by computer analysis
of lifetime failure data. Lifetime failure data were
*provided by the statistical analysis branch of the Material
Management Engineering Division located at Ogden Air
Logistics Center (OOALC/MMEAS). This group is located at
i Hill AFB, Utah, and their function is to do statistical
analysis of Minuteman failure data. The data was sent to
us in magnetic tape format.
V The data were analyzed on a Zenith 100 Computer,
utilizing a computer program written by Major John Kutzke,
24

an Air Force Institute of Technology (AFIT) instructor.
The computer program was used to construct total time on
test (TTT) plots of the failure data. A total time on test
plot, which plots the total time on test or time exposed to
risk versus calendar time, provided information about the
failure rate function and assisted us in the determination
of whether or not infant mortality, wearout, or useful life
existed in the components being examined.
Burn-in periods and environmental stress testing are
possible methods for dealing with infant mortality. The
maintenance strategies discussed in Chapter II are possible
" - methods for dealing with wearout. Both strategies are
possible methods for improving system reliability.
Data Description
The data was provided by OOALC/MMEAS to the researcher
on a magnetic tape configured in a 116-column record
length, 30 records per block, 3480 blocks format. It was
formatted at 5250 bytes per inch (BPI) and labeled in the
Extended Binary Coded Decimal Interchange Code (EBCDIC)
format. This format is not compatible with the magnetic
tape reading equipment available for research support at
AFIT. The tape was reformatted into a 116-column record
length, 60 records per block, 6960 blocks, unlabeled,
American Standard Code Information Interchange (ASCII)
format. This format is compatible with the tape reading
equipment available in the AFIT computer support area.
25

A sample of the data and the data format are contained in
Appendix A. All of the data were configured sequentially
by card type (alphabetically) and by serial number within
each card type. Air Force Logistics Command (AFLC)
Regulation 66-308, Attachment 3, provides a complete
description of the data format.
Data was provided on 44 different types of electronic
cards. The cards were from two main locations within the
Minuteman III guidance system, the stabilized platform and
the missile guidance set control. Five cards were selected
for analysis, four are from the guidance set control, and
the other is from the stabilized platform. These cards
were selected because they had more than two lifetimes and
had a large population. The card that was selected from
the stabilized platform has started on its sixteenth life-
time. This card was selected so that we could examine
those lifetimes for any changes in its failure distribution
or mean lifetimes.
Data Selection
In preparation for analysis, the data was segregated
into particular lifetimes by card type using a Fortran
program prepared by the researcher. Each of these
segregated lifetimes contained 1) electronic cards that had
failed a certain number of times, and 2) electronic cards
that had been temporarily removed from service for reasons
other than failure, but had not yet failed again. For
26

example, all electronic cards that had experienced a single
failure were sorted into one file, all electronic cards
that had experienced two failures were sorted into another
file, and so on until all available lifetimes were
segregated. However, each of these files also contained
entries for cards that had been temporarily removed form
service for reasons other than failure. There were cards
included in the data that had not yet experienced failure
and they were also sorted into a segregated file. An
example of a sorted data file containing failures and
removals is shown in Table II.
Each of the segregated lifetimes was broken down into
one file containing failures only, and another file that
contained electronic cards that were removed for reasons
other than failure. Each lifetime would therefore contain
TABLE II
Sorted Data File
Card Serial Hours Failures Hours SinceNumber Number Last Failure
BKM 988 61361 1 61631 (failure)
BKM 988 78120 2 16489 (failure)
BKM 988 82294 2 20663 (removal)
BKM 992 50954 1 50954 (failure)
BKM 992 81447 2 30493 (removal)
.'
27

failures and temporary removals for reasons other than
failure. Failures are identified as uncensored data and
removals identified as censored data. The data was then
analyzed using each card type's individual lifetimes as a
separate group.
The Fortran programs in Appendix B were written by the
researcher and used to separate all of the data into
individual files. One program was used to separate all of
the data into individual lifetimes, and each separation
required that the program be changed to read a different
file, write the new information to a different file, and
read a different number of records. A different program
was used to separate the electronic cards that had failures
from those electronic cards that did not. This program is
4also included in Appendix B.The columns of information selected from the entire
data base for this research were the card type, item serial
number, the cumulative operational hours, cumulative
verified failures, and hours since last verified failure.
The individual data files ranged in size from 2184 entries
to 21 entries. Sampling levels and plans from Military
Standard 105D, Table 7-1 and Table 7-2, were used to select
the sample sizes from the individual data sets that had
V." populations too large for the Zenith 100 to calculate. The
sample sizes from Military Standard 105D were chosen
because the standard has been proven to be mathematically
28
and statistically sound (10:1). Individual samples
were selected from the large files by the use of random
numbers from the random number table in the CRC Standard
Mathematical Tables text. A sample of the random number
table used is shown in Appendix C.
After all of the data was segregated into individual
files, each file was printed in hard copy so that samples
could be selected and all necessary data was readily
available for input into the Zenith 100 computer. The
data entered was the difference between the cumulative
operational hours and the hours since the last failure. In
the case of the electronic cards with no failures or only
one failure, these hours represented cumulative operational
hours until data selection was made. For the electronic
cards with more than one failure, these hours represented
the difference between the cumulative operational hours and
the hours since last verified failure. The electronic
cards that were used as censored data used the difference
between the current removal hours and the last removal for
a reason other than a failure. In many cases, individual
cards had more than one removal between failures. The
above process was repeated, when required, for each removal
for reasons other than failure.
The program used by the Zenith 100 computer for data
manipulation is Total Time on Test 1 (TTTI). The program
is an adaptation of a Fortran program written by Lt Col
29

Carlos Talbott, HQ USAF/LE-RD, in support of his doctoral
dissertation research. The program was rewritten in ZBASIC
programming language by Major John Kutzke, AFIT/LSM, and
modified by Captain William Rimpo and the researcher. A
printout of the program is provided in Appendix D. The
program performs all calculations required in support of
the Total Time on Test Transform described in Chapter II
of this thesis.
The data was input by individual lifetime into the
Zenith 100 computer and calculations performed by the TTTI
program. When calculations are completed, the TTT1 program
provides a data file that can be plotted using the Total
4, Time on Test graphical technique. The data for this
research was plotted using the GRAFTALK software that is
available for the Zenith 100 computer. An example of the
command formats used by the GRAFTALK software for this
research is provided in Appendix E.
The GRAFTALK plots were used to perform a portion of
the data analysis. The plots gave a visual indication of
whether or not infant mortality, wearout, or useful life
was occurring in the individual data file. The plots were
i.f also used in determining possible failure distributions for
the individual data files. An example of a GRAFTALK plot
4... is shown in Figure 6.
Another tool employed to assist the researcher in
determining individual failure distributions was the
30
- %

.8
.3
.2
. 2 .3 .4 .5 .6 .7 .8 9 1
Figure 6. Sample GRAFTALK Plot
Reliability Data Acquisition and Analysis Techniques
(RDAAT) program for the Zenith 100 computer. The program
was written for the Air Force by the BDM Corporation.
According to the BDM Corporation, the basic use for RDAAT
is to establish a more accurate approach to reliability
analysis using state-of-the-art statistical techniques
(16:1-2). These techniques will provide more accurate
reliability estimates of systems, and line replaceable
units (LRUs) by determining more accurate life predictions
and providing insight into forecasting and manpower
requirements.
31

Five electronic cards were selected as subjects for
this research. The cards that were selected are from the
missile guidance set control, the x, y, and z ECA
accelerometers, the 4.8 kilocycle power supply, the 400
cycles per second fan power supply, and the Minuteman III
stabilized platform.
Summary
The results of these applied methods will allow us to
complete the research objectives of describing the failure
distributions of selected electronic cards in the Minuteman
III guidance system and determine if the corresponding
hazard functions demonstrate infant mortality, wearout, or
useful life. By accomplishing these objectives, we will
also answer the research question of whether or not infant
mortality, wearout, or useful life exists in these
electronic cards.
This portion of the research has explained the
methodology used to reduce the initial data file into
segregated lifetimes so that an analysis could be performed
on each lifetime to determine: 1) if a particular failure
distribution is present, 2) if infant mortality or wearout
is present, or 3) if the lifetime is in useful life. The
next chapter of this research will report the results of
the data analysis, give a graphical representation of the
identified failure distribution, and report on the results
of the RDAAT statistical analysis.
32
I- - . - - - , - . n
IV. Results
This portion of the research reports the results
of the data analysis performed using the total time on
test graphical method and the Zenith 100 computer RDAAT
statistical program. We report the failure distribution,
hazard function, and indicated lifetime pattern for each
of the five types of electronic cards examined. This
research examined the first three lifetimes of each of the
five card types for the indicated failure distribution,
hazard function and lifetime pattern. The results will be
reported in lifetime order by particular card type serial
number prefix.
BQE Card Type Results
The first electronic card type to be reported on is
from the 4.8 kilocycle power supply and has a serial number
prefix of BQE. The total time on test plot for the first
lifetime, shown in Figure 7, indicates the possibility of
a Weibull distribution. The RDAAT statistical program
gives the Weibull distribution hazard plot a .94 corre-
lation coefficient and a shape parameter of 1.51. The
RDAAT statistical program also indicates that a normal
distribution may be the correct failure distribution and
the normal distribution has a .97 correlation coefficient
shown on its hazard plot. The Tiku goodness-of-fit test
33

.9
.c
-N .4
.3
.2 F ,- .1 .2 .3 .4 .5 .6 .7 .6 .9 1
PERCEI1 OF FAILURES
Figure 7. BQE 1st Lifetime Plot
for the normal distribution gives a .00003 chance of
rejecting the null hypothesis when the normal distribution
is, in fact, correct. These statistical tests give the
indication of wearout existing in the first lifetime of
this particular electronic card. The mean lifetime is
48623.69 hours for this electronic card.
The second lifetime total time on test plot for the
BQE electronic card type, shown in Figure 8, indicates
the possibility of an exponential distribution. The RDAAT
hazard plot for the exponential distribution gives a .99
correlation coefficient and the Smith-Bain goodness-of-
fit test indicates a .013 chance of rejecting the null
34

.9
.8
.7
.5
.3
.2
.1
, .3 .2 .3 .4 .5 .6 .7 .8 .9
PERCEN OF FRAILURES
Figure 8. BQE 2nd Lifetime Plot
hypothesis when the exponential distribution is correct.
The Tiku goodness-of-fit test indicates a .003 chance of
rejecting the null hypothesis. The RDAAT statistical
program also indicates that the Weibull distribution has
a .95 correlation coefficient on its hazard plot with a
.88 shape parameter. These statistical tests give the
indication that this electronic card is in useful life.
The mean lifetime is 10083.83 hours for this electronic
card.
The third lifetime total time on test plot for the BQE
electronic card type, shown in Figure 9, indicates the
possibility of an exponential distribution. The RDAAT
35

1
.6
.7
.3
.2
.3
--4.I .2 .3 .4 .5 .6 .7 .9 .9 I
* ~ PERCENT OF FAILURES
Figure 9. BQE 3rd Lifetime Plot
hazard plot for the exponential distribution gives a .98
correlation coefficient and the Tiku goodness-of-fit test
indicates a .0005 chance of rejecting the null hypothesis
when the exponential distribution is correct. The RDAAT
statistical program also indicates that the Weibull failure
distribution hazard plot has a correlation coefficient of
*1.0 with a 1.31 shape parameter. These statistical tests
give the indication that this electronic card is in useful
life. The mean lifetime is 16100.42 hours for this
electronic card. Table III summarizes the results for
the BQE electronic card.
36
AI

TABLE III
BQE Card Type Summary
Card Li4etime Mean Tested RDAAT Goodness-Type Life Distribution Correlation of-fit
(Hazard Tiku Sith-Bain
Plot)
rOG I 48623.69 Norial .97 .00003Weibull .940=I.51
2 10083.83 Exponential .99 .001 .013Weibul] .95 .Ib3B=.88
16100.42 Exponential .q8 .0005Weibu!] 1.0
B=l.31
BQQ Card Type Results
The second electronic card type to be reported on is
from the 400 cycles per second fan power supply and has a
serial number prefix of BQQ. The first lifetime total time
on test plot, shown in Figure 10, indicates the possibility
of an Weibull failure distribution. The RDAAT hazard
plot for the Weibull distribution gives a .98 correlation
coefficient and a shape parameter of 1.12. The RDAAT
program also gives the normal failure distribution hazard
plot a .98 correlation coefficient and the Tiku goodness-
of-fit test indicates a .0284 chance of rejecting the null
hypothesis when the normal failure distribution is correct.
These statistical tests indicate that this electronic card
37
%..
.9A- //
.3-
.7
.2
. .2 .3 .4 .5 .6 .7 .1 .9 1
PERIEN1 OF FAILURES
Figure 10. BQQ ist Lifetime Plot
may be experiencing wearout. The mean lifetime is 46778.39
hours for this electronic card.
The second lifetime total on test plot for the BQQ
electronic card, shown in Figure 11, indicates the
possibility of an exponential failure distribution. The
RDAAT program hazard plot for the exponential distribution
gives a 1.0 correlation coefficient. The Smith-Bain
goodness-of-fit test indicates a .01 chance of rejecting
the null hypothesis and Tiku goodness-of-fit test indicates
a .0000 chance of rejecting the null hypothesis when the
exponential distribution is correct. The RDAAT statistical
program also indicates the Weibull failure distribution
38

.9
.8
.7
a °5
.6
.3
4 .1 .2 .3 .4 .5 .6 .7 .5 9
PERCEI OF FAILURES
Figure 11. BQQ 2nd Lifetime Plot
hazard plot has a correlation coefficient of .99 with a
.70 shape parameter. The Smith Bain goodness-of-fit test
indicates a .50 chance of rejecting the null hypothesis
when the Weibull distribution is correct. These statis-
tical tests give the indication that this electronic-card
is in useful life. The mean lifetime is 8175.70 hours for
this electronic card.
The third lifetime total on test plot for the BQQ
electronic card, shown in Figure 12, indicates the
possibility of a Weibull failure distribution. The
RDAAT program hazard plot for the Weibull distribution
39
. ,
. .3 1 . 6 . . .
PRCENI OF FAILURES
Figure 12. BQQ 3rd Lifetime Plot
gives a .98 correlation coefficient and a shape parameter
of 1.04. The RDAAT program also gives the normal failure
distribution a .98 correlation coefficient and the
Tiku goodness-of-fit test indicates a .0000 chance of
rejecting the null hypothesis when the normal distribution
is correct. These statistical tests indicate that this
electronic card may be experiencing wearout. The mean
lifetime is 23216.02 hours for this electronic card.
Table IV summarizes the results for the BQQ electronic
card.
40

TABLE IV
BQQ Card Type Summary
Card Lifetime Mean Tested RODAT Goodness-Type Life Distribution Correlation of-fit
(hours) Coefficient(Hazard Tiku Smith-Bain 1Plot)
BQQ 1 46778.38 Normal .9B 02 .4Neibull .98
=1.12
8175.70 Exponential 1.0 .00O0 .01eibul! .99 .50
O= .7
3 23216.02 Normal .98 .0000Weibull .98
b=1.04
BTJ Card Type Results
The third electronic card type to be reported on is
from the missile guidance set control and has a serial
number prefix of BTJ. The first lifetime total time on
test plot for the BTJ electronic card, shown in Figure 13,
indicates a normal failure distribution. The RDAAT program
hazard plot for the normal distribution gives a .97 corre-
lation coefficient. The Smith-Bain goodness-of-fit test
indicates a .01 chance of rejecting the null hypothesis and
the Tiku goodness-of-fit test indicates a .0000 chance of
rejecting the null hypothesis when the normal distribution
is correct. The RDAAT statistical program also indicates
that the Weibull failure distribution hazard plot has a
41

.6
. .S,
.3
.2
; . .I L L L L . I L
.2 .2 .3 .4 .5 .6 .7 .8 .9
PERCENI OF FAILURES
Figure 13. BTJ 1st Lifetime Plot
correlation coefficient of .96 and a .81 shape parameter.
The Smith-Bain goodness-of-fit test indicates a .07
chance of rejecting the null hypothesis when the Weibull
distribution is correct. These statistical tests indicate
that this electronic card may be experiencing wearout. The
mean lifetime is 34938.01 hours for this electronic card.
The second lifetime total time on test plot for the
BTJ electronic card, shown in Figure 14, indicates an
*V exponential failure distribution. The RDAAT program
hazard plot gives a .99 correlation coefficient for the
exponential distribution and the Tiku goodness-of-fit test
42
~ ~ .. . NA.

.4
.3
.2 .
- .6-
PEREENI OF FRILURES
Figure 14. BTJ 2nd Lifetime Plot
indicates a .0000 chance of rejecting the null hypothesis
when the exponential distribution is correct. The RDAAT
program hazard plot for the Weibull failure distribution
indicates a 1.0 correlation coefficient and a 1.16 shape
parameter. These statistical tests indicate that this
electronic card is in useful life. The mean lifetime is
14145.02 hours for this electronic card.
The third lifetime total time on test plot for the
BTJ electronic card, shown in Figure 15, indicates an
exponential failure distribution. The RDAAT program
hazard plot gives a .96 correlation coefficient for the
43

.3
S .I .2 .3 4 .5 . 7
PElCEI'X OF FAILURES
Figure 15. BTJ 3rd Lifetime Plot
. exponential distribution and the Tiku goodness-of-fit test
indicates a .0000 chance of rejecting the null hypothesis~when the exponential distribution is correct. The RDAAT
~program hazard plot for the Weibull failure distribution
indicates a .96 correlation coefficient and a .72 shape
Z."'parameter. These statistical tests indicate that this
,. .+electronic card is in useful life. The mean lifetime
is 11762.23 hours for this electronic card. Table V
.e.".-summarizes the results for the BTJ electronic card.
44
- .- ". ... ---., ,,X. i ",, i L im l, ' ,-- ' " " -' , , . " " -' /- -,- ,,-. --'- " -" ' , '

TABLE V
BTJ Card Type Summary
Card Lifetime Mean Tested ROAAT 6oodness-Type Life Distribution Correlation of-fit
(hours) Coefficient(Hazard Tiku Smith-BainPlot)
BTJ 1 34932.01 Normal .97 .0000 .01Weibull .96 .07
2 14145.02 Exponential .99 .0000Weibull 1.0=1.16
J 11762.23 Exponential .96 .0000Weibull .96L.72
SUQ Card Type Results
The next electronic card type to be reported on is
from the x, y, or z ECA accelerometer and has a serial
number prefix of SUQ. The first lifetime total time on
test plot, shown in Figure 16, indicates an exponential
failure distribution. The RDAAT program hazard plot
gives a .72 correlation coefficient for the exponential
distribution and the Tiku goodness-of-fit test indicates
a .0948 chance of rejecting the null hypothesis when the
exponential distribution is correct. The RDAAT program
hazard plot gives a .92 correlation coefficient for the
normal distribution and the Tiku goodness-of-fit test
indicates a .0000 chance of rejecting the null hypothesis
when the normal distribution is correct. These statistical
45
r( ~ ~ (

91
.4
.3
• .I .2 .3 .4 .5 .6 .7 .1 .9
PERCENI OF FAILURES
Figure 16. SUQ 1st Lifetime Plot
tests indicate that this electronic card may be experi-
encing wearout. The mean lifetime is 45472.72 hours for
this electronic card.
The second lifetime total time on test plot for the
SUQ electronic card, shown in Figure 17, indicates a normal
failure distribution. The RDAAT program hazard plot gives
a .99 correlation coefficient for the normal distribution.
The Weibull distribution hazard plot as a .96 correlation
coefficient with a shape parameter of 1.42. The Smith-Bain
goodness-of-fit test indicates a .021 chance of rejecting
the null hypothesis and the Tiku goodness-of-fit test
indicates a .0024 chance of rejecting the null hypothesis
46
N -
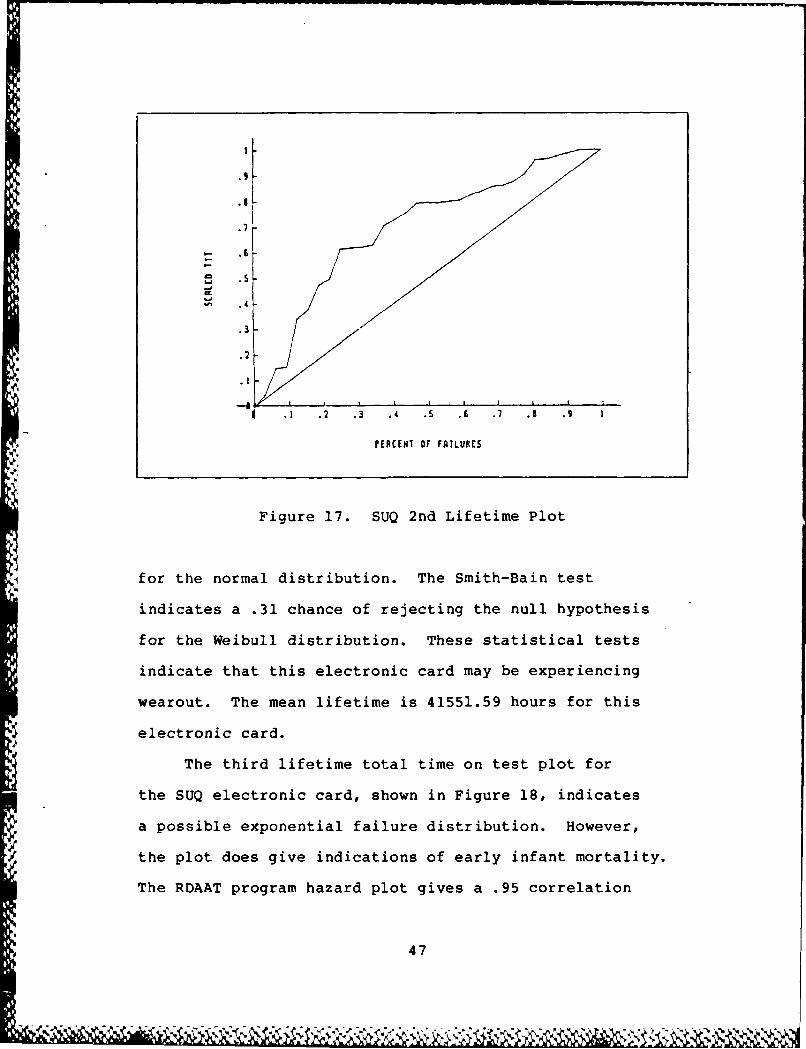
.t
Figure 17. SUQ 2nd Lifetime Plot
for the normal distribution. The Smith-Bain test
indicates a .31 chance of rejecting the null hypothesis
for the Weibull distribution. These statistical tests
indicate that this electronic card may be experiencing
wearout. The mean lifetime is 41551.59 hours for this
electronic card.
The third lifetime total time on test plot for
the SUQ electronic card, shown in Figure 18, indicates
a possible exponential failure distribution. However,
the plot does give indications of early infant mortality.
The RDAAT program hazard plot gives a .95 correlation
47

.8 -
.7 -
.2
.3
.2
.1 .2 .3 .4 .5 .6 .7 .8 .9 1
tERCEN1 OF FRILURES
Figure 18. SUQ 3rd Lifetime Plot
coefficient for the exponential distribution and the
Tiku goodness-of-fit test indicates a .0000 chance of
rejecting the null hypothesis when the exponential
distribution is correct. The RDAAT program also indicates
that the Weibull failure distribution has a .96 correlation
coefficient with a .68 shape parameter. These statistical
tests indicate that this electronic card is in useful life.
The mean lifetime is 11206.53 hours for this electronic
card. Table VI summarizes the results for the SUQ
electronic card.
48

TABLE VI
SUQ Card Type Summary
Card Lifetime Mean Tested RDAT Goodness-Type Life Distribution Correlation of-fit
(hours) Coefficient(Hazard 1iku Saith-BainPlot)
SUe 1 45472.72 Exponential .72 .094BNormal .92 .0000
2 41551.59 Normal .99 .0024 .0210Weibull .96 .316=1.42
3 11206.53 Exponential .95 .0000Weibull .96B=.68
SYL Card Type Results
The last electronic card type to be reported is from
the Minuteman III stabilized platform and has a serial
number prefix of SYL. The first lifetime total time on
test plot, shown in Figure 19, indicates an exponential
failure distribution. The RDAAT program hard plot
gives a .97 correlation coefficient for the exponential
distribution. The Smith-Bain goodness-of-fit test
indicates a .01 chance of rejecting the null hypothesis
and the Tiku goodness-of-fit indicates a .0000 chance
of rejecting the null hypothesis when the exponential
distribution is correct. The RDAAT program hazard plot
for the Weibull failure distribution indicates a .99
49
- -. , ,...

.9
.3
I4 .1 .2 .3 .4 .5 .6 .7 .8 .9 1
P[RCEN1 OF FAILURES
Figure 19. SYL 1st Lifetime Plot
correlation coefficient and a .99 shape parameter. The
Smith-Bain goodness-of-fit test indicates a .195 chance of
rejecting the null hypothesis when the Weibull distribution
is correct. These statistical tests indicate that this
electronic card is in useful life. The mean lifetime is
11359.13 hours for this electronic card.
The second lifetime total time on test plot for
the SYL electronic card, shown in Figure 20, indicates
an exponential failure distribution. The RDAAT program
hazard plot gives a .98 correlation coefficient for the
exponential distribution. The Smith-Bain goodness-of-fit
test indicates a .01 chance of rejecting the null
50

.7-
- .6
.3
.1
. .2 .3 4 .5 .6 .7 A . 1
PER[ENI OF FAILURE
Figure 20. SYL 2nd Lifetime Plot
hypothesis and the Tiku goodness-of-fit indicates a
.0000 chance of rejecting the null hypothesis when the
exponential distribution is correct. The RDAAT program
hazard plot for the Weibull failure distribution indicates
a .99 correlation coefficient and a .84 shape parameter.
The Smith-Bain goodness-of-fit test indicates a .50 chance
of rejecting the null hypothesis when the Weibull distri-
bution is correct. These statistical tests indicate that
this electronic card is in useful life. The mean lifetime
is 11476.12 hours for this electronic card.
The third lifetime total time on test plot for the
SYL electronic card, shown in Figure 21, indicates an
51
5 ,9 t" M

Cr.9
.8
-, .4
.1 .2 .3 .4 .5 .6 .7 .8 .9
PERCENI OF FAILURE
Figure 21. SYL 3rd Lifetime Plot
exponential failure distribution. The RDAAT program
hazard plot gives a 1.0 correlation coefficient for the
exponential distribution. The Smith-Bain goodness-of-
fit test indicates a .01 chance of rejecting the null
hypothesis and the Tiku goodness-of-fit indicates a
.0000 chance of rejecting the null hypothesis when the
exponential distribution is correct. The RDAAT program
hazard plot for the Weibull failure distribution indicates
a .98 correlation coefficient and a .76 shape parameter.
The Smith-Bain goodness-of-fit test indicates a .405
chance of rejecting the null hypothesis when the Weibull
distribution is correct. These statistical tests indicate
52

that this electronic card is in useful life. The mean
lifetime is 12111.20 hours for this electronic card. Table
VII summarizes the results for the SYL electronic card.
TABLE VII
SYL Card Type Summary
Card Lifetite Mean Tested RDAAT 6oodness-Type Life Distribution Correlation of-fit
(hours) Coefficient(Hazard Tiku Stith-BainPlot)
SYL I 11359.13 Exponential .97 .0000 .01Weibull .99 .1956=.99
2 11476.12 Exponential .98 .0000 .01Weibull .99 .50.84
3 12111.20 Exponential 1.0 .0000 .01Weibull .98 .405
Summary
Use of the total time on test graphical procedure and
the RDAAT statistical program has allowed us to determine
the most probable failure distributions, hazard functions,
and lifetime patterns for the electronic cards examined in
this research. Use of these procedures has also allowed us
to answer the questions that prompted this research effort:
1. Does infant mortality exist in electronic cards of
the Minuteman III guidance system?
53

2. Are electronic cards of the Minuteman III guidance
system wearing out?
3. Are the electronic cards in the Minuteman III
guidance system in useful life?
The next portion of the research effort will include
conclusions, recommendations to management, and other
possible uses of these findings.
54
NI

V. Conclusions and Recommendations
This chapter will present our conclusions based on our
findings and recommendations for future study and research.
The goal of this research was to describe the failure
distributions of selected electronic cards from the
Minuteman III guidance system and to detect what failure
pattern existed in those cards.
Research Objectives
The objectives of this research were:
1. To describe the failure distributions of selected
electronic cards in the Minuteman III guidance system.
2. To determine if the corresponding hazard function
demonstrated infant mortality, wearout, or useful life.
3. To suggest management strategies to deal with
infant mortality or wearout.
This research was also accomplished because the Total
Time on Test graphical technique had not been used to
determine failure distributions for Minuteman failure data.
Conclusions
The BQE electronic card had a first mean lifetime of
48623 hours, a second mean lifetime of 10083 hours, and
a third mean lifetime of 16100 hours. The first lifetime
failure distribution was Weibull with a shape parameter
of 1.51, which would indicate wearout. The two remaining
55
k il 1111

lifetimes examined for this card indicated exponential
failure distributions. From this failure distribution, we
can conclude that the card was in useful life. Noting the
significant difference in the mean lifetimes on this card,
we can conclude that this card was not repaired to as good
as new condition.
The BQQ electronic card had a first mean lifetime of
46778 hours, a second mean lifetime of 8175 hours, and a
third mean lifetime of 23216 hours. The first lifetime
failure distribution was Weibull with a shape parameter
of 1.12. The third lifetime for this card also indicated
a Weibull distribution and had a shape parameter of 1.04.
Recall that a Weibull distribution with a shape parameter
of 1 is the exponential distribution. Both of these
lifetimes have shape parameters that are very close to 1,
indicating that these lifetimes may not be wearing out,
but rather are in useful life. The second mean lifetime of
this card was significantly less than either of the other
two. We cannot conclude why this occurred; however, it is
interesting to note that the third mean lifetime of this
card increased significantly over the second. This card
type also has significant differences between the mean
lifetimes and because of that we can conclude that this
card was not repaired to as good as new condition.
The BTJ electronic card had a first mean lifetime of
34938 hours, a second mean lifetime of 14145 hours, and a
56
third mean lifetime of 11762 hours. The first lifetime
had a normal failure distribution and the second and third
lifetimes had exponential failure distributions. The
normal distribution gives the indication that the first
lifetime may have been showing signs of wearout. The
second and third lifetimes were both in useful life.
However, there is also a significant difference in the mean
lifetimes for this card type. The largest difference is
between the first and second lifetime. The second mean
lifetime is less than 50 percent of the first mean life-
time. Again, we can conclude that this card was not
repaired to as good as new condition.
The SUQ electronic card had a first mean lifetime of
45472 hours, a second mean lifetime of 41551 hours, and
'4a third mean lifetime of 11206 hours. The first lifetime
failure distribution was normal, indicating possible
wearout. The second lifetime also indicated a normal
failure distribution or a Weibull failure distribution with
a 1.42 shape parameter, which would also indicate possible
wearout. The third lifetime had an exponential failure
distribution and would indicate useful life. Note that
the first two mean lifetimes are quite high and that the
third lifetime is significantly less. This would tend to
indicate that during the second repair cycle of this card,
it was not repaired to as good as new condition.
57
4

The SYL electronic card was the only card selected
from the stabilized platform of the guidance system. It
was selected because it had the most lifetimes of any of
the cards on which we had data. The first mean lifetime of
the SYL electronic card was 11359 hours, the second mean
lifetime was 11476 hours, and the third mean lifetime was
12111 hours. All three lifetimes had exponential failure
distributions, indicating useful life, and there were no
significant differences between the lengths of the mean
lifetimes.
Recommendations for Further Research
Based on the findings of this research, three areas
are recommended for further research.
1. Further research needs to be accomplished to
determine if the differences in the mean lifetimes within
a specific card type is significant.
2. Determine why only one card type (SYL) has a
significant failure history beyond three lifetimes and,
since this card is from the stabilized platform, attempt to
determine if the stabilized platform is a limiting factor
in guidance system reliability.
3. Further use of the Total Time on Test performance
is necessary to validate its applicability to this type of
data.
58

Summary
Through the use of the Total Time on Test graphical
technique and the RDAAT statistical package, we have
described the failure distributions and hazard functions
for five selected electronic cards. Recall that the
failure distributions and hazard functions described are
for the first three lifetimes of these selected electronic
cards.
Nine of the fifteen lifetimes examined indicated
that the exponential distribution correctly identified
the failure pattern of those electronic cards. It can
be concluded that the lifetimes that show an exponential
failure distribution have a constant failure rate and are
in useful life. The other six lifetimes were identified
as either a Weibull with a shape parameter greater than
one, or a normal distribution. It can be concluded that
the lifetimes that show a normal failure distribution or
a Weibull failure distribution, with a shape parameter
greater than one, are indicating signs of wearout.
However, two of the lifetimes that indicated a Weibull
distribution had shape parameters very close to one. This
occurred in one type of electronic card (BQQ) and could
lead to the conclusion that these lifetimes are, in fact,
failing exponentially and are in useful life, not wearout.
The other four lifetimes that indicate wearout failure
distributions have mean lifetimes, derived from the RDAAT
59

statistical package, that exceed 34900 hours. Recall from
Chapter I that the system mean time between failure is
approximately 10000 hours. With this in mind, a card with
wearout characteristics and a mean lifetime of 34900 hours
may not require any management action. Data was provided
for 44 electronic cards; however, the five selected for
this research were the only cards that had significant
numbers of failures beyond two lifetimes. The system
has been in constant operation since the early 1970s and,
as reported in Chapter I, is improving its reliability
performance with age. Perhaps further research will
indicate possible trends that require management action
such as preventive maintenance.
60
Sill*~-V
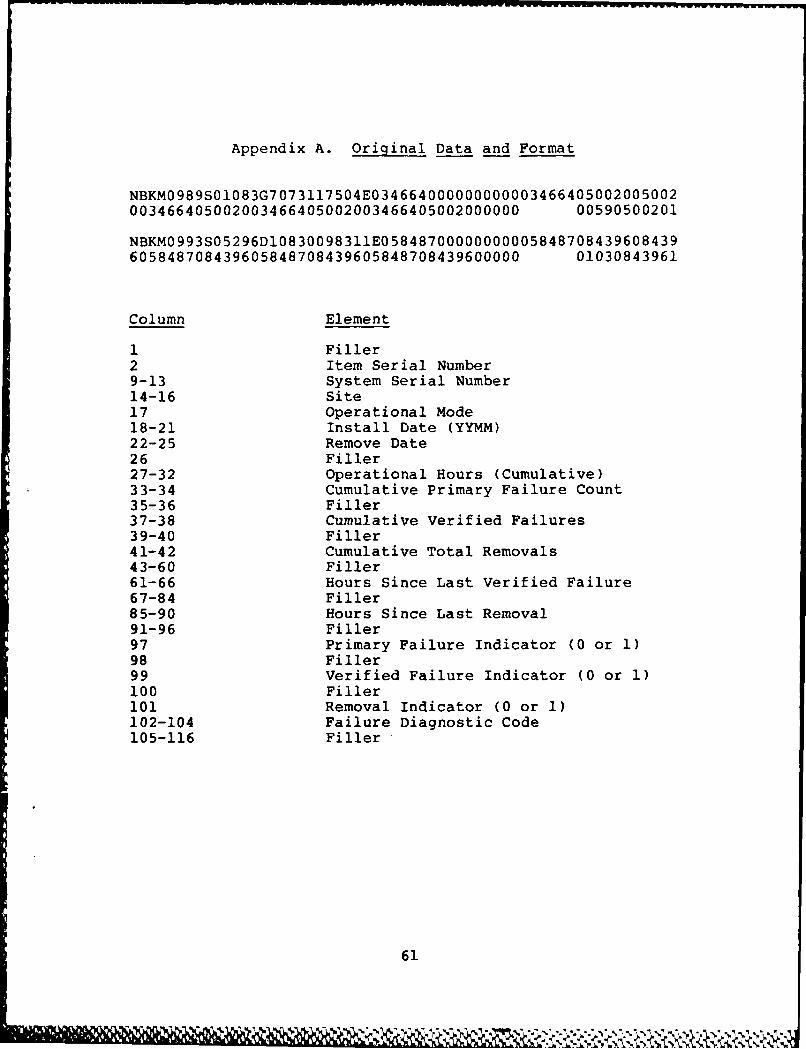
Appendix A. Original Data and Format
NBKM0989S01083G7073117504E034664000000000003466405002005002003466405002003466405002003466405002000000 00590500201
NBKM0993S05296Dl0830098311E05848700000000005848708439608439605848708439605848708439605848708439600000 01030843961
Column Element
1 Filler2 Item Serial Number9-13 System Serial Number14-16 Site17 Operational Mode18-21 Install Date (YYMM)22-25 Remove Date26 Filler27-32 Operational Hours (Cumulative)33-34 Cumulative Primary Failure Count35-36 Filler37-38 Cumulative Verified Failures39-40 Filler41-42 Cumulative Total Removals43-60 Filler61-66 Hours Since Last Verified Failure67-84 Filler85-90 Hours Since Last Removal91-96 Filler97 Primary Failure Indicator (0 or 1)98 Filler99 Verified Failure Indicator (0 or 1)100 Filler101 Removal Indicator (0 or 1)102-104 Failure Diagnostic Code105-116 Filler
61
- - - 61

Appendix B. Fortran Programs
This program was used to read the original data fileand selected all electronic cards that had a failureindicated in columns 37-38.
CHARACTER*3,CARDINTEGER SN,FAIL,HOURS,CHGHROPEN (UNIT=8,FILE='INPUTFILENAME')OPEN (UNIT-2,FILE-'OUTPUTFILENAME')
99 READ (8,100) CARD,SN,HOURS,FAIL,CHGHRI=1+1
4 IF (FAIL .GT. 0) WRITE (2,110)CARD,SN,HOURS,FAIL,CHGHRIF (I .EQ. 320000) GOTO 999GOTO 99
100 FORMAT (2X,A3,I4,17X,I6,4X,82,23X,I6,50X110 FORMAT (5X,A3,3X,I4,I6,3X,I2,3X,I6)999 STOP
END
Variations of this program were used to sort the
failures selected by the program above into individual data
files. The only changes required were to the input filename
(line 3), the output filename (line 4), the 'if' statement
specifying what was being selected (line 7), and the size of
the file being read (line 8).
CHARACTERS*3,CARD,BQE,BQQ,BTJ,SUQ,SYLINTEGER SN,FAIL,HOURS,CHGHROPEN (UNIT=8, FILE='INPUTFILENAME')OPEN (UNIT=2, FILE='OUTFUTFILENAME')
99 READ 98,2100) CARD,SN,HOURS,FAIL,CHGHRI=I+lIF (CARD.EQ.BQE)WRITE(2,110)CARD,SN,HOURS,FAIL,CHGHRIF (I. EQ. 10000) GOTO 999GOTO 99
100 FORMAT (5X,A3,3X,I4,3X,I6,3X,I2,3X,I6)110 FORMAT (5X,A3,3X,I4,3X,16,3X,I2,3X,16)999 STOP
END
62

Appendix C. Table of Random Units
PROBABILITY AND STATISTICSTable of Random Units
A TABLE OF 14,000 RANDOM UNITS (Continued)
Line/Col (I) (2) (3) (4) (5) (6) (7) (8) (9) (10) (II) (12) (13) (14)
51 1040,8 899 0153 53381 79401 21438 83(T5 123.50 36693 31238 59649 92754 72772 0233852 18629 81953 05520 91962 04739 13092 97662 24822 94730 06496 35090 04822 86772 9828953 73115 35101 47498 87637 99016 71060 88824 71013 18735 20286 23153 72924 35165 4304054 57491 16703 23167 49323 45021 33132 12544 41035 801780 45393 44812 12515 98931 9120255 30405 83946 23792 14422 15059 45799 22716 19792 09993 74353 68668 30429 70735 25499
.56 16631 35006 85900 98275 32388 52390 16815 69298 82732 38480 73817 32523 41961 4443757 96773 20206 42559 78985 05300 22164 24369 54224 35083 19687 11052 91491 60383 1974058 38935 64202 14349 82674 66523 44133 00607 35552 35970 19124 63318 29686 03387 5984859 31624 76384 17403 53363 44167 64486 64758 75366 76554 31601 12614 33072 60332 9232560 78919 19474 23632 27889 47914 02584 37680 20801 72152 39339 34806 0893) 85001 87820
61 03931 33309 57047 74211 63445 17361 62825 39908 05607 91284 68833 25570 3881 4692062 74426 33278 43972 10119 89917 1566.5 52872 73823 73144 88662 88970 74492 51805 9937863 00066 00903 20795 95452 92648 45454 09552 88815 16553 51125 79375 97596 16296 6609264 42238 12426 87025 14267 20979 04508 64535 313.55 86064 29472 47689 05974 52468 168340.5 16153 0)2 2604 41744 819.5 4 65642 74240 56312 0033 67107 77510 70625 2R725 34191
66 21457 40742 29)2n 96783 29400 21840 15035 34537 33310 06116 95240 15957 16572 0600467 21581 57802 02050)89728 17937 37621 47075 42080 97403 48626 68995 43805 33386 2159768 55612 78095 93197 33732 05810 24813 86902 60397 16489 03264 88525 42786 05269 9253269 446.57 6G999 99.124 51281 84463 60563 79312 934.54 68.876 25471 93911 25650 126r2 7357270 91340 84979 46949 81973 37949 61023 43997 15263 80644 43942 89203 71795 99533 50501
71 91227 21199 31935 270*22 84067 05462 35216 14486 29891 68607 41867 14951 91696 8506572 50001 38140 £0321 19924 72163 09538 12151 06A78 91903 18749 34405 56087 82790 7092573 65390 05224 7295A 28609 81406 39147 25549 48542 42627 45233 57202 94617 23772 0789474 27504 96131 83944 4157.5 1.573 08619 64482 73923 36152 05184 94142 25299 84387 3492575 3716 94A51 39117 89632 ()959 16447 655,36 49171 39782 170.?5 02330 7430)1 00275 48280
76 1 1508 -(1225 51111 38351 19444 66499 71945 {15422 13442 78675 89)81 669:18 9:1654 5989477 37440 3)362 (604 5469) 04452 53115 62757 95348 78662 11163 81651 )50245 34971 5292478 46515 70331 85922 38329 57015 15765 97161 17869 45349 61796 66345 81073 49106 7986079 30986 81223 42410 5.8353 21532 30502 323o5 86482 05174 07901 54339 58861 7481 4694280 63798 64995 465R.1 09765 44160 7A 128 83991 42865 92520 83531 81377 35949 81250 54238
81 82486 8446 99254 07632 43218 50076 21361 64816 51202 88124 41870 52689 51275 8355682 21885 32906 92431 1k)4644 64297 51674 64126 62570 20123 05155 59294 52799 28225 8576283 60330 98782 1740s 53458 13564 5989 26445 29789 85205 41001 125:35 12133 1464 5 2354184 43937 MR!, 1 2401 2.5560 86355 33141 2576 549'91 72899 15475 954:14 9X227 21R24 1958585 97656 63175 89344316275 07240 920163 21942 18011 47348 240213 I1534 03862 7M05 50136
86 03294 01221 0542 18,,42 557 4 92237 2675Q 86307 21210 98442 4k4:103 56013 91511 7592887 71626 414648 1:1574 1766k 47785 7214 79424 25651 83325 98428 8,76 72811 22717 5058588 85636 16335 47539 13129 65651 11977 112510 26113 99447 68645 34327 15152 55230 9344889 18039 24367 61337 06177 12143 466) 32989 74014 64708 )1533 35398 58 408 13261 4790890 08362 15656 C-627 36478 65648 16764 5:1412 109013 07832 41574 17639 82163 61)R59 75567
91 79550 29068 04142 16268 15387 12856 66227 38358 22478 73373 8.8732 09443 82558 0525092 92608 82674 27472 32534 17075 27698 98204 63863 11951 34648 88022 56148 34925 5703193 23982 25535 40055 67006 12293 02753 14827 22235 3.5071 99704 37543 12601 35503 85171, 94 C915 96.346 0n15 97941 28395 14186 01821 8 1713 70426 75647 76310 88717 37890 4012995 50937 33300 26695 62247 69927 76123 50842 43834 R6654 711959 79725 93872 28117 19233
96 42438 78077 69882 61657 34136 791RO 97526 43092 04098 73571 80799 76536 71255 6423997 46764 88273 &1003 93017 31204 38692 40202 3527.5 57306 55543 53203 18098 47625 8868498 03237 45430 55427 63282 90816 17349 8298 90831 366001 7406 06216 95787 42579 9073099 8659 8142 52667 61583 14972 9053 89514 76036 49191 43716 97548 04379 46370 28672
100 38534 01725 9 4 96 4 1872.M 65.01 (3772 39560 12918I R6537 62738 19636 51132 25739 541947
(8:557)
63
L , , " % .,- '" ,.4.'

Appendix D. Total Time on Test Program
10 'TOTAL TIME ON TEST PLOTTING TECHNIQUE20 'WRITTEN BY CAPT WILLLIAM RIMPO, MAJ JOHN KUTZKE. AND LTCCL CARLOS TALJL)TT30 40 CLS:PRINT"IOTAL TINE ON TEST ANALYSIS OF FAILURE DATA"50 PRINT60 PRINT "THIS PROGRAM CALCULATES A TOTAL TIME ON TEST STATISTIC FOR FAILURE70 PRINT "DATA FROM A COMPLETE LIFE TEST, AS WELL AS FROU FIELD FAILURE DA:A80 PRINT "CONTAINING CENSORED UNITS.90 PRINT100 DIM A(500),TTT(500).STrr(500).B(500.21).C(500).LAST(500)110 DEFINT G-J120 '130 PRINT "WELCOME TO TOTAL TIME ON TEST.140 PRINT "IF YOU WOULD LIKE TO USE AN EXISTING DATABASE ON FILE. PRESS F.150 PRINT "IF YOU WOULD LIKE TO CREATE A NEW DATA FILE. PRESS C.160 PRINT "IF YOU WOULD LIKE TO ENTER DATA MANUALLY, PRESS M.170 CLOSE #7180 LET K-0190 B$-INPUT$(1)200 IF B$="F" THEN 230210 IF B$."C" THEN 380220 IF BWM"M" THEN 530230 1-1240 '250 'ARRAY C(I) STORES FAILURE INDICATOR: 1 FOR FAILURE. 0 FOR CENSORED DATA260 'ARRAY A(I) STORES LIFETIMES270280290 LINE INPUT "MY DATA FILE IS: ";Es300 1-1310 OPEN "I",*l. E$320 IF EOF (1) THEN 660330 INPUT #1,C(I),A(I):PRINT C(I),A(1)340 IF C(I)-1 THEN K-K+1350 LET I-I+1360 GOTO 320370 PRINT380 CLS:PRINT "YOU ARE ABOUT TO CREATE A DATAFILE WHICH YOU WILL NAME.390 PRINT "PLEASE REMEMBER YOU FILE NAME. AFTER THE LAST INPUT TYPE -1400 PRINT "TO END DATA ENTRY.410 '420 LINE INPUT"MY DATA FILE NAME WILL BE:": E$430 1440 OPEN "O",#7,E$450 INPUT "ENTER I FOR FAILED UNIT, 0 FOR UNFAILED/WITHDRAWN UNIT";C(I)460 INPUT "ENTER FAILURE/CENSORED TIME.";A(I)470 IF C(I)--1 THEN 500480 WRITE#7,C(I),A(I)490 PRINT: GOTO 450500 CLOSE #7510 GOTO 300520 '530 CLS:INPUT"ENTER NUMBER OF LIFETIMES";N540 PRINT N550 FOR I11 TO N560 INPUT "ENTER 1 FOR FAILED UNIT. 0 FOR UNFAILED/WITHDRAWN UNIT";C(j)570 PRINT C(I)580 INPUT"ENTER LIFETIKE";A(I)590 PRINT A(A)600610 'K COUNTS THE NUMBER OF FAIIURES620 '630 IF C(I)-1 THEN K.K+1640 PRINT K650 NEXT I660 N.I-1670 REALNI.N680 '690 'OPENS FILES TO STORE TTT STATISTICS700
64
N--

710 OPEN "O".8."AGE1.DAT"720 '730 'HERE THE ARRAY A(M) RECORDS UNORDERED LIFETIMES
740 'NOW SORT A(I) TO ORDERED LIFETIMES
750 '760 LET F-0770 FOR I=1 TO N-i780 IF A(I)<-A(I+1) THEN GOTO 830790 LET TEMIP-A(l)795 LET TEMPC-C(I)600 LET A(I)-A(I+1)8605 LET C(I)=C(I+l)810 LET A(I+1)-TEMP815 LET C(I+I)-TEMPC820 LET F-i830 NEXT I840 '850 'IF F-I THEN ORDER ISN'T PERFECT YET860 '870 IF F-I GOTO 760680 LINE INPUT "MY ORDERED DATA FILE IS:"; F$
890 OPEN "0",#5, F$900 PRINT,"THE SET OF ORDERED LIFETIMES IS:"
910 FOR 1-1 TO N920 PRINT. I. " "C(I),A(I)930 WRITE #5,C(I).A(I)940 NEXT I950 CLOSE #5960 '970 'TOTAL TIME ON TEST SUBROUTINE9b0 I990 LET G=01000 FOR J.1 TO N1010 IF C(J)-I THEN G=G+11020 IF J.1 THEN TTT(J)-N*A(J)1030 IF J.1 GOTO 10501040 LET TTT(J)=TTT(J-1)+(N-J+I)*(A(J)-A(J-1))1050 IF C(J)-I THEN TEMP-TTT(J)1060 LET LAST(G)-TEMP1070 NEXT J1080 '
1090 'SCALED TTT SUBROUTINE1100 'CALCULATES A SCALED TTT FOR FAILURES ONLY.1110 '1120 FOR I-1 TO G1130 -1140 STTT(I)LAST(I)/LAST(G)1150 IF I=G THEN PRINT#8.0;01160 IF IG THEN PRINT#6.1;1
1170 IF I-0 THEN PRINT#8,0;01180 NEXT I1190 PRINT1200 PRINT " SCALED TTT VS PERCENT FAILURES1210 FOR F-I TO K1220 PRINT#8,STTT(F);F/K1230 PRINT. STiT(F)."".F/K1240 NEXT F1250 '1260 END
65
P
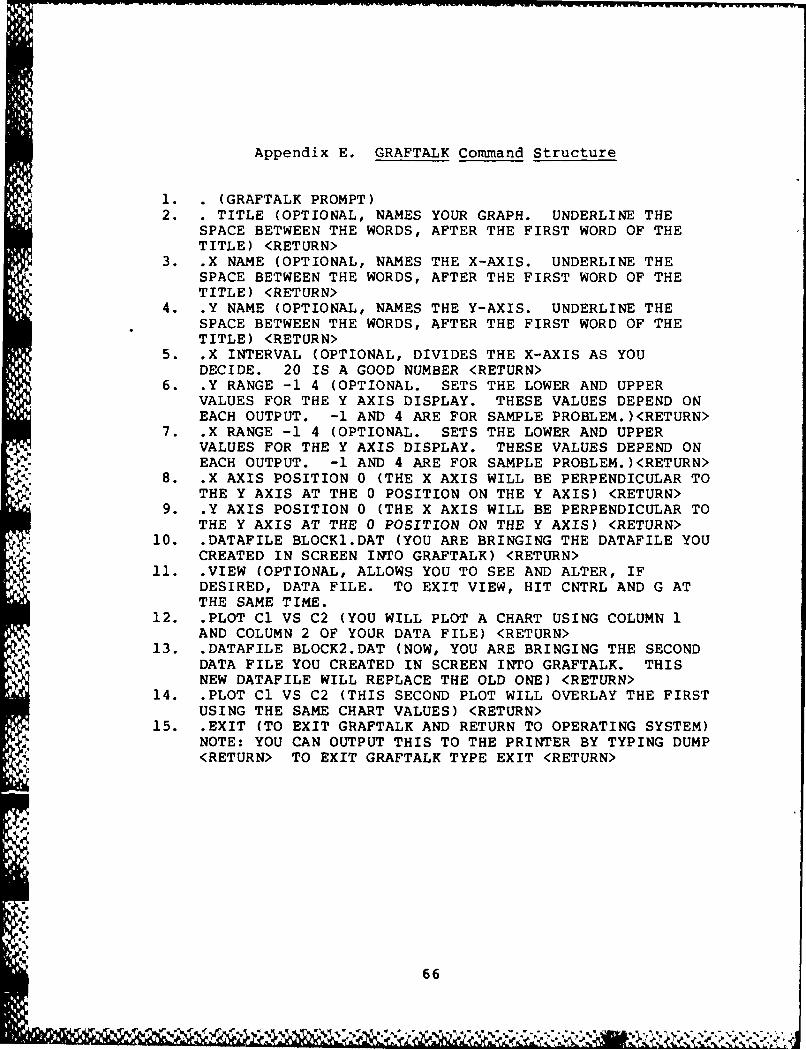
Appendix E. GRAFTALK Command Structure
1. . (GRAFTALK PROMPT)2. . TITLE (OPTIONAL, NAMES YOUR GRAPH. UNDERLINE THE
SPACE BETWEEN THE WORDS, AFTER THE FIRST WORD OF THETITLE) <RETURN>
3. .X NAME (OPTIONAL, NAMES THE X-AXIS. UNDERLINE THESPACE BETWEEN THE WORDS, AFTER THE FIRST WORD OF THETITLE) <RETURN>
4. .Y NAME (OPTIONAL, NAMES THE Y-AXIS. UNDERLINE THESPACE BETWEEN THE WORDS, AFTER THE FIRST WORD OF THETITLE) <RETURN>
5. .X INTERVAL (OPTIONAL, DIVIDES THE X-AXIS AS YOUDECIDE. 20 IS A GOOD NUMBER <RETURN>
6. .Y RANGE -1 4 (OPTIONAL. SETS THE LOWER AND UPPERVALUES FOR THE Y AXIS DISPLAY. THESE VALUES DEPEND ONEACH OUTPUT. -1 AND 4 ARE FOR SAMPLE PROBLEM.)<RETURN>
7. .X RANGE -1 4 (OPTIONAL. SETS THE LOWER AND UPPERVALUES FOR THE Y AXIS DISPLAY. THESE VALUES DEPEND ONEACH OUTPUT. -1 AND 4 ARE FOR SAMPLE PROBLEM.)<RETURN>
8. .X AXIS POSITION 0 (THE X AXIS WILL BE PERPENDICULAR TOTHE Y AXIS AT THE 0 POSITION ON THE Y AXIS) <RETURN>
9. .Y AXIS POSITION 0 (THE X AXIS WILL BE PERPENDICULAR TOTHE Y AXIS AT THE 0 POSITION ON THE Y AXIS) <RETURN>
10. .DATAFILE BLOCK1.DAT (YOU ARE BRINGING THE DATAFILE YOUCREATED IN SCREEN INTO GRAFTALK) <RETURN>
11i. VIEW (OPTIONAL, ALLOWS YOU TO SEE AND ALTER, IFDESIRED, DATA FILE. TO EXIT VIEW, HIT CNTRL AND G ATTHE SAME TIME.
12. .PLOT Cl VS C2 (YOU WILL PLOT A CHART USING COLUMN 1AND COLUMN 2 OF YOUR DATA FILE) <RETURN>
13. .DATAFILE BLOCK2.DAT (NOW, YOU ARE BRINGING THE SECONDDATA FILE YOU CREATED IN SCREEN INTO GRAFTALK. THISNEW DATAFILE WILL REPLACE THE OLD ONE) <RETURN>
14. .PLOT Cl VS C2 (THIS SECOND PLOT WILL OVERLAY THE FIRSTUSING THE SAME CHART VALUES) <RETURN>
15. .EXIT (TO EXIT GRAFTALK AND RETURN TO OPERATING SYSTEM)NOTE: YOU CAN OUTPUT THIS TO THE PRINTER BY TYPING DUMP<RETURN> TO EXIT GRAFTALK TYPE EXIT <RETURN>
66
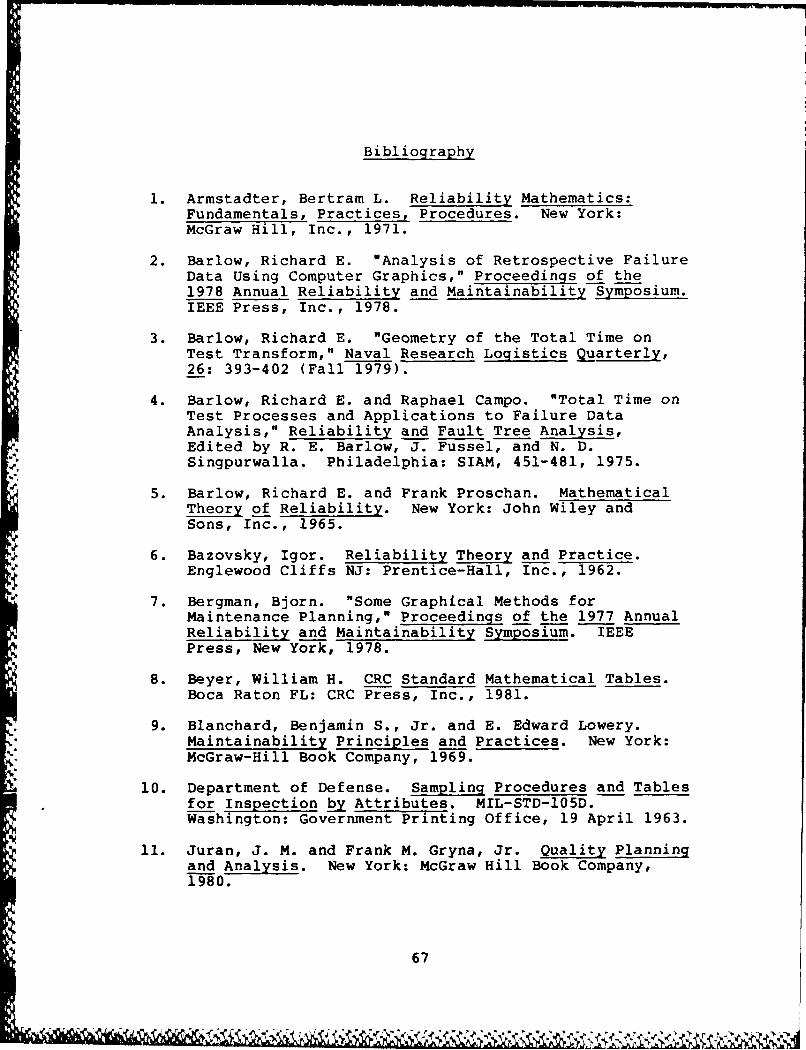
Bibliography
1. Armstadter, Bertram L. Reliability Mathematics:Fundamentals, Practices, Procedures. New York:McGraw Hill, Inc., 1971.
2. Barlow, Richard E. "Analysis of Retrospective FailureData Using Computer Graphics," Proceedings of the1978 Annual Reliability and Maintainability Symposium.IEEE Press, Inc., 1978.
3. Barlow, Richard E. "Geometry of the Total Time onTest Transform," Naval Research Logistics Quarterly,26: 393-402 (Fall 1979).
4. Barlow, Richard E. and Raphael Campo. "Total Time onTest Processes and Applications to Failure DataAnalysis," Reliability and Fault Tree Analysis,Edited by R. E. Barlow, J. Fussel, and N. D.Singpurwalla. Philadelphia: SIAM, 451-481, 1975.
5. Barlow, Richard E. and Frank Proschan. MathematicalTheory of Reliability. New York: John Wiley andSons, Inc., 1965.
6. Bazovsky, Igor. Reliability Theory and Practice.Englewood Cliffs NJ: Prentice-Hall, Inc., 1962.
7. Bergman, Bjorn. "Some Graphical Methods forMaintenance Planning," Proceedings of the 1977 AnnualReliability and Maintainability Symposium. IEEEPress, New York, 1978.
8. Beyer, William H. CRC Standard Mathematical Tables.Boca Raton FL: CRC Press, Inc., 1981.
9. Blanchard, Benjamin S., Jr. and E. Edward Lowery.Maintainability Principles and Practices. New York:McGraw-Hill Book Company, 1969.
10. Department of Defense. Sampling Procedures and Tablesfor Inspection by Attributes. MIL-STD-105D.Washington: Government Printing Office, 19 April 1963.
11. Juran, J. M. and Frank M. Gryna, Jr. Quality Planningand Analysis. New York: McGraw Hill Book Company,1980.
67

12. Kniss, James R. "Developing Reliable Systems: FactVersus Fiction," National Defense, 68: 24-27 (March1984).
13. Myers, Richard H., Kam L. Wong, and Harold M. Gordy.Reliability Engineering for Electronic Systems. NewYork: John Wiley and Sons, Inc., 1964.
14. Nelson, Wayne. Applied Life Data Analysis. New York:John Wiley and Sons, Inc., 1982.
15. Russ, Lt Gen Robert D. "Fourth Wheel on theAcquisition Wagon," Air Force Magazine, 12: 122-125(March 1985).
16. Smith, Dr. R. M. and others. Reliability DataAcquisition and Analysis Techniques SystemDocumentation. BDM/H-850881-TR, Draft. The BDMCorporation, Huntsville AL, 1985.
17. Talbott, Lt Col Carlos M., Jr. Graphical Techniquesfor Maintenance Planning. PhD Dissertation. Schoolof Engineering and Applied Science, George WashingtonUniversity, Washington DC, February 1986.
18. Tiku, M. L. "Goodness of Fit Statistics Based on theSpacings of Complete or Censored Samples," AustralianJournal of Statistics, 22: 260-275 (Fall 1980).
19. Trapp, R. D. and others. An Approach for AssessingMissile System Dormant Reliability, Final Report. TheBDM Corporation, Albuquerque NM, 1981.
68

VITA
Captain Albert E. Sisk was born on 16 April 1947 in
Joplin, Missouri. He graduated from high school in
Hays, Kansas in 1965. He enlisted in the Air Force in
May 1966 and was released from active duty in March 1970.
He attended Southern Illinois University at Edwardsville
and received a Bachelor of Science in Special Education
in March 1975. Upon graduation, he was commissioned in
the Air Force through the ROTC program. He was called
to active duty in July 1975 and completed Operational
Readiness Training for the Minuteman III ICBM weapon
system in October 197;. He then served as a Missile Launch
Officer at F. E. Warren AFB, Wyoming until September 1979.
He then served as a Test Manager in SAC's TOPHAND program
for the Minuteman Test Launch Program at Vandenberg AFB,
California until August 1983. He then served as a SAC
Liason for the Minuteman weapon system at Hill AFB, Utah
until he entered the School of Systems and Logistics, Air
Force Institute of Technology, Wright-Patterson AFB OH,
in May 1985.
Permanent Address: 2505 Old Collinsville Road
Belleville, Illinois 62221
69

UNCL1ASSIFIED
-I CS' C O OF THIS PAGE
REPORT DOCUMENTATION PAGEqE.joQT SE CuR1TY CLASSIFICAT ION 1b. RESTRICTIVE MARKINGSIU !'-liSSI FIED R N1' Irv /
2. SE,:, R TV~ CLASSIFICATION AUTHORITY 3. DISTRI BUTIONIAVAI LABI(LITY OF REPORT
Approved for public release;D~~ECLASSIFtCATI0N/DOWNGRAOING SCHEDULE distribu.tion unlimited.
4 PERFORMING ORGANIZATION REPORT NUMBER(S) 5. MONITORING ORGANIZATION REPORT NUMBER(S)
ba %AME OF PERFORMING ORGANIZATION b. OFFICE SYMBOL 7a. NAME OF MONITORING ORGANIZATION
6c. ADDRESS (City. State and ZIP Code) 7b. ADDRESS (City. State and ZIP Code)
Be. NAME OF FUNDING/SPONSORING (Sb. OFFICE SYMBOL 9. PROCUREMENT INSTRUMENT IDENTIFICATION NUMB3ERORGANIZATION j(if applicable)
Bc ADDRESS lt, State and ZIP Code) 10. SOURCE OF FUNDING NOS.
PROGRAM PROJECT TASK WORK UNITELEMENT NO. NO. NO. NO.
11. TITLE finclude Security Clasification)See Box 19
12. PERSONAL AUTHOR(S)Albert E. Sisk, B. S., Captain, USAF
13a. TYPE OF REPORT 13b. TIME COVERED 14d. DATE OF REPORT (Yr.. Mo.. Day) 15. PAGE COUNT
MS Thesis FROM TO ____I 1986 Septemrber I 8016. SUPPLEMENTARY NOTATION
17. COSATI CODES 18. SUBJECT IIERMS (Continue on reverse if neceatary and identify by block number)
FIELD GROUP SUB. GR. Total Time on Test reliability04Minuteman III failure distribu.tions
19. ABSTRACT (rCon linue on reverse if neceusary and identify by block number)
Title: A DESCRIPTION OF THE FAILURE yrI '; " nd Pofond Ib
DISIBIUIONS OF SELECTED t4lNUEM 1 III A. is .e l1.tili of Technoaaf IS
GUIDANCZE SYSME~ EL~ECTRONICCAD V"Igiltkatersan AFB Q1M ON
Thesis Advisor: Phillip E. Miller, Major, LEAFAssistant Professor of Logistics maflageirent
20. DISTR1111SUTION/AVAI LABILITY OF AB3STRACT 21. AB3STRACT SECURITY CLASSIFICATION
* UNCLASSIFIED/UNLIMITED C SAME AS RPT. 0 OTIC USERS 0 UNCLSSIFIED
22s. NAME OF RESPONSIBLE INDIVIDUAL 22b. TELEPHONE NUMBER 22c. OFFICE SYMBOL
Philli E. MllerMajor USAF(include A rea Code) ,T/SPhilip .Mller MaorLEA 513-255-5023
DD FORM 1473, 83 APR EDITION OF I JAN 73 IS OBSOLETE. hrAgF nSECURITY CLASSIFICATION OF THIS PAGE

UQt1ASS IF LEDSEC. I TV CL-SSFI'CATION OF THIS PAGE
/-/
This research described the failure distributionsof selected Minuteman III guidance system electronic cardsand was the first attempt to use the Total Time on Testgraphical technique to detect failure patterns. The dataanalysis was performed by using a Zenith 100 computer programthat performed the Total Time on Test calculations and theReliability Data Acquisition and Analysis Techniques softwarepackage.
CThe objectives of the research were to 1) describe thefailure distributions of selected Minuteman III electroniccards, 2) determine if the corresponding hazard functiondemonstrated infant mortality, useful life, or wearout, and3) suggest management strategies to deal with wearout orinfant mortality.
*<Five individual cards were selected and the first three
lifetimes of each card were examined. Nine of the fifteencards indicated an exponential failure distribution, theother six were identified as either a Wibull or a normalfailure distribution. D
The results of this research indicate that some ofthe lifetimes did show signs of wearout; however, it wasdetermined that no management actions were required becauseof the large mean lifetimes of the cards affected.
C ITYCLAIICATIONT THI PAG1 ISECuRITY CLASSIFICATION OF T1415 PAGEi

I
~viV1-I
S~. S~' ~
,r( b~~p 5'